lithium ion batteries for electric transportation: costs ... · lithium ion batteries for electric...
TRANSCRIPT
Lithium Ion Batteries for Electric Transportation:Costs and Markets
Haresh Kamath
September 22nd, 2009
2© 2009 Electric Power Research Institute, Inc. All rights reserved.
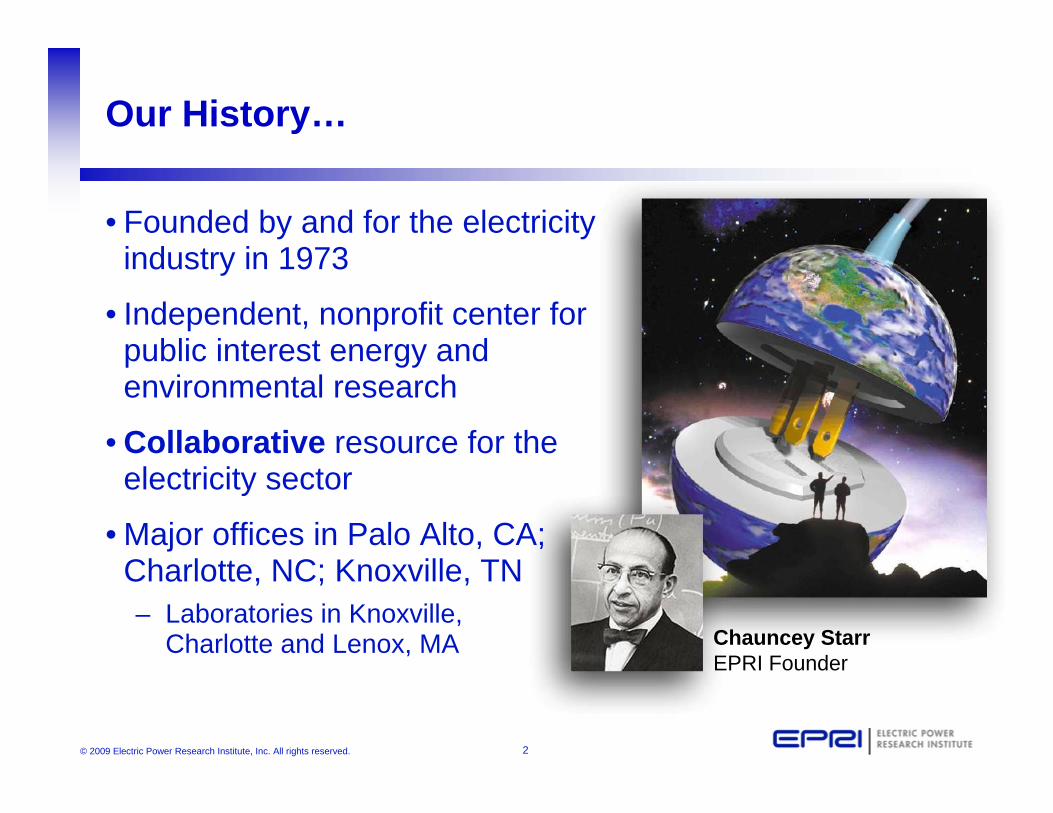
Our History…
• Founded by and for the electricity industry in 1973
• Independent, nonprofit center for public interest energy and environmental research
• Collaborative resource for the electricity sector
• Major offices in Palo Alto, CA; Charlotte, NC; Knoxville, TN– Laboratories in Knoxville,
Charlotte and Lenox, MA Chauncey StarrEPRI Founder
3© 2009 Electric Power Research Institute, Inc. All rights reserved.
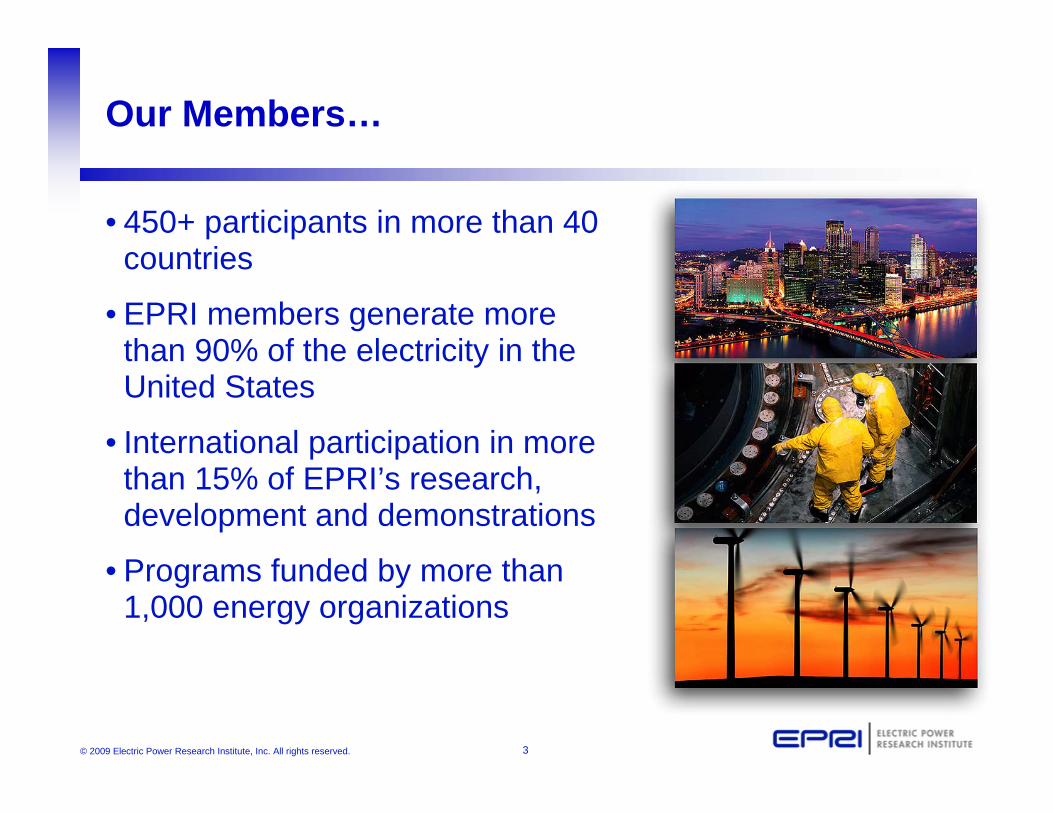
Our Members…
• 450+ participants in more than 40 countries
• EPRI members generate more than 90% of the electricity in the United States
• International participation in more than 15% of EPRI’s research, development and demonstrations
• Programs funded by more than 1,000 energy organizations
4© 2009 Electric Power Research Institute, Inc. All rights reserved.
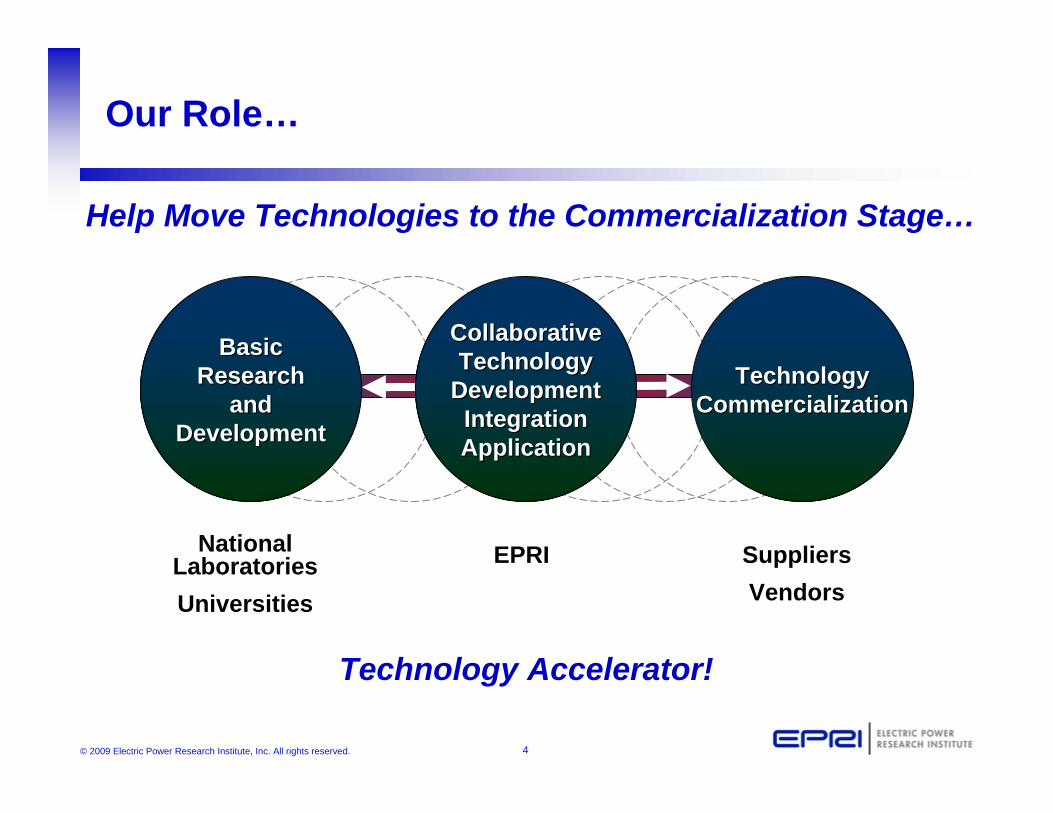
BasicBasicResearchResearch
andandDevelopmentDevelopment
TechnologyTechnologyCommercializationCommercialization
CollaborativeCollaborativeTechnologyTechnology
DevelopmentDevelopmentIntegrationIntegrationApplicationApplication
National LaboratoriesUniversities
SuppliersVendors
EPRI
Help Move Technologies to the Commercialization Stage…
Our Role…
Technology Accelerator!
5© 2009 Electric Power Research Institute, Inc. All rights reserved.
Electric Energy Storage: Background
• Electric Energy Storage: A critical technology– Portable electronics– Electric transportation– Stationary power
• Lithium Ion batteries – a very promising solution– High specific energy and energy density– High efficiency– Long life– Potentially low cost
6© 2009 Electric Power Research Institute, Inc. All rights reserved.
Lithium Ion: Costs and Markets
• Cost of Lithium Ion Batteries– Understanding cost drivers– Projecting costs with volume
• Markets for Lithium Ion Batteries– How will we achieve volume?– Total applications
7© 2009 Electric Power Research Institute, Inc. All rights reserved.
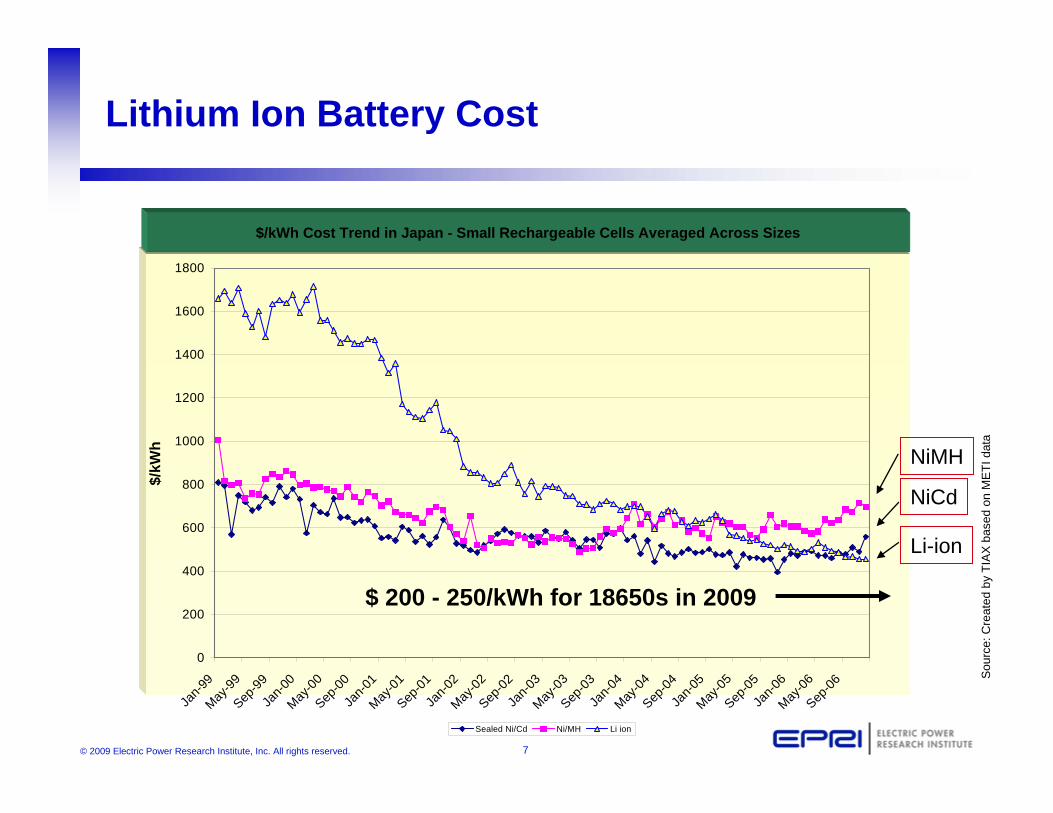
Lithium Ion Battery Cost
Li-ion
NiMH
$/kWh Cost Trend in Japan - Small Rechargeable Cells Averaged Across Sizes
NiCd
0
200
400
600
800
1000
1200
1400
1600
1800
Jan-9
9May
-99Sep
-99Ja
n-00
May-00
Sep-00
Jan-0
1May
-01Sep
-01Ja
n-02
May-02
Sep-02
Jan-0
3May
-03Sep
-03Ja
n-04
May-04
Sep-04
Jan-0
5May
-05Sep
-05Ja
n-06
May-06
Sep-06
$/kW
h
Sealed Ni/Cd Ni/MH Li ion
Sou
rce:
Cre
ated
by
TIA
X b
ased
on
ME
TI d
ata
$ 200 - 250/kWh for 18650s in 2009
8© 2009 Electric Power Research Institute, Inc. All rights reserved.
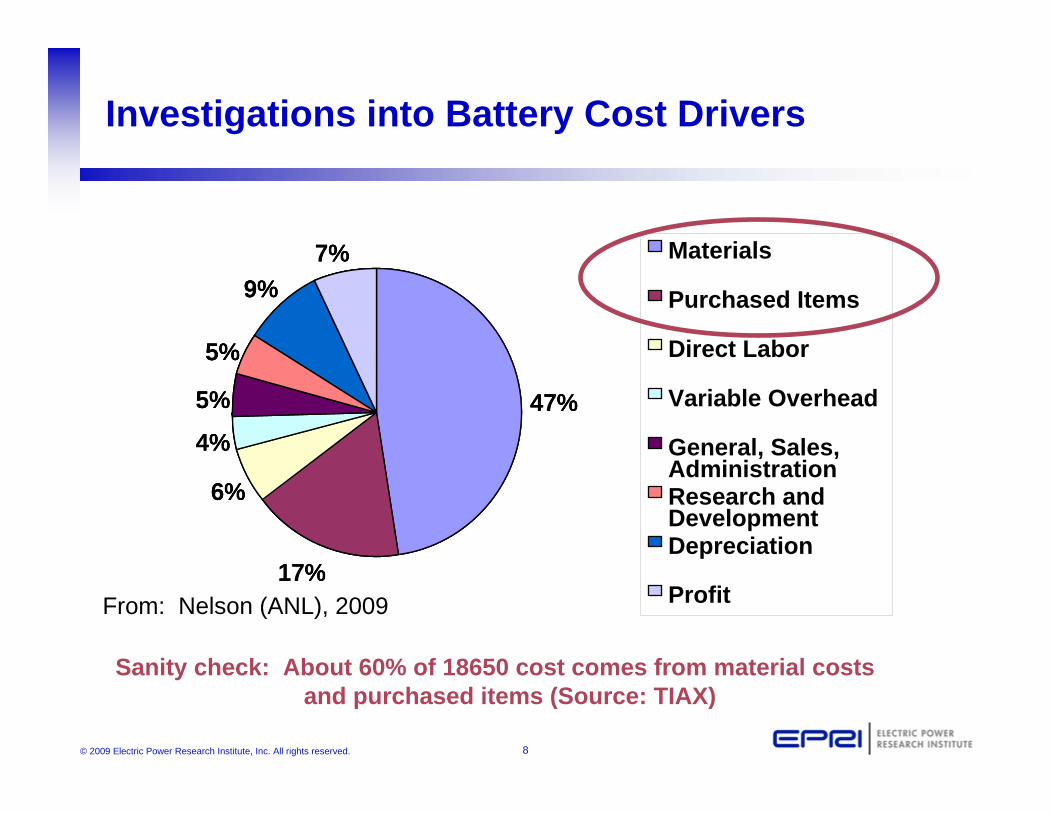
Investigations into Battery Cost Drivers
Direct Labor
Materials
Purchased Items
Variable Overhead
General, Sales,AdministrationResearch andDevelopmentDepreciation
Profit
47%
17%
6%
4%
5%
5%
9%7%
47%
17%
6%
4%
5%
5%
9%7%
47%
17%
6%
4%
5%
5%
9%7%
47%
17%
6%
4%
5%
5%
9%7%
From: Nelson (ANL), 2009
Sanity check: About 60% of 18650 cost comes from material costsand purchased items (Source: TIAX)
9© 2009 Electric Power Research Institute, Inc. All rights reserved.
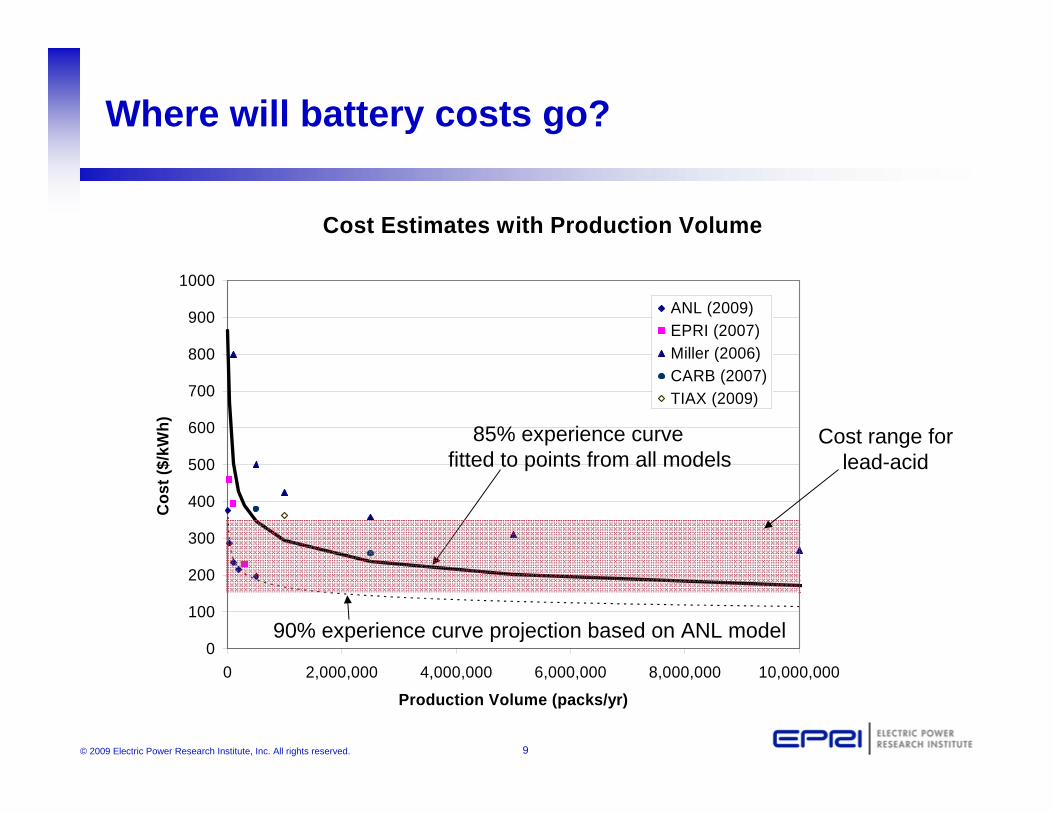
Where will battery costs go?
Cost Estimates with Production Volume
0
100
200
300
400
500
600
700
800
900
1000
0 2,000,000 4,000,000 6,000,000 8,000,000 10,000,000
Production Volume (packs/yr)
Cos
t ($/
kWh)
ANL (2009)EPRI (2007)Miller (2006)CARB (2007)TIAX (2009)
Cost Estimates with Production Volume
0
100
200
300
400
500
600
700
800
900
1000
0 2,000,000 4,000,000 6,000,000 8,000,000 10,000,000
Production Volume (packs/yr)
Cos
t ($/
kWh)
ANL (2009)EPRI (2007)Miller (2006)CARB (2007)TIAX (2009)
Cost Estimates with Production Volume
0
100
200
300
400
500
600
700
800
900
1000
0 2,000,000 4,000,000 6,000,000 8,000,000 10,000,000
Production Volume (packs/yr)
Cos
t ($/
kWh)
ANL (2009)EPRI (2007)Miller (2006)CARB (2007)TIAX (2009)
85% experience curvefitted to points from all models
90% experience curve projection based on ANL model
Cost range for lead-acid

10© 2009 Electric Power Research Institute, Inc. All rights reserved.
Cost modeling: Next steps
• The ANL cost model requires verification– Close examination of material cost assumptions
• Effects of volume production (positive and negative)– Examination of process cost assumptions– True costs at intermediate volumes
• Critical for stationary applications• Engage the vendor community
– Keep expectations realistic– Focus vendors on real value
11© 2009 Electric Power Research Institute, Inc. All rights reserved.
Secondary application price range
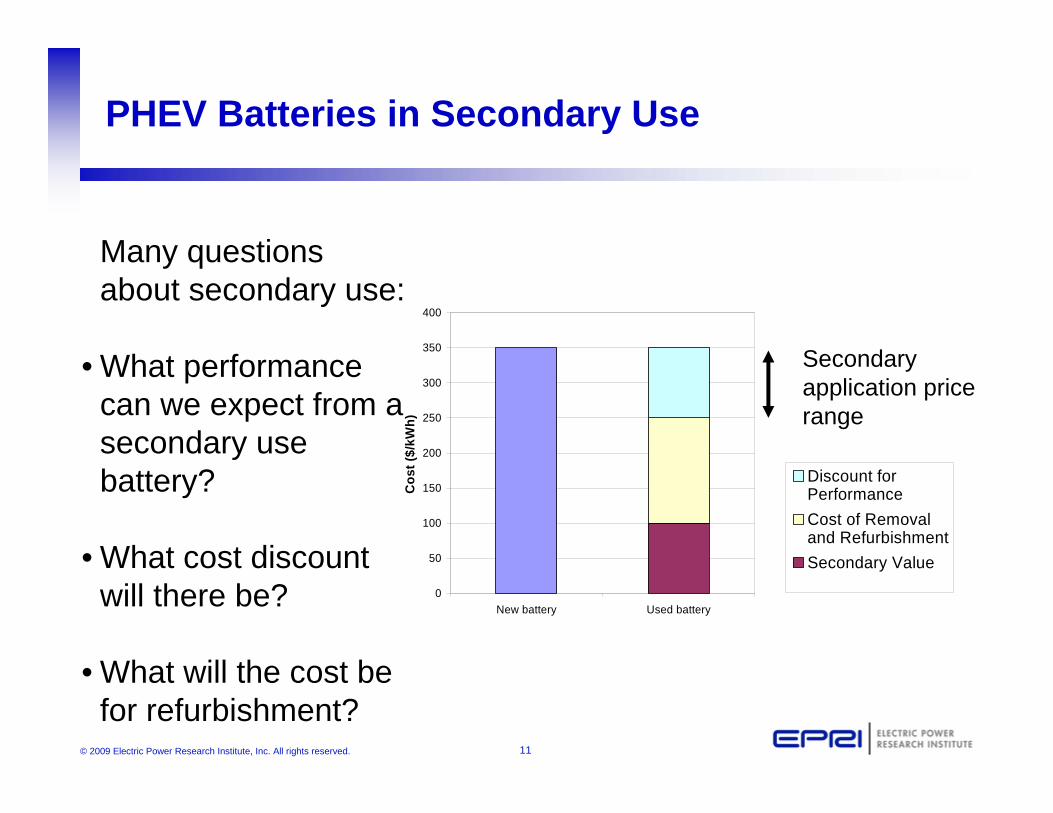
Many questions about secondary use:
• What performance can we expect from a secondary use battery?
• What cost discount will there be?
• What will the cost be for refurbishment?
0
50
100
150
200
250
300
350
400
New battery Used battery
Cos
t ($/
kWh)
Discount forPerformanceCost of Removaland RefurbishmentSecondary Value
PHEV Batteries in Secondary Use
12© 2009 Electric Power Research Institute, Inc. All rights reserved.
Cost modeling: Next steps
• The ANL cost model requires verification– Close examination of material cost assumptions
• Effects of volume production (positive and negative)– Examination of process cost assumptions– True costs at intermediate volumes
• Critical for stationary applications• Engage the vendor community
– Keep expectations realistic– Focus vendors on real value
13© 2009 Electric Power Research Institute, Inc. All rights reserved.
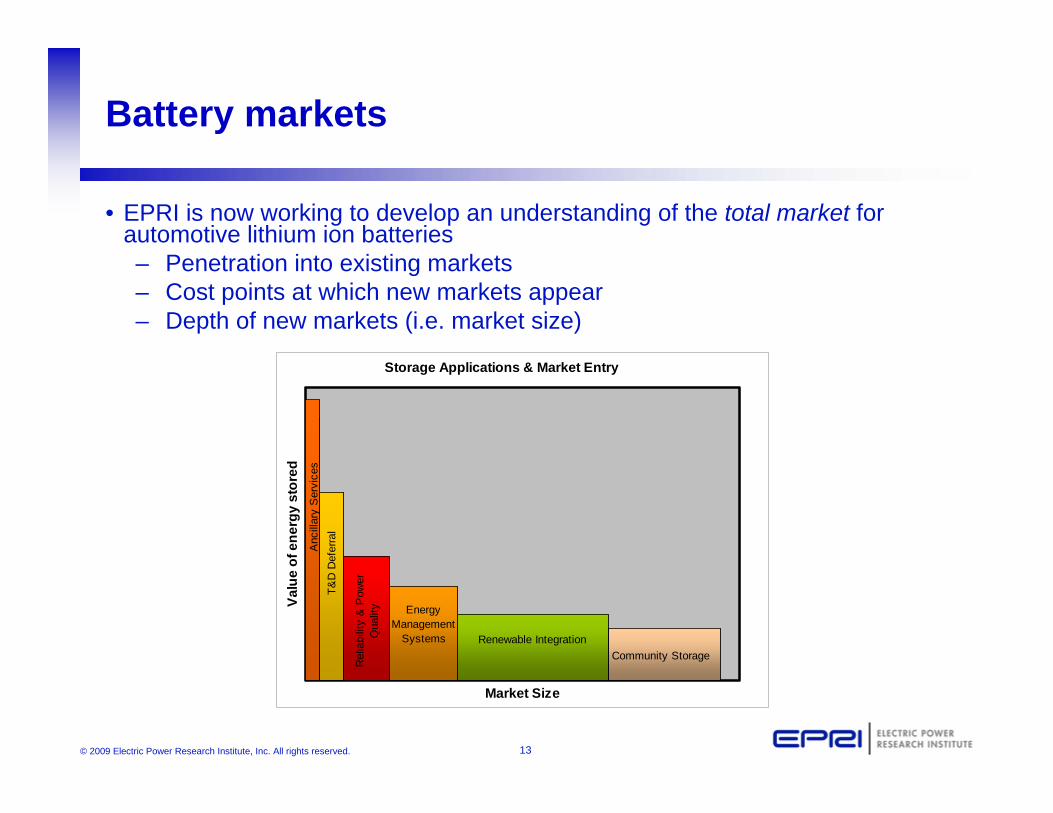
Battery markets
• EPRI is now working to develop an understanding of the total market for automotive lithium ion batteries– Penetration into existing markets– Cost points at which new markets appear– Depth of new markets (i.e. market size)
Storage Applications & Market Entry
Market Size
Valu
e of
ene
rgy
stor
edA
ncill
ary
Ser
vice
s T&
D D
efer
ral
Rel
iabi
lity
& P
ower
Q
ualit
y Energy Management
Systems Renewable Integration Community Storage
14© 2009 Electric Power Research Institute, Inc. All rights reserved.
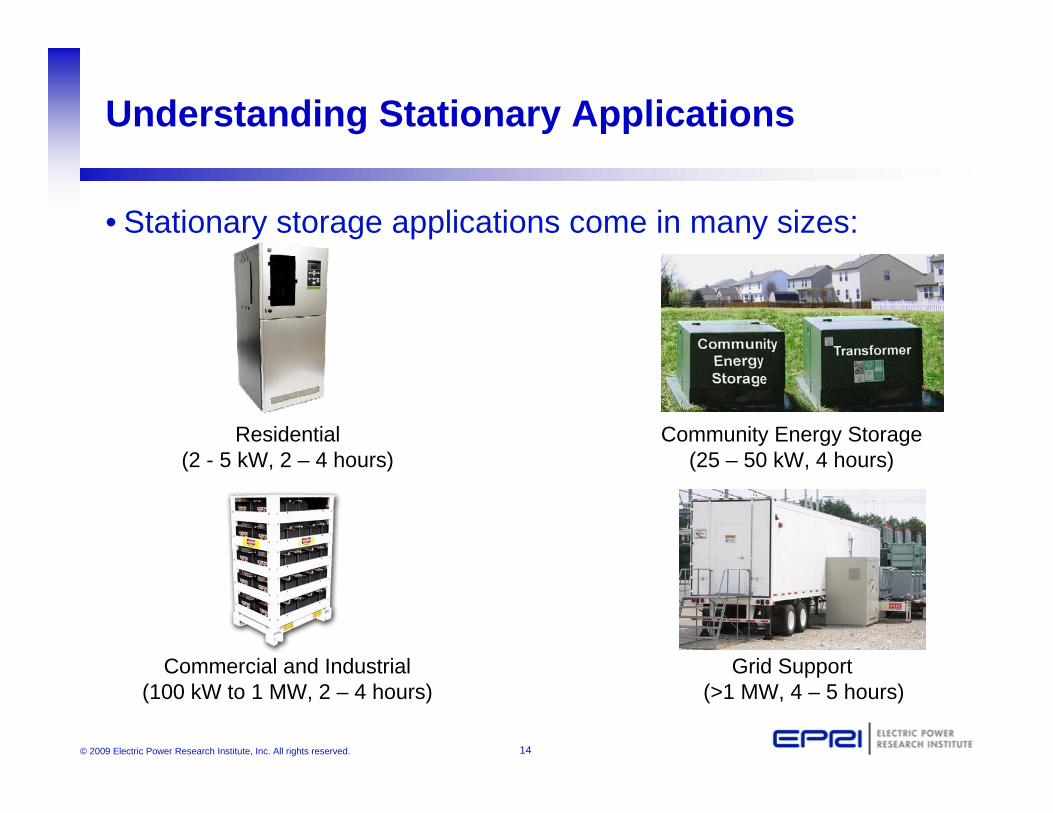
Understanding Stationary Applications
• Stationary storage applications come in many sizes:
Residential(2 - 5 kW, 2 – 4 hours)
Community Energy Storage(25 – 50 kW, 4 hours)
Commercial and Industrial(100 kW to 1 MW, 2 – 4 hours)
Grid Support(>1 MW, 4 – 5 hours)
15© 2009 Electric Power Research Institute, Inc. All rights reserved.
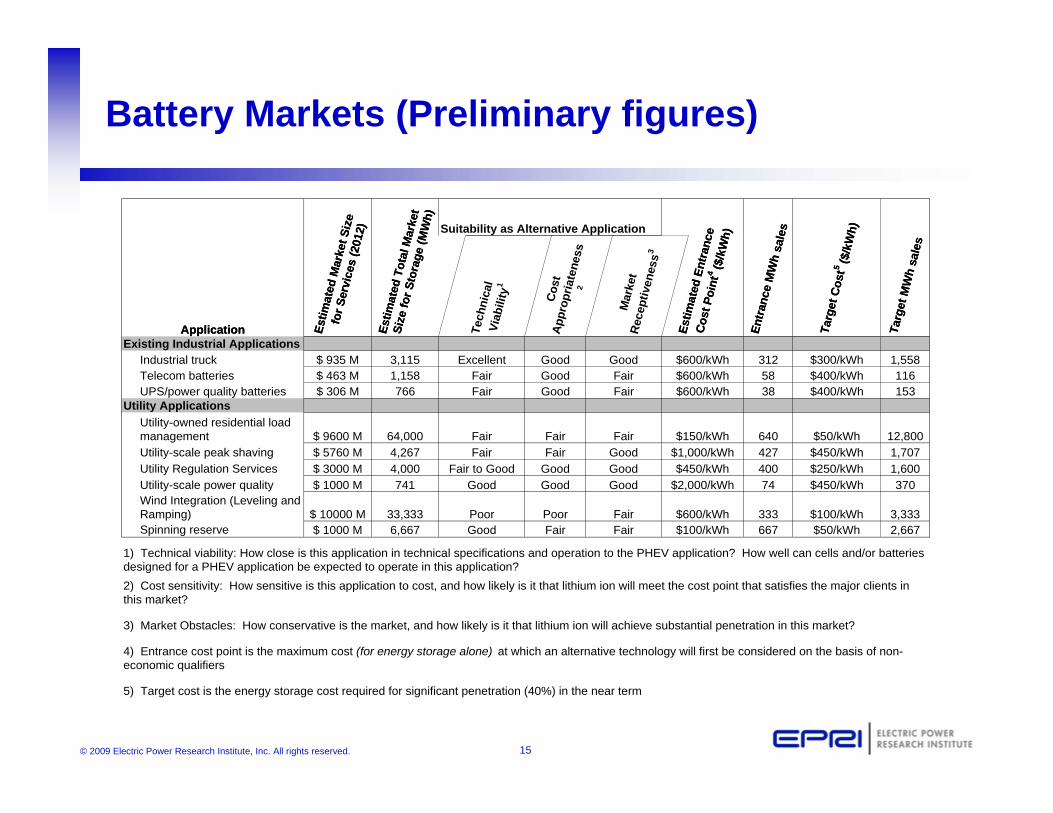
Battery Markets (Preliminary figures)
Suitability as Alternative Application
Estim
ated
Mar
ket S
ize
for S
ervi
ces
(201
2)
Estim
ated
Tot
al M
arke
t Si
ze fo
r Sto
rage
(MW
h)
Estim
ated
Ent
ranc
e C
ost P
oint
4 ($/k
Wh)
Entr
ance
MW
h sa
les
Targ
et C
ost5 ($
/kW
h)
Targ
et M
Wh
sale
s
Application Tech
nica
l Vi
abili
ty1
Cos
t A
ppro
pria
tene
ss2
Mar
ket
Rec
eptiv
enes
s3
Estim
ated
Mar
ket S
ize
for S
ervi
ces
(201
2)
Estim
ated
Tot
al M
arke
t Si
ze fo
r Sto
rage
(MW
h)
Estim
ated
Ent
ranc
e C
ost P
oint
4 ($/k
Wh)
Entr
ance
MW
h sa
les
Targ
et C
ost5 ($
/kW
h)
Targ
et M
Wh
sale
s
ApplicationExisting Industrial Applications
Industrial truck $ 935 M 3,115 Excellent Good Good $600/kWh 312 $300/kWh 1,558Telecom batteries $ 463 M 1,158 Fair Good Fair $600/kWh 58 $400/kWh 116UPS/power quality batteries $ 306 M 766 Fair Good Fair $600/kWh 38 $400/kWh 153
Utility ApplicationsUtility-owned residential load management $ 9600 M 64,000 Fair Fair Fair $150/kWh 640 $50/kWh 12,800Utility-scale peak shaving $ 5760 M 4,267 Fair Fair Good $1,000/kWh 427 $450/kWh 1,707Utility Regulation Services $ 3000 M 4,000 Fair to Good Good Good $450/kWh 400 $250/kWh 1,600Utility-scale power quality $ 1000 M 741 Good Good Good $2,000/kWh 74 $450/kWh 370Wind Integration (Leveling and Ramping) $ 10000 M 33,333 Poor Poor Fair $600/kWh 333 $100/kWh 3,333Spinning reserve $ 1000 M 6,667 Good Fair Fair $100/kWh 667 $50/kWh 2,667
1) Technical viability: How close is this application in technical specifications and operation to the PHEV application? How well can cells and/or batteries designed for a PHEV application be expected to operate in this application?2) Cost sensitivity: How sensitive is this application to cost, and how likely is it that lithium ion will meet the cost point that satisfies the major clients in this market?
3) Market Obstacles: How conservative is the market, and how likely is it that lithium ion will achieve substantial penetration in this market?
4) Entrance cost point is the maximum cost (for energy storage alone) at which an alternative technology will first be considered on the basis of non-economic qualifiers
5) Target cost is the energy storage cost required for significant penetration (40%) in the near term
16© 2009 Electric Power Research Institute, Inc. All rights reserved.
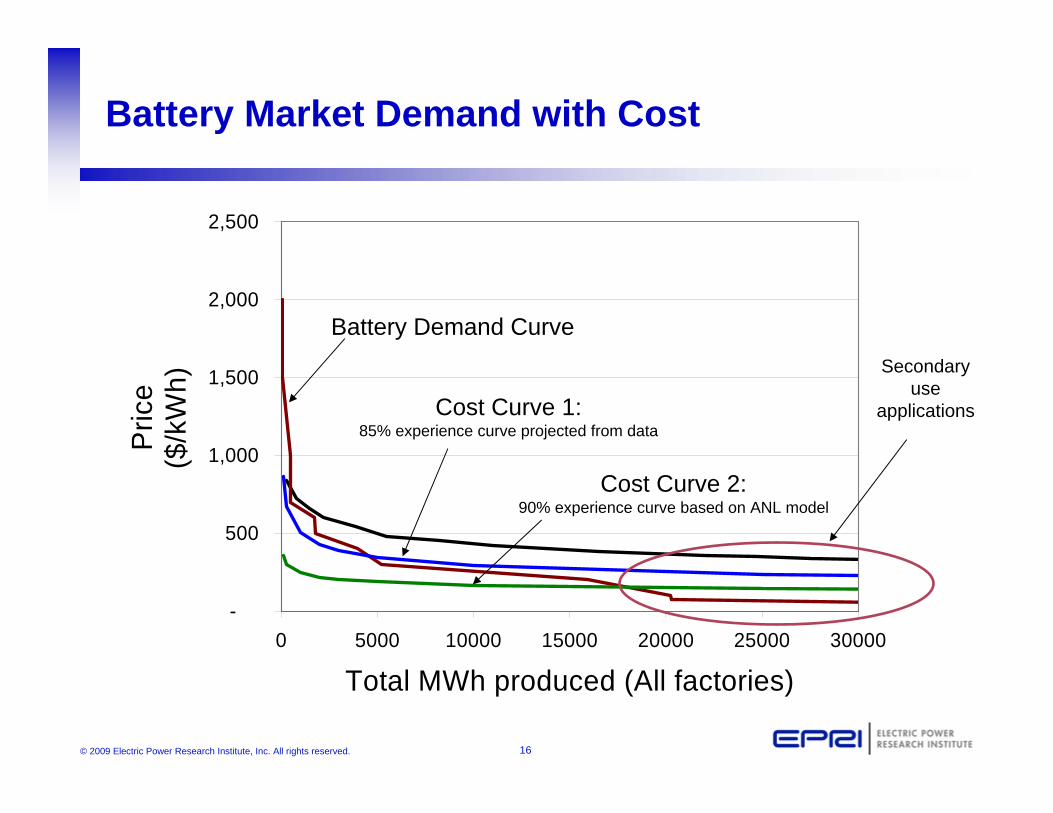
Battery Market Demand with Cost
-
500
1,000
1,500
2,000
2,500
0 5000 10000 15000 20000 25000 30000
Total MWh produced (All factories)
Pric
e($
/kW
h)
-
500
1,000
1,500
2,000
2,500
0 5000 10000 15000 20000 25000 30000
Total MWh produced (All factories)
Pric
e($
/kW
h)
Battery Volume/Cost Curve
Battery Demand with $500/kWh Subsidy
-
500
1,000
1,500
2,000
2,500
0 5000 10000 15000 20000 25000 30000
Total MWh produced (All factories)
Pric
e($
/kW
h)
-
500
1,000
1,500
2,000
2,500
0 5000 10000 15000 20000 25000 30000
Total MWh produced (All factories)
Pric
e($
/kW
h)
Cost Curve 1:85% experience curve projected from data
Cost Curve 2:90% experience curve based on ANL model
Battery Demand CurveSecondary
use applications
17© 2009 Electric Power Research Institute, Inc. All rights reserved.
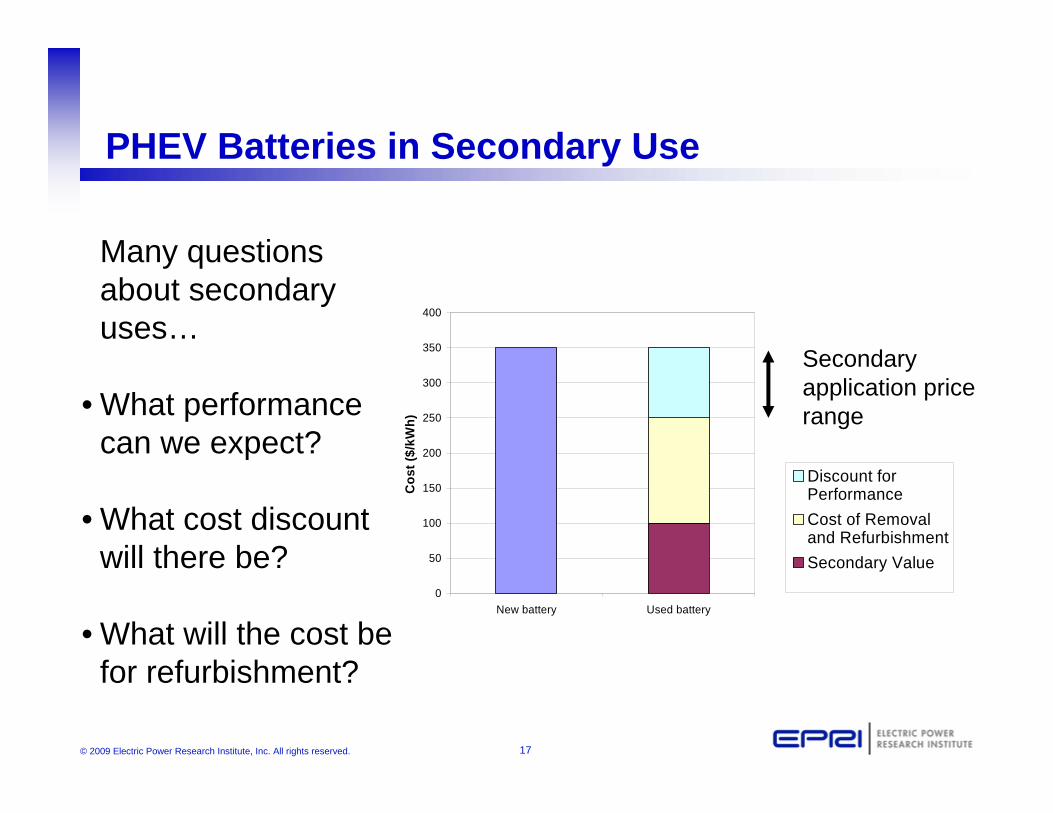
PHEV Batteries in Secondary Use
Secondary application price range
Many questions about secondary uses…
• What performance can we expect?
• What cost discount will there be?
• What will the cost be for refurbishment?
0
50
100
150
200
250
300
350
400
New battery Used battery
Cos
t ($/
kWh)
Discount forPerformanceCost of Removaland RefurbishmentSecondary Value
18© 2009 Electric Power Research Institute, Inc. All rights reserved.
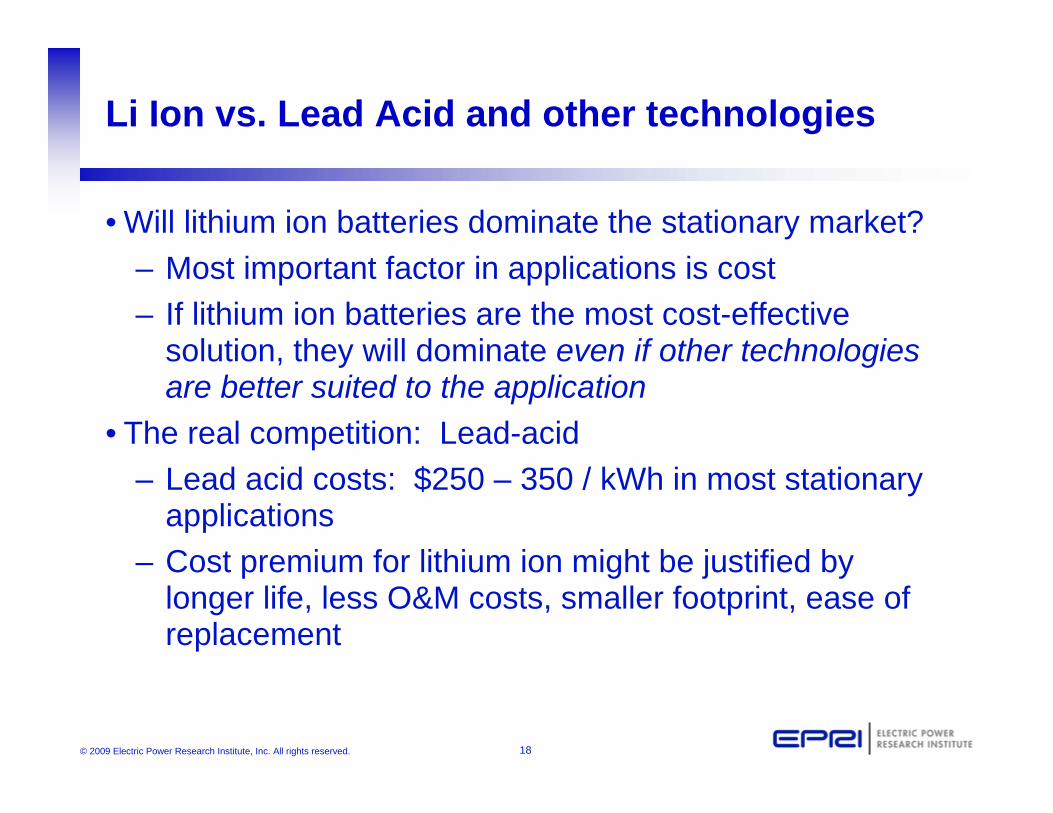
Li Ion vs. Lead Acid and other technologies
• Will lithium ion batteries dominate the stationary market?– Most important factor in applications is cost– If lithium ion batteries are the most cost-effective
solution, they will dominate even if other technologies are better suited to the application
• The real competition: Lead-acid – Lead acid costs: $250 – 350 / kWh in most stationary
applications– Cost premium for lithium ion might be justified by
longer life, less O&M costs, smaller footprint, ease of replacement

19© 2009 Electric Power Research Institute, Inc. All rights reserved.Image from NASA Visible Earth
20© 2009 Electric Power Research Institute, Inc. All rights reserved.
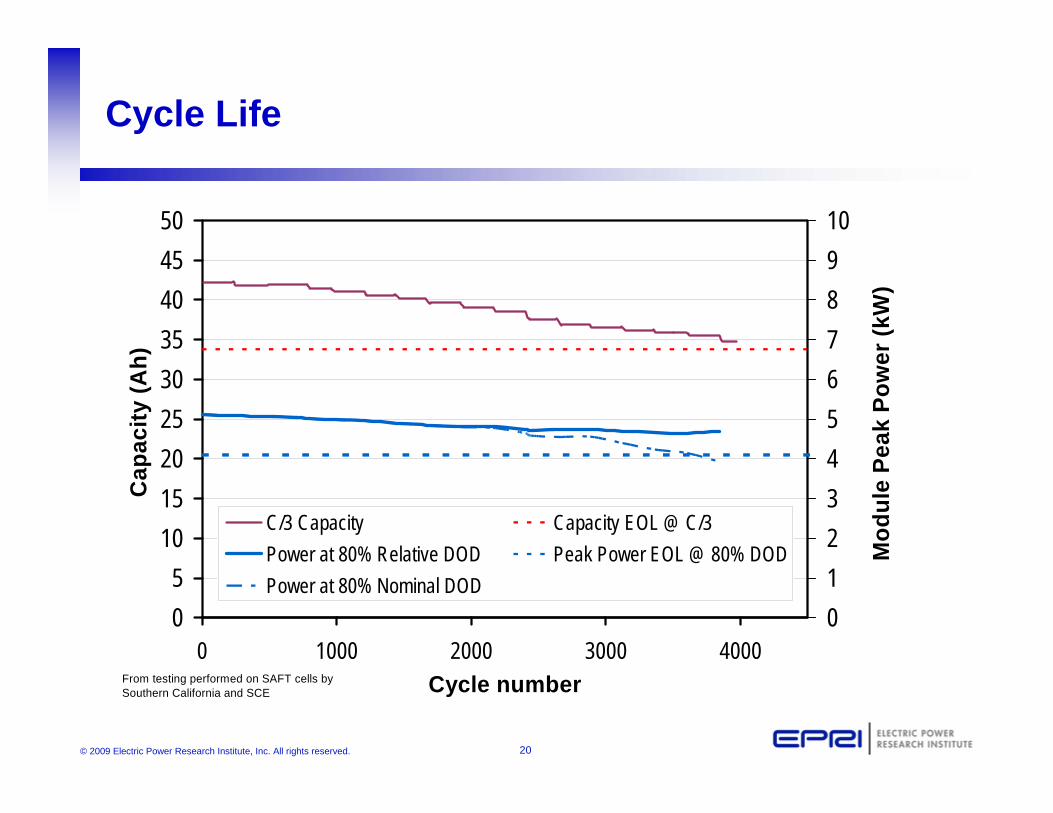
Cycle Life
05
101520253035404550
0 1000 2000 3000 4000Cycle number
Cap
acity
(Ah)
012345678910
Mod
ule
Peak
Pow
er (k
W)
C/3 Capacity Capacity EOL @ C/3Power at 80% Relative DOD Peak Power EOL @ 80% DODPower at 80% Nominal DOD
From testing performed on SAFT cells bySouthern California and SCE
21© 2009 Electric Power Research Institute, Inc. All rights reserved.
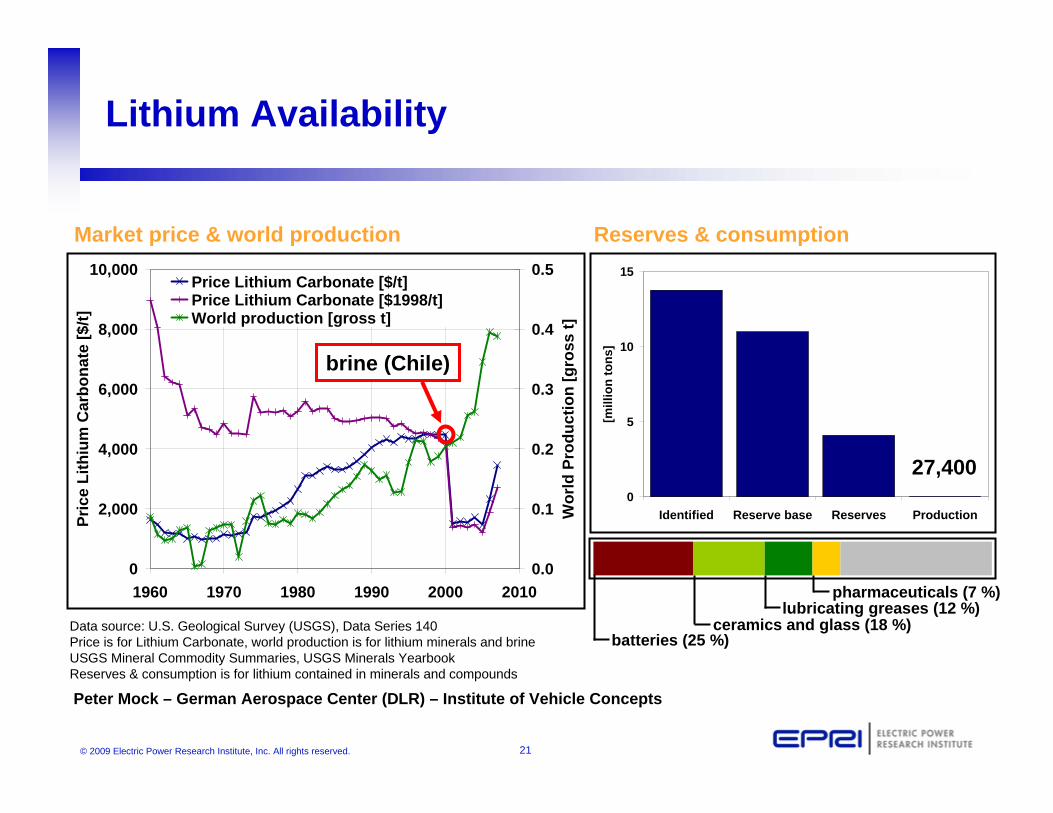
Lithium Availability
0
2,000
4,000
6,000
8,000
10,000
1960 1970 1980 1990 2000 2010
Pric
e Li
thiu
m C
arbo
nate
[$/t]
0.0
0.1
0.2
0.3
0.4
0.5
Wor
ld P
rodu
ctio
n [g
ross
t]
Price Lithium Carbonate [$/t]Price Lithium Carbonate [$1998/t]World production [gross t]
0
5
10
15
Identified Reserve base Reserves Production
[mill
ion
tons
]
Market price & world production Reserves & consumption
Peter Mock – German Aerospace Center (DLR) – Institute of Vehicle Concepts
Data source: U.S. Geological Survey (USGS), Data Series 140Price is for Lithium Carbonate, world production is for lithium minerals and brineUSGS Mineral Commodity Summaries, USGS Minerals YearbookReserves & consumption is for lithium contained in minerals and compounds
brine (Chile)
27,400
pharmaceuticals (7 %)lubricating greases (12 %)
ceramics and glass (18 %)batteries (25 %)
22© 2009 Electric Power Research Institute, Inc. All rights reserved.
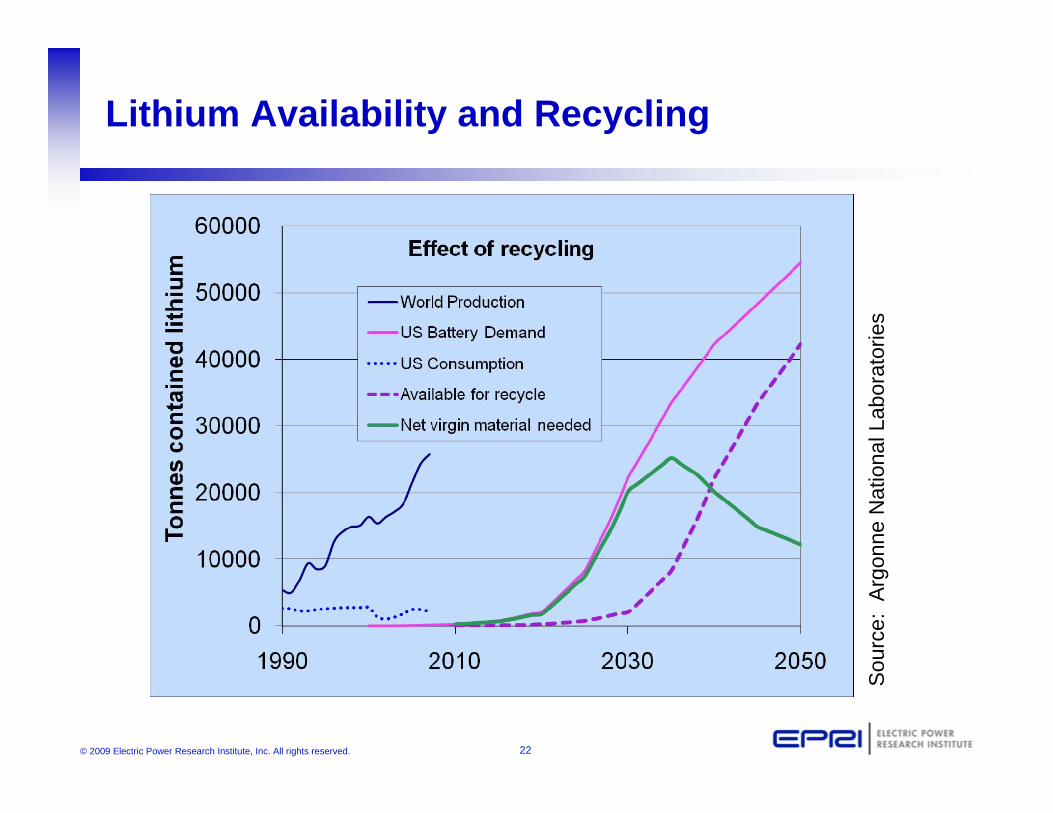
Lithium Availability and Recycling
Sou
rce:
Arg
onne
Nat
iona
l Lab
orat
orie
s