little genetic differentiation as assessed by uniparental markers
TRANSCRIPT
RESEARCH ARTICLE Open Access
Little genetic differentiation as assessed byuniparental markers in the presence ofsubstantial language variation in peoples ofthe Cross River region of NigeriaKrishna R Veeramah1,2*, Bruce A Connell3, Naser Ansari Pour4, Adam Powell5, Christopher A Plaster4,David Zeitlyn6, Nancy R Mendell7, Michael E Weale8, Neil Bradman4, Mark G Thomas5,9,10
Abstract
Background: The Cross River region in Nigeria is an extremely diverse area linguistically with over 60 distinctlanguages still spoken today. It is also a region of great historical importance, being a) adjacent to the likelyhomeland from which Bantu-speaking people migrated across most of sub-Saharan Africa 3000-5000 years agoand b) the location of Calabar, one of the largest centres during the Atlantic slave trade. Over 1000 DNA samplesfrom 24 clans representing speakers of the six most prominent languages in the region were collected and typedfor Y-chromosome (SNPs and microsatellites) and mtDNA markers (Hypervariable Segment 1) in order to examinewhether there has been substantial gene flow between groups speaking different languages in the region. Inaddition the Cross River region was analysed in the context of a larger geographical scale by comparison tobordering Igbo speaking groups as well as neighbouring Cameroon populations and more distant Ghanaiancommunities.
Results: The Cross River region was shown to be extremely homogenous for both Y-chromosome and mtDNAmarkers with language spoken having no noticeable effect on the genetic structure of the region, consistent withestimates of inter-language gene flow of 10% per generation based on sociological data. However the groups inthe region could clearly be differentiated from others in Cameroon and Ghana (and to a lesser extent Igbopopulations). Significant correlations between genetic distance and both geographic and linguistic distance wereobserved at this larger scale.
Conclusions: Previous studies have found significant correlations between genetic variation and language in Africaover large geographic distances, often across language families. However the broad sampling strategies of thesedatasets have limited their utility for understanding the relationship within language families. This is the first studyto show that at very fine geographic/linguistic scales language differences can be maintained in the presence ofsubstantial gene flow over an extended period of time and demonstrates the value of dense sampling strategiesand having DNA of known and detailed provenance, a practice that is generally rare when investigating sub-Saharan African demographic processes using genetic data.
BackgroundThe peoples and languages of the Cross River regionThe Cross River region (named after the river of thesame name that passes through it) is situated in the
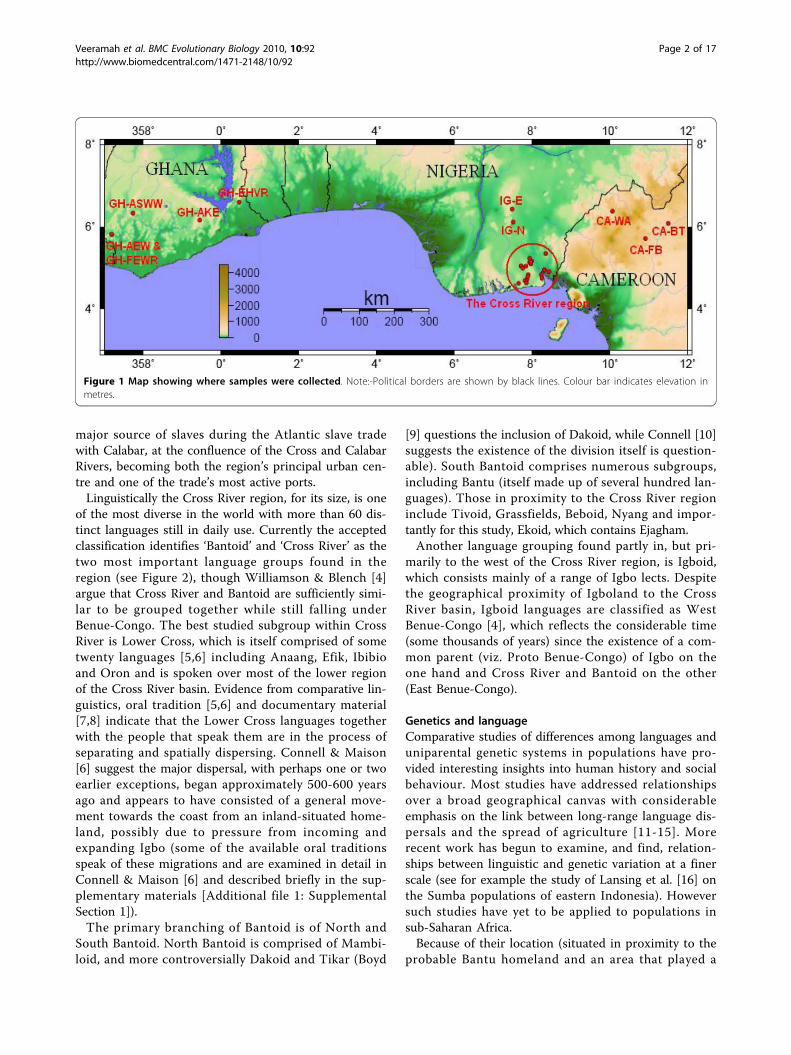
extreme southeast of Nigeria, with its headwaters in theadjacent parts of Cameroon. The land to the north eastof the Cross River region (Figure 1) is now generallyaccepted as the approximate location from which theexpansion of the Bantu-speaking peoples began betweenthree and five thousand years ago [1-3]. Bantu languagesare now spoken throughout most of sub-Saharan Africasouth of the equator. The Cross River region was also a
* Correspondence: [email protected] for Society and Genetics, University of California, Los Angeles, RolfeHall, Los Angeles, CA 90095-722, USA
Veeramah et al. BMC Evolutionary Biology 2010, 10:92http://www.biomedcentral.com/1471-2148/10/92
© 2010 Veeramah et al; licensee BioMed Central Ltd. This is an Open Access article distributed under the terms of the CreativeCommons Attribution License (http://creativecommons.org/licenses/by/2.0), which permits unrestricted use, distribution, andreproduction in any medium, provided the original work is properly cited.
major source of slaves during the Atlantic slave tradewith Calabar, at the confluence of the Cross and CalabarRivers, becoming both the region’s principal urban cen-tre and one of the trade’s most active ports.Linguistically the Cross River region, for its size, is one
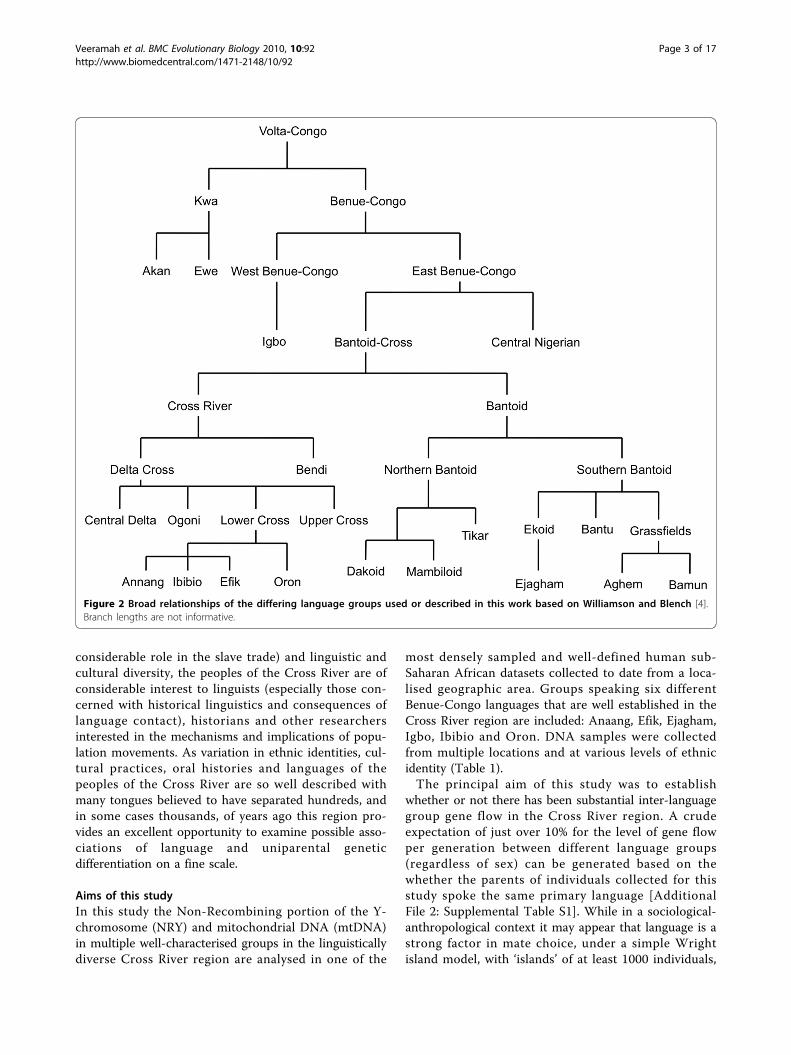
of the most diverse in the world with more than 60 dis-tinct languages still in daily use. Currently the acceptedclassification identifies ‘Bantoid’ and ‘Cross River’ as thetwo most important language groups found in theregion (see Figure 2), though Williamson & Blench [4]argue that Cross River and Bantoid are sufficiently simi-lar to be grouped together while still falling underBenue-Congo. The best studied subgroup within CrossRiver is Lower Cross, which is itself comprised of sometwenty languages [5,6] including Anaang, Efik, Ibibioand Oron and is spoken over most of the lower regionof the Cross River basin. Evidence from comparative lin-guistics, oral tradition [5,6] and documentary material[7,8] indicate that the Lower Cross languages togetherwith the people that speak them are in the process ofseparating and spatially dispersing. Connell & Maison[6] suggest the major dispersal, with perhaps one or twoearlier exceptions, began approximately 500-600 yearsago and appears to have consisted of a general move-ment towards the coast from an inland-situated home-land, possibly due to pressure from incoming andexpanding Igbo (some of the available oral traditionsspeak of these migrations and are examined in detail inConnell & Maison [6] and described briefly in the sup-plementary materials [Additional file 1: SupplementalSection 1]).The primary branching of Bantoid is of North and
South Bantoid. North Bantoid is comprised of Mambi-loid, and more controversially Dakoid and Tikar (Boyd
[9] questions the inclusion of Dakoid, while Connell [10]suggests the existence of the division itself is question-able). South Bantoid comprises numerous subgroups,including Bantu (itself made up of several hundred lan-guages). Those in proximity to the Cross River regioninclude Tivoid, Grassfields, Beboid, Nyang and impor-tantly for this study, Ekoid, which contains Ejagham.Another language grouping found partly in, but pri-
marily to the west of the Cross River region, is Igboid,which consists mainly of a range of Igbo lects. Despitethe geographical proximity of Igboland to the CrossRiver basin, Igboid languages are classified as WestBenue-Congo [4], which reflects the considerable time(some thousands of years) since the existence of a com-mon parent (viz. Proto Benue-Congo) of Igbo on theone hand and Cross River and Bantoid on the other(East Benue-Congo).
Genetics and languageComparative studies of differences among languages anduniparental genetic systems in populations have pro-vided interesting insights into human history and socialbehaviour. Most studies have addressed relationshipsover a broad geographical canvas with considerableemphasis on the link between long-range language dis-persals and the spread of agriculture [11-15]. Morerecent work has begun to examine, and find, relation-ships between linguistic and genetic variation at a finerscale (see for example the study of Lansing et al. [16] onthe Sumba populations of eastern Indonesia). Howeversuch studies have yet to be applied to populations insub-Saharan Africa.Because of their location (situated in proximity to the
probable Bantu homeland and an area that played a
Figure 1 Map showing where samples were collected. Note:-Political borders are shown by black lines. Colour bar indicates elevation inmetres.
Veeramah et al. BMC Evolutionary Biology 2010, 10:92http://www.biomedcentral.com/1471-2148/10/92
Page 2 of 17
considerable role in the slave trade) and linguistic andcultural diversity, the peoples of the Cross River are ofconsiderable interest to linguists (especially those con-cerned with historical linguistics and consequences oflanguage contact), historians and other researchersinterested in the mechanisms and implications of popu-lation movements. As variation in ethnic identities, cul-tural practices, oral histories and languages of thepeoples of the Cross River are so well described withmany tongues believed to have separated hundreds, andin some cases thousands, of years ago this region pro-vides an excellent opportunity to examine possible asso-ciations of language and uniparental geneticdifferentiation on a fine scale.
Aims of this studyIn this study the Non-Recombining portion of the Y-chromosome (NRY) and mitochondrial DNA (mtDNA)in multiple well-characterised groups in the linguisticallydiverse Cross River region are analysed in one of the
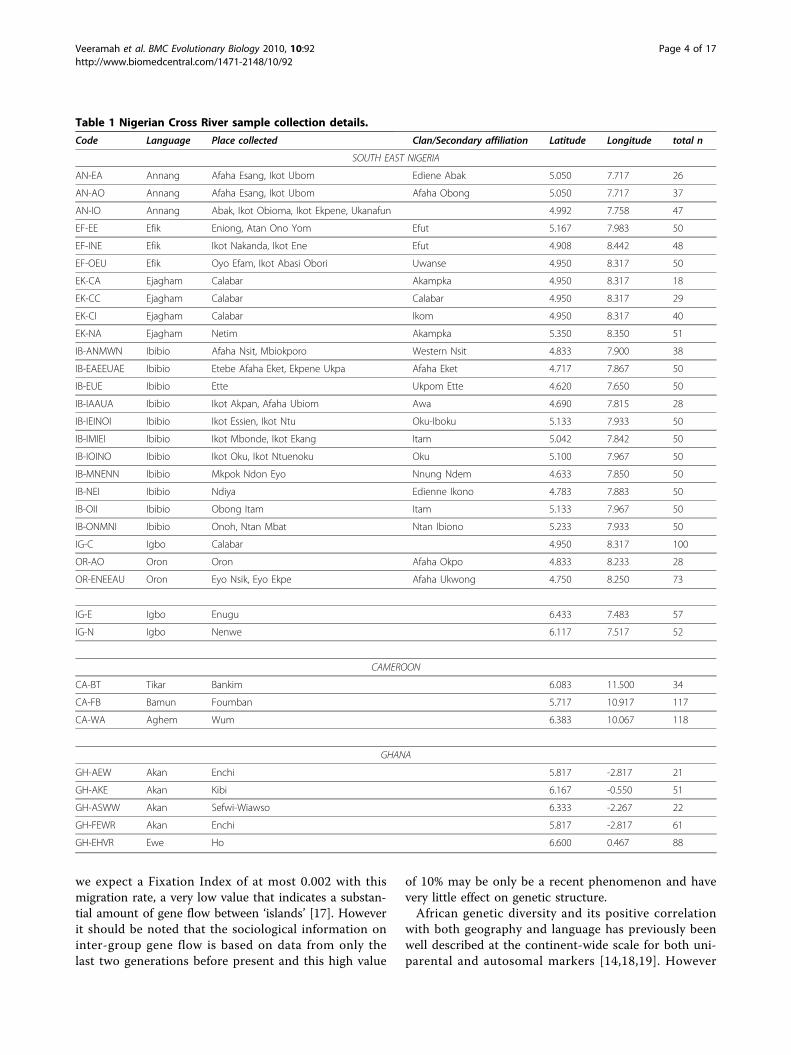
most densely sampled and well-defined human sub-Saharan African datasets collected to date from a loca-lised geographic area. Groups speaking six differentBenue-Congo languages that are well established in theCross River region are included: Anaang, Efik, Ejagham,Igbo, Ibibio and Oron. DNA samples were collectedfrom multiple locations and at various levels of ethnicidentity (Table 1).The principal aim of this study was to establish
whether or not there has been substantial inter-languagegroup gene flow in the Cross River region. A crudeexpectation of just over 10% for the level of gene flowper generation between different language groups(regardless of sex) can be generated based on thewhether the parents of individuals collected for thisstudy spoke the same primary language [AdditionalFile 2: Supplemental Table S1]. While in a sociological-anthropological context it may appear that language is astrong factor in mate choice, under a simple Wrightisland model, with ‘islands’ of at least 1000 individuals,
Figure 2 Broad relationships of the differing language groups used or described in this work based on Williamson and Blench [4].Branch lengths are not informative.
Veeramah et al. BMC Evolutionary Biology 2010, 10:92http://www.biomedcentral.com/1471-2148/10/92
Page 3 of 17
we expect a Fixation Index of at most 0.002 with thismigration rate, a very low value that indicates a substan-tial amount of gene flow between ‘islands’ [17]. Howeverit should be noted that the sociological information oninter-group gene flow is based on data from only thelast two generations before present and this high value
of 10% may be only be a recent phenomenon and havevery little effect on genetic structure.African genetic diversity and its positive correlation
with both geography and language has previously beenwell described at the continent-wide scale for both uni-parental and autosomal markers [14,18,19]. However
Table 1 Nigerian Cross River sample collection details.
Code Language Place collected Clan/Secondary affiliation Latitude Longitude total n
SOUTH EAST NIGERIA
AN-EA Annang Afaha Esang, Ikot Ubom Ediene Abak 5.050 7.717 26
AN-AO Annang Afaha Esang, Ikot Ubom Afaha Obong 5.050 7.717 37
AN-IO Annang Abak, Ikot Obioma, Ikot Ekpene, Ukanafun 4.992 7.758 47
EF-EE Efik Eniong, Atan Ono Yom Efut 5.167 7.983 50
EF-INE Efik Ikot Nakanda, Ikot Ene Efut 4.908 8.442 48
EF-OEU Efik Oyo Efam, Ikot Abasi Obori Uwanse 4.950 8.317 50
EK-CA Ejagham Calabar Akampka 4.950 8.317 18
EK-CC Ejagham Calabar Calabar 4.950 8.317 29
EK-CI Ejagham Calabar Ikom 4.950 8.317 40
EK-NA Ejagham Netim Akampka 5.350 8.350 51
IB-ANMWN Ibibio Afaha Nsit, Mbiokporo Western Nsit 4.833 7.900 38
IB-EAEEUAE Ibibio Etebe Afaha Eket, Ekpene Ukpa Afaha Eket 4.717 7.867 50
IB-EUE Ibibio Ette Ukpom Ette 4.620 7.650 50
IB-IAAUA Ibibio Ikot Akpan, Afaha Ubiom Awa 4.690 7.815 28
IB-IEINOI Ibibio Ikot Essien, Ikot Ntu Oku-Iboku 5.133 7.933 50
IB-IMIEI Ibibio Ikot Mbonde, Ikot Ekang Itam 5.042 7.842 50
IB-IOINO Ibibio Ikot Oku, Ikot Ntuenoku Oku 5.100 7.967 50
IB-MNENN Ibibio Mkpok Ndon Eyo Nnung Ndem 4.633 7.850 50
IB-NEI Ibibio Ndiya Edienne Ikono 4.783 7.883 50
IB-OII Ibibio Obong Itam Itam 5.133 7.967 50
IB-ONMNI Ibibio Onoh, Ntan Mbat Ntan Ibiono 5.233 7.933 50
IG-C Igbo Calabar 4.950 8.317 100
OR-AO Oron Oron Afaha Okpo 4.833 8.233 28
OR-ENEEAU Oron Eyo Nsik, Eyo Ekpe Afaha Ukwong 4.750 8.250 73
IG-E Igbo Enugu 6.433 7.483 57
IG-N Igbo Nenwe 6.117 7.517 52
CAMEROON
CA-BT Tikar Bankim 6.083 11.500 34
CA-FB Bamun Foumban 5.717 10.917 117
CA-WA Aghem Wum 6.383 10.067 118
GHANA
GH-AEW Akan Enchi 5.817 -2.817 21
GH-AKE Akan Kibi 6.167 -0.550 51
GH-ASWW Akan Sefwi-Wiawso 6.333 -2.267 22
GH-FEWR Akan Enchi 5.817 -2.817 61
GH-EHVR Ewe Ho 6.600 0.467 88
Veeramah et al. BMC Evolutionary Biology 2010, 10:92http://www.biomedcentral.com/1471-2148/10/92
Page 4 of 17
attempts to investigate the relationship at finer scales,for example within language families, have demonstratedthis relationship breaking down on occasion. Whetherthis is a real and widespread phenomenon or simply aresult of the unsuitability of the datasets utilised withregard to sampling density is unclear. Having a goodunderstanding of the relationship between geographic/linguistic scale and human genetic variation is importantfrom linguistic, anthropological and medical perspec-tives. Therefore, in order to compliment existing studiesconducted at very broad scales we also examined theCross River region within the somewhat intermediategeographical context of West Central Africa by analys-ing additional groups resident in the neighbouringNorthwest Province (NWP) of Cameroon and more dis-tant Ghanaian populations (see Figure 1 and Table 1).Gene flow between these three regions is likely to below given the large distances involved and thereforeobservable differences among the NRY and mtDNA pro-files of these three regions would be expected in com-parison to the Cross River scale. Finally this study willalso provide vital additional information on the overallpattern of genetic variation in sub-Saharan Africa suchas the distribution of the widespread Y-haplogroupE1b1a and its subclades.
ResultsInvestigating potential language structuring in the CrossRiver regionUsing pooled datasets of speakers of the six differentlinguistic groups sampled in the Cross River region(where clan/secondary affiliations were ignored) thehierarchical Analysis of Molecular Variance (AMOVA)-based Fixation indexes were not significant at any NRY
[Additional file 2: Supplemental Table S2] or mtDNA[Additional file 2: Supplemental Table S3] level (P >0.100) (see Table 2 for all AMOVA results). However totake into account any differences between languagegroups due to differences within language groups eachclan was analysed separately but within a frameworkwhere they were hierarchically grouped by their lan-guage spoken. Again the AMOVA-based FixationIndices for among-language-group differences were notsignificant at any NRY or mtDNA level of analysis (P-value > 0.105).Though the Fixation Indices discussed above indicate a
lack of among-group structure a small number of signifi-cant individual pairwise differences were observed at everyNRY and mtDNA level (0-1.4% of pairwise comparisonsfor a particular level of NRY or mtDNA analysis were sig-nificant at least at the 1% level, within the expected Type 1error range [Additional file 2: Supplemental Table S4][Additional file 2: Supplemental Table S5])We conducted simulations [Additional file 1: Supple-
mental Section 2] replicating NRY UEP haplogroup andsix microsatellite (UEP+MS) haplotype and mtDNAHypervariable Segment -1(HVS-1) haplotype populationdynamics in the Cross River region under realisticdemographic parameters. The number of significant (P< 0.05) population pairwise genetic distances observed(5-6% of all pairwise comparisons) was much less thanexpected even for migration rates as high as 0.3 (23% ofall pairwise comparisons) using simulated data. In addi-tion the simulations showed that at such high migrationrates the simulated AMOVA-based Fixation Indiceswere still not as low as for our observed data and thatmost population pairwise significant differences werestochastic (possibly driven by random sampling effects)
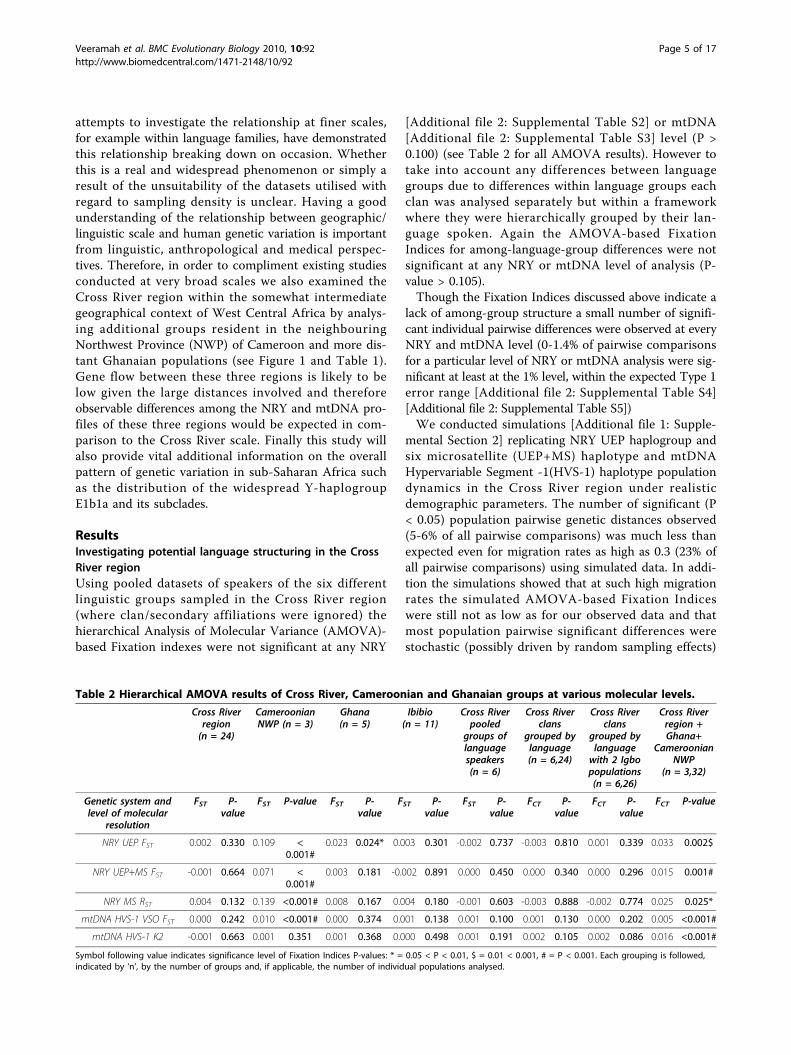
Table 2 Hierarchical AMOVA results of Cross River, Cameroonian and Ghanaian groups at various molecular levels.
Cross Riverregion(n = 24)
CameroonianNWP (n = 3)
Ghana(n = 5)
Ibibio(n = 11)
Cross Riverpooled
groups oflanguagespeakers(n = 6)
Cross Riverclans
grouped bylanguage(n = 6,24)
Cross Riverclans
grouped bylanguagewith 2 Igbopopulations(n = 6,26)
Cross Riverregion +Ghana+
CameroonianNWP
(n = 3,32)
Genetic system andlevel of molecular
resolution
FST P-value
FST P-value FST P-value
FST P-value
FST P-value
FCT P-value
FCT P-value
FCT P-value
NRY UEP FST 0.002 0.330 0.109 <0.001#
0.023 0.024* 0.003 0.301 -0.002 0.737 -0.003 0.810 0.001 0.339 0.033 0.002$
NRY UEP+MS FST -0.001 0.664 0.071 <0.001#
0.003 0.181 -0.002 0.891 0.000 0.450 0.000 0.340 0.000 0.296 0.015 0.001#
NRY MS RST 0.004 0.132 0.139 <0.001# 0.008 0.167 0.004 0.180 -0.001 0.603 -0.003 0.888 -0.002 0.774 0.025 0.025*
mtDNA HVS-1 VSO FST 0.000 0.242 0.010 <0.001# 0.000 0.374 0.001 0.138 0.001 0.100 0.001 0.130 0.000 0.202 0.005 <0.001#
mtDNA HVS-1 K2 -0.001 0.663 0.001 0.351 0.001 0.368 0.000 0.498 0.001 0.191 0.002 0.105 0.002 0.086 0.016 <0.001#
Symbol following value indicates significance level of Fixation Indices P-values: * = 0.05 < P < 0.01, $ = 0.01 < 0.001, # = P < 0.001. Each grouping is followed,indicated by ‘n’, by the number of groups and, if applicable, the number of individual populations analysed.
Veeramah et al. BMC Evolutionary Biology 2010, 10:92http://www.biomedcentral.com/1471-2148/10/92
Page 5 of 17
and of a transient nature (persisting for an average oftwo generations before the general high migration rateof the world “re-homogenised” the populations). Thusthe results of our simulations are compatible with thescenario of the Cross River region being a homogenoussystem with high inter-group migration.
Cross River region and IgbolandCalabar is considered a particularly cosmopolitan citywhere different ethnicities reside together at an unu-sually high frequency for the Cross River region as awhole. Therefore two groups from Igboland to the westof the Cross River region (IG-E and IG-N) were addedto the inter-language group analysis to take into accountthe potentially unusually high levels of inter-ethnicadmixture that may have taken place involving Igbofrom Calabar. The AMOVA-based FCT (the among-group Fixation Index) values (see Table 2) were notnoticeably different at any NRY or mtDNA levels whenthe IG-N and IG-E were grouped with the Igbo-speak-ing group from Calabar (all other language group struc-tures were the same) and none of the FCT values weresignificant (P-value > 0.086). However there was a nota-ble and substantial increase in the number of pairwisesignificant differences involving the two Igboland groupsand other Cross River clans [Additional file 2: Supple-mental Table S4] [Additional file 2: Supplemental TableS5], especially for IG-N at the UEP and UEP+MS levelswhere 22/24 comparisons were significantly different atthe 5% level (15-16 at the 1% level).
The Cross River region within the context of West CentralAfricaUsing three pooled datasets consisting of the 24 CrossRiver region clans, five Ghanaian groups and threeCameroonian NWP groups (note that the Tikar popula-tion, CA-BT, strictly lie in the Adamaoua Province closeto the NWP border) respectively, pairwise ETPD showedsignificant differences at the 1% threshold between allthree datasets at all NRY and mtDNA levels while NRYRST and mtDNA K2 (see Methods section for explanationof K2) genetic distances were also significant at the 1%threshold [Additional File 2: Supplemental Table S6].Once again, to account for possible within-region differ-entiation the Cross River clans and Ghanaian and Camer-oonian groups were analysed within a framework wherepopulations were also hierarchically grouped by theircountry of origin. The AMOVA-based Fixation Indicesfor among-country-group differences were significant atthe 5% threshold using RST and were significant at the1% level using UEP defined haplogroups and UEP+MShaplotypes and at both levels of mtDNA analysis.The Cameroonian NWP populations tended to
demonstrate more pairwise significant differences (both
in number and significance level) than Ghanaian popu-lations when compared to Cross River clans [Additionalfile 1: Supplemental Figure S1] [Additional file 2: Sup-plemental Table S4] [Additional file 2: SupplementalTable S5]. Pairwise comparisons via genetic distancesand ETPD [Additional file 2: Supplemental Table S4][Additional file 2: Supplemental Table S5] also showthat at the UEP+MS, RST and mtDNA haplotype levels(and to some extent mtDNA K2 levels) pairwise com-parisons between Ghanaian and Cameroonian popula-tions were highly significant. It was noticeable that theAMOVA-based Fixation index for the CameroonianNWP alone was highly significant at all levels (P <0.001) except based on mtDNA K2 distances, whileGhana was more homogenous, only showing signifi-cance at 5% at the UEP level (see Table 2).Principle Co-Ordinate (PCO) plots of NRY and
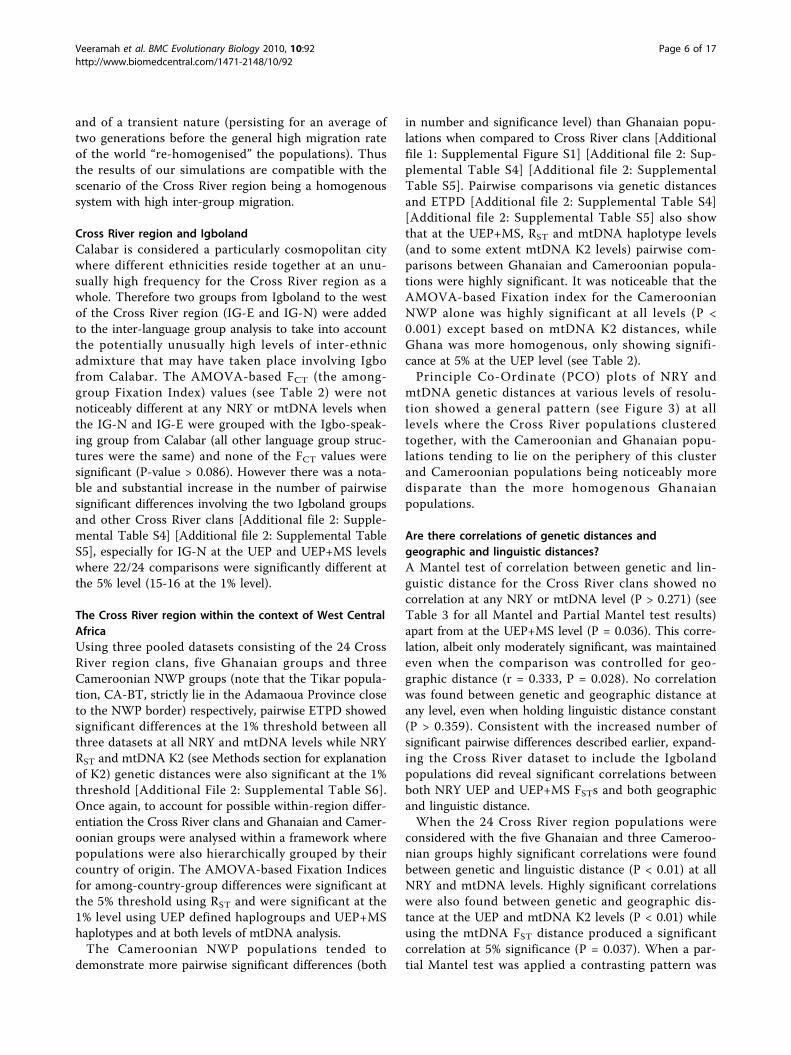
mtDNA genetic distances at various levels of resolu-tion showed a general pattern (see Figure 3) at alllevels where the Cross River populations clusteredtogether, with the Cameroonian and Ghanaian popu-lations tending to lie on the periphery of this clusterand Cameroonian populations being noticeably moredisparate than the more homogenous Ghanaianpopulations.
Are there correlations of genetic distances andgeographic and linguistic distances?A Mantel test of correlation between genetic and lin-guistic distance for the Cross River clans showed nocorrelation at any NRY or mtDNA level (P > 0.271) (seeTable 3 for all Mantel and Partial Mantel test results)apart from at the UEP+MS level (P = 0.036). This corre-lation, albeit only moderately significant, was maintainedeven when the comparison was controlled for geo-graphic distance (r = 0.333, P = 0.028). No correlationwas found between genetic and geographic distance atany level, even when holding linguistic distance constant(P > 0.359). Consistent with the increased number ofsignificant pairwise differences described earlier, expand-ing the Cross River dataset to include the Igbolandpopulations did reveal significant correlations betweenboth NRY UEP and UEP+MS FSTs and both geographicand linguistic distance.When the 24 Cross River region populations were
considered with the five Ghanaian and three Cameroo-nian groups highly significant correlations were foundbetween genetic and linguistic distance (P < 0.01) at allNRY and mtDNA levels. Highly significant correlationswere also found between genetic and geographic dis-tance at the UEP and mtDNA K2 levels (P < 0.01) whileusing the mtDNA FST distance produced a significantcorrelation at 5% significance (P = 0.037). When a par-tial Mantel test was applied a contrasting pattern was
Veeramah et al. BMC Evolutionary Biology 2010, 10:92http://www.biomedcentral.com/1471-2148/10/92
Page 6 of 17
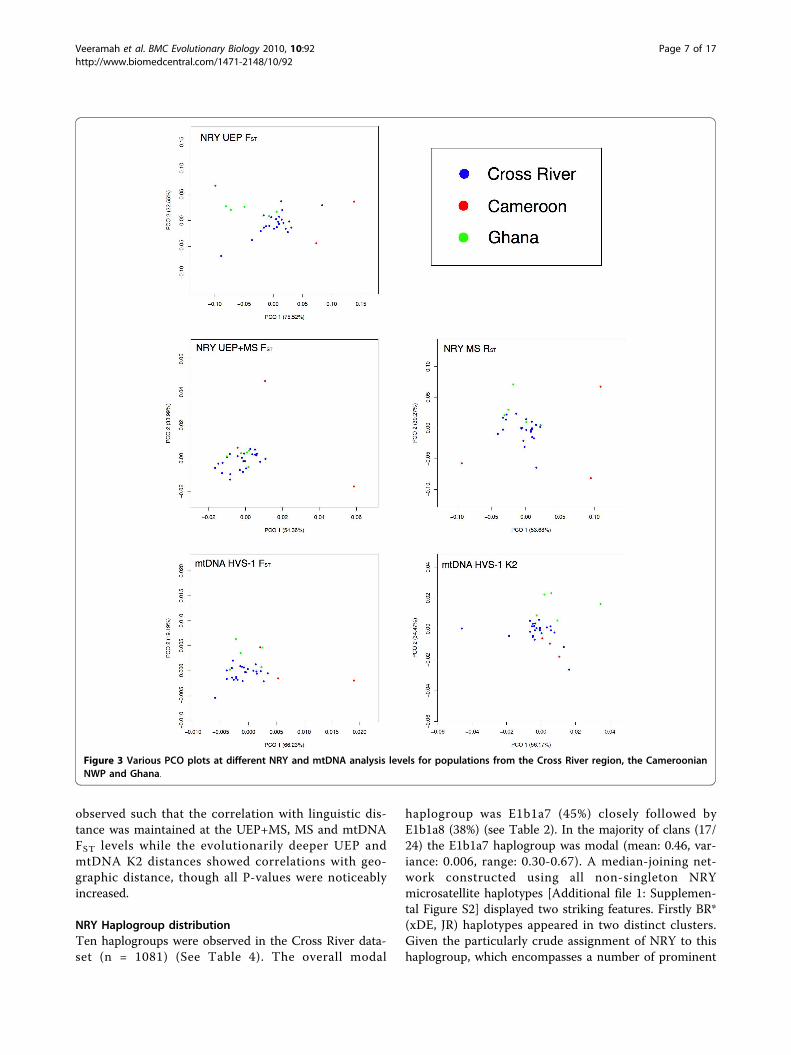
observed such that the correlation with linguistic dis-tance was maintained at the UEP+MS, MS and mtDNAFST levels while the evolutionarily deeper UEP andmtDNA K2 distances showed correlations with geo-graphic distance, though all P-values were noticeablyincreased.
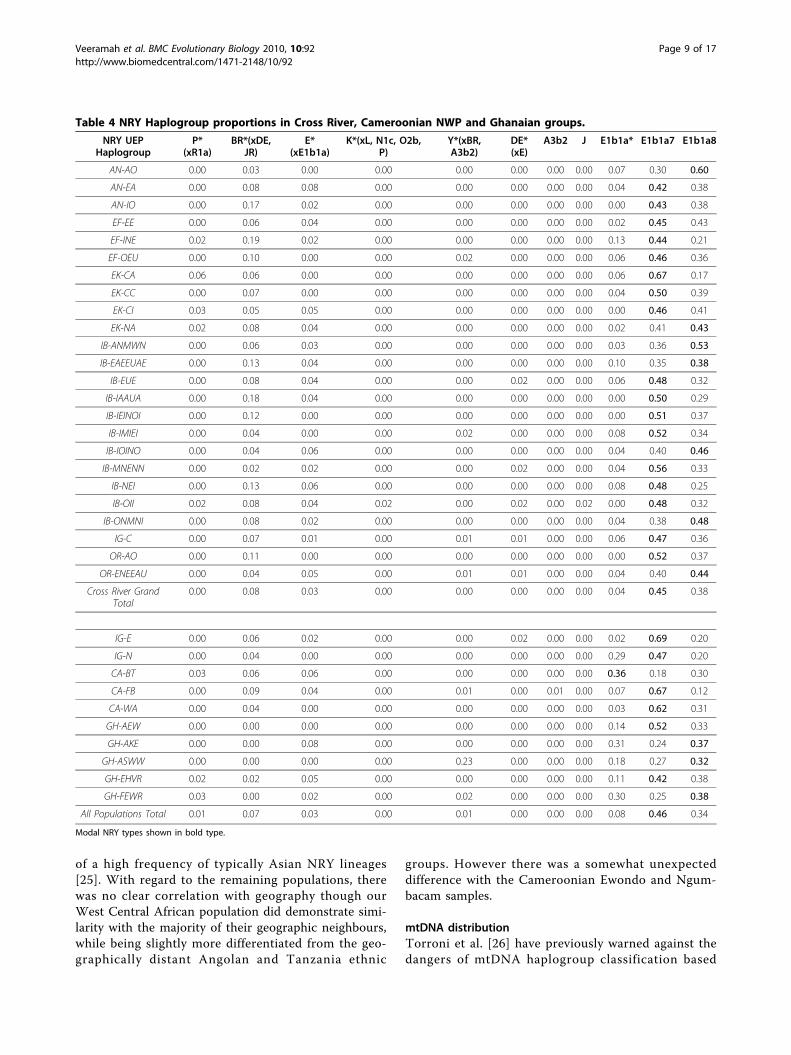
NRY Haplogroup distributionTen haplogroups were observed in the Cross River data-set (n = 1081) (See Table 4). The overall modal
haplogroup was E1b1a7 (45%) closely followed byE1b1a8 (38%) (see Table 2). In the majority of clans (17/24) the E1b1a7 haplogroup was modal (mean: 0.46, var-iance: 0.006, range: 0.30-0.67). A median-joining net-work constructed using all non-singleton NRYmicrosatellite haplotypes [Additional file 1: Supplemen-tal Figure S2] displayed two striking features. Firstly BR*(xDE, JR) haplotypes appeared in two distinct clusters.Given the particularly crude assignment of NRY to thishaplogroup, which encompasses a number of prominent
Figure 3 Various PCO plots at different NRY and mtDNA analysis levels for populations from the Cross River region, the CameroonianNWP and Ghana.
Veeramah et al. BMC Evolutionary Biology 2010, 10:92http://www.biomedcentral.com/1471-2148/10/92
Page 7 of 17
subclades, it is likely that at least one of these representthe sub-Saharan African-specific Haplogroup B, whilethe other cluster may contain a typically non-sub-Saharan African haplogroup (for example HaplogroupsF, G and I have been found at low frequencies amongsttypically African ethnic groups in the DemocraticRepublic of São Tomé and Príncipe [20], presumablybecause of European (especially Portuguese) introgres-sion during the Slave trade.Secondly the presence of E1b1a*, E1b1a7 and E1b1a8
haplogroups dominated the network but with substantialhaplotype sharing among all three clades, consistentwith a relatively recent common genealogical origin atthe E1b1a root. One haplotype (15-12-21-10-11-13),which has previously been identified as a possible signa-ture type for the expansion of the Bantu-speaking peo-ples [21-23] (though it is actually present at appreciablefrequencies in other Niger-Congo speaking peoples asfar west as Guinea-Bissau [22]), stands out as the mostfrequent and is predominantly found within E1b1a8.Examining each haplogroup separately [Additional file 1:Supplemental Figure S3] shows that E1b1a8 haplotypesare tightly clustered around this haplotype in a star-likemanner while E1b1a7 is more diffusely spread with mul-tiple high frequency haplotypes implying a longer
evolutionary period since this haplogroup arose. This isreflected in the substantially lower Average Squared Dis-tance (ASD) values for E1b1a8 compared to E1b1a7[Additional file 2: Supplemental Table S7] (though,depending on the growth model used, the confidenceintervals for the two haplogroups did overlap), whichcan be interpreted as younger Time to the Most RecentCommon Ancestor (TMRCA) estimates [24] [Additionalfile 2: Supplemental Table S8]. E1b1a* (which was foundat a slightly higher frequency in Ghana) is very diffusewith regard to microsatellite haplotypes, which suggeststhat further UEP delineation may be informative.We compared our West Central African data for 5 of
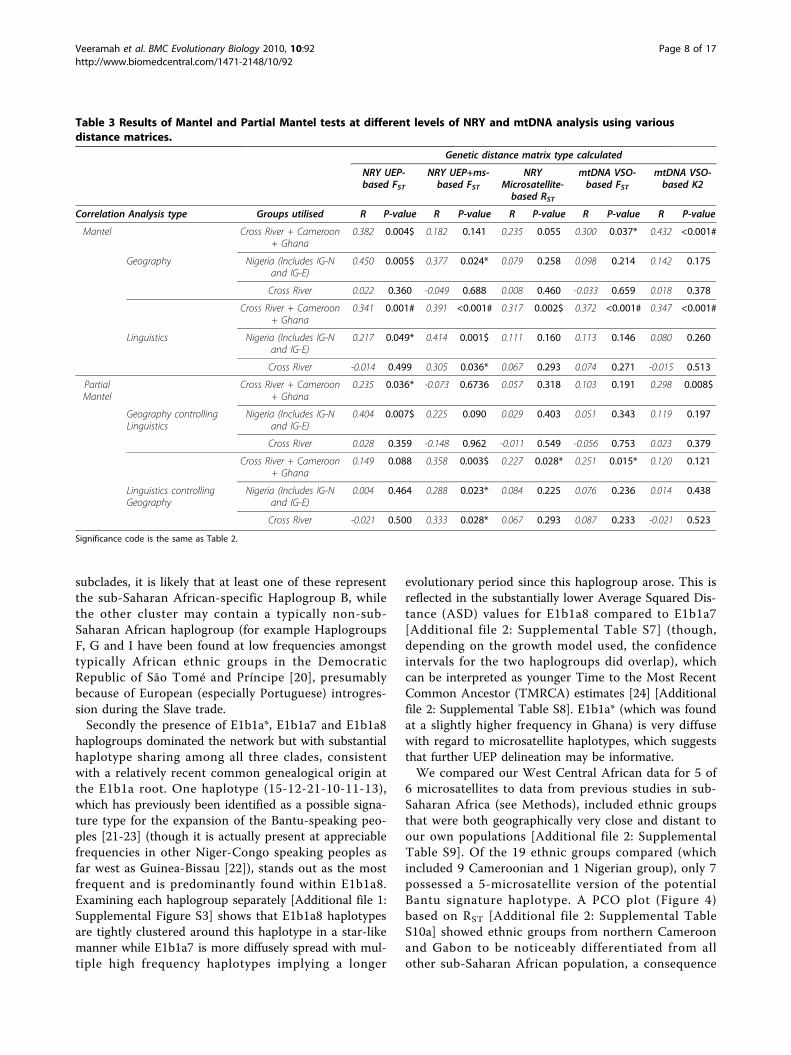
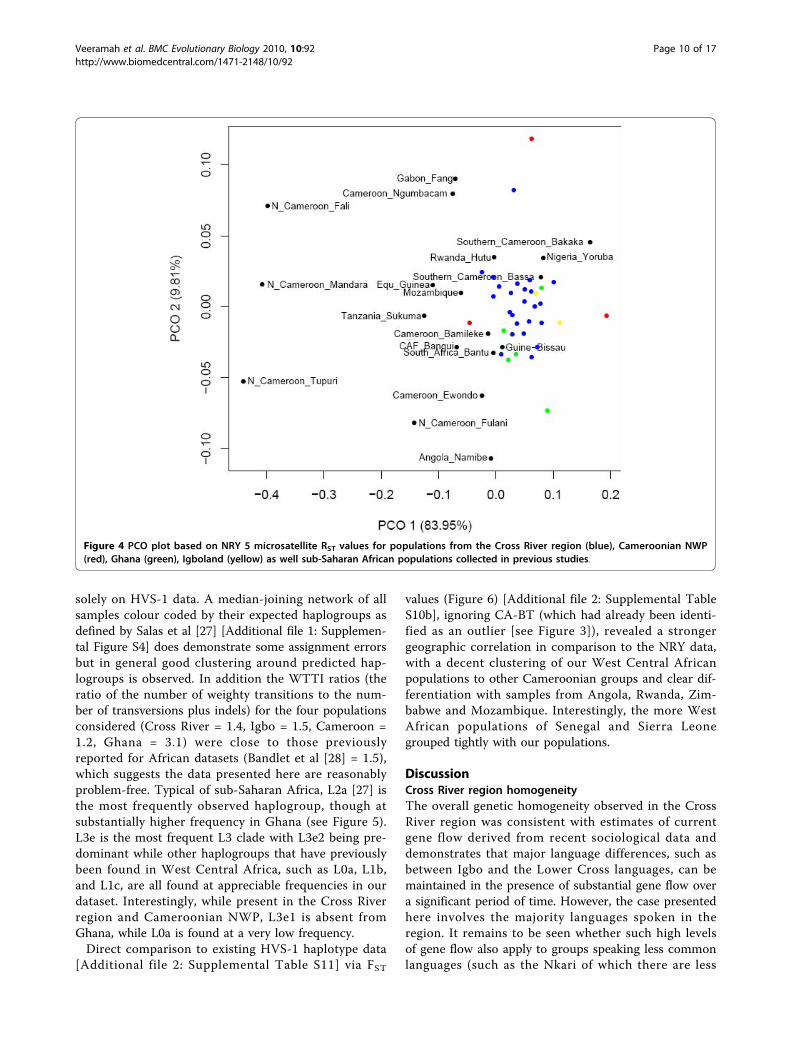
6 microsatellites to data from previous studies in sub-Saharan Africa (see Methods), included ethnic groupsthat were both geographically very close and distant toour own populations [Additional file 2: SupplementalTable S9]. Of the 19 ethnic groups compared (whichincluded 9 Cameroonian and 1 Nigerian group), only 7possessed a 5-microsatellite version of the potentialBantu signature haplotype. A PCO plot (Figure 4)based on RST [Additional file 2: Supplemental TableS10a] showed ethnic groups from northern Cameroonand Gabon to be noticeably differentiated from allother sub-Saharan African population, a consequence
Table 3 Results of Mantel and Partial Mantel tests at different levels of NRY and mtDNA analysis using variousdistance matrices.
Genetic distance matrix type calculated
NRY UEP-based FST
NRY UEP+ms-based FST
NRYMicrosatellite-based RST
mtDNA VSO-based FST
mtDNA VSO-based K2
Correlation Analysis type Groups utilised R P-value R P-value R P-value R P-value R P-value
Mantel Cross River + Cameroon+ Ghana
0.382 0.004$ 0.182 0.141 0.235 0.055 0.300 0.037* 0.432 <0.001#
Geography Nigeria (Includes IG-Nand IG-E)
0.450 0.005$ 0.377 0.024* 0.079 0.258 0.098 0.214 0.142 0.175
Cross River 0.022 0.360 -0.049 0.688 0.008 0.460 -0.033 0.659 0.018 0.378
Cross River + Cameroon+ Ghana
0.341 0.001# 0.391 <0.001# 0.317 0.002$ 0.372 <0.001# 0.347 <0.001#
Linguistics Nigeria (Includes IG-Nand IG-E)
0.217 0.049* 0.414 0.001$ 0.111 0.160 0.113 0.146 0.080 0.260
Cross River -0.014 0.499 0.305 0.036* 0.067 0.293 0.074 0.271 -0.015 0.513
PartialMantel
Cross River + Cameroon+ Ghana
0.235 0.036* -0.073 0.6736 0.057 0.318 0.103 0.191 0.298 0.008$
Geography controllingLinguistics
Nigeria (Includes IG-Nand IG-E)
0.404 0.007$ 0.225 0.090 0.029 0.403 0.051 0.343 0.119 0.197
Cross River 0.028 0.359 -0.148 0.962 -0.011 0.549 -0.056 0.753 0.023 0.379
Cross River + Cameroon+ Ghana
0.149 0.088 0.358 0.003$ 0.227 0.028* 0.251 0.015* 0.120 0.121
Linguistics controllingGeography
Nigeria (Includes IG-Nand IG-E)
0.004 0.464 0.288 0.023* 0.084 0.225 0.076 0.236 0.014 0.438
Cross River -0.021 0.500 0.333 0.028* 0.067 0.293 0.087 0.233 -0.021 0.523
Significance code is the same as Table 2.
Veeramah et al. BMC Evolutionary Biology 2010, 10:92http://www.biomedcentral.com/1471-2148/10/92
Page 8 of 17
of a high frequency of typically Asian NRY lineages[25]. With regard to the remaining populations, therewas no clear correlation with geography though ourWest Central African population did demonstrate simi-larity with the majority of their geographic neighbours,while being slightly more differentiated from the geo-graphically distant Angolan and Tanzania ethnic
groups. However there was a somewhat unexpecteddifference with the Cameroonian Ewondo and Ngum-bacam samples.
mtDNA distributionTorroni et al. [26] have previously warned against thedangers of mtDNA haplogroup classification based
Table 4 NRY Haplogroup proportions in Cross River, Cameroonian NWP and Ghanaian groups.
NRY UEPHaplogroup
P*(xR1a)
BR*(xDE,JR)
E*(xE1b1a)
K*(xL, N1c, O2b,P)
Y*(xBR,A3b2)
DE*(xE)
A3b2 J E1b1a* E1b1a7 E1b1a8
AN-AO 0.00 0.03 0.00 0.00 0.00 0.00 0.00 0.00 0.07 0.30 0.60
AN-EA 0.00 0.08 0.08 0.00 0.00 0.00 0.00 0.00 0.04 0.42 0.38
AN-IO 0.00 0.17 0.02 0.00 0.00 0.00 0.00 0.00 0.00 0.43 0.38
EF-EE 0.00 0.06 0.04 0.00 0.00 0.00 0.00 0.00 0.02 0.45 0.43
EF-INE 0.02 0.19 0.02 0.00 0.00 0.00 0.00 0.00 0.13 0.44 0.21
EF-OEU 0.00 0.10 0.00 0.00 0.02 0.00 0.00 0.00 0.06 0.46 0.36
EK-CA 0.06 0.06 0.00 0.00 0.00 0.00 0.00 0.00 0.06 0.67 0.17
EK-CC 0.00 0.07 0.00 0.00 0.00 0.00 0.00 0.00 0.04 0.50 0.39
EK-CI 0.03 0.05 0.05 0.00 0.00 0.00 0.00 0.00 0.00 0.46 0.41
EK-NA 0.02 0.08 0.04 0.00 0.00 0.00 0.00 0.00 0.02 0.41 0.43
IB-ANMWN 0.00 0.06 0.03 0.00 0.00 0.00 0.00 0.00 0.03 0.36 0.53
IB-EAEEUAE 0.00 0.13 0.04 0.00 0.00 0.00 0.00 0.00 0.10 0.35 0.38
IB-EUE 0.00 0.08 0.04 0.00 0.00 0.02 0.00 0.00 0.06 0.48 0.32
IB-IAAUA 0.00 0.18 0.04 0.00 0.00 0.00 0.00 0.00 0.00 0.50 0.29
IB-IEINOI 0.00 0.12 0.00 0.00 0.00 0.00 0.00 0.00 0.00 0.51 0.37
IB-IMIEI 0.00 0.04 0.00 0.00 0.02 0.00 0.00 0.00 0.08 0.52 0.34
IB-IOINO 0.00 0.04 0.06 0.00 0.00 0.00 0.00 0.00 0.04 0.40 0.46
IB-MNENN 0.00 0.02 0.02 0.00 0.00 0.02 0.00 0.00 0.04 0.56 0.33
IB-NEI 0.00 0.13 0.06 0.00 0.00 0.00 0.00 0.00 0.08 0.48 0.25
IB-OII 0.02 0.08 0.04 0.02 0.00 0.02 0.00 0.02 0.00 0.48 0.32
IB-ONMNI 0.00 0.08 0.02 0.00 0.00 0.00 0.00 0.00 0.04 0.38 0.48
IG-C 0.00 0.07 0.01 0.00 0.01 0.01 0.00 0.00 0.06 0.47 0.36
OR-AO 0.00 0.11 0.00 0.00 0.00 0.00 0.00 0.00 0.00 0.52 0.37
OR-ENEEAU 0.00 0.04 0.05 0.00 0.01 0.01 0.00 0.00 0.04 0.40 0.44
Cross River GrandTotal
0.00 0.08 0.03 0.00 0.00 0.00 0.00 0.00 0.04 0.45 0.38
IG-E 0.00 0.06 0.02 0.00 0.00 0.02 0.00 0.00 0.02 0.69 0.20
IG-N 0.00 0.04 0.00 0.00 0.00 0.00 0.00 0.00 0.29 0.47 0.20
CA-BT 0.03 0.06 0.06 0.00 0.00 0.00 0.00 0.00 0.36 0.18 0.30
CA-FB 0.00 0.09 0.04 0.00 0.01 0.00 0.01 0.00 0.07 0.67 0.12
CA-WA 0.00 0.04 0.00 0.00 0.00 0.00 0.00 0.00 0.03 0.62 0.31
GH-AEW 0.00 0.00 0.00 0.00 0.00 0.00 0.00 0.00 0.14 0.52 0.33
GH-AKE 0.00 0.00 0.08 0.00 0.00 0.00 0.00 0.00 0.31 0.24 0.37
GH-ASWW 0.00 0.00 0.00 0.00 0.23 0.00 0.00 0.00 0.18 0.27 0.32
GH-EHVR 0.02 0.02 0.05 0.00 0.00 0.00 0.00 0.00 0.11 0.42 0.38
GH-FEWR 0.03 0.00 0.02 0.00 0.02 0.00 0.00 0.00 0.30 0.25 0.38
All Populations Total 0.01 0.07 0.03 0.00 0.01 0.00 0.00 0.00 0.08 0.46 0.34
Modal NRY types shown in bold type.
Veeramah et al. BMC Evolutionary Biology 2010, 10:92http://www.biomedcentral.com/1471-2148/10/92
Page 9 of 17
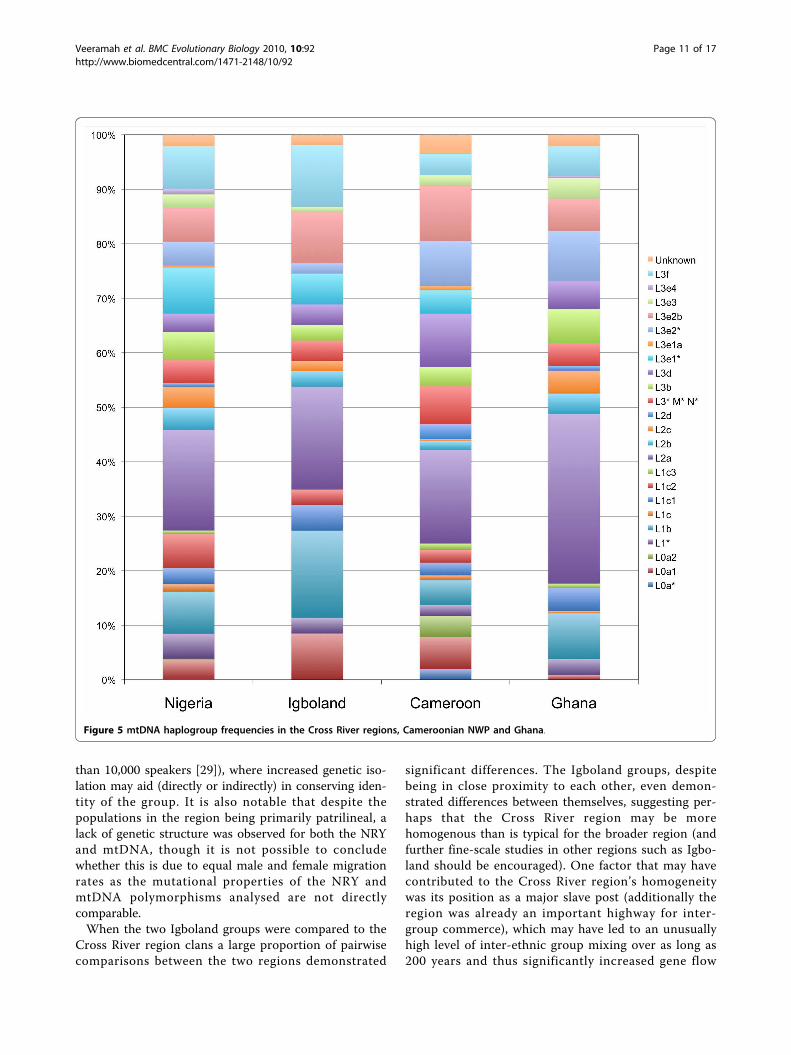
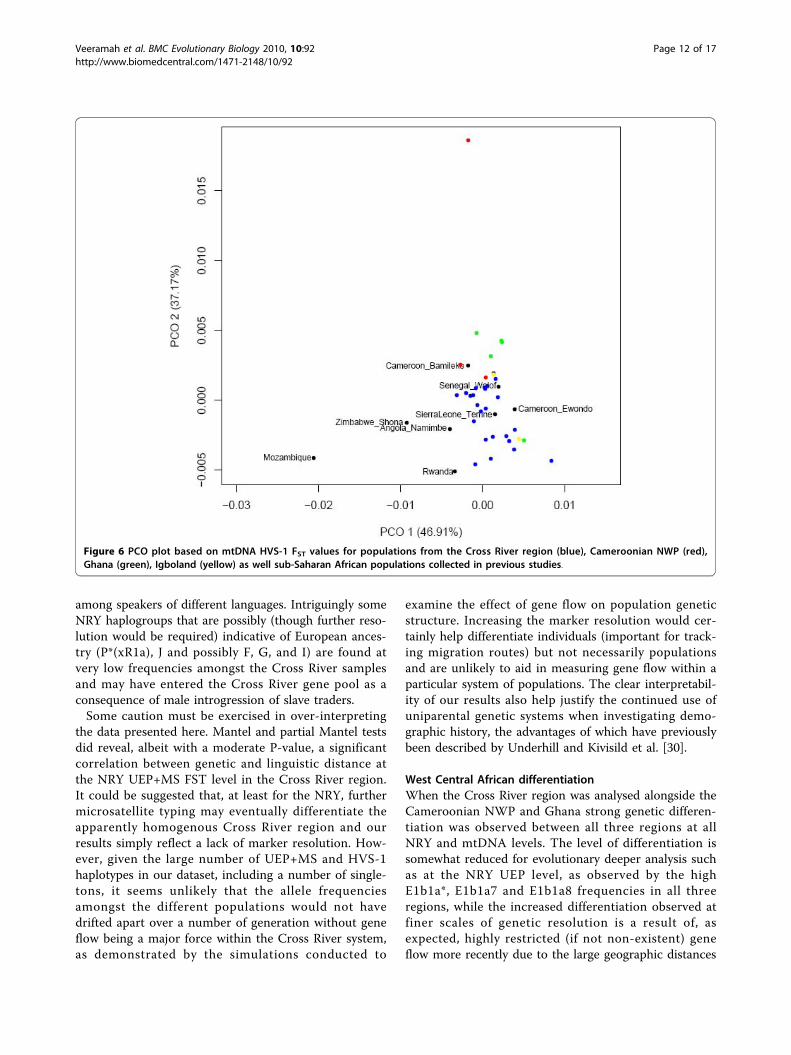
solely on HVS-1 data. A median-joining network of allsamples colour coded by their expected haplogroups asdefined by Salas et al [27] [Additional file 1: Supplemen-tal Figure S4] does demonstrate some assignment errorsbut in general good clustering around predicted hap-logroups is observed. In addition the WTTI ratios (theratio of the number of weighty transitions to the num-ber of transversions plus indels) for the four populationsconsidered (Cross River = 1.4, Igbo = 1.5, Cameroon =1.2, Ghana = 3.1) were close to those previouslyreported for African datasets (Bandlet et al [28] = 1.5),which suggests the data presented here are reasonablyproblem-free. Typical of sub-Saharan Africa, L2a [27] isthe most frequently observed haplogroup, though atsubstantially higher frequency in Ghana (see Figure 5).L3e is the most frequent L3 clade with L3e2 being pre-dominant while other haplogroups that have previouslybeen found in West Central Africa, such as L0a, L1b,and L1c, are all found at appreciable frequencies in ourdataset. Interestingly, while present in the Cross Riverregion and Cameroonian NWP, L3e1 is absent fromGhana, while L0a is found at a very low frequency.Direct comparison to existing HVS-1 haplotype data
[Additional file 2: Supplemental Table S11] via FST
values (Figure 6) [Additional file 2: Supplemental TableS10b], ignoring CA-BT (which had already been identi-fied as an outlier [see Figure 3]), revealed a strongergeographic correlation in comparison to the NRY data,with a decent clustering of our West Central Africanpopulations to other Cameroonian groups and clear dif-ferentiation with samples from Angola, Rwanda, Zim-babwe and Mozambique. Interestingly, the more WestAfrican populations of Senegal and Sierra Leonegrouped tightly with our populations.
DiscussionCross River region homogeneityThe overall genetic homogeneity observed in the CrossRiver region was consistent with estimates of currentgene flow derived from recent sociological data anddemonstrates that major language differences, such asbetween Igbo and the Lower Cross languages, can bemaintained in the presence of substantial gene flow overa significant period of time. However, the case presentedhere involves the majority languages spoken in theregion. It remains to be seen whether such high levelsof gene flow also apply to groups speaking less commonlanguages (such as the Nkari of which there are less
Figure 4 PCO plot based on NRY 5 microsatellite RST values for populations from the Cross River region (blue), Cameroonian NWP(red), Ghana (green), Igboland (yellow) as well sub-Saharan African populations collected in previous studies.
Veeramah et al. BMC Evolutionary Biology 2010, 10:92http://www.biomedcentral.com/1471-2148/10/92
Page 10 of 17
than 10,000 speakers [29]), where increased genetic iso-lation may aid (directly or indirectly) in conserving iden-tity of the group. It is also notable that despite thepopulations in the region being primarily patrilineal, alack of genetic structure was observed for both the NRYand mtDNA, though it is not possible to concludewhether this is due to equal male and female migrationrates as the mutational properties of the NRY andmtDNA polymorphisms analysed are not directlycomparable.When the two Igboland groups were compared to the
Cross River region clans a large proportion of pairwisecomparisons between the two regions demonstrated
significant differences. The Igboland groups, despitebeing in close proximity to each other, even demon-strated differences between themselves, suggesting per-haps that the Cross River region may be morehomogenous than is typical for the broader region (andfurther fine-scale studies in other regions such as Igbo-land should be encouraged). One factor that may havecontributed to the Cross River region’s homogeneitywas its position as a major slave post (additionally theregion was already an important highway for inter-group commerce), which may have led to an unusuallyhigh level of inter-ethnic group mixing over as long as200 years and thus significantly increased gene flow
Figure 5 mtDNA haplogroup frequencies in the Cross River regions, Cameroonian NWP and Ghana.
Veeramah et al. BMC Evolutionary Biology 2010, 10:92http://www.biomedcentral.com/1471-2148/10/92
Page 11 of 17
among speakers of different languages. Intriguingly someNRY haplogroups that are possibly (though further reso-lution would be required) indicative of European ances-try (P*(xR1a), J and possibly F, G, and I) are found atvery low frequencies amongst the Cross River samplesand may have entered the Cross River gene pool as aconsequence of male introgression of slave traders.Some caution must be exercised in over-interpreting
the data presented here. Mantel and partial Mantel testsdid reveal, albeit with a moderate P-value, a significantcorrelation between genetic and linguistic distance atthe NRY UEP+MS FST level in the Cross River region.It could be suggested that, at least for the NRY, furthermicrosatellite typing may eventually differentiate theapparently homogenous Cross River region and ourresults simply reflect a lack of marker resolution. How-ever, given the large number of UEP+MS and HVS-1haplotypes in our dataset, including a number of single-tons, it seems unlikely that the allele frequenciesamongst the different populations would not havedrifted apart over a number of generation without geneflow being a major force within the Cross River system,as demonstrated by the simulations conducted to
examine the effect of gene flow on population geneticstructure. Increasing the marker resolution would cer-tainly help differentiate individuals (important for track-ing migration routes) but not necessarily populationsand are unlikely to aid in measuring gene flow within aparticular system of populations. The clear interpretabil-ity of our results also help justify the continued use ofuniparental genetic systems when investigating demo-graphic history, the advantages of which have previouslybeen described by Underhill and Kivisild et al. [30].
West Central African differentiationWhen the Cross River region was analysed alongside theCameroonian NWP and Ghana strong genetic differen-tiation was observed between all three regions at allNRY and mtDNA levels. The level of differentiation issomewhat reduced for evolutionary deeper analysis suchas at the NRY UEP level, as observed by the highE1b1a*, E1b1a7 and E1b1a8 frequencies in all threeregions, while the increased differentiation observed atfiner scales of genetic resolution is a result of, asexpected, highly restricted (if not non-existent) geneflow more recently due to the large geographic distances
Figure 6 PCO plot based on mtDNA HVS-1 FST values for populations from the Cross River region (blue), Cameroonian NWP (red),Ghana (green), Igboland (yellow) as well sub-Saharan African populations collected in previous studies.
Veeramah et al. BMC Evolutionary Biology 2010, 10:92http://www.biomedcentral.com/1471-2148/10/92
Page 12 of 17
involved. However it is also appears that a simple isola-tion by distance model is not adequate to fit the patternobserved.Despite being geographically much closer, the Camer-
oonian NWP populations are noticeably more differen-tiated from the Cross River region than Ghanaianpopulations, as seen clearly seen in the PCO plots (Fig-ure 3), with the Cameroonian NWP populations demon-strating the greatest differentiation both between eachother and non-Cameroonian populations at the NRYUEP+MS FST and mtDNA FST levels. Linguistically thedistance between the Cross River region and both theCameroonian NWP and Ghana (at least for the particu-lar languages considered in this study) is much less pro-nounced than the corresponding geographic distances.As a consequence Mantel and partial Mantel tests showa stronger correlation between genetic and linguistic dis-tance at finer genetic resolutions. However, the mean-ingfulness of these correlations is somewhatquestionable, given that while the broad relationships ofthe languages considered here are generally accepted,the lexicostatistics that the actual distances between lan-guages are based on are at best a first estimate withnumerous potentially problematic approximations[Additional file 1: Supplemental Section 3]. While bothare clearly involved (and likely confounding) at somelevel, not until more reliable language distance estimatesare generated can the relative contributions of geogra-phy and language to genetic divergence amongst theseWest Central African populations be assessed.The substantial amount of genetic differentiation
within the Cameroonian NWP may be driven by theextreme topography of the region, which is a largelyhighland area with many valleys, hills and mountains(Mount Oku is located in the NWP and is the secondhighest mountain in West Central Africa) and thus pre-sents significant physical barriers to gene flow betweenneighbouring populations. As the rate of linguisticseparation may well also be increased by such physicalbarriers it is possible that at smaller geographical scaleswhere the topography is particularly varied, languagewill be a better guide to genetic differentiation than geo-graphy alone, though the desire to maintain a separateidentity within close quarters is also likely to majorforce for shaping genetic heterogeneity.
E1b1a8 and the expansion of Bantu-speaking peoplesThough not the primary focus of the study, the typingof the U175 marker [31] permits important new insightsinto the demographic processes influencing haplogroupE1b1a. While none of the populations studied here areNarrow Bantu speakers, the star-like network of E1b1a8,especially in comparison to E1b1a7, coupled with arecent TMRCA based on the level of haplogroup
specific microsatellite diversity of 1866-2355 years[Additional file 2: Supplemental Table S8] (though theauthors recognise that TMRCAs do not necessarily cor-relate with demographic events) hint at men with NRYthat belong to this subclade playing a prominent role inthe expansion of the Bantu-speaking peoples. This pos-sibility is further reinforced by the haplotype that hasbeen observed at high frequencies amongst Bantu-speaking populations, including South Africa (the puta-tive Bantu signature haplotype [21]) being observedalmost exclusively within E1b1a8 in our dataset. Thusfurther typing of U175 in other Bantu-speaking popula-tions along both streams of the proposed expansionmay yield important clues to the movement of Bantu-speaking farmers.Our Cross River and Cameroonian NWP datasets are
located adjacent to the proposed source of proto-Bantuand their similarity for the NRY to other populationsboth neighbouring and more distant demonstrates thepotential impact of the expansion of Bantu famers inhomogenising the NRY profile of sub-Saharan Africa.For example, the South African Bantu speakers arebarely more differentiated from our West Central Afri-can dataset than the Bamileke. This pattern is in con-trast to that seen for mtDNA, where our West CentralAfrican populations are more easily differentiated fromthe more geographically distant southern African popu-lations, consistent with previous data [19] that suggestsa more gradual and short range movement of femalelineages than men during this migration period. Hap-logroups L0a, L1c, L2a, L3e and L1e have all been asso-ciated with the expansion of Bantu-speaking farmers[19] (the origin of L2a has actually been proposed to befrom the Cameroonian Plateau) and their substantialpresence in our Cross River and Cameroonian NWPdatasets, and in some circumstances absence from themore westerly Ghanaian dataset (such as L3e1, which isvery common in southeastern Africa), certainly addweight to these claims.
ConclusionIn this study we have been able to elucidate that lan-guages and peoples can move independent of each otherwithin the Cross River region of Nigeria, a finding thatwill be of considerable interest to linguists working onaspects of language contact. A major reason we havebeen able to gain insight at such a fine geographic scaleis the quality of the dataset assembled. There has, unfor-tunately, been a tendency when examining Africangenetic diversity to utilise datasets of small size withsamples of undeclared origin and relationships. Thepractice of assembling dense DNA sample sets ofknown and detailed provenance, as previously called forby anthropologists and linguists [32], will be the most
Veeramah et al. BMC Evolutionary Biology 2010, 10:92http://www.biomedcentral.com/1471-2148/10/92
Page 13 of 17
vital aspect when conducting studies to answer themany complex questions likely to be encountered in thecourse of unravelling demographic histories of geogra-phically restricted African ethnicities.
MethodsSample collection procedureBuccal swabs were collected from males over eighteenyears old unrelated at the paternal grandfather levelfrom locations in South East Nigeria as shown in Table 1.All buccal swabs were collected anonymously withinformed consent. Ethical approval was obtained fromUniversity College Hospitals and University College Lon-don Joint Committee on the Ethics of Human Research(reference number 99/0196). Sociological data were alsocollected from each individual including age, currentresidence, birthplace, self-declared cultural identity, firstlanguage, second language and (when available) clanaffiliation (Clan identities were verified with informationpresented in Cross River and Akwa Ibom State Popula-tion Bulletin 1982-90 [33]) for the individual as well assimilar information on the individual’s father, mother,paternal grandfather and maternal grandmother. Thesamples were classified into groups primarily by first lan-guage spoken, then by place of collection and thirdly,when available, by clan or some other subsidiary criter-ion. Where collections from a particular group weremade in more than one location (for example the EdieneAbak were collected from two neighbouring villages:Afaha Esang and Ikot Ubom) and co-ordinate data areavailable for both sites, locations are represented byaverages.Buccal swabs and similar sociological data as described
above were also collected from males eighteen years orolder unrelated at the paternal grandfather level fromthe following groups:CA-BT: Tikar speakers from Bankim Cameroon (n =
34), CA-FB: Bamoun speakers from Foumban Cameroon(n = 117), CA-WA: Aghem speakers from Wum Camer-oon (n = 118), GH-AEW: Twi speakers from EnchiGhana (n = 21), GH-AKE: Twi speakers from KibiGhana (n = 51), GH-ASWW: Twi speakers from SefwiWiawso Ghana (n = 22), GH-EHVR: Ewe speakers fromHo Ghana (n = 88), GH-FEWR: Fante speakers fromEnchi (n = 61).Standard phenol-chloroform DNA extractions were
performed on all samples.
Assembly of comparison NRY and mtDNA datasetsNRY data for 5 microsatellites (DYS19, DYS390,DYS391, DYS392, DYS393) was assembled from pre-vious studies conducted on sub-Saharan African popula-tions for comparison to data generated in this study.The populations considered were Namibe from Angola
[34]; Bangui from the Central African Republic [35];Ngumbacam [36], Bamileke[37] and Ewondo [37] fromCameroon; Fali [38], Fulani [38], Mandara [38] andTupuri [38] from Northern Cameroon; Bakaka [38] andBassa [38] from Southern Cameroon; individuals fromEquatorial Guinea [39]; Fang from Gabon [36]; indivi-duals from Guinea’ Bissau [40]; individuals fromMozambique [22]; Yoruba from Nigeria [41]; Hutu fromRwanda [37]; Bantu speaker from South Africa [21]; andSukuma from Tanzania [41].HVS-1 VSO haplotype data from positions 16030 to
16360 was also assembled from previous studies fromthe following populations: Namimbe from Angola [34];Bamileke [42] and Ewondo [42] from Cameroon, indivi-duals from Mozambique [43]; Hutu from Rwanda [44];Wolof from Senegal [45]; Temne from Sierra Leone[46]; and Shona from Zimbabwe [44].
Y-chromosome typingThe NRY of all South East Nigerian samples as well asall Cameroonian and Ghanaian samples were typed inthe following manner: standard TCGA kits were used tocharacterise six microsatellites (DYS19, DYS388,DYS390, DYS391, DYS392, DYS393) and eleven biallelicUnique Event Polymorphism (UEP) markers (92R7, M9,M13, M17, M20, SRY+465, SRY4064, SRY10831, sY81,Tat, YAP), as described by Thomas et al. [47]. Microsa-tellite repeat sizes were assigned according to thenomenclature of Kayser et al. [48]. Where necessary theadditional markers M191 and U175, were typed using atetra primer ARMS PCR method [49]. Each PCRinvolved four oligonucleotide primers and resulted inthe amplification of a full fragment (control band) andone allele specific fragment (see supplementary materialsfor further details [Additional file 2: Supplemental TableS12]). P12f2 was typed as described by Rosser et al. [11].NRY Haplogroups were defined by the 14 UEP markersaccording to the nomenclature proposed by Karafet etal. [50] [Additional file 1: Supplemental Figure S5]. Mar-kers typed were chosen to reflect that as well as charac-terising NRY types of recent African origin we wouldalso be likely to characterise a minority of NRY types ofrecent European origin due to possible introgressionfrom North Atlantic slave traders.
mtDNA typingThe mtDNA (Hypervariable Segment 1) HVS-1 regionof all South East Nigerian samples as well as allCameroonian and Ghanaian samples was sequencedas described by Veeramah et al. [51]. HVS-1 VariableSite Only (VSO) haplotypes were determined for allsamples from South East Nigeria by comparingsequence data covering nucleotides 16020-16400 withthe Cambridge Reference Sequence [52,53].
Veeramah et al. BMC Evolutionary Biology 2010, 10:92http://www.biomedcentral.com/1471-2148/10/92
Page 14 of 17
Haplotypes were defined by base changes and nucleo-tide positions where substitutions, insertions or dele-tions occurred. Tentative mtDNA Africa-specifichaplogroup classification was based on the scheme ofSalas et al. [27]. HVS-1 VSO haplotypes were alsodetermined for all samples from Cameroon andGhana with sequence data covering nucleotides16023-16380. South East Nigerian HVS-1 coveragewas reduced to this range for comparisons includingthese groups.
Statistical and population genetic analysisGenetic differences between pairs of populations whenindividuals in populations were characterised by a) NRYUEP haplogroups, b) combined NRY UEP haplogroupand six microsatellite haplotypes (UEP+MS) or c)mtDNA HVS-1 VSO haplotypes were assessed using anExact Test of Pairwise Population Differentiation(ETPD) with 10,000 Markov steps [54,55].Population Genetic Structure was estimated using
Hierarchical Analysis of Molecular Variance (AMOVA)[56] based on a particular mutation model to generate asingle Fixation Index statistic, FST, when a simple struc-ture of populations within a single group was defined, orthree Fixation Indices, FST (the within-population Fixa-tion Index), FSC (the among-populations within-groupFixation Index) and FCT (the among-group FixationIndex), when a more complex structure of populationswithin multiple groups was defined. Significances of Fixa-tion Indices are assessed by randomly permuting indivi-duals (given that only haploid systems are considered)among populations or groups of populations, dependingon the Fixation Index being tested and after every roundof permutations, of which 10,000 were performed, Fixa-tion Indices are recalculated to create a null distribution.Population pairwise genetic distances were estimated
from Analysis of Molecular Variance �ST values [56].The genetic distances used were a) FST [57] (whenindividuals in populations were described by UEP hap-logroups, UEP+MS haplotypes and mtDNA HVS-1VSO haplotypes), b) RST [58] (when NRY were charac-terised by the six microsatellites) and c) the Kimura-2parameter model (which allows different transition andtransversion rates) with gamma distribution of value0.47 (K2) [59] (when mtDNA was characterised byHVS-1 sequences with gaps removed). Significance ofgenetic distances was assessed by permutation of indi-viduals as described above for testing significance ofFixation Indices. All the above was performed usingArlequin software [60].Principal Coordinates Analysis (PCO) [61] was per-
formed using the ‘R’ statistical package http://www.R-pro-ject.org by implementing the ‘cmdscale’ function found inthe ‘mva’ package on pairwise FST (or equivalent) matrices.
TMRCA estimates based on the level haplogroup speci-fic microsatellite diversity and associated confidenceintervals (CIs) were estimated using YTIME software [62]http://www.ucl.ac.uk/tcga/software/index.html. An inter-generation time of 25 years was applied to convert fromgenerations to years. A mutation rate of 0.002 [63] wasutilized under a single-stepwise mutation model andunder a length-dependent mutation model the constantsa and b in the equation μ = a + bL were represented by-0.004758677 and 4.46E-04 respectively (YTIME userguide http://www.ucl.ac.uk/tcga/software/index.html).The most frequent haplotype in the corresponding hap-logroup was utilized as the ancestral haplotypes (there-fore this method does not take into account error in thechoice of ancestral haplotypes in the genealogy).Mantel and Partial Mantel tests [64] were performed
between genetic distance and both geographic and lin-guistic distance using the ‘R’ package ‘Vegan’, whichuses the Pearson product-moment method. Significancewas assessed by permuting the rows and columns of thematrices 1,000 times.Geographic distances were Great Circle distances esti-
mated from latitude and longitude data. Linguistic dis-tances were constructed as described in thesupplementary materials [Additional file 1: SupplementalSection 3], drawing from lexicostatistics reported in the lit-erature and incomplete data matrix prediction algorithms.Median Joining Networks were constructed for NRY
data as described by Helgason et al. [65] and formtDNA data as described by Vilar et al. [66].NRY and mtDNA simulations were performed as
described in the supplementary materials [Additionalfile 1: Supplemental Section 2], the results of whichcould be compared to empirical data in order to guideour understanding of the effect migration rate andsample size on genetic structure in the Cross Riverregion. These simulations are at best crude approxima-tions of the true Cross River region system that do notexplore the full likely parameter space and thus arenot formally statistically assessed in comparison to ourobserved data.
Additional file 1: Supplemental Sections and Figures. A documentfile containing Supplemental Sections 1-3 and Supplemental Figures S1-S12.
Additional file 2: Supplemental Tables. A spreadsheet file containingSupplemental Tables S1-S14.
AcknowledgementsThe authors thank the Biotechnology and Biological Sciences ResearchCouncil, the Andrew Mellon Foundation, the Centre for Society andGenetics, UCLA, Dr John Novembre, the DNA and History Faculty Seminarmembers, Emma Connell, who organised the sample collection, andProfessor Mark Jobling for his invaluable comments on the manuscript.
Veeramah et al. BMC Evolutionary Biology 2010, 10:92http://www.biomedcentral.com/1471-2148/10/92
Page 15 of 17
Author details1Centre for Society and Genetics, University of California, Los Angeles, RolfeHall, Los Angeles, CA 90095-722, USA. 2Novembre Laboratory, Department ofEcology and Evolutionary Biology, University of California, Los Angeles, 621Charles E. Young Dr South, Los Angeles, CA 90095-1606, USA. 3Centre forResearch on Language Contact, Glendon College, York University, Toronto,Ontario M4N 3N6, Canada. 4The Centre for Genetic Anthropology, UniversityCollege London, Research Department of Genetics, Evolution andEnvironment, University College London, Gower Street, London WC1E 6BT,UK. 5Molecular and Culture Evolution Laboratory, Research Department ofGenetics, Evolution and Environment, University College London, GowerStreet, London WC1E 6BT, UK. 6Department of Anthropology, University ofKent, Canterbury CT2 7NR, UK. 7Department of Applied Mathematics andStatistics, Stony Brook University, Stony Brook, NY 11794, USA. 8Departmentof Medical and Molecular Genetics, King’s College London, Guy’s Tower,Guy’s Hospital, London SE1 9RT, UK. 9AHRC Centre for the Evolution ofCultural Diversity, Institute of Archaeology, University College London,London, WC1E 6BT, UK. 10Deptartment of Evolutionary Biology, EvolutionaryBiology Centre, Uppsala, University, Norbyvagen 18D, SE-752 36 Uppsala,Sweden.
Authors’ contributionsKRV drafted the manuscript, participated in conceiving and the design ofthe study and performed the majority of analysis. BC provided the linguisticand historical background and participated in conceiving and the design ofthe study. NAP performed the M191 and U175 NRY typing. AP wrote thePython code for the NRY and mtDNA simulations. CP performed theNetwork analysis. DZ participated in conceiving and the design of the study.NM aided in the statistical analysis. MW participated in conceiving and thedesign of the study and aided in the statistical analysis. NB participated inconceiving and the design of the study and helped draft the manuscript.MG participated in conceiving and the design of the study and helped draftthe manuscript. All authors read and approved the final manuscript.
Received: 6 August 2009 Accepted: 31 March 2010Published: 31 March 2010
References1. Blench R: Archaeology, Language, and the African Past Lanham: AltaMira
Press 2006.2. Greenberg JH: Studies in African Linguistic Classification Branford: Compass
1955.3. Vansina J: Paths in the Rainforests: Toward a History of Political Tradition in
Equatorial Africa The University of Wisconsin Press 1990.4. Williamson K, Blench R: Niger-Congo. Cambridge: Cambridge University
Press 2000, 11-42.5. Connell B: The Lower Cross languages: a prolegomena to the
classification of the Cross River languages. Journal of West AfricanLanguages 1994, XXIV:3-46.
6. Connell B, Maison KB: A Cameroun homeland for the Lower Crosslanguages? Sprache und Geschichte in Afrika 1994, 15:47-90.
7. Ardener E: Documentary and linguistic evidence for the rise of thetrading polities between Rio del Rey and Cameroons. History and SocialAnthropology LondonLewis IM 1968, 1500-1650.
8. Latham AJH: Old Calabar. The impact of the international economy upon atraditional society Oxford: Clarendon Press 1973, 1600-1891.
9. Boyd R: Chamba Daka and Bantoid: A further look at Chamba Dakaclassification. Journal of West African Languages 1996, 26:29-43.
10. Connell B: The Integrity of Mambiloid. Proceedings from the 2nd WorldCongress of African Linguistics Cologne: pplyBrkRulesRüdiger KöppeVerlagWolff HE, Gensler O Leipzig 2000, 197-213.
11. Rosser ZH, Zerjal T, Hurles ME, Adojaan M, Alavantic D, Amorim A, Amos W,Armenteros M, Arroyo E, Barbujani G, et al: Y-chromosomal diversity inEurope is clinal and influenced primarily by geography, rather than bylanguage. Am J Hum Genet 2000, 67:1526-1543.
12. Zegura SL, Karafet TM, Zhivotovsky LA, Hammer MF: High-resolution SNPsand microsatellite haplotypes point to a single, recent entry of NativeAmerican Y chromosomes into the Americas. Mol Biol Evol 2004,21:164-175.
13. Hurles ME, Nicholson J, Bosch E, Renfrew C, Sykes BC, Jobling MA: Ychromosomal evidence for the origins of oceanic-speaking peoples.Genetics 2002, 160:289-303.
14. Wood ET, Stover DA, Ehret C, Destro-Bisol G, Spedini G, McLeod H, Louie L,Bamshad M, Strassmann BI, Soodyall H, et al: Contrasting patterns of Ychromosome and mtDNA variation in Africa: evidence for sex-biaseddemographic processes. Eur J Hum Genet 2005, 13:867-876.
15. Karafet TM, Osipova LP, Gubina MA, Posukh OL, Zegura SL, Hammer MF:High levels of Y-chromosome differentiation among native Siberianpopulations and the genetic signature of a boreal hunter-gatherer wayof life. Hum Biol 2002, 74:761-789.
16. Lansing JS, Cox MP, Downey SS, Gabler BM, Hallmark B, Karafet TM,Norquest P, Schoenfelder JW, Sudoyo H, Watkins JC, et al: Coevolution oflanguages and genes on the island of Sumba, eastern Indonesia. ProcNatl Acad Sci USA 2007, 104:16022-16026.
17. Hartl DL, Clarke AG: Principles of Population Genetics Sinauer Assosiates 1997.18. Tishkoff SA, Reed FA, Friedlaender FR, Ehret C, Ranciaro A, Froment A,
Hirbo JB, Awomoyi AA, Bodo JM, Doumbo O, et al: The genetic structureand history of Africans and African Americans. Science 2009,324:1035-1044.
19. Salas A, Richards M, De la FT, Lareu MV, Sobrino B, Sanchez-Diz P,Macaulay V, Carracedo A: The making of the African mtDNA landscape.Am J Hum Genet 2002, 71:1082-1111.
20. Goncalves R, Spinola H, Brehm A: Y-chromosome lineages in Sao Tome ePrincipe islands: evidence of European influence. Am J Hum Biol 2007,19:422-428.
21. Thomas MG, Parfitt T, Weiss DA, Skorecki K, Wilson JF, le Roux M,Bradman N, Goldstein DB: Y chromosomes traveling south: the cohenmodal haplotype and the origins of the Lemba–the “Black Jews ofSouthern Africa”. Am J Hum Genet 2000, 66:674-686.
22. Pereira L, Gusmao L, Alves C, Amorim A, Prata MJ: Bantu and EuropeanY-lineages in Sub-Saharan Africa. Ann Hum Genet 2002, 66:369-378.
23. Berniell-Lee G, Bosch E, Bertranpetit J, Comas D: Y-chromosome diversityin Bantu and Pygmy populations from Central Africa. InternationalCongress Series 2006, 1288:234-236.
24. Thomas MG, Skorecki K, Ben Ami H, Parfitt T, Bradman N, Goldstein DB:Origins of Old Testament priests. Nature 1998, 394:138-140.
25. Cruciani F, Santolamazza P, Shen P, Macaulay V, Moral P, Olckers A,Modiano D, Holmes S, Destro-Bisol G, Coia V, et al: A back migration fromAsia to sub-Saharan Africa is supported by high-resolution analysis ofhuman Y-chromosome haplotypes. Am J Hum Genet 2002, 70:1197-1214.
26. Torroni A, Richards M, Macaulay V, Forster P, Villems R, Norby S,Savontaus ML, Huoponen K, Scozzari R, Bandelt HJ: mtDNA haplogroupsand frequency patterns in Europe. Am J Hum Genet 2000, 66:1173-1177.
27. Salas A, Richards M, Lareu MV, Scozzari R, Coppa A, Torroni A, Macaulay V,Carracedo A: The African diaspora: mitochondrial DNA and the Atlanticslave trade. Am J Hum Genet 2004, 74:454-465.
28. Bandelt HJ, Quintana-Murci L, Salas A, Macaulay V: The fingerprint ofphantom mutations in mitochondrial DNA data. Am J Hum Genet 2002,71:1150-1160.
29. Lewis MP: Ethnologue: Languages of the World Dallas, Texas: SIL International2009.
30. Underhill PA, Kivisild T: Use of y chromosome and mitochondrial DNApopulation structure in tracing human migrations. Annu Rev Genet 2007,41:539-564.
31. Sims LM, Garvey D, Ballantyne J: Sub-populations within the majorEuropean and African derived haplogroups R1b3 and E3a aredifferentiated by previously phylogenetically undefined Y-SNPs. HumMutat 2007, 28:97.
32. MacEachern S: Genes, tribes, and African history. Current Anthropology2000, 41:357-384.
33. Cross River and Akwa Ibom State Population Bulletin (1982-90) Calabar 1987.34. Coelho M, Sequeira F, Luiselli D, Beleza S, Rocha J: On the edge of Bantu
expansions: mtDNA, Y chromosome and lactase persistence geneticvariation in southwestern Angola. BMC Evol Biol 2009, 9:80.
35. Lecerf M, Filali M, Gresenguet G, Ndjoyi-Mbiguino A, Le Goff J, deMazancourt P, Belec L: Allele frequencies and haplotypes of eight Y-shorttandem repeats in Bantu population living in Central Africa. Forensic SciInt 2007, 171:212-215.
Veeramah et al. BMC Evolutionary Biology 2010, 10:92http://www.biomedcentral.com/1471-2148/10/92
Page 16 of 17
36. Berniell-Lee G, Calafell F, Bosch E, Heyer E, Sica L, Mouguiama-Daouda P,van der Veen V, Hombert JM, Quintana-Murci L, Comas D: Genetic anddemographic implications of the Bantu expansion: insights from humanpaternal lineages. Mol Biol Evol 2009, 26:1581-1589.
37. Caglia A, Tofanelli S, Coia V, Boschi I, Pescarmona M, Spedini G, Pascali V,Paoli G, Destro-Bisol G: A study of Y-chromosome microsatellite variationin sub-Saharan Africa: a comparison between F(ST) and R(ST) geneticdistances. Hum Biol 2003, 75:313-330.
38. Coia V, Brisighelli F, Donati F, Pascali V, Boschi I, Luiselli D, Battaggia C,Batini C, Taglioli L, Cruciani F, et al: A multi-perspective view of geneticvariation in Cameroon. Am J Phys Anthropol 2009, 140:454-464.
39. Arroyo-Pardo E, Gusmao L, Lopez-Parra AM, Baeza C, Mesa MS, Amorim A:Genetic variability of 16 Y-chromosome STRs in a sample fromEquatorial Guinea (Central Africa). Forensic Sci Int 2005, 149:109-113.
40. Rosa A, Ornelas C, Brehm A, Villems R: Population data on 11 Y-chromosome STRs from Guine-Bissau. Forensic Sci Int 2006, 157:210-217.
41. Tishkoff SA, Gonder MK, Henn BM, Mortensen H, Knight A, Gignoux C,Fernandopulle N, Lema G, Nyambo TB, Ramakrishnan U, et al: History ofclick-speaking populations of Africa inferred from mtDNA and Ychromosome genetic variation. Mol Biol Evol 2007, 24:2180-2195.
42. Destro-Bisol G, Coia V, Boschi I, Verginelli F, Caglia A, Pascali V, Spedini G,Calafell F: The analysis of variation of mtDNA hypervariable region 1suggests that Eastern and Western Pygmies diverged before the Bantuexpansion. Am Nat 2004, 163:212-226.
43. Pereira L, Macaulay V, Torroni A, Scozzari R, Prata MJ, Amorim A: Prehistoricand historic traces in the mtDNA of Mozambique: insights into theBantu expansions and the slave trade. Ann Hum Genet 2001, 65:439-458.
44. Castri L, Tofanelli S, Garagnani P, Bini C, Fosella X, Pelotti S, Paoli G,Pettener D, Luiselli D: mtDNA variability in two Bantu-speakingpopulations (Shona and Hutu) from Eastern Africa: implications forpeopling and migration patterns in sub-Saharan Africa. Am J PhysAnthropol 2009, 140:302-311.
45. Rando JC, Pinto F, Gonzalez AM, Hernandez M, Larruga JM, Cabrera VM,Bandelt HJ: Mitochondrial DNA analysis of northwest African populationsreveals genetic exchanges with European, near-eastern, and sub-Saharan populations. Ann Hum Genet 1998, 62(Pt 6):531-550.
46. Jackson BA, Wilson JL, Kirbah S, Sidney SS, Rosenberger J, Bassie L, Alie JA,McLean DC, Garvey WT, Ely B: Mitochondrial DNA genetic diversityamong four ethnic groups in Sierra Leone. Am J Phys Anthropol 2005,128:156-163.
47. Thomas MG, Bradman N, Flinn HM: High throughput analysis of10 microsatellite and 11 diallelic polymorphisms on the humanY-chromosome. Hum Genet 1999, 105:577-581.
48. Kayser M, Caglia A, Corach D, Fretwell N, Gehrig C, Graziosi G, Heidorn F,Herrmann S, Herzog B, Hidding M, et al: Evaluation of Y-chromosomalSTRs: a multicenter study. Int J Legal Med 1997, 110:125-129.
49. Ye S, Dhillon S, Ke X, Collins AR, Day IN: An efficient procedure forgenotyping single nucleotide polymorphisms. Nucleic Acids Res 2001, 29:E88.
50. Karafet TM, Mendez FL, Meilerman MB, Underhill PA, Zegura SL,Hammer MF: New binary polymorphisms reshape and increaseresolution of the human Y chromosomal haplogroup tree. Genome Res2008, 18:830-838.
51. Veeramah KR, Zeitlyn D, Fanso VG, Mendell NR, Connell BA, Weale ME,Bradman N, Thomas MG: Sex-Specific Genetic Data Support One of TwoAlternative Versions of the Foundation of the Ruling Dynasty of the Nso’in Cameroon. Curr Anthropol 2008, 49:707-714.
52. Anderson S, Bankier AT, Barrell BG, de Bruijn MH, Coulson AR, Drouin J,Eperon IC, Nierlich DP, Roe BA, Sanger F, et al: Sequence and organizationof the human mitochondrial genome. Nature 1981, 290:457-465.
53. Andrews RM, Kubacka I, Chinnery PF, Lightowlers RN, Turnbull DM,Howell N: Reanalysis and revision of the Cambridge reference sequencefor human mitochondrial DNA. Nat Genet 1999, 23:147.
54. Raymond M, Rousset F: An Exact Test for Population Differentiation.Evolution 1995, 49:1280-1283.
55. Goudet J, Raymond M, de Meeus T, Rousset F: Testing differentiation indiploid populations. Genetics 1996, 144:1933-1940.
56. Excoffier L, Smouse PE, Quattro JM: Analysis of molecular varianceinferred from metric distances among DNA haplotypes: application tohuman mitochondrial DNA restriction data. Genetics 1992, 131:479-491.
57. Reynolds J, Weir BS, Cockerham CC: Estimation Of The CoancestryCoefficient: Basis For A Short-Term Genetic Distance. Genetics 1983,105:767-779.
58. Slatkin M: A measure of population subdivision based on microsatelliteallele frequencies. Genetics 1995, 139:457-462.
59. Kimura M: A simple method for estimating evolutionary rates of basesubstitutions through comparative studies of nucleotide sequences. JMol Evol 1980, 16:111-120.
60. Schneider S, Roessli D, Excoffier L: Arlequin: A software for populationgenetics data analysis. (Ver 2.000). Genetics and Biometry Lab, Dept. ofAnthropology, University of Geneva 2000.
61. Gower JC: Some distance properties of latent root and vector methodsused in multivariate analysis. Biometrika 1966, 53:325-328.
62. Behar DM, Thomas MG, Skorecki K, Hammer MF, Bulygina E, Rosengarten D,Jones AL, Held K, Moses V, Goldstein D, et al: Multiple origins of AshkenaziLevites: Y chromosome evidence for both Near Eastern and Europeanancestries. Am J Hum Genet 2003, 73:768-779.
63. King TE, Parkin EJ, Swinfield G, Cruciani F, Scozzari R, Rosa A, Lim SK, Xue Y,Tyler-Smith C, Jobling MA: Africans in Yorkshire? The deepest-rootingclade of the Y phylogeny within an English genealogy. Eur J Hum Genet2007, 15:288-293.
64. Sokal RR, Rohlf FJ: Biometry New York: W. H. Freeman and Co 1994.65. Helgason A, Sigureth aS, Nicholson J, Sykes B, Hill EW, Bradley DG,
Bosnes V, Gulcher JR, Ward R, Stefansson K: Estimating Scandinavian andGaelic ancestry in the male settlers of Iceland. Am J Hum Genet 2000,67:697-717.
66. Vilar MG, Kaneko A, Hombhanje FW, Tsukahara T, Hwaihwanje I, Lum JK:Reconstructing the origin of the Lapita Cultural Complex: mtDNAanalyses of East Sepik Province, PNG. J Hum Genet 2008, 53:698-708.
doi:10.1186/1471-2148-10-92Cite this article as: Veeramah et al.: Little genetic differentiation asassessed by uniparental markers in the presence of substantiallanguage variation in peoples of the Cross River region of Nigeria. BMCEvolutionary Biology 2010 10:92.
Submit your next manuscript to BioMed Centraland take full advantage of:
• Convenient online submission
• Thorough peer review
• No space constraints or color figure charges
• Immediate publication on acceptance
• Inclusion in PubMed, CAS, Scopus and Google Scholar
• Research which is freely available for redistribution
Submit your manuscript at www.biomedcentral.com/submit
Veeramah et al. BMC Evolutionary Biology 2010, 10:92http://www.biomedcentral.com/1471-2148/10/92
Page 17 of 17