liu.tiffany.winegrapes
TRANSCRIPT

May 1, 2023 1
Projection of Vitis vinifera production and climate change in the Columbia Basin Valley in the 21st centuryTIFFANY LIUClimate Physics Educational DevelopmentRichland, WA

May 1, 2023 2
This summer
Young Women in ScienceUnder Yun Qian and Hailong Wang in the Climate Physics Educational Development group
Climate change and its effects show detrimental effects to wine grape production, the economy, job stability, and familiesWashington state wine production has a national $14.9 billion economic impact [1]
Accounts for nearly 30,000 full-time jobs
20% of all grapes produced in 2013 were Cabernet Sauvignon.
http://img1.sunset.timeinc.net/sites/default/files/image/2007/09/sunplants-grapes-l.jpg
[1] Stonebridge Research Group, 2012, The Economic Impact of Washington State Wine and Grapes, Stonebridge Research Group, St. Helena, California, 8 p.

May 1, 2023 3
An outline
2 major factors focused on for growing Vitis vinifera (wine grapes)
Temperature and precipitation
Visual data showing the representative concentration pathways
RCP 4.5 (Carbon Price) is the scenario in which total radiative forcing is stabilized right after 2100 [2]
RCP 8.5 (Business as Usual) is when greenhouse gas emissions steadily increases without change [2]
Importance locally, nationally, and globallyTri-Cities, United States, global economy
Washington produced 40,500 tons of chardonnay grapes in 2013.
http://www.winelegacy.com/Images/ItemDescription/20090422/forestville-chardonnay.jpg
[2] Wayne, G. P., 2013, The Beginner’s Guide to Representative Concentration Pathways, Skeptical Science, 14 p.

May 1, 2023 4
Radiative forcing [3]CO 2 concentration [2]
Additional factors in wine grape growth
[2]Wayne, G. P., 2013, The Beginner’s Guide to Representative Concentration Pathways, Skeptical Science, 14 p.
[3] Meinshausen, M. et al., The RCP greenhouse gas concentrations and their extensions from 1765 to 2300, 2010, Climatic Change, 18 p.
May 1, 2023 5
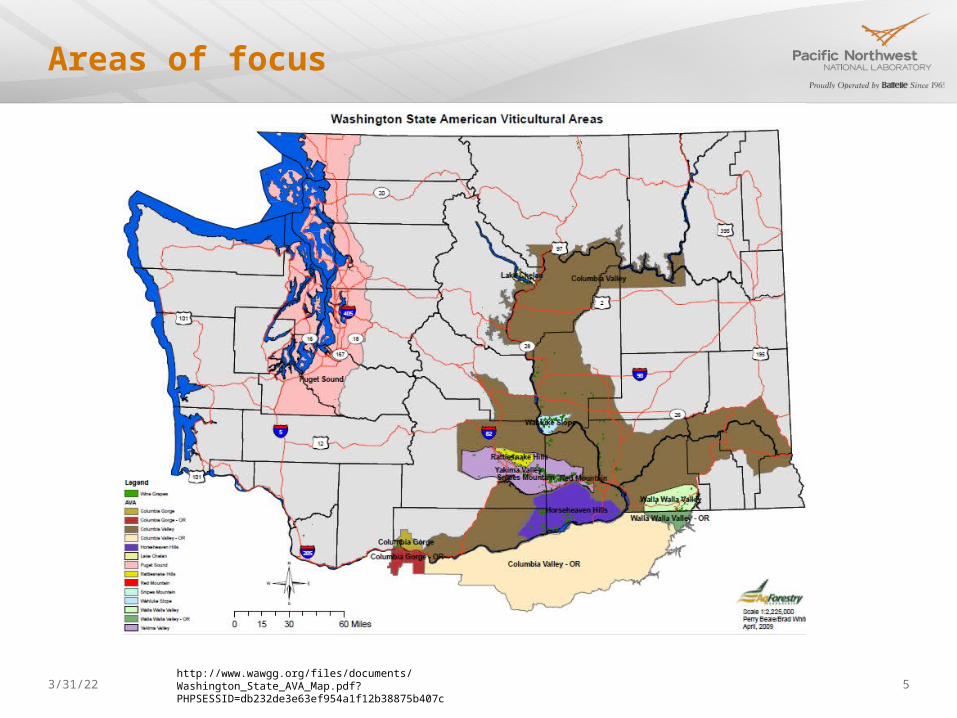
Areas of focus
http://www.wawgg.org/files/documents/Washington_State_AVA_Map.pdf?PHPSESSID=db232de3e63ef954a1f12b38875b407c

May 1, 2023 6
Methodology and data
Using the Community Climate System Model (CCSM), we obtained temp. and precip. data from 9 grid cellsThrough literature, we found the total volume of wine grape production in WA in 2010 as a baseline and then projected data until 2100
1 2 3 45 6 7
8 9

May 1, 2023 7
Statistical yield model (Lobdell et al., 2006)
Y represents yield anomaly (ton acre-1). Subscript numbers indicate month of climate variable, with negative values denoting a month from the year prior to harvest. Tn, minimum temperature (°C); P, precipitation (mm)Average aggregated average data computed from 382 individual meteorological stations throughout the state of California from 1980-2003 [4]

May 1, 2023 8
Precipitation projections
0
0.5
1
1.5
2
2.5
3
3.5
4
4.5June Monthly-mean Daily Precipitation
RCP 4.5RCP 8.5
Year
Prec
ipita
tion
(mm
)
2010 2020 2030 2040 2050 2060 2070 2080 2090 2100
0
0.5
1
1.5
2
2.5
3Previous September Monthly-mean Daily Precipitation
RCP 4.5RCP 8.5
Year
Prec
ipita
tion
(mm
)
2010 2020 2030 2040 2050 2060 2070 2080 2090 2100

May 1, 2023 9
RCP 4.5 and 8.5 scenarios
0
1
2
3
4
5
6
7
8 April Mean Daily Minimum Temperature
RCP 4.5
RCP 8.5
Year
Tem
pera
ture
(°C)
2010 2020 2030 2040 2050 2060 2070 2080 2090 2100
20102013
20162019
20222025
20282031
20342037
20402043
20462049
20522055
20582061
20642067
20702073
20762079
20822085
20882091
20942097
2100-70
-60
-50
-40
-30
-20
-10
0
10 Statistical Yield Anomaly
RCP 4.5
RCP 8.5
Year
Perc
ent a
nom
aly
(%)

May 1, 2023 10
Carbon Price vs. Business as Usual
20102013
20162019
20222025
20282031
20342037
20402043
20462049
20522055
20582061
20642067
20702073
20762079
20822085
20882091
20942097
210060000
80000
100000
120000
140000
160000
180000 Total Washington Yield
RCP 4.5
RCP 8.5
Year
Volu
me
(ton
s)

May 1, 2023 11
Carbon Price vs. Business as Usual
Due to the colder and drier climate of Eastern Washington, the model does not show that human activity will affect the yield of WA wine grapes. RCP 4.5 and 8.5 show little difference. However, the statistical yield model that was designed specifically for California does show the conclusion that if human activity proceeds as usual, the production of grape production will substantially decrease, compared to if we begin implementing ways to decrease anthropogenic climate change.
20102013
20162019
20222025
20282031
20342037
20402043
20462049
20522055
20582061
20642067
20702073
20762079
20822085
20882091
20942097
2100-16
-14
-12
-10
-8
-6
-4
-2
0 California Statistical Anomaly
RCP 4.5RCP 8.5
Year
Perc
ent a
nom
aly
(%)

May 1, 2023 12
Recommendations
LocallyMinimize uncertaintiesIrrigation adaptationsProvide training and guidance to workers for a more sustainable and green environment
NationallyImplement specific adaptation regulations to each region Derive a more encompassing model with all major factors in order to provide more accurate projections for specific regions
GloballyEducate everyone about the state of our earth and how we are responsible
Merlot is usually harvested late in order to gain physiological ripeness and fuller flavor.
http://www.frenchscout.com/grapes/merlot-on-black.jpg

May 1, 2023 13
Acknowledgements
Special thanks to:Young Women in Science Program
Ying LiuCarolyn CramerLavon ConlinEmily Davis
Hailong WangYun Qian

May 1, 2023 14
References
1. Stonebridge Research Group, 2012, The Economic Impact of Washington State Wine and Grapes, Stonebridge Research Group, St. Helena, California, 8 p.
2. Wayne, G. P., 2013, The Beginner’s Guide to Representative Concentration Pathways, Skeptical Science, 14 p, 16 p.
3. Meinshausen, M. et al., The RCP greenhouse gas concentrations and their extensions from 1765 to 2300, 2010, Climatic Change, 18 p.
4. Lobdell, D. et al., 2006, Impacts of future climate change on California perennial crop yields: Model projections with climate and crop uncertainties, Science Direct, Stanford, California, 210 p.