live cell imaging of apoptosis and necrosis - biotek.com cell imaging of...individual cell. 2...
TRANSCRIPT
Live Cell Imaging of Apoptosis and Necrosis
A p p l i c a t i o n N o t e
Live Cell Imaging
BioTek Instruments, Inc.P.O. Box 998, Highland Park, Winooski, Vermont 05404-0998 USAPhone: 888-451-5171 Outside the USA: 802-655-4740 Email: [email protected] www.biotek.comCopyright © 2018
Sarah Beckman, Ph.D., Principal Scientist, Applications Department, BioTek Instruments, Inc., Winooski, VT USA
Key Words:
Live Cell Imaging
Apoptosis
Necrosis
Introduction Cell death is a vital component of multiple biological processes including normal cell turnover and proper development. Cell death demonstrates a complimentary but opposite role to proliferation in the homeostatic regulation of cellular populations. Inappropriate cell death (either too much or not enough) is a factor in many diseases such as ischemic damage, cancer, and neurodegeneration.1 Thus, the ability to modulate the life or death of a cell is of immense therapeutic potential.
Two classic pathways of cell death are apoptosis and necrosis. Apoptosis is an active, programmed process of autonomous cellular demise that avoids eliciting an immune response. On the other hand, necrosis is an uncontrolled, passive process which results in the release of inflammatory cytoplasmic content into the surrounding tissue. Critical to each unique cell death pathway is the way in which the resultant cellular debris is cleared. Apoptotic cells display a variety of recognition signals for phagocytes that lead to their expedient removal. The uptake of apoptotic bodies suppresses secretion of inflammatory mediators from activated macrophages. Conversely, the cellular content released from necrotic cells includes molecules that act as signals to promote the inflammatory response.2
Despite their differences, apoptosis and necrosis are not mutually exclusive processes. Multiple types of cell death can occur concurrently in cells exposed to the same stimuli. The local intensity, as well as the activation or differentiation state of a particular cell, helps to determine the cell
death pathway which is undertaken by each individual cell.2 Furthermore, the degree of stimuli can determine whether cells die of apoptosis or necrosis. At low doses, a variety of damaging stimuli such as heat, radiation, hypoxia and cytotoxic anticancer drugs can induce apoptosis, but the same stimuli induce necrosis at higher doses.2
Quantification of the cell death response is an integral component of exploring cell biology, responses to cellular stress, and performing high-throughput drug screens. Classic methods of cell death detection include flow cytometry, which requires extensive handling of cells and only provides end point data. Kinetic imaging, in contrast, is a critical application for studying dynamic biological processes in real time. Kinetic analysis of cell death allows for sensitive, real-time determination of the accumulation of both apoptotic and necrotic events within the cellular population.
Here we present the use of apoptosis and necrosis fluorescent probes in combination with automated kinetic imaging to quantitatively assess the effects of known inducers of cell death in multiple cell lines. We use label free high contrast brightfield imaging to assess the total number of cells and fluorescent probes to quantify concurrently early stage apoptosis at the level of plasma membrane inversion exposing phosphatidyl serine and plasma membrane rupture associated with necrosis. This allows for determination of percent apoptosis and necrosis in each cell population over 48 hours of drug treatment.
Abstract
Cell death occurs throughout the life of an organism, and this is critical for developmental plasticity and organismal health, in part by eliminating unneeded and unhealthy cells in a timely and effective manner. However, dysfunctional cell death leads to diseases such as cancer, neurodegeneration, and ischemic damage. In this study, we investigate apoptosis and necrosis in real time over a 48 hour time period using high contrast brightfield imaging in combination with fluorescent probes for apoptotic and necrotic cell death markers. We demonstrate apoptosis and necrosis are induced in a dose dependent manner in both HT1080 and SKOV3 cells.
2
Application Note Live Cell Imaging
Materials and Methods
Cell Culture
HT1080 cells were grown in Advanced Dulbecco’s Modified Eagle’s Medium (DMEM) (Gibco, Grand Island, NY) with 10% FBS (Gibco) and 1x PennStrep-Glutamine (Cellgro, Manassas, VA). SKOV3 cells were grown in McCoy’s 5a Medium Modified (Gibco) with 10% FBS (Gibco) and 1x PennStrep-Glutamine (Cellgro). Cells were seeded into black sided clear bottom 96-well microplates (Corning, Corning, NY) at a density of 2,000 (HT1080) or 4,000 (SKOV3) cells per well and were allowed to adhere overnight. Environmental conditions, including temperature (37 °C), gas (5% CO2), and humidity (90%) were maintained during the two day incubation by a Biospa™ 8 Automated Incubator (BioTek Instruments, Winooski, VT).
Cell Death Induction and Component Addition
Cell death was induced by treating the cells with dilutions of camptothecin or staurosporine with concentrations ranging from 10,000-2.44 nM and a no compound control. The media also contained reagents from the Kinetic Apoptosis Kit (ab129817), donated by Abcam (Cambridge, MA). The polarity sensitive indicator of viability and apoptosis (pSIVA), a marker of apoptosis, was added to the media at a concentration of 10 µL/mL. Propidium iodine (PI), a necrosis indicator, was added to the media at a concentration of 5 µL/mL.
Cell Imaging
Cell culture plates were transferred by the BioSpa 8 to a Cytation™ 5 Cell Imaging Multi-Mode Reader (BioTek Instruments, Winooski, VT) every two hours. Environmental conditions were maintained at 37 ºC and 5% CO2 within the Cytation 5 throughout the imaging steps. Images were captured at 4x in the PI, GFP, and brightfield channels. Two high contrast brightfield images were captured at each time point, an in focus image used for reference, and a defocused image for cell counting. Briefly, cells were brought into focus using the high contrast brightfield kit. The view line profile tool was then used to draw a line that crossed cells and background sections of the imaging field. The focal height was then decreased while observing the line profile to determine the focal height at which maximum contrast between cell and background brightness was achieved. This value was then input as an offset from the reference high contrast brightfield image.3
Image Analysis
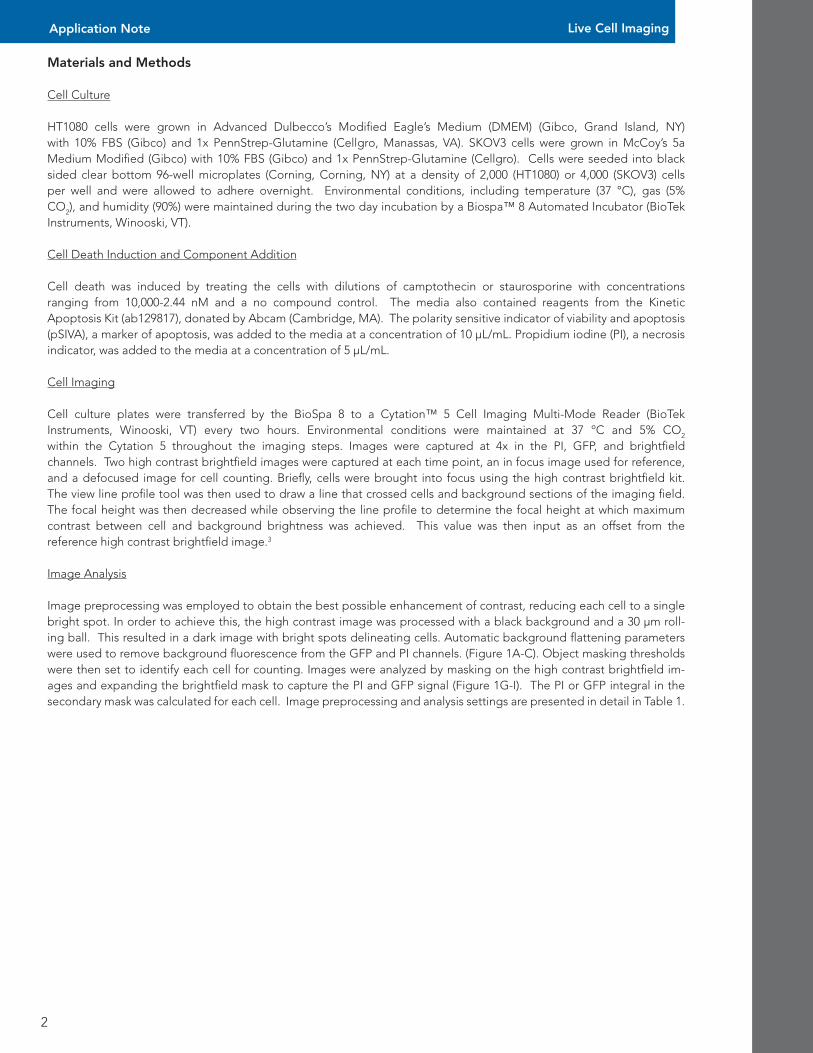
Image preprocessing was employed to obtain the best possible enhancement of contrast, reducing each cell to a single bright spot. In order to achieve this, the high contrast image was processed with a black background and a 30 µm roll-ing ball. This resulted in a dark image with bright spots delineating cells. Automatic background flattening parameters were used to remove background fluorescence from the GFP and PI channels. (Figure 1A-C). Object masking thresholds were then set to identify each cell for counting. Images were analyzed by masking on the high contrast brightfield im-ages and expanding the brightfield mask to capture the PI and GFP signal (Figure 1G-I). The PI or GFP integral in the secondary mask was calculated for each cell. Image preprocessing and analysis settings are presented in detail in Table 1.
3
Application Note Live Cell Imaging
Figure 1. Image analysis of apoptotic and necrotic cells. HT1080 cells were treated with camptothecin in order to determine the effect of the drug on the apoptotic and necrotic response of HT1080 cells. The first row (A-C) shows pre-processed high contrast brightfield images along with GFP and PI at 0 (A), 12 (B), and 24 (C) hours after treatment. The next row of images (D-F) shows the primary mask surrounding each individual cell as delineated by the pre-processed high contrast bright field image. Row G-I shows the expanded mask which captures more of the cell area and encompasses the GFP and PI signal. Row J-L shows the apoptotic cells highlighted in blue. Row M-O indicates necrotic cells highlighted in blue.
4
Application Note Live Cell Imaging
Image Preprocessing
Image Set Bright Field [2]
Background Dark
Rolling Bar Diameter 30
Priority Fine results
Image Smoothing Strength 0
Image Set Propidium Iodide
Background Dark
Rolling Bar Diameter Auto
Image Smoothing Strength 0
Image Set GFP
Background Dark
Rolling Bar Diameter Auto
Image Smoothing Strength 0
Cellular Analysis
Detection Channel: Primary mask and Count
Tsf[Bright Field [2]]
Threshold Auto
Background Dark
Min. object size 10
Max. object size 100
Secondary Mask Tsf[Propidium Iodide]
Measure within a Secondary Mask
Checked
Expand Primary mask 20 µm
Secondary Mask Tsf[GFP]
Measure within a Secondary Mask
Checked
Expand Primary Mask 30 µm
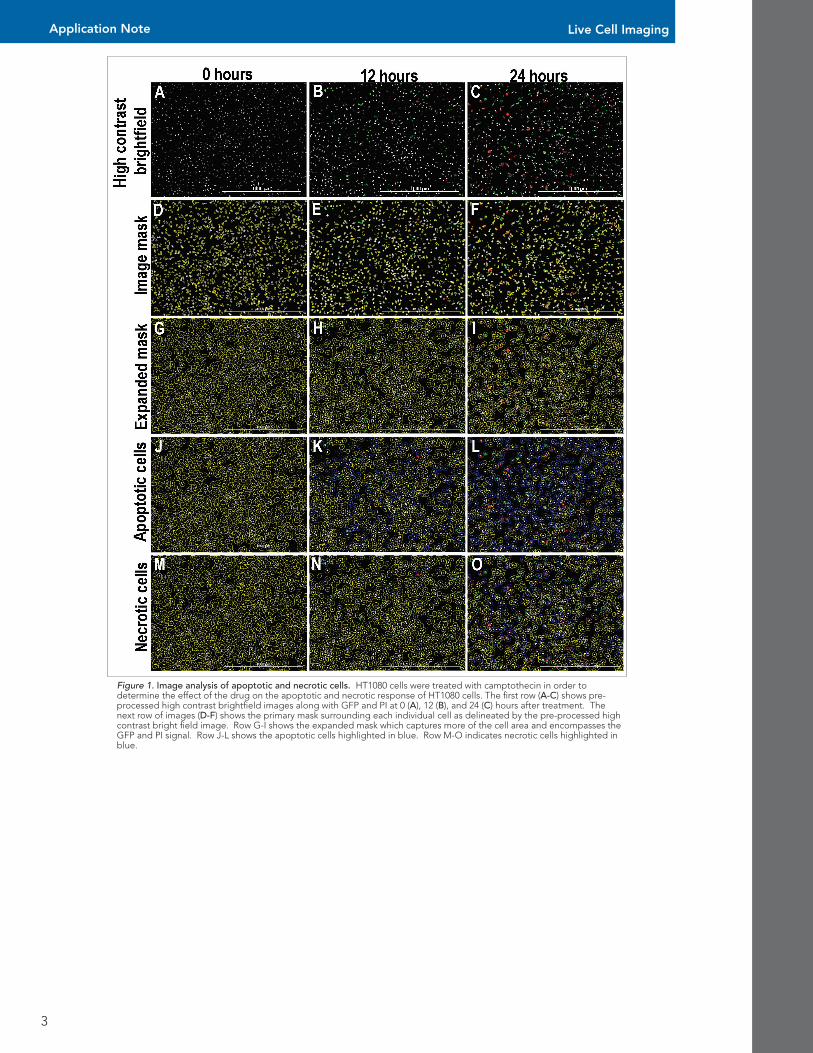
Table 1. Gen5 Microplate Reader and Imager Software settings. Image analysis parameters for generating a cellular mask in the high contrast bright field channel. Primary masks are expanded to encompass the PI and GFP signal in order to determine the integrals.
In order to determine which cells were positive for apoptosis or necrosis, a threshold was set based upon the negative control well (Figure 2). This threshold was set at 2 standard deviations above the mean of the average value of the negative control well. The percent of total apoptotic/necrotic cells per time point was de-termined using the ratio transformation function in the data reduction tool box.
Figure 2. Scatter plots for apoptosis and necrosis cut-offs. (A) GFP integral and (B) PI integrals from negative control wells were used to determine cutoffs for apoptotic and necrotic cells with subpopulation analysis. The average plus two standard deviations was used as the basis for determining positive apoptotic and necrotic cells.
Results
One feature of apoptosis is the expression of cell sur-face markers that result in early phagocytic recogni-tion of apoptotic cells, permitting phagocytosis with minimal compromise to the surrounding tissue. This is achieved by the movement of the normally inward fac-ing phosphatidylserine (PS) of the cell’s lipid bilayer to expression on the outer layers of the plasma membrane. Externalization of PS is a well known recognition sig-nal for phagocytes. In this study, we use a probe that binds reversibly to PS, the Polarity Sensitive Indicator of Viability and Apoptosis (pSIVA). A hallmark feature of necrosis is the breakdown of the plasma membrane, allowing uptake of membrane impermeable dyes such as propidium iodine (PI), thus indicating the presence of necrotic cells. The pSIVA and PI together act to dis-tinguish between apoptotic and necrotic cell death.
HT1080 cells were treated with camptothecin in order to determine the effect of the drug on the apoptotic and necrotic response of HT1080 cells. Camptothecin is a topoisomerase inhibitor which has high cytotoxicity in a variety of cell lines. Camptothecin acts by binding to the DNA topoisomerase I cleavage complex, which prevents re-ligation of single strand breaks and causes apopto-sis.4 We found an increase in apoptotic and necrotic cells both over time and according to dose (Figures 3-4).
5
Application Note Live Cell Imaging
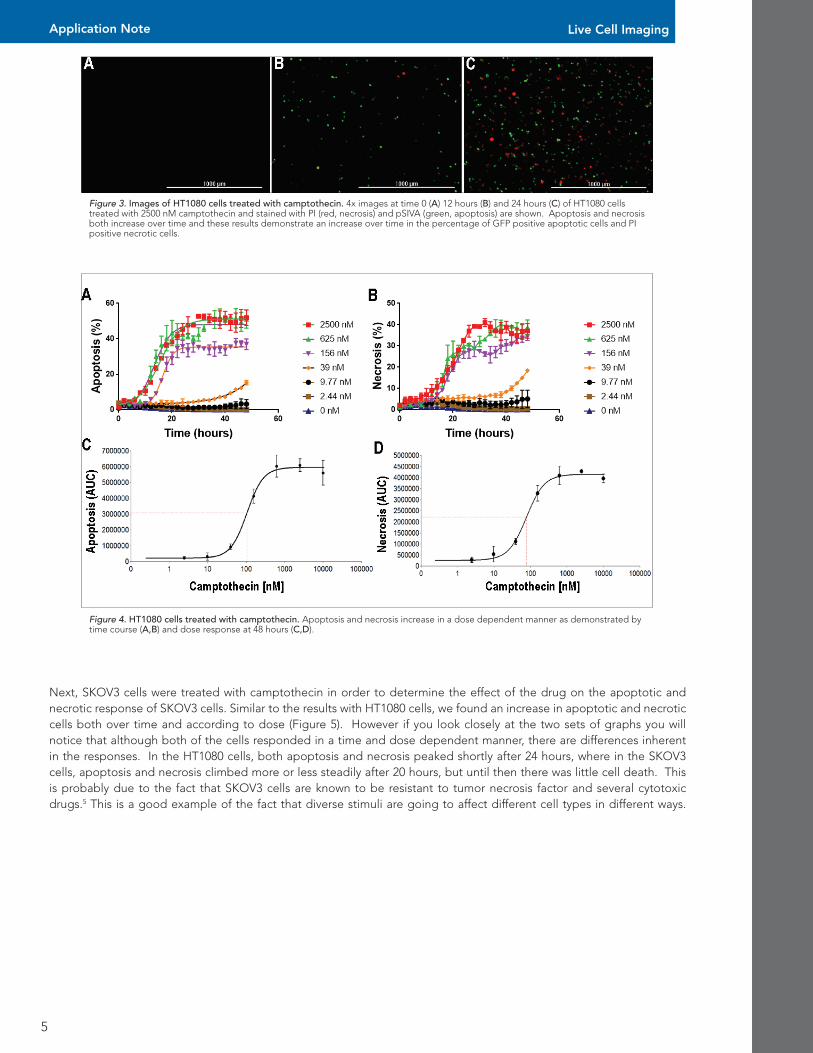
Figure 3. Images of HT1080 cells treated with camptothecin. 4x images at time 0 (A) 12 hours (B) and 24 hours (C) of HT1080 cells treated with 2500 nM camptothecin and stained with PI (red, necrosis) and pSIVA (green, apoptosis) are shown. Apoptosis and necrosis both increase over time and these results demonstrate an increase over time in the percentage of GFP positive apoptotic cells and PI positive necrotic cells.
Figure 4. HT1080 cells treated with camptothecin. Apoptosis and necrosis increase in a dose dependent manner as demonstrated by time course (A,B) and dose response at 48 hours (C,D).
Next, SKOV3 cells were treated with camptothecin in order to determine the effect of the drug on the apoptotic and necrotic response of SKOV3 cells. Similar to the results with HT1080 cells, we found an increase in apoptotic and necrotic cells both over time and according to dose (Figure 5). However if you look closely at the two sets of graphs you will notice that although both of the cells responded in a time and dose dependent manner, there are differences inherent in the responses. In the HT1080 cells, both apoptosis and necrosis peaked shortly after 24 hours, where in the SKOV3 cells, apoptosis and necrosis climbed more or less steadily after 20 hours, but until then there was little cell death. This is probably due to the fact that SKOV3 cells are known to be resistant to tumor necrosis factor and several cytotoxic drugs.5 This is a good example of the fact that diverse stimuli are going to affect different cell types in different ways.
6
Application Note Live Cell Imaging
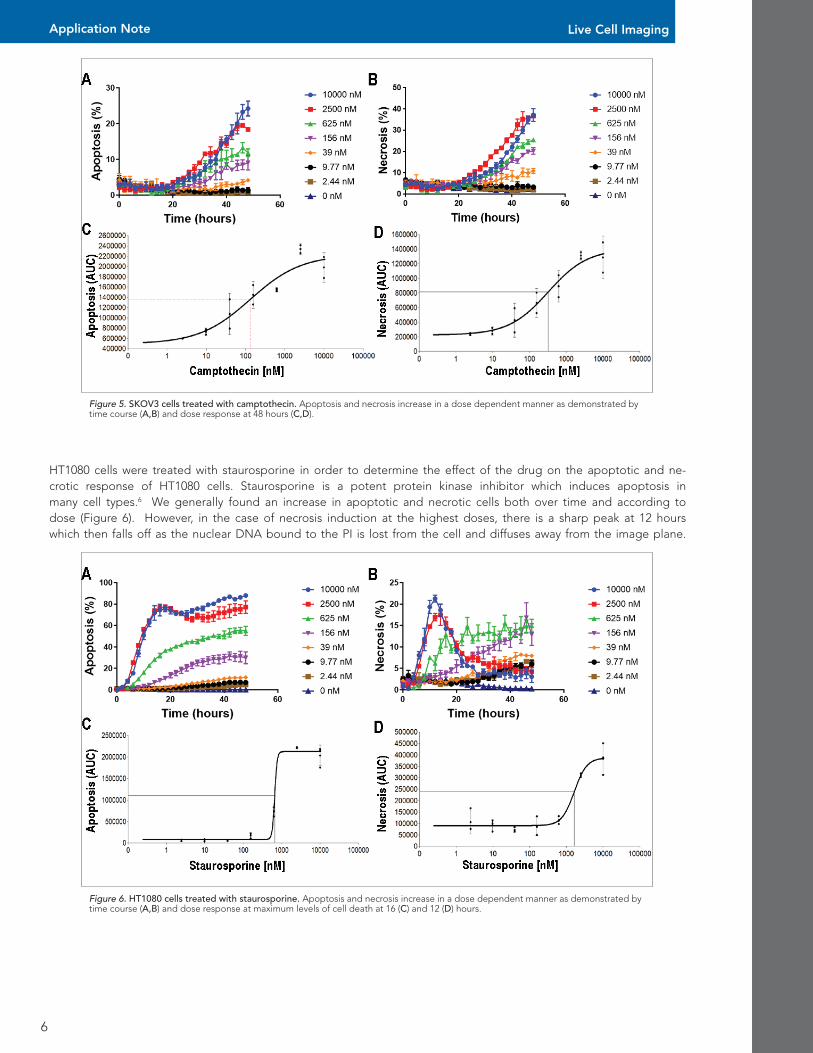
Figure 5. SKOV3 cells treated with camptothecin. Apoptosis and necrosis increase in a dose dependent manner as demonstrated by time course (A,B) and dose response at 48 hours (C,D).
HT1080 cells were treated with staurosporine in order to determine the effect of the drug on the apoptotic and ne-crotic response of HT1080 cells. Staurosporine is a potent protein kinase inhibitor which induces apoptosis in many cell types.6 We generally found an increase in apoptotic and necrotic cells both over time and according to dose (Figure 6). However, in the case of necrosis induction at the highest doses, there is a sharp peak at 12 hours which then falls off as the nuclear DNA bound to the PI is lost from the cell and diffuses away from the image plane.
Figure 6. HT1080 cells treated with staurosporine. Apoptosis and necrosis increase in a dose dependent manner as demonstrated by time course (A,B) and dose response at maximum levels of cell death at 16 (C) and 12 (D) hours.

7
Application Note Live Cell Imaging
Conclusions
The use of apoptosis and necrosis fluorescent probes
in combination with automated kinetic imaging allows
for quantitative assessment of the effects of known
inducers of cell death in multiple cell lines. This assay
uses high contrast label free brightfield imaging to assay
for total number of cells and cellular dyes to label both
apoptotic and necrotic cells concurrently. This allows
for determination of percent apoptosis and necrosis
in each cell population over long term drug treatment
without use of a nuclear dye. When HT1080 or SKOV3
cells are treated with dilutions of camptothecin or
staurosporine, apoptosis and necrosis are induced in
a dose dependent manner over time. This assay also
demonstrates the differing response of different cells
to the same stimulus, as in the case of SKOV3 and
HT1080 responding differently to camptothecin. Kinetic
analysis of cell death allows for sensitive, real-time
determination of the accumulation of both apoptotic
and necrotic events within the cellular population.
References
1. Elmore, S. Apoptosis: a review of programmed cell
death. Toxicol Pathol 35, 495–516 (2007).
2. Fink, S. L. & Cookson, B. T. Apoptosis, pyroptosis, and
necrosis: mechanistic description of dead and dying
eukaryotic cells. Infect. Immun. 73, 1907–16 (2005).
3. Clayton, J. Kinetic Proliferation Assay using Label-
Free Cell Counting. (2017)
4. Venditto, V. J. & Simanek, E. E. Cancer therapies
utilizing the camptothecins: a review of the in vivo
literature. Mol. Pharm. 7, 307–49 (2010).
5. Morimoto, H., Safrit, J. T. & Bonavida, B. Synergistic
effect of tumor necrosis factor-alpha- and diphtheria
toxin-mediated cytotoxicity in sensitive and resistant
human ovarian tumor cell lines. J. Immunol. 147, 2609–
16 (1991).
6. Tamaoki, T. et al. Staurosporine, a potent inhibitor of
phospholipid/Ca++dependent protein kinase. Biochem.
Biophys. Res. Commun. 135, 397–402 (1986).
AN032218_05, Rev. 03/22/18
Finally, SKOV3 cells were treated with staurosporine in order to determine the effect of the drug on the apop-totic and necrotic response of SKOV3 cells. Similar to previous results, we found an increase in apoptot-ic and necrotic cells both over time and according to dose (Figure 7). However, compared to the response of SKOV3 cells to camptothecin, when exposed to staurosporine, there was a slightly greater overall apop-totic and necrotic response, highlighting the fact that the same cells respond differently to different stimuli.
Figure 7. SKOV3 cells treated with staurosporine. Apoptosis and necrosis increase in a dose dependent manner as demonstrated by time course (A,B) and dose response at 48 hours (C,D).