live cell imaging of yeast - harvard...
TRANSCRIPT
Topic Introduction
Live Cell Imaging of Yeast
Daniel R Rines Dominik Thomann Jonas F Dorn Paul Goodwin and Peter K Sorger
INTRODUCTION
The development of cloning vectors for green fluorescent protein (GFP) and the simplicity of yeastreverse genetics allow straightforward labeling of yeast proteins in living cells Budding and fissionyeast are therefore attractive organisms in which to study dynamic cellular processes such as growthcell division and morphogenesis using live cell fluorescence microscopy This article focuses onmethods to culture mount and observe budding yeast cells using three-dimensional (3D) microscopybut themethods are broadly applicable to other types of cells and other imaging techniques The empha-sis is on 3D imaging because yeast cells are roughly spherical andmost organelles in yeast move in threedimensions Three-dimensional imaging also makes it possible to apply image restorationmethods (egdeconvolution) to obtain sharper images with better definition This is important because yeast cells aresmall (haploid Saccharomyces cerevisiae cells have a diameter of ~4ndash5 microm) relative to the resolution ofeven the best optical microscope (~025 microm)
BACKGROUND
Making a live cell movie involves trade-offs between the number of optical slices collected per time pointthe brightness of each slice the sampling frequency and the moviersquos duration Properties of the sampleand limitations in the imaging system link these variables together in a complex fashion One unavoid-able limitation is the total amount of light to which a live yeast cell can be exposed without causingphotobleaching or disrupting critical cellular processes Upon extended illumination chemical andGFP-based fluorophores become sufficiently bleached that they can no longer be detected above back-ground Moreover cells are sensitive to light and will die or they will arrest cell division if overexposedLike other cell types S cerevisiae appears to be more sensitive to blue light (~420ndash480 nm) than to near-ultraviolet (UV) or infrared irradiation This sensitivity creates a serious problem because it overlaps theexcitation wavelength for most variants of GFP The practical impact of photobleaching and phototoxi-city is that the investigator must limit the frequency of sampling the number of slices per time point andthe duration of a movie so that the cells remain below their exposure limit
Microscopes are subject to fundamental limitations in optical resolution acquisition speed and thesignal-to-noise response all of which are of practical interest in live cell experiments and must bebalanced to achieve the highest-quality results For instance short exposures increase the samplingrate but decrease the signal-to-noise ratio (SNR) and effective image resolution Long exposuresimprove SNR and resolution but increase photodamage and reduce the frequency of sampling Allmicroscopy whether fixed or live cell must begin with high-quality samples accurately alignedoptics and mounting techniques that minimize aberrations in image formation However there is nosingle best way to set the exposure time section thickness duration or other critical features of a livecell movie Instead the limitations of the sample and the instrument must be evaluated with respectto the goals of an individual experiment For example if a dynamic process is monitored with bright3D stacks collected every 5 sec over a period of 5 min the acquisition of such a movie would cause sig-nificant photobleaching This would be a valid way to examine rapid processes in mitosis but would notallow the overall timing of cell division to be elucidated For cell cycle studies phototoxicity negativelyaffects cell growth The intensity of illumination and frequency of samplingmust therefore beminimized
Adapted from Live Cell Imaging 2nd edition (ed Goldman et al)CSHL Press Cold Spring Harbor NY USA 2010Cite as Cold Spring Harb Protoc 2011 doi101101pdbtop065482 wwwcshprotocolsorg
copy 2011 Cold Spring Harbor Laboratory Press 1026
PRO
TOC
OLS
Co
ld S
pri
ng
Har
bo
r P
roto
cols
ww
wc
shp
roto
co
lso
rg
with a consequent reduction in temporal resolution This article briefly discusses the physics that underliethe limitations inherent in optical microscopy and the ways live cell imaging can be optimized withinthese limits
SPATIAL AND TEMPORAL RESOLUTION
The two most frequent questions in microscopy concern resolution What is the smallest object that canbe detected How close can two objects be and remain distinct in the image The resolution of opticalmicroscopes is limited by the diffraction of light as it passes through circular apertures in the objectivelens and other optical elements All microscopes are subject to this effect which is typically referred toas the ldquodiffraction limitrdquo Light from a point source object which is necessarily below the diffractionlimit is spread out to generate a blurred distribution known as the point-spread function (PSF) This dis-tribution is narrower in the x-y plane than along the z axis and its central portion resembles an elongatedellipse standing on end (Fig 1AB) Occasionally the PSF will be referred to as the ldquoimpulse responserdquo ofthe microscope because it represents the output in response to a point source impulse or input It turnsout to be remarkably useful to examine the PSF of an objective lens under real imaging conditions (seebelow) Imaging small point sources in a real biological sample (eg fluorescently tagged spindle polebodies) can be used to confirm the quality of images by checking that the blurred image resembles asymmetric PSF Asymmetry in the PSF along the z axis is known as ldquospherical aberrationrdquo and is only cor-rected by selecting an immersion oil with a different refractive index (see the section on Refractive IndexMatching Using ImmersionMedia) Normally the elliptical shapewould be seen along the z axis (Fig 1B)as well as a bright circle with multiple concentric rings of rapidly decreasing amplitude in the x-y plane(Fig 1C) The central part of this pattern is referred to as the Airy disk and contains ~85of the total lightthe concentric rings contain the remaining 15 Restoration or deconvolution microscopy uses infor-mation about the PSF to increase the sharpness of an image by attempting to re-create the original objectfrom its blurred image
Spatial resolution is typically defined using the Rayleigh criterion in which two point sources areconsidered to be distinctly resolvable when they are separated by no less than a distance dR
xy fromeach other in the x-y plane (perpendicular to the optical axis) and dR
z in the z plane (parallel to theoptical axis) (Inoue 1995)
dRxy = 061
l
NA dR
z = 2ln
NA2
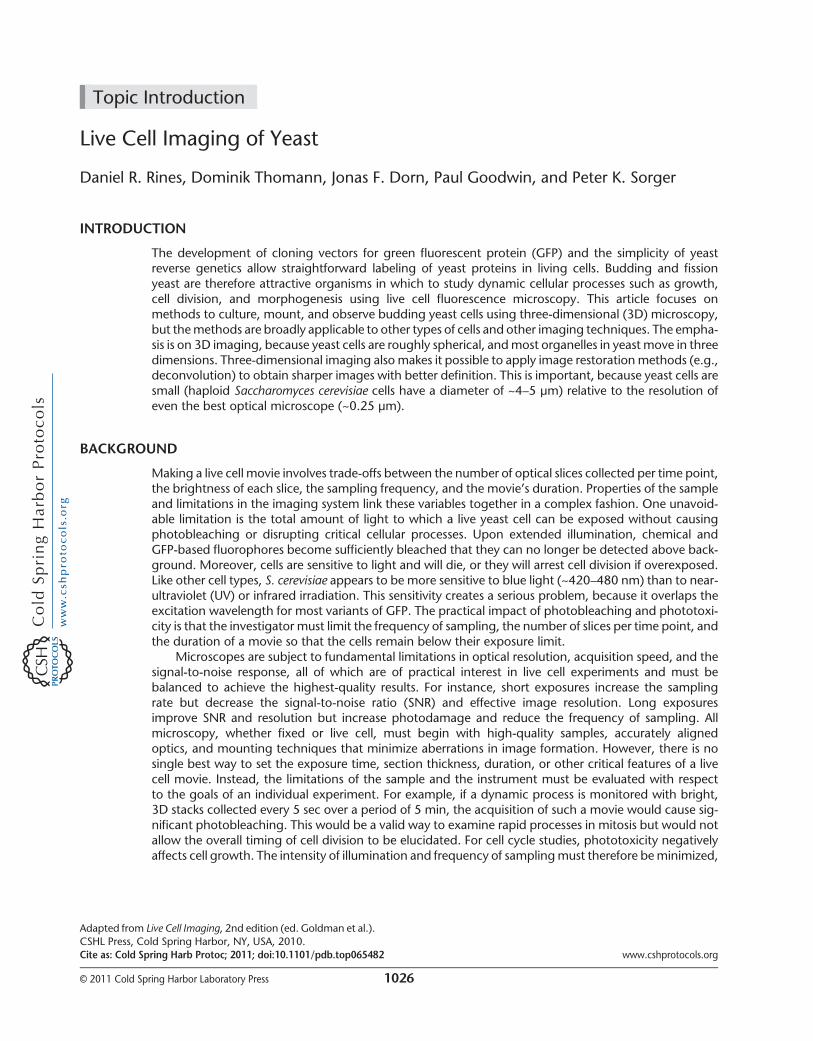
The Rayleigh distance is the point at which the first minimum in the diffraction-induced pattern(Fig 2A) of one point source overlaps the maximum in the second (Fig 2BC) Resolution increases
FIGURE 1 Point-spread function (PSF) (A) Light collected from afluorescent point source (eg a small bead) is smeared The smear-ing effect is a well-understood phenomenon and can be modeledcomputationally (Thomann et al 2002) (B) Complex pattern ofsmearing is commonly referred to as the PSF and is a characteristicof lens magnification construction immersion medium coverglassand any cellular components between the focal plane and lens Aperfect PSF will have symmetric cones of light above and belowthe point source This effect is best observed by optical z sectioningthrough a single point source Light from the z stack when vieweddirectly from the side generates the pattern or distribution shownhere (C ) The large circular pattern represents a view of the PSFfrom above and is commonly referred to as an Airy disk Thesignal intensity is represented by the density shading
wwwcshprotocolsorg 1027 Cold Spring Harbor Protocols
PRO
TOC
OLS
Co
ld S
pri
ng
Har
bo
r P
roto
cols
ww
wc
shp
roto
co
lso
rg
with higher numerical aperture (NA) in the objective lens and decreases with higher-wavelength (A) orrefractive index (n) values Thus with a 100times 14 NA objective the Rayleigh resolution limit with greenlight is ~250 nm in the x-y plane and ~700 nm in the z plane It is important to note that this resolutioncan only be achieved under optically ideal circumstances in which spherical aberration has been mini-mized (see the section on Refractive Index Matching Using Immersion Media) Image restorationmethods are designed to compensate for optical blurring but not for sample preparation problems orpoor instrument alignment Fortunately yeast cells are sufficiently small that we need not concern our-selves with sample-induced light scattering and depth-dependent aberrations that normally complicateimage collection when working with tissues and other thick specimens
In live cell imaging we are also concerned with temporal resolution Sampling must be sufficientlyfrequent to capture critical dynamics without loss of information For instance a dynamic processdescribed by a periodic waveform (eg the oscillation of chromosomes) must be sampled at no lessthan the Nyquist frequency which is defined as twice the highest frequency in the original waveformDiscrete sampling below the Nyquist frequency results in misestimation of the original waveformrsquos fre-quency Temporal aliasing is a serious concern in live cell imaging of yeast because wide-field 3D micro-scopes are currently unable to capture an image stack in lt1ndash2 sec Thus we cannot hope to follow aprocess with a frequency above 025ndash05 Hz
IMAGE INFORMATION CAPACITY
The Rayleigh formulation for resolution assumes noise-free images In reality noise is amajor determinantof both the detectability and resolvability of objects For example even if two point sources are resolvableby Rayleigh criteria it may be impossible to distinguish them if the amplitude of the noise exceeds thedepth of the minimum in the intensity profile When considering the detectability of small faintobjects it is also important to consider both the level of the noise and the blurring effect of the opticsWe can consider the impact of noise on images in a general sense by thinking about a microscopesimply as an information transfer system with three spatial (x y z) and one temporal channel As firstshown by Shannon the information capacity C of such a system is C = f log(1 + SNR) where f is thecontinuous bandwidth of the microscope in all four channels As the SNR falls the information capacity(the information about the image that can be conveyed by the microscope) falls and is completely lostwhen the SNR reaches 0 The bandwidth is itself a function of the cutoff frequencies of the objective lensTo understand why this cutoff exists recall that a lens decomposes an image into its frequency com-ponents such that the lowest-frequency components (those containing the least detail) are towardthe center of the optical axis and the higher-frequency components (those containing more imagedetail) are toward the edge (Fig 3) Thus as the half-angle (ltθgt) of collected light increases so doesthe objectiversquos ability to collect higher frequencies and better resolve small objects Viewed in anotherway the fixed diameter of the objective limits the maximum frequency that can pass the cutoff
FIGURE 2 Rayleigh resolution criteria Green spheres in insets represent two identical point sources in close proximityGreen curves show fluorescent intensity of one point source red curves represent intensity of other source black curvesshow the cumulative signal from both point sources (A) A three-dimensional representation of an Airy distributionZeroth order is represented by the large peak in the center and successive orders occur in the circular radial bands (B)When two objects are in close proximity to one another where the Airy patterns overlap bylt42 of themaximal intensitiesthe objects are individually resolvable (equal intensity objects) Rayleigh resolution limit (dR) represents the minimum dis-tance the two objects can be to each other (C ) If the objects move together with gt42 of their maximal intensity overlap-ping the ability to resolve the objects as distinct is no longer possible Notice that the two maxima are closer than theRayleigh resolution limit
wwwcshprotocolsorg 1028 Cold Spring Harbor Protocols
PRO
TOC
OLS
Co
ld S
pri
ng
Har
bo
r P
roto
cols
ww
wc
shp
roto
co
lso
rg
frequency Vc to an extent that varies with ltθgt
vc = 2NAl
NA = n(sin u)
All frequencies larger than Vc which would define the fine structures of the object are not conveyedby the objective lens and therefore cannot appear in the image (n = refractive index of medium) Theprecise relationship between resolution and SNR depends on specific properties of the image and theway it is processed but a typical result from point object tracking is shown in Figure 4 The importantpoint here is that it is ultimately both the cutoff frequency of the objective lens and the SNR that limitresolution and detectability under low-light conditions Factors in the imaging system that affect SNRare discussed in detail below
BRIGHTNESS
An additional question that is frequently asked and one of particular relevance for live cell imaging ishow bright an object must be to be detectable Detectability increases with the intrinsic brightness (B)of the object being imaged and the SNR of the image Increasing the SNR is a significant problem inlive cell imaging because photobleaching and photodamage prevent us from increasing the intensityor duration of the illumination indefinitely Instead we must ensure that incident (excitation) photonsare efficiently converted into fluorophore (emitted) photons In other words as many emittedphotons as possible need to be collected by the objective and passed through the microscope to thecamera and the camera must be optimally configured to convert these emitted photons into an elec-tronic signal We consider each of these issues in turn and in all cases concentrate on epifluorescenceimaging
The intrinsic brightness of a fluorescently tagged object depends on the number of fluorophores perunit volume (density) the probability that an excitation photon will be absorbed (the extinction coeffi-cient of the fluorophore) and the probability that a photon will be emitted by the fluorophore in
FIGURE 3 Comparing light collected from different NA objectives Shown are two lenses with different NAs (low NA on theleft high NA on the right) Black lines represent half-angle cone of light collected by the objective as determined by the NA ofthe lens the greater the half-angle (ltθgt) the larger the NA value The lens on the left (A) has a smaller NA than the one onthe right (B) thus e1 lt e2 (Red dashed lines) Normal dispersion of emitted light from a single fluorescent point source afterpassing through a coverglass Note that higher-NA objectives collect more light emitted from sample In addition use ofrefractive matched immersion oil limits excess refraction and enhances the number of photons collected by an objective(solid red line) The effects on image detail are illustrated about each objective with respect to the cutoff frequency Thehigher-NA lens produces a more defined image because it can collect the higher frequencies not available in thelow-NA lens
wwwcshprotocolsorg 1029 Cold Spring Harbor Protocols
PRO
TOC
OLS
Co
ld S
pri
ng
Har
bo
r P
roto
cols
ww
wc
shp
roto
co
lso
rg
response to an absorbed photon (the quantum yield) It is also important to consider the differencebetween the excitation and emission wavelengths (the Stokesrsquo shift) When the excitation and emissionwavelengths are close it is difficult to block all of the excitatory photons and collect only the much lessnumerous (~10ndash6-fold) emitted photons GFP has a relatively small extinction coefficient quantum yieldand Stokesrsquo shift when compared to chemical fluorophores but some GFP variants are better than others(Tsien 1998) Moreover enhanced GFP has good photostability making it the best fluorophore for livecell imaging Preliminary evidence also suggests that the intrinsic brightness of a protein can be increasedconsiderably by fusing it to two tandem GFP tags When deciding what proteins in a multiproteincomplex to label it is also helpful to choose those that are concentrated in a small area (for simplicitywe are ignoring possible complications from proximity-induced fluorescence quenching) Thus totrack the growth and movement of mitotic spindles in living cells we decided to GFP-tag Spc42p aprotein that is present in many copies at the spindle pole bodies rather than tubulin which formsextendedmicrotubule-based structures (Fig 4A) The spindle pole bodies are smaller than the diffractionlimit of themicroscope (~024 microm) (Bullitt et al 1997) and therefore appear as bright spots independentof magnification It is relatively simple to determine the center of these fluorescent spots and therebymeasure the length and orientation of the spindle (Fig 4BC) In contrast it is difficult to measurewith precision the extent of tubulin in the spindle
Choosing an Objective
Although many aspects of a microscopersquos optics affect the brightness of a feature none are as importantfor fluorescent imaging as the NA of an objective lens (Fig 3) (for review see Spector and Goldman
FIGURE 4 Dependence of localization error and resolution on SNR in a typical application (A) Maximum intensity projec-tion of an S cerevisiaemitotic spindle Spindle pole bodies (SPBs) are marked with GFP-tagged Spc42p and the centromereproximal DNA is marked on chromosome III (CEN) with a TetOTetR GFP-tagging system (Straight et al 1996 Ciosk et al1998) (B) Gaussian approximation of the PSF for a fluorescent point source in the x-y plane (C ) Same as Bwith respect to thez plane Note that distribution of Gaussian is greater in the z plane compared to the x-y plane The combination of the twoapproximations describes the shape of a fluorescent point source in 3D (D) The error in localizing a single-point sourceobject as a function of the SNR (E) The localization error as a function of the point-to-point distance calculated for threedifferent SNR values Note that the horizontal axis points from high to low SNR The graph confirms the well-known factthat center positions of features with a known intensity distribution in our case the distribution of the PSF can be determinedwith sub-20-nm precision (Bobroff 1986) For SNR gt15 the precision even reaches the single-nanometer range Withshorter separation distances the accuracy decreases the Rayleigh limit is denoted by a dashed vertical line dxy is the sep-aration distance between two spots and σxy is the width of the Gaussian distribution (D and E Reprinted from Thomannet al 2002 with permission from Wiley copy 2002)
wwwcshprotocolsorg 1030 Cold Spring Harbor Protocols
PRO
TOC
OLS
Co
ld S
pri
ng
Har
bo
r P
roto
cols
ww
wc
shp
roto
co
lso
rg
2003) The observed brightness of a fluorescent image (b) is
b asymp BNA4
M2
( )E
where B is the fluorescent brightness of the object M is the magnification NA is the objective lensrsquosnumerical aperture and E is the transmission efficiency of the optics All other factors being equal it isimportant to use the highest-NA lowest-magnification lens available In the case of diffraction-limitedpoint-source objects magnification does not affect brightness As a practical matter all high-NA micro-scope objectives are also highmagnification and are typically available with 60ndash100timesmagnifications Foryeast a 100times 14 NA lens is usually optimal With regard to the transmission efficiency of the optics (E) itis important to avoid objectives designed for phase contrast because the phase ring causes ~30reduction in transmission Similarly it is important to remove differential interference contrast (DIC)-phase plates and prisms from the optical path because they also reduce light transmission by asmuch as 70 Fully color-corrected flat-field (Plan-Apochromat) objectives typically exhibit 75ndash85transmission for 400- to 700-nm light It is possible to increase the transmission by a small but significantextent by using less than fully color-corrected objectives Overall the rule in live cell imaging is to use thehighest-NA objective that is designed for epifluorescent imaging rather than for phase contrast
Filters and Dichroic Mirrors
To select the desired excitation and emission wavelengths epifluorescence microscopes make use ofthree optical elements an excitation filter a dichroic mirror (beam splitter) and an emission filterA typical arrangement is detailed in Figure 5 and a full range of absorption spectra can be downloaded
FIGURE 5 Filtering elements in a typical epifluorescent microscope system (A) Light consisting of all wavelengths from thevisible spectrum enters a set of neutral-density UV and infrared filters to block excessively damaging light rays (B) Wave-lengths are then filtered by passing through the excitation filter Only those photons between 450 and 500 nm pass throughthis filter before being reflected by the angled beam splitter (dichroic) to the objective lens and to the specimen slide (C ) Thebeam splitter not only selectively reflects photons from the excitation wavelength but also allows photons emitted from thespecimen to pass directly through In this example only those photons between 450 and 500 nm are reflected The photonsemitted from the GFPmolecules (510ndash530 nm) and any background fluorescence pass down through the splitter toward theemission filter (D) Light slipping through the beam splitter is selectively blocked so that only those photons between 500 and550 nm are passed through to the eyepiece or CCD (charge-coupled device) camera Thus the emission filter helps toreduce autofluorescent signals and excitation wavelengths that slip through the beam splitter The graph of Chroma41047 shows the overlapping image spectra from each of the individual elements for the GFP bandpass filter set
wwwcshprotocolsorg 1031 Cold Spring Harbor Protocols
PRO
TOC
OLS
Co
ld S
pri
ng
Har
bo
r P
roto
cols
ww
wc
shp
roto
co
lso
rg
from Chroma Technology Corp Omega Optical and other vendors Broad-spectrum light from themercury or xenon burner first passes through a series of infrared and UV-blocking filters near the rearof the microscope (Fig 5A) and then through an interference filter that allows only excitation wave-lengths to pass (Fig 5B) Excitatory illumination is then reflected by the dichroic mirror toward the objec-tive lens and the sample (Fig 5C) Emitted photons from the sample are collected by the objective andpass through the dichroic and then through an emission filter on their way to the camera or occulars(Fig 5D) Filter manufacturers such as Omega Optical (httpswwwomegafilterscom) and ChromaTechnology Corp (httpwwwchromacom) offer filters in sets suitable for various applications Inmany cases all of the optical elements are mounted in a single holder known as a filter cube In micro-scopes with automatic wavelength selection the dichroic mirror is mounted in the cube whereas theexcitation and emission filters are mounted in separate motorized wheels
We have encountered a considerable degree of confusion surrounding the selection and assemblyof filter sets The issue is easy to understand however if one makes reference to spectral plots and thegeometry of an epifluorescence microscope (Fig 5) Wavelength filtering in epifluorescence micro-scopes relies on a special property of dichroics They reflect light shorter than a characteristic wavelengthbut are transparent to longer wavelengths (polychroic beam splitters have several transitions betweenreflection and transmission) Short-pass and long-pass emission and excitation filters are describedby a wavelength that denotes the point of inflection between transmission and absorption (Fig 6AB)Alternatively bandpass filters are described by the wavelength of peak emission (the center wavelength)and the width of the allowable band (the full width at half-maximum transmission eg 52020) Byexamining the characteristics of each element in a set it is possible to choose sets for a particularapplication but some experimentation with individual elements is advisable to fully optimize theoptical train
Live cell imaging of GFP-labeled yeast cells presents some special problems in filter set design and atrade-off must be made between sensitivity and selectivity Because the Stokesrsquo shift of GFP is small it iscommon to pass all of the emitted photons from the sample while sacrificing somewhat on the excitationside In some yeast strains autofluorescence is a significant problem and filter sets must be assembled bythe user tominimize the backgroundWe have found that a long-pass GFP (Chroma HQ500LP) emissionfilter provides good sensitivity for single-color recording of yeast cells expressing enhanced GFP Whenautofluorescence is a problem particularly with adendash strains (see below) use of the bandpass GFP(Chroma HQ52550m) emission filter is preferred In dual-color imaging filter and fluorophore combi-nations must be examined closely for overlapping wavelengths However combinations with cyan fluo-rescent protein (CFP)GFP or CFPYFP (yellow fluorescent protein) are usually quite successful It is bestif the less-abundant protein is tagged with GFP because GFP is significantly brighter than CFP and isless likely to photobleach It should also be noted that CFP and YFP can be used as a FRET (fluorescenceresonance energy transfer) pair
The shortest exposures and lowest possible illumination should be used for live-sampleexcitation With our GFP-labeled spindles and tagged chromosomes we typically collect 50-msecexposures per z section and use neutral density (ND) filters to reduce the incident illumination fivefoldto 10-fold A broad range of neutral density filters are available and should be kept on hand forthis purpose
FIGURE 6 Filter types (A) Low-pass filter selectively allows only wavelengths below 550ndash600 nm to pass in this exampleLonger-wavelength photons are blocked by the element (B) High-pass filter designed to allow wavelengths above 550ndash600nm to pass through (C ) Bandpass filter blocks both short and long wavelengths while allowing only light from 525ndash625 nm topass through
wwwcshprotocolsorg 1032 Cold Spring Harbor Protocols
PRO
TOC
OLS
Co
ld S
pri
ng
Har
bo
r P
roto
cols
ww
wc
shp
roto
co
lso
rg
Setting Up the Camera
Camera design and configuration are critical variables in determining the brightness of images and theextent to which features can be discriminated Because they are invariably more efficient than colorcameras we consider here only the monochromatic charge-coupled device (CCD) cameras In a micro-scope system connected to a monochromatic camera exposures are taken with different excitation andemission filters and color is introduced after the fact by assigning a hue to each exposure based on theproperties of the filter The construction of CCD cameras is a relatively complex topic that we will notcover in any detail but to optimize camera performance it is helpful to have a basic understanding oftheir operation (Fig 7) At the core of a CCD camera is a chip containing a rectangular area of photosen-sitive detectorsmdashpixelsmdashthat convert photons into electrons with a particular quantum efficiency (QEwhich varies with wavelength and is typically 60ndash80 for blue-green light) After an exposure istaken the number of electrons generated at each pixel is determined by an analog-to-digital converter(ADC) Cameras typically have only one ADC and the electrons in each pixel of the CCD must thereforebe moved to the ADC via a series of positional shifts until the entire chip has been read (Fig 7) Thuseven though a CCD camera collects photoelectrons at each pixel in a parallel process the pixels areread serially Serial readout significantly limits the rate at which CCD cameras operate and thus thefewer the number of pixels read the greater the rate at which successive frames can be recorded (com-monly referred to as frame rate) One simple way to increase frame rate is to limit the area of the CCDbeing read by the ADC Yeast cells are sufficiently small even with a 100times objective where a 64 times64-pixel or 128 times 128-pixel area of the CCD is usually sufficient A second method to increase framerate is to add the contents of adjacent pixels together prior to their arrival at the ADC in a processknown as on-chip binning Besides faster readout binning increases the SNR at the cost of lowerimage resolution To understand the impact of binning on an image note that the pixels in a CCDarray perform a discrete sampling of the image which is a continuously varying two-dimensional wave-form The pixel array must therefore by Nyquist criteria sample the image at twice the frequency of thehighest spatial frequencies in the image The highest frequency in the image is determined by the cutofffrequency Vc of the objective We can therefore determine the pixel spacing px as follows
px le lM4NA
With a 100times 14 NA objective the largest acceptable pixel spacing is 89 microm For instance aRoper CoolSNAP HQ interline CCD camera has a pixel size of 625 times 625-microm without binning and
FIGURE 7CCD chip architecture (A) Photons coming from themicroscope hit the surface of the CCDphotosensitive detec-tors These photons are registered and incrementally counted as electrons for the desired exposure duration The electroncount is converted into signal intensity by a single read buffer (ADC) at the top of the array To read each line from the CCDarray the information must be shifted up one line at a time until the entire image is transferred into the read buffer and readout sequentially (B) Once complete the raw digital image can be reconstructed from the individual intensity values (C )Properties of a typical high-performance interline CCD camera
wwwcshprotocolsorg 1033 Cold Spring Harbor Protocols
PRO
TOC
OLS
Co
ld S
pri
ng
Har
bo
r P
roto
cols
ww
wc
shp
roto
co
lso
rg
with a 100times 14 NA objective lens oversamples the image 14-fold (relative to the Nyquist criteria) This isreasonable for small diffraction-limited objects In contrast 2 times 2 binning (to create 125 times 125-micromsuperpixels) would be detrimental
CCD cameras are subject to three sources of noise dark noise photon noise and read noise Darknoise refers to the random generation of electrons within the photosensitive elements of the CCDarray from heat rather than by photon absorption Modern microscope cameras cool the CCD tobetween minus30˚C and minus50˚C effectively making dark noise negligible Photon noise also known asshot-noise arises from variations in the flux of photons in a beam of constant intensity Photonnoise exhibits Poisson statistics varying with the square root of the signal and is an intrinsic featureof photons that cannot be eliminated by changes in camera design and setup Read noise refers touncertainty in the measurement of photoelectron number introduced by limitations in the preampli-fier ADC and other electronics in the camera (httpwwwroperscientificcom) Read noise is a func-tion of the quality of the camera and the care that has been taken in designing the electronics but fora given camera the faster the read rate of the camera the greater the noise Ideally imaging should beperformed under conditions in which the physics of photon counting and not the camera design islimiting Under these conditions commonly referred to as photon-limited imaging photon noise isthe greatest contributor to overall noise However it is not always possible to work in this rangewith live samples and we typically find ourselves recording in the instrument-limited range Underthese circumstances it is important to find the lowest-noise cameras and lowest-noise settings Forexample with a CoolSNAP camera recording 50-msec exposures on a 128 times 128 area of the CCD wehave observed a dramatic increase in SNR but little decrease in frame rate by dropping from a20-MHz read rate to 10 MHz
In summary for live cell imaging of yeast it is usually best to use only a fraction of the area of amega-pixel CCD camera This makes it possible to increase the frame rate while keeping the ADC read rate aslow as possible to increase SNR In general avoid binning the image but before accepting this nostrumit is best to perform the simple calculation mentioned above to see if this is also true for the microscopebeing used If it allows binning then the image SNR will increase because the signal becomesphoton-noise-limited at a lower overall intensity Before leaving the topic of cameras however it isworthmentioning interline CCD architectures which have a significant impact on frame rate In an inter-line CCD a set of masked (nonphotosensitive) pixels are interleaved between the primary photosensitivedetector lines Such interline CCDs have a primary recording array and a second masked array An entireframe can be shifted in parallel from the recording to themasked array and themasked array can then bedigitized while the primary array is recording a subsequent exposure This makes it possible to record suc-cessive frames without a shutter Historically interline CCDs have had the drawback that the interlinemasks reduce the fraction of the chip that responds to light and therefore reduce camera sensitivityRecent cameras circumvent this problem by including a small lens for each pixel that focuses the lightfrom masked elements onto photosensitive elements thereby achieving both increased speed andincreased sensitivity Interline CCD cameras currently represent the best option for high-speed live cellimaging (Fig 7C)
PREPARING AND MOUNTING SAMPLES FOR LIVE CELL IMAGING
Quite often the most tedious parts of live cell microscopy are keeping cells growing proficiently andpreventing them from floating around during an imaging session The following sections describeprocedures for selecting appropriate strains preparing the culture and maintaining cells in a suitableenvironment
Strains and Growth
Autofluorescence can be a significant problem in yeast if cultures are grown under poor conditionsespecially whenworking with adendash strains In adendash strains a colored intermediate in adenine biosynthesisphosphoribosylaminoimidazole accumulates to high levels in the absence of exogenous adenine and ishighly fluorescent when excited with blue light (Stotz and Linder 1990) In fact it is the phosphoribosy-laminoimidazole that gives adendash yeast cells the distinctive red color used in genetic sectoring assays(Ishiguro 1989) Autofluorescence can be minimized by using ADE+ genetic backgrounds and growingcells in synthetic complete (SC) medium supplemented with essential amino acids and 20 microgmL extra
wwwcshprotocolsorg 1034 Cold Spring Harbor Protocols
PRO
TOC
OLS
Co
ld S
pri
ng
Har
bo
r P
roto
cols
ww
wc
shp
roto
co
lso
rg
adenine Additionally cultures should be maintained below 5 times 106 cellsmL for 4ndash10 generations andthe medium should be refreshed prior to mounting and imaging
Slide Preparation
Although it is possible to mount live yeast cultures directly under a coverglass we have found it quitedifficult to avoid physical damage and to hold cells in a fixed position using direct mounting Thuswe recommend mounting cells on a pad of 12 agarose formed in a slide that contains a shallowdepression This system not only holds the cells in place better and prevents accidental shearing butit also provides cells with a significant volume of nutrients to help maintain cell viability The use ofagarose pads is particularly important for time-lapse experiments and we have successfully used themto maintain cells at wild-type growth rates for 8 h or more (Fig 8)
Preparing Slides with an Agarose Cushion
1 To prepare the agarose solution combine 10 microL of SC medium supplemented with a Complete Sup-plement Mixture of amino acids (Bio101 httpwwwBio101com) 20 microgmL of additional adenineand a carbon source (eg 2 wv glucose) with 12 (wv) agarose Heat the solution in a micro-wave to completely melt the agarose
2 Add 200 microL of melted agarose solution to a 60˚C prewarmed slide fabricated with a shallow 18-mmhemispherical depression (VWR httpwwwvwrcom) (Fig 9A) Quickly cover the agarose-filleddepression with a regular microscope slide (the top slide) by placing it directly onto the agaroseUsing the thumbs press evenly against the top slide for 1min to allow the agarose to harden (Fig 9B)Excess agarose will squeeze out from the edges It is essential that no air bubbles be trapped in the agarose during thisprocess and that the agarose forms a smooth flat surface with the slide To prevent dehydration leave the top slide inplace until cells are ready for mounting
3 Prepare a 22 times 22-mm no 15 (016- to 019-mm) coverglass (VWR) for mounting by first physicallyremoving dust particles from the coverglass with a dry artistrsquos paintbrush and hand blower (egBergeon Dust Blower from httpwwwwatchpartsusacom or httpwwwnationaljewelerssup-pliescom) Make sure to remove any particles from the coverglass since they will prevent a tightseal with the agarose pad
Avoid using precision wipes (eg Kimwipes) as they can leave scratches and fluorescent strands on theglass In addition avoid Dust-Off or similar compressed gas products because they usually contain smallhighly fluorescent particles
The coverglass is an important and often overlooked component of the optical path Objectivelenses are typically designed to work with a particular thickness of coverglass usually no 15 (016ndash019-mm thickness) and proper selection can enhance image quality For the most precise work it isgood practice to measure the thickness of the coverglass and to use only those within plusmn002 mm of
FIGURE 8 S cerevisiae cells growing on an agarose specimen slide Wild-type cell culture grown in medium to log phaseand mounted at 1 times 107 cellsmL using the techniques described in this article The slide was maintained at 30˚C for justover 8 h Series of phase-contrast images collected at regular intervals (every 60 min) to monitor growth rates Culturedoubles every 90ndash100 min based on cell counts Bar 4 μm
wwwcshprotocolsorg 1035 Cold Spring Harbor Protocols
PRO
TOC
OLS
Co
ld S
pri
ng
Har
bo
r P
roto
cols
ww
wc
shp
roto
co
lso
rg
nominal dimension A digital micrometer suitable for measuring thickness can be obtained from any toolsupply house (eg httpwww1mscdirectcom)
4 Apply a very fine band of 100 pure petroleum jelly (eg Vaseline) to the extreme edge of the cover-glass Do this to all sides by adding a very small amount of jelly with a toothpick to one corner andrunning a finger gently along the extreme edge to distribute the petroleum jelly evenlyThe petroleum jelly prevents rapid evaporation of the cell culture medium and creates a better seal when the coverglassis applied to the agarose bed
Mounting Cells
5 To pellet the cells transfer 1 mL of log-phase yeast culture to amicrocentrifuge tube and centrifuge atlow speed (4000 rpm) for 1 min Avoid overspinning
6 Remove the supernatant from themicrocentrifuge tube and resuspend the cell pellet in 03ndash05mL offresh SC medium (as in Step 1 but without agarose)The volume used to resuspend the cells depends on the size of the cell pellet in Step 5 and the desired final cell density onthe microscope slide
7 Remove the top slide to expose the agarose pad by gently pushing the top slide along the length ofthe depression slide (Fig 9CD) This step should release the seal between the two slides and leave avery smooth surface on top of the depression slide If any large bits of agarose remain carefullyremove them
8 Transfer 22 microL of resuspended cell culture to the smooth agarose and gently place the coverglass withpetroleum jelly over the cell culture (Fig 9EF) To create a tight seal apply a very slight amount ofpressure at the extreme edges of the coverglass Do not press too hard because the cells could bedamaged or crushed between the coverglass and microscope slide
9 Spot a small amount of nail polish at the four corners of the coverglass to prevent it from sliding orpulling away from the agarose bed during the imaging session
FIGURE 9 Preparing specimen slide with agarose pad and mounting of S cerevisiae cells (A) 200 μL of hot agaroseSC-Complete Medium Mixture is added to a 60˚C prewarmed depression slide using a pipette (B) A prewarmed top slideis placed directly on the agarose-filled depression and pressure is held evenly across the top slide for 60 sec while theagarose solution hardens (C ) The top slide is gently removed by sliding it toward one end of the depression slide (D) Afterremoval of the top slide excess agarose is removed from the depression slide to create a flat and even surface (E) 22 μL ofyeast culture is immediately added to the center of the agarose pad using a small pipette tip (F ) A dust-free petroleum-edgedcoverglass is gently placed on top of the yeast sample and sealed by applying light amounts of pressure to the four sides of thecoverglass Large air bubbles can be removed by gently applying pressure to the coverglass in a radial direction
wwwcshprotocolsorg 1036 Cold Spring Harbor Protocols
PRO
TOC
OLS
Co
ld S
pri
ng
Har
bo
r P
roto
cols
ww
wc
shp
roto
co
lso
rg
INSTRUMENTATION ENVIRONMENTAL CONTROL AND MICROSCOPE OPTICS
Environmental Control Devices
Temperature-sensitive yeast strains are well suited to live cell microscopy and present an opportunity todetermine the role of a single gene on a dynamic process in a living cell However special considerationmust be given to control the temperature of the yeastsrsquo environment because the objective and slide arecoupled thermally via immersion oil and thus the objective acts as a heat sink Live cell yeast microscopycan be performed successfully on either upright or invertedmicroscopes and commercial environmentalcontrol systems are available for both With yeast cells it is not necessary to use the elaborate chambersdeveloped for animal cells because the regulation of oxygen and CO2 levels is not critical When choos-ing or building an environmental control system it is important to keep in mind the geometric con-straints imposed by high-NA objectives These include a relatively large-diameter lens direct contactwith the sample (via immersion oil) and short working distance In our experience by using a stageheater an objective heater and the depression slide system discussed in the previous section it is poss-ible to maintain live yeast cells at temperatures from 15˚C to 40˚C for many hours The best way toperform rapid shifts from permissive to nonpermissive temperatures is to use preheated objectivesrather than to change the temperature of a single objective Note that such a shift entails a compromisein the choice of mounting oil (see below)
Building a Thermally Regulated Slide Holder
A simple stage heater can be fabricated from a brass block measuring 4 times 2 times 05 inches One advantageof this simple water-based thermal system is that it appears to be more stable thermally than traditionalresistive systems which cycle on and off In addition a refrigerated circulator allows cold-sensitivemutants to be chilled below room temperature
A completed thermal unit should make clean contact with the microscope objective and look similarto the detailed arrangement shown in Figure 10D (eg inverted microscope configuration)
1 Drill a 1-inch hole through the block to permit bright-field illumination Drill intersecting holesthrough the length of the block cap themwith seals and connect the block via tubing to a circulatingwater bath to create a continuous channel for heated or cooled water (Fig 10A)
2 Fit a temperature collar (available from Bioptechs Inc httpwwwbioptechscom) over the objectiveto regulate its temperature (Fig 10B) and to prevent heat from being absorbed into the microscopebase Exercise caution in using the collar since it is typically wide enough that excessive stage move-ment can cause the objective to crash into the stage
3 Insert small spring-steel clips to hold the slide firmly to the brass block and ceramic foot pads toprevent heat loss through contact with the microscope stage (Fig 10C)
Commercial Environmental Systems
Commercial temperature-control systems are available in a wide range of configurations styles optionsand price ranges Some systems are similar to the basic system described above and contain nothingmore than an aluminum slide holder connected to a resistive heating coil (httpwwwinsteccom)Others typically designed for mammalian cell microscopy are elaborate temperature-regulated circulat-ing dishes (httpwwwbioptechscom) These systems are not well suited to yeast work because mostmammalian studies use adherent cells that bind tightly to the coverglass whereas yeast cells float or spinaround continuously Finally acrylic chambers that enclosemost of themicroscope are also available andcan be used to control the air temperature as well as that of the microscope (httpwwwlischtheboxhtml) This type of system has the advantage of keeping the entire microscope stage and objective atthe desired temperature but the cost is significantly greater than a stage-mounted controller Regardlessof what system is used the temperature of the slide must bemonitored as close to the sample as possibleusing a small thin-film RTD temperature sensor and a digital thermometer (httpwwwomegacom)Wefind that the actual temperature of the sample typically differs by 1˚Cndash3˚C from the temperature of thecirculating bath
wwwcshprotocolsorg 1037 Cold Spring Harbor Protocols
PRO
TOC
OLS
Co
ld S
pri
ng
Har
bo
r P
roto
cols
ww
wc
shp
roto
co
lso
rg
Limiting Geometric Aberrations
Imperfections in lens geometry or sample mounting directly affect the shape of the PSF in distinct ways(Fig 11) A tilted or misaligned lens skews the PSF so that it is no longer perpendicular to the optical stackor is bent in half (Fig 11B) A PSF of this type suggests a significant problemwith tilt and centration in the
FIGURE 11 Lens aberrations and spherical aberration (A) Anideally shaped lens should collect photons symmetrically froma single focused point shown by the red and green lines Withthe correct immersion medium the light from a single fluo-rescent point source results in a spherically correct or symmetricPSF (B) Improperly aligned elements within the objective lensresults in PSF deformation A lens can be misaligned laterally(eg centration) or in a slightly tilted configuration Lens con-struction problems cause the PSF to be altered perpendicularto the x-z plane or bent asymmetrically about the point sourceorigin (C ) Aberrations in the PSF can also occur when imperfec-tions in the curvature of the glass cause light to be collected fromdifferent axial-shifted positions in space and result in axial asym-metry (also known as spherical aberration) Spherical aberra-tions can additionally result from using an immersion oil withthe wrong refractive index All aberrations lead to a reductionin the signal intensity strength and distortions in the final image
FIGURE 10 Temperature controller block and objective lens assembly (A) Liquid-controlled thermal block for maintainingspecimen slides at desired temperature Channels through the block allow liquid to flow in through one port and out theother The block can be fabricated with a large hole bored directly through the center to allow bright-field illuminationon the specimen slide (normally attached to the bottom of the block for inverted microscope configurations) Flatceramic blocks can be added to the bottom of the block to insulate the block and specimen slide from the microscopestage (B) Commercial liquid-regulated thermal collar for an objective lens The ring is incorporated into the liquid circulatingsystem typically provided from a temperature-controlled circulating water bath (C ) Thermal block in upside-down con-figuration Small aluminum clips and screws are used to hold the specimen slide to the underside of the block for invertedmicroscope configurations Screws and clips can be added to the top of the block for upright configurations (D) Fullyassembled thermal block with specimen slide and mounting oil placed over inverted microscope objective
wwwcshprotocolsorg 1038 Cold Spring Harbor Protocols
PRO
TOC
OLS
Co
ld S
pri
ng
Har
bo
r P
roto
cols
ww
wc
shp
roto
co
lso
rg
objective and cannot be corrected by the user When the PSF symmetry is disrupted in the longitudinal oraxial dimension (Fig 11C) spherical aberration is the problem Spherical aberration can arise from prob-lems with the objective or the use of immersionmedia with the wrong refractive index The small size of ayeast cell relative to the resolution limit of an optical microscope requires that spherical aberration beminimized because even small axial aberrations lead to relatively large errors Spherical aberration canbe reduced dramatically by selecting an immersion medium with the proper refractive index
Refractive Index Matching Using Immersion Media
Immersion lenses are designed towork with either oil- or water-basedmedia but not both as specified onthe side of the lens housing The higher the refractive index of the immersion oil the greater the extent towhich light is bent into the objective therefore the highest-NA lenses are oil immersion (see Fig 3)Environmental factors particularly temperature affect the refractive index of the mounting and immer-sion medium and mismatches in either cause spherical aberration By changing the refractive index ofthe immersion medium within a narrow range it is possible to correct for differences in the culturemedium coverglass thickness and temperature Kits with immersion oils having refractive indexesbetween 1500 and 1534 in increments of 0002 can be obtained from Applied Precision (httpwwwapicom) or Cargille Laboratories (httpwwwcargillecom) Choosing which oil to use for agiven temperature is determined empirically based on a visual analysis of the PSF with different oilsWhen the angle of light dispersion is greater above the point source than below it the refractiveindex of the mounting medium is too high and vice versa (Fig 11C) When the PSF is nearly symmetricin z the correct refractive index must be determined We find that when imaging live yeast at 30˚C withno 15 coverglass a refractive index of 1518 is typically appropriate at 37˚C the correct refractiveindex can be as high as 1526 or 1528 Although oil matching can be tedious at first the processbecomes routine over time and the results are worth the effort
Experimental Determination of PSF
Determining the PSF of an objective under typical imaging conditions can help to identify flaws in theobjective and problems with sample preparation The following protocol describes an approach forthe experimental determination of PSF
1 Dilute a set of small fluorescein isothiocyanate (FITC)-conjugated beads in the samemedium as is usedfor mounting cells (SC medium supplemented with a Complete Supplement Mixture of amino acids[Bio101 (httpwwwBio101com)] 20 microgmL of additional adenine and a carbon source)
2 Add 22 microL of the bead mixture to a coverglass coated with poly-L-lysine and seal it with nail polishonto a standard microscope slideAn initial immersion oil with a refractive index of 1516 is a good starting point for imaging at room temperature
3 While focusing the lens above through and beyond the point source (using the motorized system)collect sections at regular intervals (eg every 0020 microm)
4 Examine by eye the symmetry and extent of blurring once the stack of optical z-sections are rotated upby 90˚ and viewed from the side (Fig 11A)The spherically correct PSF is completely symmetric both above and below the point source as well as circularlysymmetric
5 Change the immersion oil refractive index until a symmetric PSF is obtained
PHOTODAMAGE
As discussed above phototoxicity and photobleaching are significant problems in live cell analysis Theexact mechanism of GFP photobleaching has not been elucidated What is known is that the protein isneither destroyed nor degraded rather continuous or long-term repeated exposure to excitation wave-lengths irreversibly alters the GFPmolecule so that it can no longer fluoresce This property can be utilizedin fluorescence recovery after photobleaching (FRAP) experiments and is a common approach to study-ing cytoskeletal dynamics
wwwcshprotocolsorg 1039 Cold Spring Harbor Protocols
PRO
TOC
OLS
Co
ld S
pri
ng
Har
bo
r P
roto
cols
ww
wc
shp
roto
co
lso
rg
Phototoxicity indirectly describes a general class of harmful effects on live cells based on either long-term or short but extreme exposures to a light source Phototoxicity ismuchmore difficult to discern thanphotobleaching because it is harder to measure directly and can be a consequence of DNA damage (UVlight) or protein damage (infrared light) In addition excessive excitation of a fluorophore can lead tooxide radical formation and may also negatively impact cell growth To avoid unpredicted effectsduring live cell acquisition it is important to incorporate interference filters into the microscopesystem Quite often multiple filters can be piggybacked on top of one another Alternatively specialfilters can be ordered that have the appropriate filters fused together (httpwwwchromacom andhttpswwwomegafilterscom) Performing 3D microscopy on cells exaggerates the negativeeffects of photobleaching and phototoxicity The acquisition of multiple optical sections requires con-tinuous or repeated exposure by a magnitude based on the number of sections taken Consequentlyperforming live cell analysis with fluorescent light mandates attention to detail and proper microscopeconfigurations
To minimize photobleaching a bandpass excitation filter (eg Chroma HQ47040X) and aninfrared-blocking filter can be combined in series with the emission filter to block unwanted infraredand UV irradiation In addition neutral-density filters can be used to reduce the intensity of excitatoryillumination across all wavelengths These filters are described by a number that increases in value asthe percent transmission falls Such filters are available from 0100 (80 transmission) up to 30(010 transmission) With all filters maintenance is also required over time This is especially true forthose filters immediately exposed to an intense light source such as excitation and neutral-densityfilters We have found that these elements will fade develop small imperfections and experiencepinhole defects over time and should be replaced after ~6 mo of heavy use
The best exposure time and neutral-density filter combination must be determined empirically anddepends on how frequently repeated exposure is required and on the dynamics of the process beingimaged We have found that 50 msec and a 0500 neutral-density filter works best for rapid acquisitionmovies where 14ndash20 optical z sections are taken every 5 sec This combination allows us to acquire amovie with 120 time points up to 10-min long using enhanced GFP-labeled spindle pole bodies andsingle chromosome tags
FUTURE DEVELOPMENTS
During the next several years expect important developments to occur in live cell microscopy and auto-mated image analysis Machine vision methods have the potential to greatly accelerate the rate at whichimage information can be converted into quantitative information formechanistic and screening studiesIn addition machine vision methods can extend the resolution limit of microscopes beyond the Rayleighlimit and can process images that are too indistinct for human interpretation Machine vision thereforehas the potential to overcomemany of the practical problems associated with live cell imaging includingphototoxicity and photobleaching large data streams and subjective data analysis
WWW RESOURCES
httpwwwchromacom (Chroma Technology) Excellent onlinehandbook of filter basics GFP filter brochure and absorption spectra
httpwwwhamamatsucom (Hamamatsu Photonics) Leadingcamera manufacturer
httpwwwmicroscopyfsuedu (Molecular Expressions Primer) Excel-lent source of microscopy information many interactive demos forunderstanding important concepts
httpswwwomegafilterscom (OmegaOptical) Curv-o-matic viewingof filter spectra online
httpwwwroperscientificcom (Roper Scientific) Good technicallibrary from a leading camera manufacturer
REFERENCES
Bobroff N 1986 Position measurement with a resolution and noise-limited instrument Rev Sci Instrum 57 1152ndash1157
Bullitt E Rout MP Kilmartin JV Akey CW 1997 The yeast spindle polebody is assembled around a central crystal of Spc42p Cell 891077ndash1086
Ciosk R Zachariae W Michaelis C Shevchenko A Mann M NasmythK 1998 An ESP1PDS1 complex regulates loss of sister chromatid
cohesion at the metaphase to anaphase transition in yeast Cell 931067ndash1076
Inoue S 1995 Microscopes In Handbook of optics 2nd ed (ed Bass Met al) Vol 2 pp 171ndash1750 McGraw-Hill New York
Ishiguro J 1989 An abnormal cell division cycle in an AIR carboxylase-deficient mutant of the fission yeast Schizosaccharomyces pombeCurr Genet 15 71ndash74
wwwcshprotocolsorg 1040 Cold Spring Harbor Protocols
PRO
TOC
OLS
Co
ld S
pri
ng
Har
bo
r P
roto
cols
ww
wc
shp
roto
co
lso
rg
Spector DL Goldman RD 2003 Essentials from cells A laboratorymanual (Laboratory Essentials on CD) Cold Spring Harbor Labora-tory Press Cold Spring Harbor NY
Stotz A Linder P 1990 The ADE2 gene from Saccharomyces cerevisiaeSequence and new vectors Gene 95 91ndash98
Straight AF Belmont AS Robinett CC Murray AW 1996 GFP taggingof budding yeast chromosomes reveals that proteinndashprotein
interactions can mediate sister chromatid cohesion Curr Biol 61599ndash1608
Thomann D Rines DR Sorger PK Danuser G 2002 Automatic fluo-rescent tag detection in 3D with super-resolution Application tothe analysis of chromosome movement J Microsc 208 49ndash64
Tsien RY 1998 The green fluorescent protein Annu Rev Biochem 67509ndash544
wwwcshprotocolsorg 1041 Cold Spring Harbor Protocols
PRO
TOC
OLS
Co
ld S
pri
ng
Har
bo
r P
roto
cols
ww
wc
shp
roto
co
lso
rg

with a consequent reduction in temporal resolution This article briefly discusses the physics that underliethe limitations inherent in optical microscopy and the ways live cell imaging can be optimized withinthese limits
SPATIAL AND TEMPORAL RESOLUTION
The two most frequent questions in microscopy concern resolution What is the smallest object that canbe detected How close can two objects be and remain distinct in the image The resolution of opticalmicroscopes is limited by the diffraction of light as it passes through circular apertures in the objectivelens and other optical elements All microscopes are subject to this effect which is typically referred toas the ldquodiffraction limitrdquo Light from a point source object which is necessarily below the diffractionlimit is spread out to generate a blurred distribution known as the point-spread function (PSF) This dis-tribution is narrower in the x-y plane than along the z axis and its central portion resembles an elongatedellipse standing on end (Fig 1AB) Occasionally the PSF will be referred to as the ldquoimpulse responserdquo ofthe microscope because it represents the output in response to a point source impulse or input It turnsout to be remarkably useful to examine the PSF of an objective lens under real imaging conditions (seebelow) Imaging small point sources in a real biological sample (eg fluorescently tagged spindle polebodies) can be used to confirm the quality of images by checking that the blurred image resembles asymmetric PSF Asymmetry in the PSF along the z axis is known as ldquospherical aberrationrdquo and is only cor-rected by selecting an immersion oil with a different refractive index (see the section on Refractive IndexMatching Using ImmersionMedia) Normally the elliptical shapewould be seen along the z axis (Fig 1B)as well as a bright circle with multiple concentric rings of rapidly decreasing amplitude in the x-y plane(Fig 1C) The central part of this pattern is referred to as the Airy disk and contains ~85of the total lightthe concentric rings contain the remaining 15 Restoration or deconvolution microscopy uses infor-mation about the PSF to increase the sharpness of an image by attempting to re-create the original objectfrom its blurred image
Spatial resolution is typically defined using the Rayleigh criterion in which two point sources areconsidered to be distinctly resolvable when they are separated by no less than a distance dR
xy fromeach other in the x-y plane (perpendicular to the optical axis) and dR
z in the z plane (parallel to theoptical axis) (Inoue 1995)
dRxy = 061
l
NA dR
z = 2ln
NA2
The Rayleigh distance is the point at which the first minimum in the diffraction-induced pattern(Fig 2A) of one point source overlaps the maximum in the second (Fig 2BC) Resolution increases
FIGURE 1 Point-spread function (PSF) (A) Light collected from afluorescent point source (eg a small bead) is smeared The smear-ing effect is a well-understood phenomenon and can be modeledcomputationally (Thomann et al 2002) (B) Complex pattern ofsmearing is commonly referred to as the PSF and is a characteristicof lens magnification construction immersion medium coverglassand any cellular components between the focal plane and lens Aperfect PSF will have symmetric cones of light above and belowthe point source This effect is best observed by optical z sectioningthrough a single point source Light from the z stack when vieweddirectly from the side generates the pattern or distribution shownhere (C ) The large circular pattern represents a view of the PSFfrom above and is commonly referred to as an Airy disk Thesignal intensity is represented by the density shading
wwwcshprotocolsorg 1027 Cold Spring Harbor Protocols
PRO
TOC
OLS
Co
ld S
pri
ng
Har
bo
r P
roto
cols
ww
wc
shp
roto
co
lso
rg
with higher numerical aperture (NA) in the objective lens and decreases with higher-wavelength (A) orrefractive index (n) values Thus with a 100times 14 NA objective the Rayleigh resolution limit with greenlight is ~250 nm in the x-y plane and ~700 nm in the z plane It is important to note that this resolutioncan only be achieved under optically ideal circumstances in which spherical aberration has been mini-mized (see the section on Refractive Index Matching Using Immersion Media) Image restorationmethods are designed to compensate for optical blurring but not for sample preparation problems orpoor instrument alignment Fortunately yeast cells are sufficiently small that we need not concern our-selves with sample-induced light scattering and depth-dependent aberrations that normally complicateimage collection when working with tissues and other thick specimens
In live cell imaging we are also concerned with temporal resolution Sampling must be sufficientlyfrequent to capture critical dynamics without loss of information For instance a dynamic processdescribed by a periodic waveform (eg the oscillation of chromosomes) must be sampled at no lessthan the Nyquist frequency which is defined as twice the highest frequency in the original waveformDiscrete sampling below the Nyquist frequency results in misestimation of the original waveformrsquos fre-quency Temporal aliasing is a serious concern in live cell imaging of yeast because wide-field 3D micro-scopes are currently unable to capture an image stack in lt1ndash2 sec Thus we cannot hope to follow aprocess with a frequency above 025ndash05 Hz
IMAGE INFORMATION CAPACITY
The Rayleigh formulation for resolution assumes noise-free images In reality noise is amajor determinantof both the detectability and resolvability of objects For example even if two point sources are resolvableby Rayleigh criteria it may be impossible to distinguish them if the amplitude of the noise exceeds thedepth of the minimum in the intensity profile When considering the detectability of small faintobjects it is also important to consider both the level of the noise and the blurring effect of the opticsWe can consider the impact of noise on images in a general sense by thinking about a microscopesimply as an information transfer system with three spatial (x y z) and one temporal channel As firstshown by Shannon the information capacity C of such a system is C = f log(1 + SNR) where f is thecontinuous bandwidth of the microscope in all four channels As the SNR falls the information capacity(the information about the image that can be conveyed by the microscope) falls and is completely lostwhen the SNR reaches 0 The bandwidth is itself a function of the cutoff frequencies of the objective lensTo understand why this cutoff exists recall that a lens decomposes an image into its frequency com-ponents such that the lowest-frequency components (those containing the least detail) are towardthe center of the optical axis and the higher-frequency components (those containing more imagedetail) are toward the edge (Fig 3) Thus as the half-angle (ltθgt) of collected light increases so doesthe objectiversquos ability to collect higher frequencies and better resolve small objects Viewed in anotherway the fixed diameter of the objective limits the maximum frequency that can pass the cutoff
FIGURE 2 Rayleigh resolution criteria Green spheres in insets represent two identical point sources in close proximityGreen curves show fluorescent intensity of one point source red curves represent intensity of other source black curvesshow the cumulative signal from both point sources (A) A three-dimensional representation of an Airy distributionZeroth order is represented by the large peak in the center and successive orders occur in the circular radial bands (B)When two objects are in close proximity to one another where the Airy patterns overlap bylt42 of themaximal intensitiesthe objects are individually resolvable (equal intensity objects) Rayleigh resolution limit (dR) represents the minimum dis-tance the two objects can be to each other (C ) If the objects move together with gt42 of their maximal intensity overlap-ping the ability to resolve the objects as distinct is no longer possible Notice that the two maxima are closer than theRayleigh resolution limit
wwwcshprotocolsorg 1028 Cold Spring Harbor Protocols
PRO
TOC
OLS
Co
ld S
pri
ng
Har
bo
r P
roto
cols
ww
wc
shp
roto
co
lso
rg
frequency Vc to an extent that varies with ltθgt
vc = 2NAl
NA = n(sin u)
All frequencies larger than Vc which would define the fine structures of the object are not conveyedby the objective lens and therefore cannot appear in the image (n = refractive index of medium) Theprecise relationship between resolution and SNR depends on specific properties of the image and theway it is processed but a typical result from point object tracking is shown in Figure 4 The importantpoint here is that it is ultimately both the cutoff frequency of the objective lens and the SNR that limitresolution and detectability under low-light conditions Factors in the imaging system that affect SNRare discussed in detail below
BRIGHTNESS
An additional question that is frequently asked and one of particular relevance for live cell imaging ishow bright an object must be to be detectable Detectability increases with the intrinsic brightness (B)of the object being imaged and the SNR of the image Increasing the SNR is a significant problem inlive cell imaging because photobleaching and photodamage prevent us from increasing the intensityor duration of the illumination indefinitely Instead we must ensure that incident (excitation) photonsare efficiently converted into fluorophore (emitted) photons In other words as many emittedphotons as possible need to be collected by the objective and passed through the microscope to thecamera and the camera must be optimally configured to convert these emitted photons into an elec-tronic signal We consider each of these issues in turn and in all cases concentrate on epifluorescenceimaging
The intrinsic brightness of a fluorescently tagged object depends on the number of fluorophores perunit volume (density) the probability that an excitation photon will be absorbed (the extinction coeffi-cient of the fluorophore) and the probability that a photon will be emitted by the fluorophore in
FIGURE 3 Comparing light collected from different NA objectives Shown are two lenses with different NAs (low NA on theleft high NA on the right) Black lines represent half-angle cone of light collected by the objective as determined by the NA ofthe lens the greater the half-angle (ltθgt) the larger the NA value The lens on the left (A) has a smaller NA than the one onthe right (B) thus e1 lt e2 (Red dashed lines) Normal dispersion of emitted light from a single fluorescent point source afterpassing through a coverglass Note that higher-NA objectives collect more light emitted from sample In addition use ofrefractive matched immersion oil limits excess refraction and enhances the number of photons collected by an objective(solid red line) The effects on image detail are illustrated about each objective with respect to the cutoff frequency Thehigher-NA lens produces a more defined image because it can collect the higher frequencies not available in thelow-NA lens
wwwcshprotocolsorg 1029 Cold Spring Harbor Protocols
PRO
TOC
OLS
Co
ld S
pri
ng
Har
bo
r P
roto
cols
ww
wc
shp
roto
co
lso
rg
response to an absorbed photon (the quantum yield) It is also important to consider the differencebetween the excitation and emission wavelengths (the Stokesrsquo shift) When the excitation and emissionwavelengths are close it is difficult to block all of the excitatory photons and collect only the much lessnumerous (~10ndash6-fold) emitted photons GFP has a relatively small extinction coefficient quantum yieldand Stokesrsquo shift when compared to chemical fluorophores but some GFP variants are better than others(Tsien 1998) Moreover enhanced GFP has good photostability making it the best fluorophore for livecell imaging Preliminary evidence also suggests that the intrinsic brightness of a protein can be increasedconsiderably by fusing it to two tandem GFP tags When deciding what proteins in a multiproteincomplex to label it is also helpful to choose those that are concentrated in a small area (for simplicitywe are ignoring possible complications from proximity-induced fluorescence quenching) Thus totrack the growth and movement of mitotic spindles in living cells we decided to GFP-tag Spc42p aprotein that is present in many copies at the spindle pole bodies rather than tubulin which formsextendedmicrotubule-based structures (Fig 4A) The spindle pole bodies are smaller than the diffractionlimit of themicroscope (~024 microm) (Bullitt et al 1997) and therefore appear as bright spots independentof magnification It is relatively simple to determine the center of these fluorescent spots and therebymeasure the length and orientation of the spindle (Fig 4BC) In contrast it is difficult to measurewith precision the extent of tubulin in the spindle
Choosing an Objective
Although many aspects of a microscopersquos optics affect the brightness of a feature none are as importantfor fluorescent imaging as the NA of an objective lens (Fig 3) (for review see Spector and Goldman
FIGURE 4 Dependence of localization error and resolution on SNR in a typical application (A) Maximum intensity projec-tion of an S cerevisiaemitotic spindle Spindle pole bodies (SPBs) are marked with GFP-tagged Spc42p and the centromereproximal DNA is marked on chromosome III (CEN) with a TetOTetR GFP-tagging system (Straight et al 1996 Ciosk et al1998) (B) Gaussian approximation of the PSF for a fluorescent point source in the x-y plane (C ) Same as Bwith respect to thez plane Note that distribution of Gaussian is greater in the z plane compared to the x-y plane The combination of the twoapproximations describes the shape of a fluorescent point source in 3D (D) The error in localizing a single-point sourceobject as a function of the SNR (E) The localization error as a function of the point-to-point distance calculated for threedifferent SNR values Note that the horizontal axis points from high to low SNR The graph confirms the well-known factthat center positions of features with a known intensity distribution in our case the distribution of the PSF can be determinedwith sub-20-nm precision (Bobroff 1986) For SNR gt15 the precision even reaches the single-nanometer range Withshorter separation distances the accuracy decreases the Rayleigh limit is denoted by a dashed vertical line dxy is the sep-aration distance between two spots and σxy is the width of the Gaussian distribution (D and E Reprinted from Thomannet al 2002 with permission from Wiley copy 2002)
wwwcshprotocolsorg 1030 Cold Spring Harbor Protocols
PRO
TOC
OLS
Co
ld S
pri
ng
Har
bo
r P
roto
cols
ww
wc
shp
roto
co
lso
rg
2003) The observed brightness of a fluorescent image (b) is
b asymp BNA4
M2
( )E
where B is the fluorescent brightness of the object M is the magnification NA is the objective lensrsquosnumerical aperture and E is the transmission efficiency of the optics All other factors being equal it isimportant to use the highest-NA lowest-magnification lens available In the case of diffraction-limitedpoint-source objects magnification does not affect brightness As a practical matter all high-NA micro-scope objectives are also highmagnification and are typically available with 60ndash100timesmagnifications Foryeast a 100times 14 NA lens is usually optimal With regard to the transmission efficiency of the optics (E) itis important to avoid objectives designed for phase contrast because the phase ring causes ~30reduction in transmission Similarly it is important to remove differential interference contrast (DIC)-phase plates and prisms from the optical path because they also reduce light transmission by asmuch as 70 Fully color-corrected flat-field (Plan-Apochromat) objectives typically exhibit 75ndash85transmission for 400- to 700-nm light It is possible to increase the transmission by a small but significantextent by using less than fully color-corrected objectives Overall the rule in live cell imaging is to use thehighest-NA objective that is designed for epifluorescent imaging rather than for phase contrast
Filters and Dichroic Mirrors
To select the desired excitation and emission wavelengths epifluorescence microscopes make use ofthree optical elements an excitation filter a dichroic mirror (beam splitter) and an emission filterA typical arrangement is detailed in Figure 5 and a full range of absorption spectra can be downloaded
FIGURE 5 Filtering elements in a typical epifluorescent microscope system (A) Light consisting of all wavelengths from thevisible spectrum enters a set of neutral-density UV and infrared filters to block excessively damaging light rays (B) Wave-lengths are then filtered by passing through the excitation filter Only those photons between 450 and 500 nm pass throughthis filter before being reflected by the angled beam splitter (dichroic) to the objective lens and to the specimen slide (C ) Thebeam splitter not only selectively reflects photons from the excitation wavelength but also allows photons emitted from thespecimen to pass directly through In this example only those photons between 450 and 500 nm are reflected The photonsemitted from the GFPmolecules (510ndash530 nm) and any background fluorescence pass down through the splitter toward theemission filter (D) Light slipping through the beam splitter is selectively blocked so that only those photons between 500 and550 nm are passed through to the eyepiece or CCD (charge-coupled device) camera Thus the emission filter helps toreduce autofluorescent signals and excitation wavelengths that slip through the beam splitter The graph of Chroma41047 shows the overlapping image spectra from each of the individual elements for the GFP bandpass filter set
wwwcshprotocolsorg 1031 Cold Spring Harbor Protocols
PRO
TOC
OLS
Co
ld S
pri
ng
Har
bo
r P
roto
cols
ww
wc
shp
roto
co
lso
rg
from Chroma Technology Corp Omega Optical and other vendors Broad-spectrum light from themercury or xenon burner first passes through a series of infrared and UV-blocking filters near the rearof the microscope (Fig 5A) and then through an interference filter that allows only excitation wave-lengths to pass (Fig 5B) Excitatory illumination is then reflected by the dichroic mirror toward the objec-tive lens and the sample (Fig 5C) Emitted photons from the sample are collected by the objective andpass through the dichroic and then through an emission filter on their way to the camera or occulars(Fig 5D) Filter manufacturers such as Omega Optical (httpswwwomegafilterscom) and ChromaTechnology Corp (httpwwwchromacom) offer filters in sets suitable for various applications Inmany cases all of the optical elements are mounted in a single holder known as a filter cube In micro-scopes with automatic wavelength selection the dichroic mirror is mounted in the cube whereas theexcitation and emission filters are mounted in separate motorized wheels
We have encountered a considerable degree of confusion surrounding the selection and assemblyof filter sets The issue is easy to understand however if one makes reference to spectral plots and thegeometry of an epifluorescence microscope (Fig 5) Wavelength filtering in epifluorescence micro-scopes relies on a special property of dichroics They reflect light shorter than a characteristic wavelengthbut are transparent to longer wavelengths (polychroic beam splitters have several transitions betweenreflection and transmission) Short-pass and long-pass emission and excitation filters are describedby a wavelength that denotes the point of inflection between transmission and absorption (Fig 6AB)Alternatively bandpass filters are described by the wavelength of peak emission (the center wavelength)and the width of the allowable band (the full width at half-maximum transmission eg 52020) Byexamining the characteristics of each element in a set it is possible to choose sets for a particularapplication but some experimentation with individual elements is advisable to fully optimize theoptical train
Live cell imaging of GFP-labeled yeast cells presents some special problems in filter set design and atrade-off must be made between sensitivity and selectivity Because the Stokesrsquo shift of GFP is small it iscommon to pass all of the emitted photons from the sample while sacrificing somewhat on the excitationside In some yeast strains autofluorescence is a significant problem and filter sets must be assembled bythe user tominimize the backgroundWe have found that a long-pass GFP (Chroma HQ500LP) emissionfilter provides good sensitivity for single-color recording of yeast cells expressing enhanced GFP Whenautofluorescence is a problem particularly with adendash strains (see below) use of the bandpass GFP(Chroma HQ52550m) emission filter is preferred In dual-color imaging filter and fluorophore combi-nations must be examined closely for overlapping wavelengths However combinations with cyan fluo-rescent protein (CFP)GFP or CFPYFP (yellow fluorescent protein) are usually quite successful It is bestif the less-abundant protein is tagged with GFP because GFP is significantly brighter than CFP and isless likely to photobleach It should also be noted that CFP and YFP can be used as a FRET (fluorescenceresonance energy transfer) pair
The shortest exposures and lowest possible illumination should be used for live-sampleexcitation With our GFP-labeled spindles and tagged chromosomes we typically collect 50-msecexposures per z section and use neutral density (ND) filters to reduce the incident illumination fivefoldto 10-fold A broad range of neutral density filters are available and should be kept on hand forthis purpose
FIGURE 6 Filter types (A) Low-pass filter selectively allows only wavelengths below 550ndash600 nm to pass in this exampleLonger-wavelength photons are blocked by the element (B) High-pass filter designed to allow wavelengths above 550ndash600nm to pass through (C ) Bandpass filter blocks both short and long wavelengths while allowing only light from 525ndash625 nm topass through
wwwcshprotocolsorg 1032 Cold Spring Harbor Protocols
PRO
TOC
OLS
Co
ld S
pri
ng
Har
bo
r P
roto
cols
ww
wc
shp
roto
co
lso
rg
Setting Up the Camera
Camera design and configuration are critical variables in determining the brightness of images and theextent to which features can be discriminated Because they are invariably more efficient than colorcameras we consider here only the monochromatic charge-coupled device (CCD) cameras In a micro-scope system connected to a monochromatic camera exposures are taken with different excitation andemission filters and color is introduced after the fact by assigning a hue to each exposure based on theproperties of the filter The construction of CCD cameras is a relatively complex topic that we will notcover in any detail but to optimize camera performance it is helpful to have a basic understanding oftheir operation (Fig 7) At the core of a CCD camera is a chip containing a rectangular area of photosen-sitive detectorsmdashpixelsmdashthat convert photons into electrons with a particular quantum efficiency (QEwhich varies with wavelength and is typically 60ndash80 for blue-green light) After an exposure istaken the number of electrons generated at each pixel is determined by an analog-to-digital converter(ADC) Cameras typically have only one ADC and the electrons in each pixel of the CCD must thereforebe moved to the ADC via a series of positional shifts until the entire chip has been read (Fig 7) Thuseven though a CCD camera collects photoelectrons at each pixel in a parallel process the pixels areread serially Serial readout significantly limits the rate at which CCD cameras operate and thus thefewer the number of pixels read the greater the rate at which successive frames can be recorded (com-monly referred to as frame rate) One simple way to increase frame rate is to limit the area of the CCDbeing read by the ADC Yeast cells are sufficiently small even with a 100times objective where a 64 times64-pixel or 128 times 128-pixel area of the CCD is usually sufficient A second method to increase framerate is to add the contents of adjacent pixels together prior to their arrival at the ADC in a processknown as on-chip binning Besides faster readout binning increases the SNR at the cost of lowerimage resolution To understand the impact of binning on an image note that the pixels in a CCDarray perform a discrete sampling of the image which is a continuously varying two-dimensional wave-form The pixel array must therefore by Nyquist criteria sample the image at twice the frequency of thehighest spatial frequencies in the image The highest frequency in the image is determined by the cutofffrequency Vc of the objective We can therefore determine the pixel spacing px as follows
px le lM4NA
With a 100times 14 NA objective the largest acceptable pixel spacing is 89 microm For instance aRoper CoolSNAP HQ interline CCD camera has a pixel size of 625 times 625-microm without binning and
FIGURE 7CCD chip architecture (A) Photons coming from themicroscope hit the surface of the CCDphotosensitive detec-tors These photons are registered and incrementally counted as electrons for the desired exposure duration The electroncount is converted into signal intensity by a single read buffer (ADC) at the top of the array To read each line from the CCDarray the information must be shifted up one line at a time until the entire image is transferred into the read buffer and readout sequentially (B) Once complete the raw digital image can be reconstructed from the individual intensity values (C )Properties of a typical high-performance interline CCD camera
wwwcshprotocolsorg 1033 Cold Spring Harbor Protocols
PRO
TOC
OLS
Co
ld S
pri
ng
Har
bo
r P
roto
cols
ww
wc
shp
roto
co
lso
rg
with a 100times 14 NA objective lens oversamples the image 14-fold (relative to the Nyquist criteria) This isreasonable for small diffraction-limited objects In contrast 2 times 2 binning (to create 125 times 125-micromsuperpixels) would be detrimental
CCD cameras are subject to three sources of noise dark noise photon noise and read noise Darknoise refers to the random generation of electrons within the photosensitive elements of the CCDarray from heat rather than by photon absorption Modern microscope cameras cool the CCD tobetween minus30˚C and minus50˚C effectively making dark noise negligible Photon noise also known asshot-noise arises from variations in the flux of photons in a beam of constant intensity Photonnoise exhibits Poisson statistics varying with the square root of the signal and is an intrinsic featureof photons that cannot be eliminated by changes in camera design and setup Read noise refers touncertainty in the measurement of photoelectron number introduced by limitations in the preampli-fier ADC and other electronics in the camera (httpwwwroperscientificcom) Read noise is a func-tion of the quality of the camera and the care that has been taken in designing the electronics but fora given camera the faster the read rate of the camera the greater the noise Ideally imaging should beperformed under conditions in which the physics of photon counting and not the camera design islimiting Under these conditions commonly referred to as photon-limited imaging photon noise isthe greatest contributor to overall noise However it is not always possible to work in this rangewith live samples and we typically find ourselves recording in the instrument-limited range Underthese circumstances it is important to find the lowest-noise cameras and lowest-noise settings Forexample with a CoolSNAP camera recording 50-msec exposures on a 128 times 128 area of the CCD wehave observed a dramatic increase in SNR but little decrease in frame rate by dropping from a20-MHz read rate to 10 MHz
In summary for live cell imaging of yeast it is usually best to use only a fraction of the area of amega-pixel CCD camera This makes it possible to increase the frame rate while keeping the ADC read rate aslow as possible to increase SNR In general avoid binning the image but before accepting this nostrumit is best to perform the simple calculation mentioned above to see if this is also true for the microscopebeing used If it allows binning then the image SNR will increase because the signal becomesphoton-noise-limited at a lower overall intensity Before leaving the topic of cameras however it isworthmentioning interline CCD architectures which have a significant impact on frame rate In an inter-line CCD a set of masked (nonphotosensitive) pixels are interleaved between the primary photosensitivedetector lines Such interline CCDs have a primary recording array and a second masked array An entireframe can be shifted in parallel from the recording to themasked array and themasked array can then bedigitized while the primary array is recording a subsequent exposure This makes it possible to record suc-cessive frames without a shutter Historically interline CCDs have had the drawback that the interlinemasks reduce the fraction of the chip that responds to light and therefore reduce camera sensitivityRecent cameras circumvent this problem by including a small lens for each pixel that focuses the lightfrom masked elements onto photosensitive elements thereby achieving both increased speed andincreased sensitivity Interline CCD cameras currently represent the best option for high-speed live cellimaging (Fig 7C)
PREPARING AND MOUNTING SAMPLES FOR LIVE CELL IMAGING
Quite often the most tedious parts of live cell microscopy are keeping cells growing proficiently andpreventing them from floating around during an imaging session The following sections describeprocedures for selecting appropriate strains preparing the culture and maintaining cells in a suitableenvironment
Strains and Growth
Autofluorescence can be a significant problem in yeast if cultures are grown under poor conditionsespecially whenworking with adendash strains In adendash strains a colored intermediate in adenine biosynthesisphosphoribosylaminoimidazole accumulates to high levels in the absence of exogenous adenine and ishighly fluorescent when excited with blue light (Stotz and Linder 1990) In fact it is the phosphoribosy-laminoimidazole that gives adendash yeast cells the distinctive red color used in genetic sectoring assays(Ishiguro 1989) Autofluorescence can be minimized by using ADE+ genetic backgrounds and growingcells in synthetic complete (SC) medium supplemented with essential amino acids and 20 microgmL extra
wwwcshprotocolsorg 1034 Cold Spring Harbor Protocols
PRO
TOC
OLS
Co
ld S
pri
ng
Har
bo
r P
roto
cols
ww
wc
shp
roto
co
lso
rg
adenine Additionally cultures should be maintained below 5 times 106 cellsmL for 4ndash10 generations andthe medium should be refreshed prior to mounting and imaging
Slide Preparation
Although it is possible to mount live yeast cultures directly under a coverglass we have found it quitedifficult to avoid physical damage and to hold cells in a fixed position using direct mounting Thuswe recommend mounting cells on a pad of 12 agarose formed in a slide that contains a shallowdepression This system not only holds the cells in place better and prevents accidental shearing butit also provides cells with a significant volume of nutrients to help maintain cell viability The use ofagarose pads is particularly important for time-lapse experiments and we have successfully used themto maintain cells at wild-type growth rates for 8 h or more (Fig 8)
Preparing Slides with an Agarose Cushion
1 To prepare the agarose solution combine 10 microL of SC medium supplemented with a Complete Sup-plement Mixture of amino acids (Bio101 httpwwwBio101com) 20 microgmL of additional adenineand a carbon source (eg 2 wv glucose) with 12 (wv) agarose Heat the solution in a micro-wave to completely melt the agarose
2 Add 200 microL of melted agarose solution to a 60˚C prewarmed slide fabricated with a shallow 18-mmhemispherical depression (VWR httpwwwvwrcom) (Fig 9A) Quickly cover the agarose-filleddepression with a regular microscope slide (the top slide) by placing it directly onto the agaroseUsing the thumbs press evenly against the top slide for 1min to allow the agarose to harden (Fig 9B)Excess agarose will squeeze out from the edges It is essential that no air bubbles be trapped in the agarose during thisprocess and that the agarose forms a smooth flat surface with the slide To prevent dehydration leave the top slide inplace until cells are ready for mounting
3 Prepare a 22 times 22-mm no 15 (016- to 019-mm) coverglass (VWR) for mounting by first physicallyremoving dust particles from the coverglass with a dry artistrsquos paintbrush and hand blower (egBergeon Dust Blower from httpwwwwatchpartsusacom or httpwwwnationaljewelerssup-pliescom) Make sure to remove any particles from the coverglass since they will prevent a tightseal with the agarose pad
Avoid using precision wipes (eg Kimwipes) as they can leave scratches and fluorescent strands on theglass In addition avoid Dust-Off or similar compressed gas products because they usually contain smallhighly fluorescent particles
The coverglass is an important and often overlooked component of the optical path Objectivelenses are typically designed to work with a particular thickness of coverglass usually no 15 (016ndash019-mm thickness) and proper selection can enhance image quality For the most precise work it isgood practice to measure the thickness of the coverglass and to use only those within plusmn002 mm of
FIGURE 8 S cerevisiae cells growing on an agarose specimen slide Wild-type cell culture grown in medium to log phaseand mounted at 1 times 107 cellsmL using the techniques described in this article The slide was maintained at 30˚C for justover 8 h Series of phase-contrast images collected at regular intervals (every 60 min) to monitor growth rates Culturedoubles every 90ndash100 min based on cell counts Bar 4 μm
wwwcshprotocolsorg 1035 Cold Spring Harbor Protocols
PRO
TOC
OLS
Co
ld S
pri
ng
Har
bo
r P
roto
cols
ww
wc
shp
roto
co
lso
rg
nominal dimension A digital micrometer suitable for measuring thickness can be obtained from any toolsupply house (eg httpwww1mscdirectcom)
4 Apply a very fine band of 100 pure petroleum jelly (eg Vaseline) to the extreme edge of the cover-glass Do this to all sides by adding a very small amount of jelly with a toothpick to one corner andrunning a finger gently along the extreme edge to distribute the petroleum jelly evenlyThe petroleum jelly prevents rapid evaporation of the cell culture medium and creates a better seal when the coverglassis applied to the agarose bed
Mounting Cells
5 To pellet the cells transfer 1 mL of log-phase yeast culture to amicrocentrifuge tube and centrifuge atlow speed (4000 rpm) for 1 min Avoid overspinning
6 Remove the supernatant from themicrocentrifuge tube and resuspend the cell pellet in 03ndash05mL offresh SC medium (as in Step 1 but without agarose)The volume used to resuspend the cells depends on the size of the cell pellet in Step 5 and the desired final cell density onthe microscope slide
7 Remove the top slide to expose the agarose pad by gently pushing the top slide along the length ofthe depression slide (Fig 9CD) This step should release the seal between the two slides and leave avery smooth surface on top of the depression slide If any large bits of agarose remain carefullyremove them
8 Transfer 22 microL of resuspended cell culture to the smooth agarose and gently place the coverglass withpetroleum jelly over the cell culture (Fig 9EF) To create a tight seal apply a very slight amount ofpressure at the extreme edges of the coverglass Do not press too hard because the cells could bedamaged or crushed between the coverglass and microscope slide
9 Spot a small amount of nail polish at the four corners of the coverglass to prevent it from sliding orpulling away from the agarose bed during the imaging session
FIGURE 9 Preparing specimen slide with agarose pad and mounting of S cerevisiae cells (A) 200 μL of hot agaroseSC-Complete Medium Mixture is added to a 60˚C prewarmed depression slide using a pipette (B) A prewarmed top slideis placed directly on the agarose-filled depression and pressure is held evenly across the top slide for 60 sec while theagarose solution hardens (C ) The top slide is gently removed by sliding it toward one end of the depression slide (D) Afterremoval of the top slide excess agarose is removed from the depression slide to create a flat and even surface (E) 22 μL ofyeast culture is immediately added to the center of the agarose pad using a small pipette tip (F ) A dust-free petroleum-edgedcoverglass is gently placed on top of the yeast sample and sealed by applying light amounts of pressure to the four sides of thecoverglass Large air bubbles can be removed by gently applying pressure to the coverglass in a radial direction
wwwcshprotocolsorg 1036 Cold Spring Harbor Protocols
PRO
TOC
OLS
Co
ld S
pri
ng
Har
bo
r P
roto
cols
ww
wc
shp
roto
co
lso
rg
INSTRUMENTATION ENVIRONMENTAL CONTROL AND MICROSCOPE OPTICS
Environmental Control Devices
Temperature-sensitive yeast strains are well suited to live cell microscopy and present an opportunity todetermine the role of a single gene on a dynamic process in a living cell However special considerationmust be given to control the temperature of the yeastsrsquo environment because the objective and slide arecoupled thermally via immersion oil and thus the objective acts as a heat sink Live cell yeast microscopycan be performed successfully on either upright or invertedmicroscopes and commercial environmentalcontrol systems are available for both With yeast cells it is not necessary to use the elaborate chambersdeveloped for animal cells because the regulation of oxygen and CO2 levels is not critical When choos-ing or building an environmental control system it is important to keep in mind the geometric con-straints imposed by high-NA objectives These include a relatively large-diameter lens direct contactwith the sample (via immersion oil) and short working distance In our experience by using a stageheater an objective heater and the depression slide system discussed in the previous section it is poss-ible to maintain live yeast cells at temperatures from 15˚C to 40˚C for many hours The best way toperform rapid shifts from permissive to nonpermissive temperatures is to use preheated objectivesrather than to change the temperature of a single objective Note that such a shift entails a compromisein the choice of mounting oil (see below)
Building a Thermally Regulated Slide Holder
A simple stage heater can be fabricated from a brass block measuring 4 times 2 times 05 inches One advantageof this simple water-based thermal system is that it appears to be more stable thermally than traditionalresistive systems which cycle on and off In addition a refrigerated circulator allows cold-sensitivemutants to be chilled below room temperature
A completed thermal unit should make clean contact with the microscope objective and look similarto the detailed arrangement shown in Figure 10D (eg inverted microscope configuration)
1 Drill a 1-inch hole through the block to permit bright-field illumination Drill intersecting holesthrough the length of the block cap themwith seals and connect the block via tubing to a circulatingwater bath to create a continuous channel for heated or cooled water (Fig 10A)
2 Fit a temperature collar (available from Bioptechs Inc httpwwwbioptechscom) over the objectiveto regulate its temperature (Fig 10B) and to prevent heat from being absorbed into the microscopebase Exercise caution in using the collar since it is typically wide enough that excessive stage move-ment can cause the objective to crash into the stage
3 Insert small spring-steel clips to hold the slide firmly to the brass block and ceramic foot pads toprevent heat loss through contact with the microscope stage (Fig 10C)
Commercial Environmental Systems
Commercial temperature-control systems are available in a wide range of configurations styles optionsand price ranges Some systems are similar to the basic system described above and contain nothingmore than an aluminum slide holder connected to a resistive heating coil (httpwwwinsteccom)Others typically designed for mammalian cell microscopy are elaborate temperature-regulated circulat-ing dishes (httpwwwbioptechscom) These systems are not well suited to yeast work because mostmammalian studies use adherent cells that bind tightly to the coverglass whereas yeast cells float or spinaround continuously Finally acrylic chambers that enclosemost of themicroscope are also available andcan be used to control the air temperature as well as that of the microscope (httpwwwlischtheboxhtml) This type of system has the advantage of keeping the entire microscope stage and objective atthe desired temperature but the cost is significantly greater than a stage-mounted controller Regardlessof what system is used the temperature of the slide must bemonitored as close to the sample as possibleusing a small thin-film RTD temperature sensor and a digital thermometer (httpwwwomegacom)Wefind that the actual temperature of the sample typically differs by 1˚Cndash3˚C from the temperature of thecirculating bath
wwwcshprotocolsorg 1037 Cold Spring Harbor Protocols
PRO
TOC
OLS
Co
ld S
pri
ng
Har
bo
r P
roto
cols
ww
wc
shp
roto
co
lso
rg
Limiting Geometric Aberrations
Imperfections in lens geometry or sample mounting directly affect the shape of the PSF in distinct ways(Fig 11) A tilted or misaligned lens skews the PSF so that it is no longer perpendicular to the optical stackor is bent in half (Fig 11B) A PSF of this type suggests a significant problemwith tilt and centration in the
FIGURE 11 Lens aberrations and spherical aberration (A) Anideally shaped lens should collect photons symmetrically froma single focused point shown by the red and green lines Withthe correct immersion medium the light from a single fluo-rescent point source results in a spherically correct or symmetricPSF (B) Improperly aligned elements within the objective lensresults in PSF deformation A lens can be misaligned laterally(eg centration) or in a slightly tilted configuration Lens con-struction problems cause the PSF to be altered perpendicularto the x-z plane or bent asymmetrically about the point sourceorigin (C ) Aberrations in the PSF can also occur when imperfec-tions in the curvature of the glass cause light to be collected fromdifferent axial-shifted positions in space and result in axial asym-metry (also known as spherical aberration) Spherical aberra-tions can additionally result from using an immersion oil withthe wrong refractive index All aberrations lead to a reductionin the signal intensity strength and distortions in the final image
FIGURE 10 Temperature controller block and objective lens assembly (A) Liquid-controlled thermal block for maintainingspecimen slides at desired temperature Channels through the block allow liquid to flow in through one port and out theother The block can be fabricated with a large hole bored directly through the center to allow bright-field illuminationon the specimen slide (normally attached to the bottom of the block for inverted microscope configurations) Flatceramic blocks can be added to the bottom of the block to insulate the block and specimen slide from the microscopestage (B) Commercial liquid-regulated thermal collar for an objective lens The ring is incorporated into the liquid circulatingsystem typically provided from a temperature-controlled circulating water bath (C ) Thermal block in upside-down con-figuration Small aluminum clips and screws are used to hold the specimen slide to the underside of the block for invertedmicroscope configurations Screws and clips can be added to the top of the block for upright configurations (D) Fullyassembled thermal block with specimen slide and mounting oil placed over inverted microscope objective
wwwcshprotocolsorg 1038 Cold Spring Harbor Protocols
PRO
TOC
OLS
Co
ld S
pri
ng
Har
bo
r P
roto
cols
ww
wc
shp
roto
co
lso
rg
objective and cannot be corrected by the user When the PSF symmetry is disrupted in the longitudinal oraxial dimension (Fig 11C) spherical aberration is the problem Spherical aberration can arise from prob-lems with the objective or the use of immersionmedia with the wrong refractive index The small size of ayeast cell relative to the resolution limit of an optical microscope requires that spherical aberration beminimized because even small axial aberrations lead to relatively large errors Spherical aberration canbe reduced dramatically by selecting an immersion medium with the proper refractive index
Refractive Index Matching Using Immersion Media
Immersion lenses are designed towork with either oil- or water-basedmedia but not both as specified onthe side of the lens housing The higher the refractive index of the immersion oil the greater the extent towhich light is bent into the objective therefore the highest-NA lenses are oil immersion (see Fig 3)Environmental factors particularly temperature affect the refractive index of the mounting and immer-sion medium and mismatches in either cause spherical aberration By changing the refractive index ofthe immersion medium within a narrow range it is possible to correct for differences in the culturemedium coverglass thickness and temperature Kits with immersion oils having refractive indexesbetween 1500 and 1534 in increments of 0002 can be obtained from Applied Precision (httpwwwapicom) or Cargille Laboratories (httpwwwcargillecom) Choosing which oil to use for agiven temperature is determined empirically based on a visual analysis of the PSF with different oilsWhen the angle of light dispersion is greater above the point source than below it the refractiveindex of the mounting medium is too high and vice versa (Fig 11C) When the PSF is nearly symmetricin z the correct refractive index must be determined We find that when imaging live yeast at 30˚C withno 15 coverglass a refractive index of 1518 is typically appropriate at 37˚C the correct refractiveindex can be as high as 1526 or 1528 Although oil matching can be tedious at first the processbecomes routine over time and the results are worth the effort
Experimental Determination of PSF
Determining the PSF of an objective under typical imaging conditions can help to identify flaws in theobjective and problems with sample preparation The following protocol describes an approach forthe experimental determination of PSF
1 Dilute a set of small fluorescein isothiocyanate (FITC)-conjugated beads in the samemedium as is usedfor mounting cells (SC medium supplemented with a Complete Supplement Mixture of amino acids[Bio101 (httpwwwBio101com)] 20 microgmL of additional adenine and a carbon source)
2 Add 22 microL of the bead mixture to a coverglass coated with poly-L-lysine and seal it with nail polishonto a standard microscope slideAn initial immersion oil with a refractive index of 1516 is a good starting point for imaging at room temperature
3 While focusing the lens above through and beyond the point source (using the motorized system)collect sections at regular intervals (eg every 0020 microm)
4 Examine by eye the symmetry and extent of blurring once the stack of optical z-sections are rotated upby 90˚ and viewed from the side (Fig 11A)The spherically correct PSF is completely symmetric both above and below the point source as well as circularlysymmetric
5 Change the immersion oil refractive index until a symmetric PSF is obtained
PHOTODAMAGE
As discussed above phototoxicity and photobleaching are significant problems in live cell analysis Theexact mechanism of GFP photobleaching has not been elucidated What is known is that the protein isneither destroyed nor degraded rather continuous or long-term repeated exposure to excitation wave-lengths irreversibly alters the GFPmolecule so that it can no longer fluoresce This property can be utilizedin fluorescence recovery after photobleaching (FRAP) experiments and is a common approach to study-ing cytoskeletal dynamics
wwwcshprotocolsorg 1039 Cold Spring Harbor Protocols
PRO
TOC
OLS
Co
ld S
pri
ng
Har
bo
r P
roto
cols
ww
wc
shp
roto
co
lso
rg
Phototoxicity indirectly describes a general class of harmful effects on live cells based on either long-term or short but extreme exposures to a light source Phototoxicity ismuchmore difficult to discern thanphotobleaching because it is harder to measure directly and can be a consequence of DNA damage (UVlight) or protein damage (infrared light) In addition excessive excitation of a fluorophore can lead tooxide radical formation and may also negatively impact cell growth To avoid unpredicted effectsduring live cell acquisition it is important to incorporate interference filters into the microscopesystem Quite often multiple filters can be piggybacked on top of one another Alternatively specialfilters can be ordered that have the appropriate filters fused together (httpwwwchromacom andhttpswwwomegafilterscom) Performing 3D microscopy on cells exaggerates the negativeeffects of photobleaching and phototoxicity The acquisition of multiple optical sections requires con-tinuous or repeated exposure by a magnitude based on the number of sections taken Consequentlyperforming live cell analysis with fluorescent light mandates attention to detail and proper microscopeconfigurations
To minimize photobleaching a bandpass excitation filter (eg Chroma HQ47040X) and aninfrared-blocking filter can be combined in series with the emission filter to block unwanted infraredand UV irradiation In addition neutral-density filters can be used to reduce the intensity of excitatoryillumination across all wavelengths These filters are described by a number that increases in value asthe percent transmission falls Such filters are available from 0100 (80 transmission) up to 30(010 transmission) With all filters maintenance is also required over time This is especially true forthose filters immediately exposed to an intense light source such as excitation and neutral-densityfilters We have found that these elements will fade develop small imperfections and experiencepinhole defects over time and should be replaced after ~6 mo of heavy use
The best exposure time and neutral-density filter combination must be determined empirically anddepends on how frequently repeated exposure is required and on the dynamics of the process beingimaged We have found that 50 msec and a 0500 neutral-density filter works best for rapid acquisitionmovies where 14ndash20 optical z sections are taken every 5 sec This combination allows us to acquire amovie with 120 time points up to 10-min long using enhanced GFP-labeled spindle pole bodies andsingle chromosome tags
FUTURE DEVELOPMENTS
During the next several years expect important developments to occur in live cell microscopy and auto-mated image analysis Machine vision methods have the potential to greatly accelerate the rate at whichimage information can be converted into quantitative information formechanistic and screening studiesIn addition machine vision methods can extend the resolution limit of microscopes beyond the Rayleighlimit and can process images that are too indistinct for human interpretation Machine vision thereforehas the potential to overcomemany of the practical problems associated with live cell imaging includingphototoxicity and photobleaching large data streams and subjective data analysis
WWW RESOURCES
httpwwwchromacom (Chroma Technology) Excellent onlinehandbook of filter basics GFP filter brochure and absorption spectra
httpwwwhamamatsucom (Hamamatsu Photonics) Leadingcamera manufacturer
httpwwwmicroscopyfsuedu (Molecular Expressions Primer) Excel-lent source of microscopy information many interactive demos forunderstanding important concepts
httpswwwomegafilterscom (OmegaOptical) Curv-o-matic viewingof filter spectra online
httpwwwroperscientificcom (Roper Scientific) Good technicallibrary from a leading camera manufacturer
REFERENCES
Bobroff N 1986 Position measurement with a resolution and noise-limited instrument Rev Sci Instrum 57 1152ndash1157
Bullitt E Rout MP Kilmartin JV Akey CW 1997 The yeast spindle polebody is assembled around a central crystal of Spc42p Cell 891077ndash1086
Ciosk R Zachariae W Michaelis C Shevchenko A Mann M NasmythK 1998 An ESP1PDS1 complex regulates loss of sister chromatid
cohesion at the metaphase to anaphase transition in yeast Cell 931067ndash1076
Inoue S 1995 Microscopes In Handbook of optics 2nd ed (ed Bass Met al) Vol 2 pp 171ndash1750 McGraw-Hill New York
Ishiguro J 1989 An abnormal cell division cycle in an AIR carboxylase-deficient mutant of the fission yeast Schizosaccharomyces pombeCurr Genet 15 71ndash74
wwwcshprotocolsorg 1040 Cold Spring Harbor Protocols
PRO
TOC
OLS
Co
ld S
pri
ng
Har
bo
r P
roto
cols
ww
wc
shp
roto
co
lso
rg
Spector DL Goldman RD 2003 Essentials from cells A laboratorymanual (Laboratory Essentials on CD) Cold Spring Harbor Labora-tory Press Cold Spring Harbor NY
Stotz A Linder P 1990 The ADE2 gene from Saccharomyces cerevisiaeSequence and new vectors Gene 95 91ndash98
Straight AF Belmont AS Robinett CC Murray AW 1996 GFP taggingof budding yeast chromosomes reveals that proteinndashprotein
interactions can mediate sister chromatid cohesion Curr Biol 61599ndash1608
Thomann D Rines DR Sorger PK Danuser G 2002 Automatic fluo-rescent tag detection in 3D with super-resolution Application tothe analysis of chromosome movement J Microsc 208 49ndash64
Tsien RY 1998 The green fluorescent protein Annu Rev Biochem 67509ndash544
wwwcshprotocolsorg 1041 Cold Spring Harbor Protocols
PRO
TOC
OLS
Co
ld S
pri
ng
Har
bo
r P
roto
cols
ww
wc
shp
roto
co
lso
rg
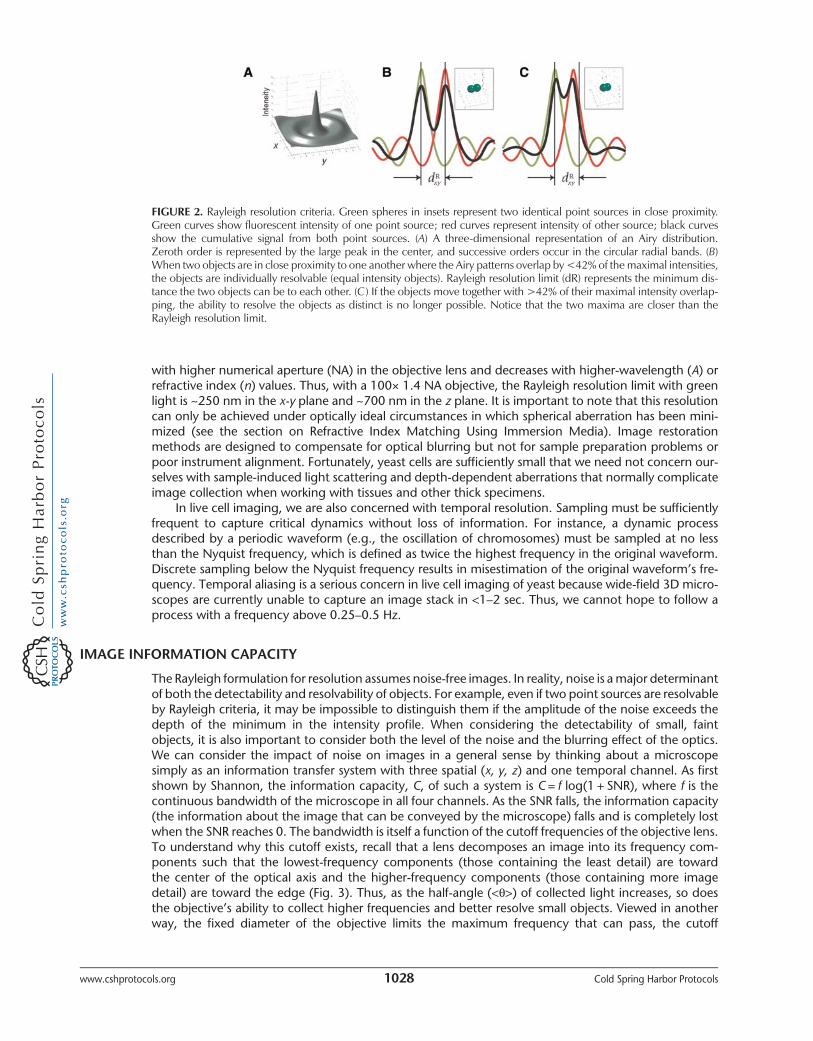
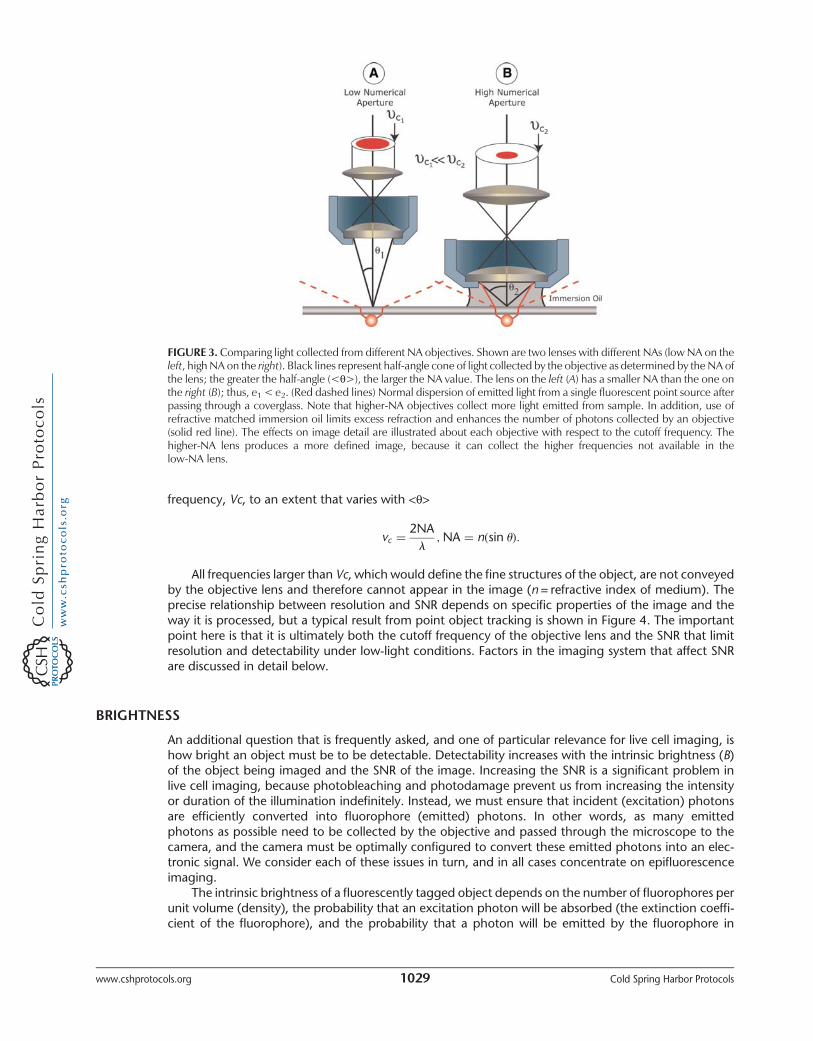
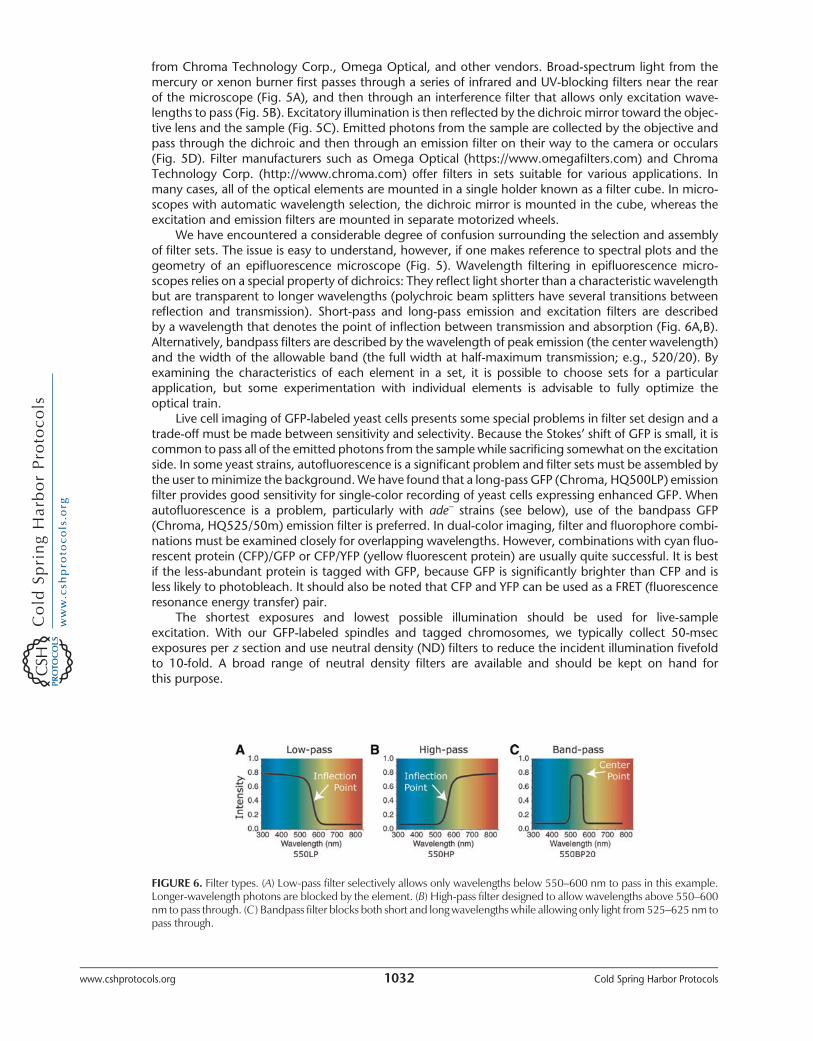
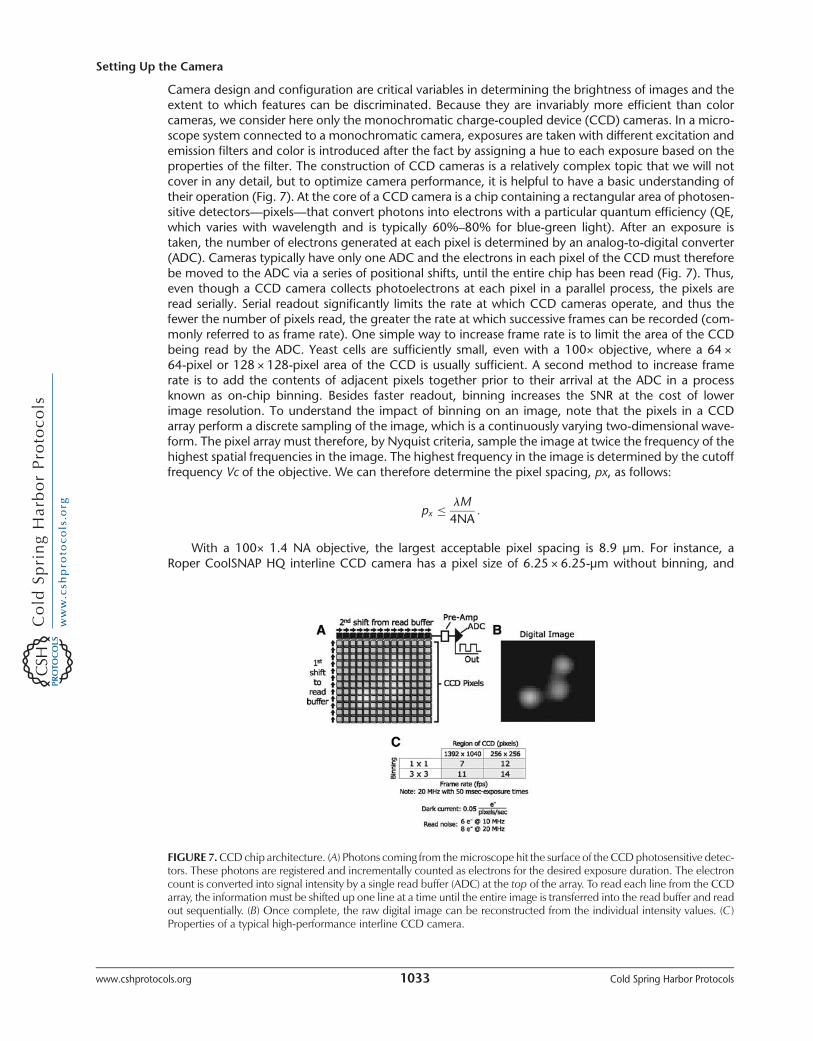
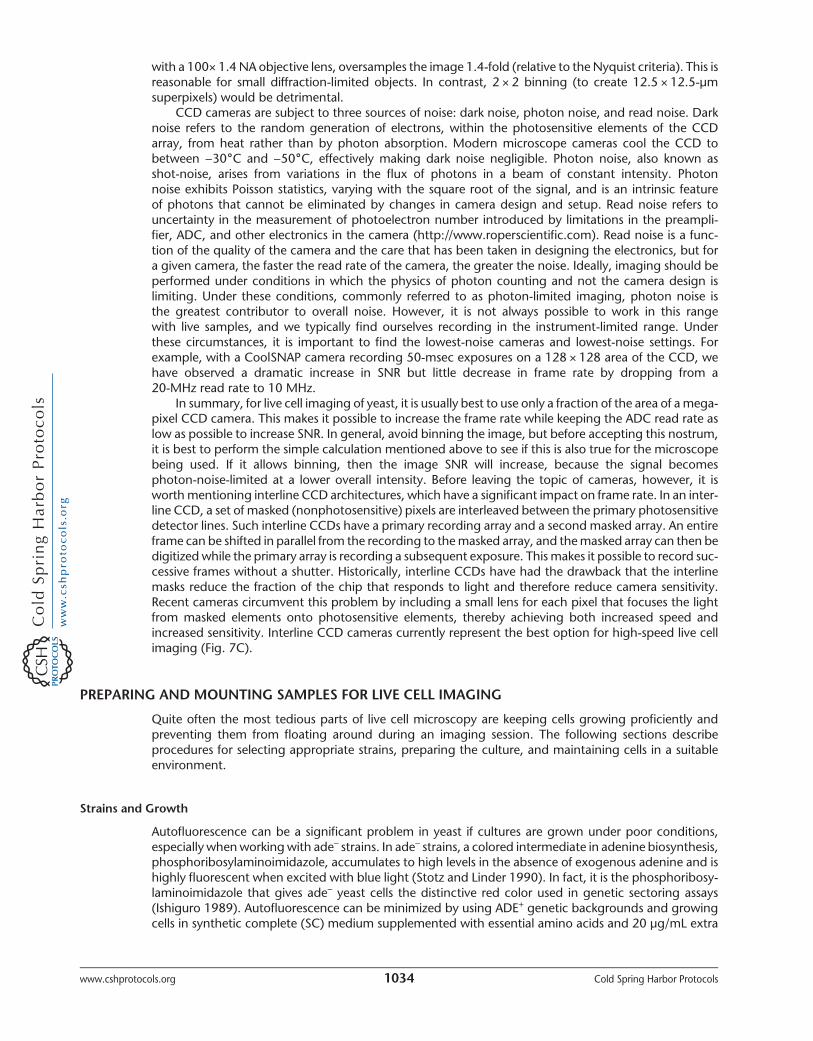
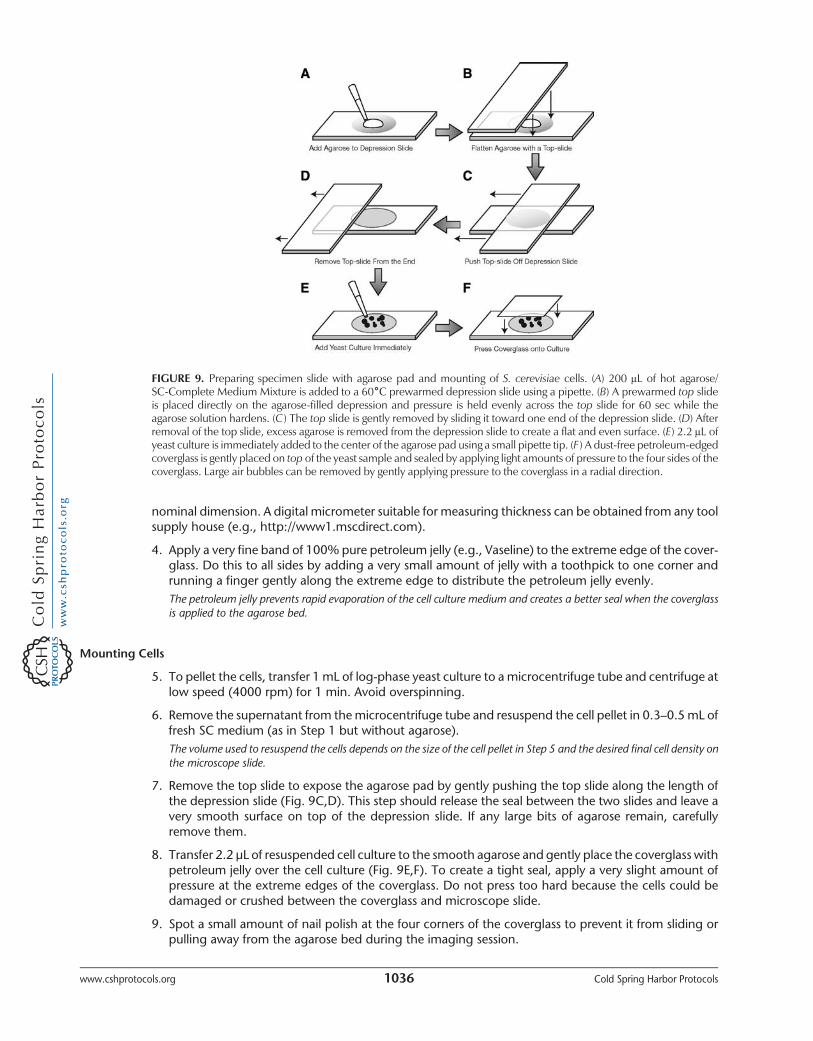
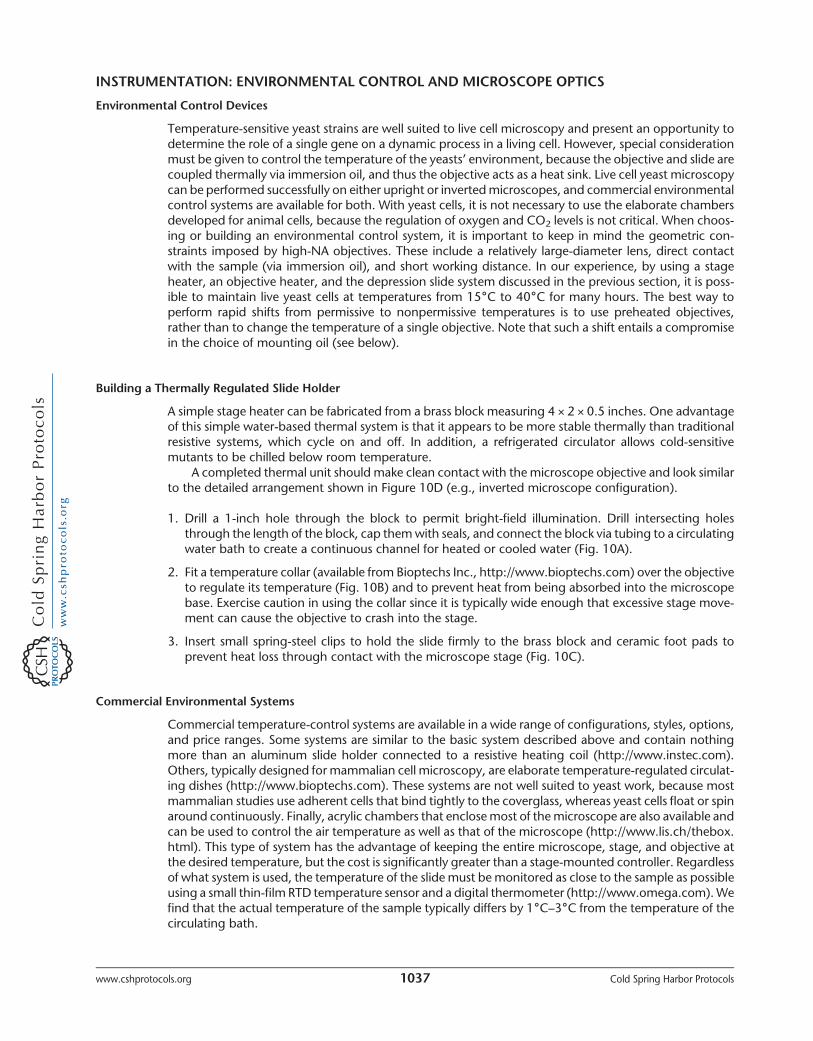
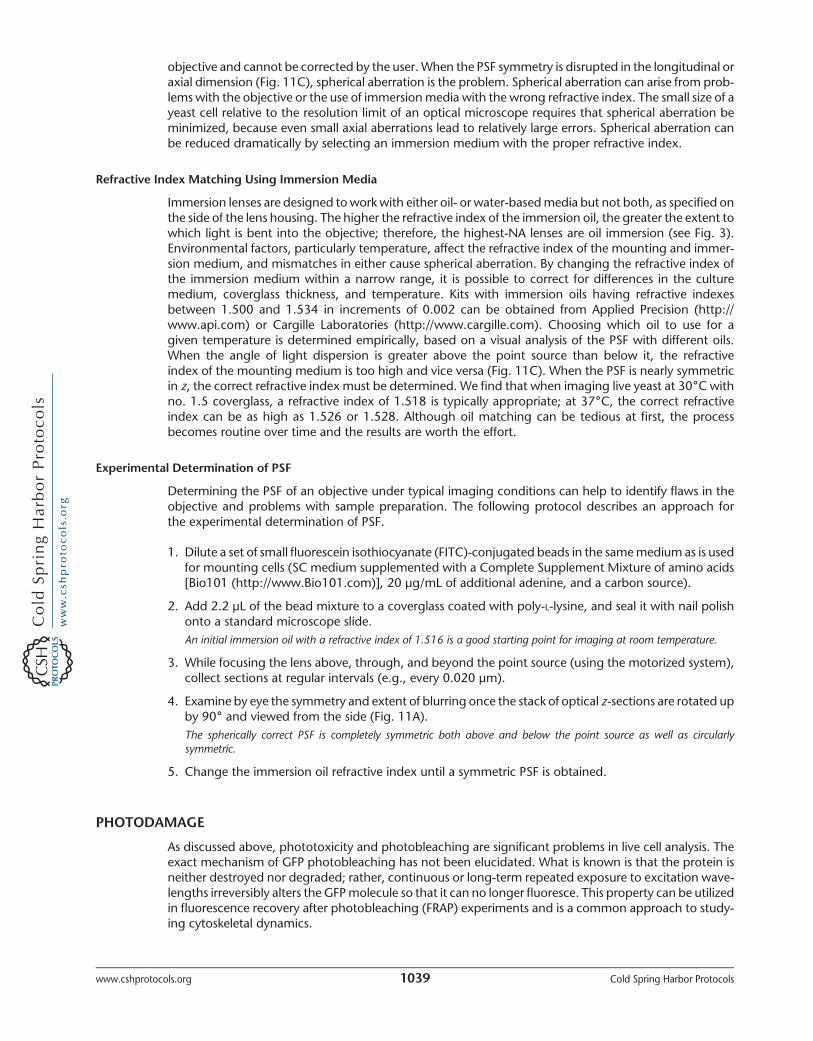
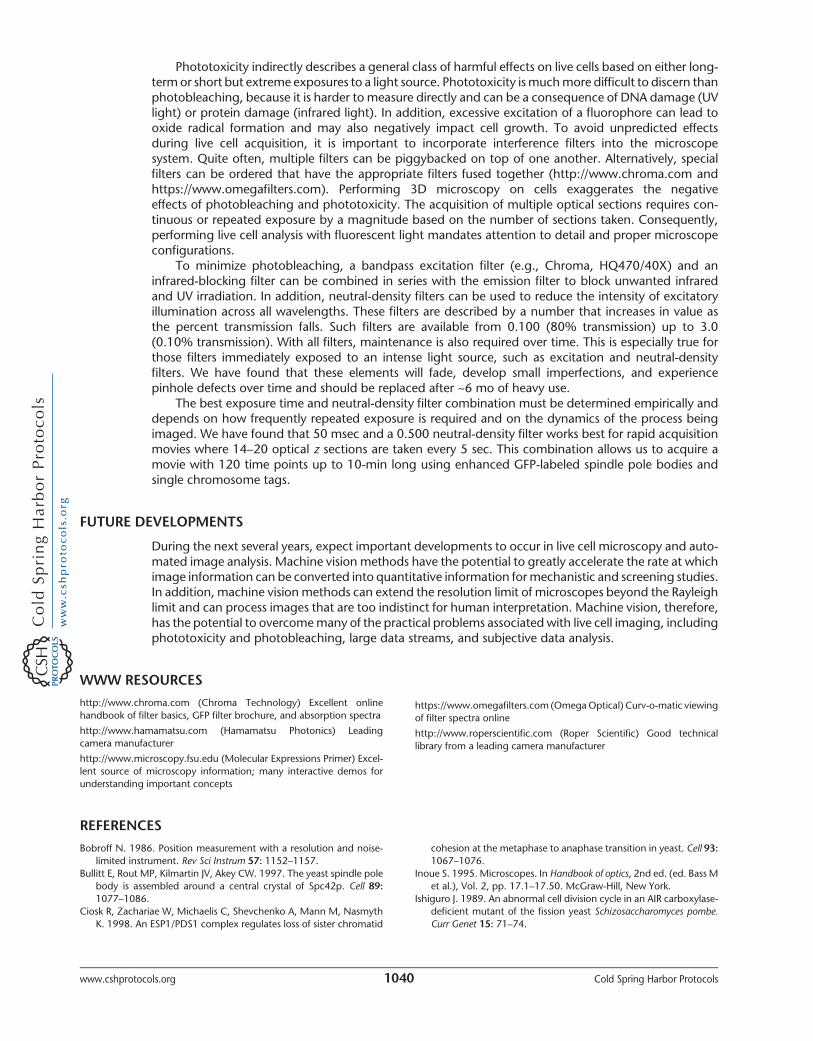