livelihoods baseline profiles - home | famine...
TRANSCRIPT

1
LIVELIHOODS BASELINE PROFILES Limpopo Basin, Mozambique A SPECIAL REPORT BY THE FAMINE EARLY WARNING SYSTEMS NETWORK (FEWS NET)
May 2011

2
LIVELIHOODS BASELINE PROFILES Limpopo Basin, Mozambique A SPECIAL REPORT BY THE FAMINE EARLY WARNING SYSTEMS NETWORK (FEWS NET) May 2011 The authors’ views expressed in this publication do not necessarily reflect the views of the United States Agency for International Development or the United States Government.

3
Contents Acknowledgements ....................................................................................................................................... 4
Sorghum Dominant Semi Arid Interior Livelihood Zone ............................................................................... 5
Maize Dominant Semi‐Arid Interior Livelihood Zone .................................................................................. 11
Upper Limpopo Riverine Chicualacuala/Mabalane Livelihood Zone .......................................................... 19
Upper Limpopo Massingir Riverine Livelihood Zone ................................................................................... 25
Lower Limpopo Baixa Non Irrigation Scheme Livelihood Zone ................................................................... 32
Lower Limpopo Baixa Irrigation Livelihood Zone ........................................................................................ 39
Lower Limpopo Alta Cassava Livelihood Zone ............................................................................................ 46
Lower Limpopo Alta Maize Livelihood Zone ............................................................................................... 54
Annexes
Methodology...............................................................................................................................................64
Comparing Eight Livelihood Zones in the Limpopo Basin............................................................................67
Implications for Future Programming.........................................................................................................70

4
Acknowledgements A revised zoning of the Limpopo Basin was conducted with the directors of the District Economic Activities Services (representing districts Funhalouro, Mabote, Panda, Chigubo and Massangena from Inhambane Province and districts Bilene, Chokwe, Chibuto, Guija, Mandlakzi, Mabalane, Chiculalcula, Massingir and Xai‐Xai from Gaza Province; representatives from the Provincial Directorate of Agriculture in Gaza Province; the Technical Secretariat for Food Security and Nutrition (SETSAN) in Maputo; the National Institute for Disaster Management (INGC) in Gaza Province; Save the Children; IRD; and Associação para o Desenvolvimento das Comunidades Rurais (ADCR).
The baseline fieldwork was conducted by FEWS NET and FEG consultants; one staff member of the National Institute for Disaster Management (INGC); and students from Universidade Técnica de Moçambique (UDM) and in collaboration with local authorities from all the districts in the basin.

5
Mozambique Livelihood Baseline Profile, Zone 34 Sorghum Dominant Semi Arid Interior Livelihood Zone December 20101
Zone Description
The Sorghum Dominant Semi Arid Interior Livelihood Zone (LZ) covers the eastern and northern parts of Chigubo and Funhalouro districts, the southern parts of Mabote District and much of Massangena District. This livelihood zone is defined in large part by its remoteness, far from the central markets in Gaza and Inhambane with poor road conditions and little transport. The movement of people and goods is limited, which in turn constrains the opportunities people in this zone have for economic development. The zone typically does not produce a surplus but households are nevertheless relatively food secure, supplementing their production with sufficient purchases and in the case of the poor and very poor, with food from labor exchange and wild foods so that annual requirements are normally met.
This flat, low‐lying area is covered by indigenous trees, shrubs and bushes, many of which produce wild foods. There is one rainy season from October through March and crop production is entirely rain‐fed. Relatively low rainfall amounts (400 – 600 mm per year) and sandy soils with poor water retention capacity have historically led households to grow sorghum, a drought‐tolerant crop, as the main staple. During the hottest periods of the year, in the wet season, temperatures range from 20 to 33 Co. In the dry season temperatures are much cooler, between 13 and 16 Co.
Households in this zone pursue two primary economic activities: crop production and livestock rearing. In addition, at the poorer end of the wealth spectrum people engage in local agricultural labor on a seasonal basis as well as a range of self‐employment activities. There is also some migration to areas outside the zone for employment. Production is based on traditional practices, with virtually no modern inputs. Better off and middle households own plow oxen to cultivate the land, but the poor and very poor do not own oxen and most can not afford to rent it, relying instead on hand tilling. The main water sources for humans and livestock are boreholes and wells fitted with hand pumps both in the wet and dry seasons, and seasonal ponds in the dry season. The Save River is another source of water but only in Massangena District. Water salinity limits the quality of drinking water in some parts of the livelihood zone. Droughts, human and livestock diseases, and crop pests are the main hazards affecting livelihoods and production in this zone.
Markets
The Sorghum Dominant Semi Arid Interior Livelihood Zone is defined in many ways by its remoteness, far from most central markets in Gaza and Inhambane. Poor road conditions and extremely limited transportation
1 Field work for the current profile was undertaken in October‐November 2010. The information presented refers to March 2009‐ February 2010, an average year for food security by local standards. Provided there are no fundamental and rapid shifts in the economy, the information in this profile is expected to remain valid for at least five years (i.e. until at least 2015). All prices referred to in the document are for the reference year.

6
within and outside the zone provide little opportunity for the mobility of goods and people. The flow of market information is also limited, putting households in the zone at a disadvantage when it comes to negotiating with traders. There are seasonal variations in access to markets, with the rainy season creating especially adverse road conditions.
At the village level, many of the market interactions are ad hoc, with livestock and crops exchanged between households; the exception is in Mabote, where government‐run trader fairs improve market organization. In addition, traders travel to villages to buy crops and livestock. The main crops sold are cashews, maize and groundnuts, and the main livestock sold include cattle, goats, sheep and chickens. Primary markets are at village and district levels, while secondary markets are located in Chokwe, Maxixe, Massinga, Xai‐Xai. Maputo serves as the tertiary market which is the typical destination for livestock and crops like cashews, maize and groundnuts. Imported food and other commodities consumed within the livelihood zone (e.g. sugar, rice, oil, soap, and kerosene) also come from Maputo often through these secondary markets. Unlike maize and groundnuts, which have a national market, there is limited demand for sorghum, which is mostly sold and consumed in areas within the livelihood zone. Natural products like grasses, construction poles and handicrafts are sold and used locally as is home‐brewed alcohol. Bad roads, limited communication and less consumer preferences for some of the local crops such as sorghum are constraints to the development of local markets.
Seasonal Calendar
Seasonal activities in this zone mirror those in the neighboring Maize Dominant Semi Arid Livelihood Zone. There is one rainy season, from October to March during which most agricultural activities take place.
The main cropping activities begin with land preparation in September, followed by planting in October/November and weeding in December/January. The first crops consumed are green cow peas and groundnuts in January, and then green maize in Febraury. The main harvest starts in March for most crops and extends through April/May. Agricultural labor, which is undertaken by poorer households for better off households, occurs between September and February and includes land prepration, planting and weeding.
Cattle conceptions take place between December and February with births occuring from September to November. Goats conceive during March and April and births occur 6 months later. Peak livestock sales and food purchases take place from September to January. The lean season is from November to February, when stocks run out for many households and staple food prices are highest. Wild foods are consumed from October through April. The incidence of malaria is especially high from January through May.
Mar Apr May Jun Jul Aug Sep Oct Nov Dec Jan Feb
Seasons Rainy season LegendLivestock SalesCattle Births Conception Goats Maize WeedingSorghumMillet CowpeasCashews Groundnuts GH GH Water melon Pumpkin Agricultural labor Lean period Food purchase Malaria Diarrhoea Migratory labor Wild food consumption
Harvest Planting Land preparation GH Green harvest
Dry season

7
Wealth Breakdown
Wealth in this zone is determined by the amount of land cultivated, the number of livestock owned (especially plow oxen), and household size and composition. Based on these determinants, households in this livelihood zone were categorized by community members into four main wealth groups. Very poor and poor households have smaller household sizes, no cattle and the least amount of cultivated land. They cultivate the least in the village because they have no oxen for plowing, they have few cash resources and can not afford to hire help, and are themselves often employed to work on the plots of better‐off households, leaving them with less time to devote to their own land. Poor households sometimes rent oxen from middle and better off households, which accounts for the slightly larger land area cultivated by poor households compared to very poor.
All wealth groups own chickens and most own cashew trees. Poor households derive some additional income from goats. The middle and better‐off also own cattle and plow oxen which are rented out to the poor in the agricultural season. Sheep ownership is limited to the better‐off though they are very few in number. The better‐off and middle augment their own household labor by hiring people from very poor and poor households during peak agricultural activity periods, allowing them to cultivate much larger areas of land. Limited labor and access to plow oxen and less ownership of livestock are the main constraints to production for poor and very poor households.
HH sizeL and ar ea cul tiva ted
(h a)Cro ps cu ltivated Livestock/Asset Ho ld in gs
Very P oor 5-7 1.5-3S orghum , mil le t, pu ls es (B eans
andcow peas ), m a ize, w ate r melon, pumpk in and c ashew s.
Chic kens 5 -10 Ca shew t rees (variab le )
Poor 5-7 2-4S orghum , mil le t, pu ls es (B eans
andcow peas ), m a ize, w ate r melon, pumpk in and c ashew s.
G oats 4-12 C h ick ens 10-20
C ashew t rees 10-20
Midd le 7-8 3-5S orghum , mil le t, pu ls es (B eans
andcow peas ), m a ize, w ate r melon, pumpk in and c ashew s.
C a tt le 3-9G oats 2-20
C hick ens 10-20 P low oxen 1
C ashew t rees 15-25
Better-o ff 9 -11 5-9S orghum , mil le t, pu ls es (B eans
andcow peas ), m a ize, w ate r melon, pumpk in and c ashew s.
Ca tt le 20 -40G oats 8-20 S heep 0 -12
C hick ens 20-40 P low oxen 2
C ashew t rees 32-50
W e alt h G roups Chara ct erist ic s
0% 50 % 1 00%
The graph below represents the sources of food for households in different wealth groups in the livelihood zone for the reference year (March 2009 – April 2010). March is the beginning of the consumption year, corresponding to the green harvest. The main sources of food in the reference year were own crops, food purchase and food aid for all wealth groups. Labor exchange (in‐kind payment) made up a significant proportion for very poor households and livestock products provide additional calories for middle and better off households. Own crops make up the largest component of household food income for most households, comprising 40‐50, 55‐65, 55‐70, and 65‐80 percent of annual needs for very poor, poor, middle and better off households respectively. These crops consist of sorghum, millet, groundnuts, pulses (beans, cow peas), maize, water melon, and pumpkin.
Sources of Food for the Reference Year (2009 – 2010)

8
Sources of Cash for the Reference Year (2009‐2010) Sources of Cash The graph provides a breakdown of total cash income according to income source.
Very poor Poor Middle Better off
Annual income (MT) (midpoint of range) 10‐15,000 10‐20,000 20‐30,000 30‐55,000
The graph to the left shows sources of cash income (in Mozambican Meticais) for each wealth group in the reference year.
There are four main sources of cash income for households in this livelihood zone: 1. Self employment; 2. Casual employment; 3. Livestock sales; and 4. Crop sales. As a rule, the wealthier the household the more it relies on sales of its own production, such as crops and livestock. The poorer the household the more it relies on its own labor to generate cash income through activities like grass sales, construction poles, handicrafts and brewing.
Livestock sales (cattle, goats/sheep, and chickens) and livestock product sales (mainly oxen hire) are especially important for better off and middle households.
Poor households also depend on livestock sales, selling chickens and goats to generate some cash, but the amounts obtained are small. Crop sales are only relevant for middle and better off households, who sell maize, groundnuts and cashews. Casual employment refers to construction and agriculture activities. The main self‐employment activities include sales of grasses, construction poles, handicrafts and brewed/distilled alcohol. The better off and middle households generate some cash from renting oxen as well.
Expenditure Patterns for the Reference Year (2009‐2010)
The graph below shows expenditure patterns as a percentage of total income for each wealth group during the reference year. The four categories that make up the majority of expenditure for all households are: 1. Staple food; 2. Non‐staple food; 3. Household items (such as kerosene, salt, soap, etc.); and 4. Inputs. The poorer the household, the larger the relative expenditure on staple food. The wealthier the household the larger the relative expenditure on inputs.
Staple food included maize (meal and grains), wheat flour and rice; non‐staple food included sugar and maize. Nearly 60 percent of very poor household expenditure and 40‐45 percent of the poor household
All but the very poor also consume cashew nuts. Food purchase is the second most important source of food for all groups except the better off. The poor and very poor rely on food purchases more than the wealthier two groups, since their crop production is lower. The second most important source for better off households is livestock products, which include milk and meat. Food aid provides additional calories for all groups, as do wild foods.
Sources of Food
In the graph, food access is expressed as a percentage of minimum food requirements, taken as an average food energy intake of 2100 calories per person per day.
0
10000
20000
30000
40000
Very Poor
Poor Middle Better Off
Ann
ual c
ash
inco
me
in M
T
self-employment
casual employment
livestock sales
livestock product sales
crop sales
0%
20%
40%
60%
80%
100%
120%
V.Poor Poor Middle Better Off
wild foodsfood aidpurchasepayment in kindlivestock prod.crops

9
expenditure were devoted to food purchase in the reference year.
Better off and middle households do not need to purchase as much food because their reliance on own production (both crops and livestock products) is higher. Their expenditure on food was 20‐25 and 35‐45 percent respectively.
The proportion spent on household items is relatively high for all households, with small amounts of cash spent daily on things like tea leaves, salt, soap, kerosene and utensils adding up over the year. Inputs, which include seeds, agricultural equipment, agricultural labor and livestock drugs, take up an especially large proportion of better off expenditure. The middle and the better‐off are the only groups that spend money on agricultural labor, with the better‐off making some livestock investment. Social services and clothes comprise another significant
Expenditure Patterns The graph provides a breakdown of total cash expenditure according to category of expenditure.
component of expenditure. Small amounts are also spent on water. The ‘other’ category includes expenditure on transport, telephone calls and communal obligations. All of these costs increase in absolute terms with wealth status.
Hazards
Malaria, crop pests and chicken disease are the main chronic hazards that recurrently affect livelihoods and people in this zone. Malaria is the most commonly cited human illness, affecting large numbers of people. Newcastle disease, which can kill off entire holdings of chickens, is a continual cause of concern. Sorghum and millet eating pests lead to significant reductions in sorghum and millet harvests.
Intermittent hazards include droughts, cattle and goat/sheep and crop diseases. Droughts, which typically follow a three‐year cycle, are especially damaging. Crop production suffers from a decline in moisture availability, and both humans and livestock water sources are curtailed during droughts, leading to an increase in human and livestock disease. Crop and livestock production shortfalls combine with reduced access to cash income as livestock condition worsens and livestock prices fall, making drought years especially difficult for households to endure. Reduced availability of wild foods and natural products (e.g. grasses for sales) further worsens food insecurity at the household level. Especially important for poorer households, cash income and in‐kind food from agricultural labor diminishes during droughts. Cattle and goat/sheep diseases, which typically follow a two year cycle, deplete critical assets for poor, middle, and better‐off. Crop diseases occur once every two to three years.
Coping Strategies
Households in this livelihood zone respond to hazards in various ways that help to minimize the negative effects of them on their lives and livelihoods. The following practices represent the main coping strategies in the zone:
Increased search for and consumption of wild foods. More time will be devoted to this activity and more people will be involved in the gathering process than in typical years. All but the better off households will use this strategy.
0
20
40
60
80
100
Very Poor Poor Middle Better Off
% o
f ann
ual H
H e
xpen
ditu
re other
water
clothes
social serv.
inputs
HH items
non-staple food
staple food

10
Intensification of self‐employment activities including the collection and sale of grasses, construction poles, handicrafts and various types of alcohol to generate more income. Very poor and poor households will use this strategy.
Shifting expenditures from non‐food to food items. Expenditure items that are often reduced or dropped completely include clothes, transport and telephone costs. This strategy is used by all households.
Increased livestock sales. This is used mostly by middle and better‐off groups; very poor and poor households do not have large enough livestock holdings to make this a feasible option for them.
Increased food purchase to fill the gap left by own production and purchasing power shortfalls as a result of the shock. This is used by all households.
Programme Implications
The common development priorities for all wealth groups include in this livelihood zone include the following:
Market Development: Improved roads and infrastructure would even out irregularities in demand and strengthen the purchasing power of local households.
Water Sector Development: Improved access to water for human and livestock use and for irrigation purposes is seen as necessary for improving productivity in livestock and crop sectors. During bad years, this will also reduce the stress that results from drought‐driven water shortages.
Health Sector Development: Expansion of health services to new areas and improving the speed and quality of service delivery in the livelihood zone is crucial for both saving lives and livelihoods. Because of the fundamental reliance on household labor, illness undermines a household’s ability to generate income and food, so reducing disease and treating illnesses quickly will help people maintain their livelihoods.
Crop Sector Development: It was noted that traditional methods of production limit the productivity of most households. A cost‐benefit analysis should be undertaken to determine whether the risk‐reducing benefits of traditional seeds and methods outweighs the potential returns in productivity associated with more modern agricultural inputs.
Livestock Sector Development: The expansion of treatment and vaccination facilities to rural areas would help increase household incomes. It is especially important to target endemic diseases that regularly kill livestock and train more people in the provision of animal health services.
Education Sector Development: Increasing access to education and improving the quality of education services is ultimately one of the most important development priorities in this area.
Other priorities: These include the provision of electric power and expansion of communication networks.

11
Mozambique Livelihood Baseline Profile, Zone 35
Maize Dominant Semi‐Arid Interior Livelihood Zone December 20102
Zone Description
The Maize Dominant Semi‐Arid Interior Livelihood Zone is found in the southern parts of Chigubo and Funhalouro Districts, northern parts of Mabote and Chibuto Districts and parts of Guija and Manjakaze Districts. Crop production complemented with limited livestock rearing is the basis of livelihoods. Extra cash is earned through brewing and distilling, seasonal employment in agriculture and away on migratory work, and self‐employment (i.e. collection and sales of grasses, construction poles and handicrafts). Most parts of this zone are remote and difficult to reach under wet conditions due to poor roads. This, combined with the limited number of roads, makes it poorly integrated with the nation’s main market centers. This is a semi‐arid ecology, with a topography that is mostly formed by flat land without mountains or hills, a few rivers that run only seasonally, and no streams. Rainfall ranges from 400mm to 600mm3 annually. Temperatures are highest in the rainy season which falls in the months of October to March (summer: 20‐33Co) and lowest in the dry season from April to September (winter: 13‐16Co). Sandy managa soils of low fertility and poor moisture retention capacity predominate.
The livelihood zone is sparsely populated, with most areas covered by dense vegetation consisting of thick grasses and bushes and other indigenous scrub and forests of medium height. Open plains of savannah‐like grass belts are also occasionally found. The variety and extent of this natural vegetation provide a basis for teeming wild life and easy access by humans to wild foods and game. However, both resources are increasingly under threat from forest fires instigated mostly for land clearance by the expanding settled population and from loggers and animal poachers coming from areas outside the zone. The timber and grasses are important raw materials for the construction industry and for making handcrafts, providing an income source to the poor and very poor households. The livestock raised are mainly cattle for the better‐off and middle wealth groups, whilst the poor essentially own goats and the very poor only chickens.
The principal crops grown are maize, groundnuts, pulses (bambara nuts and cowpeas), pumpkin, water melon and cashews. Inter‐cropping is widely practiced. Water scarcity is one of the most serious constraints in the zone. The main water sources include wells fitted with hand‐pumps, boreholes, seasonal ponds, and lakes, which are found only in Chibuto. Access to clean water is generally a problem and more so in drought years as the water table goes down, decreasing water yield. In some parts of the zone (e.g. Machaila) water access and quality is further limited by high levels of salinity, particularly in the dry season and again worst in drought years.
2 Field work for the current profile was undertaken in October‐November 2010. The information presented refers to March 2009‐ February 2010, an average year for food security by local standards. Provided there are no fundamental and rapid shifts in the economy, the information in this profile is expected to remain valid for at least five years (i.e. until at least 2015). All prices referred to in the document are for the reference year. 3 Source: the Limpopo Basin Atlas.

12
Given the constraints of low rainfall and fertility, households manage to produce 50‐70 percent of the basic grain and pulses they consume. Their entire reliance on rainfed production makes them more vulnerable to rain failure than those in the neighboring zone with access to river irrigation, and drought is the most common shock affecting access to food and income. The seasonal shifts in the demand for casual labor and natural products (e.g. for grasses, construction poles and hand crafts), and in the availability of raw materials for making local beverages, affects the seasonal flow of cash incomes to the poor and very poor wealth groups.
Markets
The poor network and condition of the roads limits access to markets at all levels (i.e. primary, secondary and tertiary markets). Most households in this zone therefore sell their crop produce and livestock only locally whenever demand is available, rather than taking advantage of a wider market geography. On the other hand, very often traders from local areas (primary markets) and from secondary (e.g. Maxixe, chokwe, Massinga, Chicualcuala, Xai‐Xai etc) and tertiary markets (e.g. Maputo) outside the zone come into the area to buy livestock and crops. Market access is somewhat eased by trade fairs organized by the government on a quarterly basis in some parts of the zone (e.g. Mabote district). Seasonally, market access is better in the dry season due to better mobility of sellers and buyers and flow of goods from one area to the next. But on the whole the poor access to markets and low levels of trading activity locally make for a rather stagnant price environment for local products, and together with the low investment capital of local traders, this sometimes puts local producers at risk of exploitation by the bigger traders from outside.
Cashews, maize and ground nuts are the crops most frequently sold. Maize is the most widely traded food grain nationally and therefore has a better demand than other crops. This is followed by cashews which are sold mostly in processed form and destined for main urban markets and, to some extent, for export (e.g. to India). Other crops like sorghum, groundnuts and beans are bought for local consumption. Because market access is so limited and competitive demand is lacking, prices hardly change for the local products. However prices of imported food and non‐food items tend to change under the influence of both international and national factors. This reality could potentially threaten the food security of households, given the underlying poor terms of trade whereby the prices of locally produced crops are low in the rural areas but increase as they reach main urban areas while those of imported food items are vice‐versa.
While imported food and non‐food items (e.g. rice, maize meal, oil, soap, kerosene, clothes) come into the zone via secondary markets such as Maxixe, Xai‐Xai, Chokwe, Manica, Massinga and Chicualacuala, and also sometimes directly from Maputo, other food items like potatoes, coconuts, cassava, vegetable, beans, maize and sorghum come from areas neighboring the zone (e.g. Mapai, Mabalane, Morrumbene, Maxixe). These goods may or may not also come via the secondary markets.
All the three livestock types ‐ cattle, goats and poultry ‐ are most often sold locally. However, the trade in cattle and goats is national with the highest demand base in Maputo. Thus although traded livestock go through the secondary markets of the zone, their destination is often Maputo. Goat sales peak in the months of August to December while cattle sales peak in the November – December period. This coincides with the time when demand for meat consumption rises to the highest levels nationally. Trade in chickens is essentially for local consumption.
The market demand for natural‐resource based products such as construction poles, grasses and handicrafts is mostly from local towns. Similarly, the locally made beverages are consumed within the zone except for the distilled alcohol which claims some external demand from commuters and travellers into the zone. Droughts and livestock/crop disease outbreaks are historically the most destabilizing factors for the prices of local production.

13
Mar Apr May Jun Jul Aug Sep Oct Nov Dec Jan Feb
Seasons Rainy season
LegendLivestock SalesCattle Births ConceptionGoatsMaize WeedingSorghumCowpeasCashewsGroundnuts GH GHWater melonPumpkinAgricultural laborMigratory laborLean periodFood purchaseWild food consumptionMalariaDiarrhoea
Harvest Planting Land preparation GH Green harvest
Dry season
Seasonal Calendar
This livelihood zone lies in a semi‐arid area where the there is only one wet season in the whole year. The rainy season starts in October and continues to late March, so that the dry season is from April to September. The seasonal cycle of agricultural activities starts with land preparation and planting from September to November. Both activities are the most labor demanding in the production season. These are followed by weeding in December and January and then the cutting of green (immature) maize in February / March to break the lean season before the harvest. The start of harvesting from March onwards marks the beginning of the consumption year which ends in February of the next year. The reference year (March 2009 – February 2010) was an average year in terms of crop production in most parts of the zone, although the in a few areas there were problems (e.g. Manjakaze and pocket areas of Chigubo). During any year, as stocks of food from the household’s harvest are used up, money is increasingly needed to purchase food as well as non‐food essentials. Livestock sales are a prime source of cash for middle and better‐off households, and so livestock sales increase in the months before the harvest. Wild foods serve to eek out grain for the less wealthy households during the whole rainy season, even beyond the beginning of the harvest. Paid labor on the fields is in demand from September to February mainly in the form of land preparation, planting and weeding. People go to look for migrant work when the agricultural season at home is at an end, i.e. from June to September. A main destination is South Africa, but work is also sought in urban areas inside and outside the livelihood zone within Mozambique. Taking the year’s employment overall, about 80 percent of work is found within the livelihood zone and the remaining 20 percent outside. Migrants often return home in the period just before the cropping season and around the festivities at the end of the year. Livestock migration for grazing is not common because pasture is abundant in most of the zone even in bad years for crop production. Rain failure, though frequent, gives concern not so much for livestock feeding but rather for livestock watering. Livestock migration in search of water occurs in bad year dry seasons. Malaria is most prevalent in the months of January to May, and diarrheoa during

14
HH sizeLand area cultivated
(ha)Crops cultivated Livestock/Asset Holdings Other Assets
Very poor 5 ‐ 6 1 ‐ 3Maize, cowpeas, groundnuts, root crops, pumpkins
Chickens 0 ‐ 2015 ‐ 20 cashew trees
1 ‐ 3 adults capable of working
Poor 5 ‐ 7 2 ‐ 4Maize, cowpeas, groundnuts, root crops, pumpkins
Chickens 4 ‐ 20 Goats: 0 ‐ 14
4 ‐ 50 cashew trees 1 ‐ 3 adults capable of working
Middle 6 ‐ 10 4 ‐ 7Maize, cowpeas, groundnuts, root crops, pumpkins
Chickens 6 ‐ 30 Goats: 4 ‐ 15 , 0 ‐ 2 pigs
Cattle 5 ‐ 14 1 ‐ 2 plough oxen
35 ‐ 90 cashew trees 2 ‐ 4 adults capable of working
Better off 7 ‐ 13 5 ‐ 10Maize, cowpeas, groundnuts, root crops, pumpkins
Chickens 10 ‐ 40 Goats: 6 ‐ 30, 0 ‐ 3 pigs
Cattle 11 ‐ 40 1 ‐ 3 plough oxen
30 ‐ 180 cashew trees 3 ‐ 5 adults capable of working
Wealth Groups Characteristics
0 % 20% 40 %
% of househo lds
December and January, equally triggered by environmental conditions in the rainy season.
Wealth Breakdown
In discussions with villagers, four wealth groups were characterized by a combination of household size, land area cultivated, and livestock holdings including plough oxen. Household size is one thing, but household composition is another. Polygamy is common, and there are two wives even in a good number of very poor households. The better‐off and middle households are up to twice as large as the poorer households, and this tends to mean that they have more working adults (as well as the cash to hire labor to some extent). The very poor and poor wealth groups not only have fewer members and therefore fewer potential working adults, but also generally a higher dependency ratio, i.e. a higher ratio of young children and aged people compared to working members. The proportion of female headed households is also higher. In view of this, in the very poor group especially, children are expected to be economically productive from an early age and contribute quite heavily to the household’s labor activities. For most poorer households, access to education tends to be limited to primary school since this is free. But drop‐out rates are high within the very poor group as children’s time for study is compromised by food and income generating activities. As can be seen from the table, asset ownership is distinctly skewed: there are big differences between the wealth groups in all factors, but there is a particular divide between the very poor and poor on the one hand, and the middle and better‐off on the other. Between the poorer and wealthier there is a two‐to‐fourfold difference in land area cultivated (i.e. greater than the difference in the size of households), while everyone cultivates the same items in greater of lesser amounts, including cashews as a perennial. With regard to livestock, the difference between poorer and wealthier households is not simply in the numbers kept but in the fact that only the wealthier possess the most valuable animals: cattle, including plow‐oxen. The poorer farmers must either pay to hire oxen or keep to tiling by hand‐hoe. Either way they do not achieve optimal land preparation, and combined with the generally mediocre fertility of the soils and limited rainfall, productivity is much constrained.

15
Sources of Food for the Reference Year (2009‐2010)
Under own crops the consumption is essentially of maize and pulses (cowpeas and bambara nuts); water melon, pumpkin and cashew nuts are additional own‐produced food items. No group is self‐sufficient in basic food from their own production: the very poor only achieve about 50 percent self‐sufficiency, and even the better off are under 75 percent, although in their case they do sell around 15 percent of their maize harvest in order to buy the preferred rice. Nobody else sells maize; maize meal is purchased by the middle households, while the very poor and poor purchase maize grains which are relatively cheaper.
For the very poor and poor, food purchase together with direct receipts of grain as labor‐wages
Sources of Food
In the graph, food access is expressed as a percentage of minimum food requirements, taken as an average food energy intake of 2100 kcals per person per day.
(payment–in‐kind) make up one‐ third of their consumption, but gathered wild foods are a crucial addition. Various wild foods (over a dozen types) are found in the zone among which the most consumed include baobab fruit and other fruits locally known as massala and macuacua (consumed in powdery form). But even then, food aid ‐ mainly school feeding ‐ must make up a gap. The very poor do not in fact quite reach their proper requirement; if they cannot afford the money to even basically feed themselves in normal times, they are very poor indeed and highly vulnerable to any economic shock. By contrast the high consumption of milk by the better off and middle testifies to their substantial cattle holdings, which could, if necessary, be converted into cash in the face of any problem of access to food. In one or two areas (e.g. northern parts of Funhalouro) cattle are not milked, and goats are nowhere milked. There is no sale of milk.
0%
20%
40%
60%
80%
100%
120%
V.Poor Poor Middle Better Off
wild foodsfood aidpurchasepayment in kindlivestock prod .own crops

16
Sources of Cash for the Reference Year (2009‐2010)
Sources of Cash
. The graph provides a breakdown of total cash income according to income source.
There is a striking difference in the sources of cash between groups: the wealthier make over 70 percent of their money through livestock sales ‐ mainly cattle ‐ since they have very few food crops to sell, and even for the better off, cashews and groundnuts together bring in only around 10 percent of their total income. All households sell some cashews but only the better off sell groundnuts; maize is sold only by the better off, and then only for less than 3 percent of their total income. By contrast, the poorer households make 70‐90 percent of their money through ‘self employment’ in which by far the largest factor is brewing of beer and spirits (also brewed by middle households), with the rest coming from sales of grasses, construction poles, and handicrafts, although they are constrained by limited demand.
Very poor Poor Middle Better off
Annual income (MT)
9‐12,000 12‐17,000 22‐32,000 34‐46,000
Waged labor is much less important for them, payment‐in‐kind being dominant. The livestock sold includes cattle, goats and chickens, but not pigs. As the poor and very poor groups own no cattle, they sell just one or two chickens and the poor also tend to sell just one goat in a year. The better off and middle make some cash by renting plough‐oxen to poorer farmers who have none (under ‘self‐employment’).
Expenditure Patterns for the Reference Year (2009‐2010)
The staple foods purchased include maize grain, maize meal and rice. As the poor and very poor produce less food for themselves than the wealthier groups, it is not surprising that staple food purchase takes up a greater proportion of their budget than for the other groups. In the reference year, both groups spend about 35 percent of their income on staple food purchase and further 10‐15 percent on non‐staple (e.g. sugar, oil etc), committing nearly half of all income to food purchase. In absolute cash terms the poor and middle households spend considerably more on stapes than either the very poor or the better off. Proportionately, the wealthier groups spend more money on buying inputs as they have more livestock to take care of, and more land to cultivate (15‐30 percent of expenditure versus 5‐10 percent
Expenditure Patterns The graph provides a breakdown of total annual cash expenditure according to category of expenditure.
of expenditure on inputs by the poorer groups). Each group buys treated seeds, but only the better off and middle hire labor for production, and only the better off spend significantly on livestock restocking. In absolute terms, the wealthier are also able to spend more cash on other elements that affect the quality of life: household items including anything from soap to alcoholic beverages, clothes and ‘social services’ meaning school and
05000
10000150002000025000300003500040000
Very Poor
Poor Middle Better Off
Ann
ual c
ash
inco
me
in M
T
self-employment
casual employment
livestock sales
livestock product sales
crop sales
0
20
40
60
80
100
Very Poor Poor Middle Better Off
% o
f ann
ual h
ouse
hold
ex
pend
iture
otherwaterclothessocial serv.inputsHH itemsstaple food
17
medical costs together, in which school expenditure is around twice that on medication.
Hazards
The main chronic hazards affecting households in this livelihood zone every year include poor access to markets, malaria in humans and animal diseases, especially Newcastle in poultry. Malaria affects larger numbers of people than any other disease, particularly in the rural areas where access to health services is limited or lacking. Poor access to markets is marked by almost stagnant prices for local products relative to imported food and non‐food items. This can create divergence between the prices of locally produced goods and imported ones, putting local producers in unfavorable terms of exchange. Newcastle disease kills large numbers of chicken on a yearly basis and is therefore a more urgent cause of concern among the poor and very poor groups for whom chickens are an important asset.
The most common periodic hazards are cattle and goat diseases about every two years and outbreaks of crop pest and disease. Birds, grasshoppers and rats all threaten crops. Drought in some degree occurs about once in three years, affecting not only crops but water availability for people and their livestock. This is why water security for human and livestock comes first in ranking of development priorities. Drought also affects the availability of raw materials for making alcohol and of grasses for constructing houses, reducing the income of the poor and very groups. Droughts lead to a reduced demand for agricultural labor, meaning a fall in the incomes especially of the poor group who normally depend on casual work for 20 percent of their total cash income.
Coping Strategies
Households in this livelihood zone employ a variety of coping strategies in response to hazards. These strategies aim to minimize the immediate effects of hazards rather than to address their causes.
1. Income‐oriented coping strategies – to compensate for reduced/lost access to income/food in the event of a shortfall in production as a result of a drought or disease outbreaks, the better‐off and middle households increase livestock sales. The poor and the very poor try to increase self‐employment activities like the sale of grasses, construction poles and alcohol. Increasing labor migration away from home to areas within and outside the zone is also an option taken by the very poor and poor.
2. Food‐oriented coping strategies – All wealth groups increase food purchases. The poor and very poor target maize grain that is relatively cheaper. The very poor, poor and middle increase wild food consumption well beyond the level consumed in normal years. Crops like watermelon, much of which is fed to animals in typical years, are consumed more by all wealth groups. Labor migration becomes more important, whether for in‐kind payment or cash.
3. Expenditure‐oriented coping strategies – All wealth groups shift expenditure from non‐food purchases like clothes, transport, telephone and alcoholic drinks to staple food purchases. The overwhelming majority of the poor and very poor groups reported that they drop expenditure on such items by almost 100 percent, whilst the middle and better‐off groups reported reduction by 50‐70 percent during bad years.
4. Non‐food/income coping strategies – this refers to coping in response to hazards like disease outbreaks which are common in this zone. The government often provides free vaccinations and treatments in the event of large‐scale disease outbreaks. Households in the first place seek medical assistance from the relevant government and non‐governmental actors but also purchase medicines and veterinary drugs on the market, the more so when there is no assistance.
18
Programme Implications
Households in the zone highlighted a set of development priorities which were very largely convergent between the wealth groups, except that the very poor and poor groups included restocking, credit service, social welfare and the provision of plow oxen and tools for agricultural labor, whereas the better‐off households included strengthening of trade, establishment of banks and provision of urban employment opportunities.
Water Development – this refers to improving the access to safe drinking water (for humans and livestock) and development in this relatively low‐rainfall area of irrigation through borehole drilling, the construction of motorised wells and the building of dams. Water scarcity is one of the most serious problems in the zone.
Human Health – this refers to easing access to health care through improving the availability of important drugs like anti‐malarials as well of treatment services. Maternal child health (MCH) services were cited as an example of services that are not available at all. People called for the expansion of health service coverage to rural areas through increasing the number of facilities and improving the service delivery of already existing ones are required. Ambulances are needed for delivering urgent medical cases from rural areas to the urban health centres.
Agricultural Development – this includes the provision of essential inputs like drought and disease resistant crop varieties, agricultural tools and technical extension services.
Livestock Development – increasing the availability of essential drugs and vaccination and treatment services in the rural areas is seen as a priority. Upgrading of already existing facilities to strengthen their service provision capacity and building new ones is needed.
Market Access – improving access to markets through improving road networks, transport and communication: strengthening trade ties with secondary and tertiary markets remains crucially important. Extension of the trade fairs already existing in some parts to other parts of the zone would help in bringing buyers and sellers together. The inception of policies to prevent exploitation of local producers and strengthen the bargaining power of local population is important. Market information has to be channelled through national media to increase the access to information at grass‐root level.
Development of the education sector – schools are available in the rural areas but the quality of education and the distance that some of the children have to move are of concern. So improving the quality of education through updating existing facilities, creation of new facilities, providing more teaching aids and text books and improving the capacity of the teachers through trainings are seen as a priority.
Other Development priorities – these included grinding mills, solar energy and cell phone networks.

19
Mozambique Livelihood Baseline Profile, Zone 36
Upper Limpopo Riverine Chicualacuala/Mabalane Livelihood Zone
December 20104
Zone Description
This livelihood zone covers the western half of Chicualacuala district and a part of the west of Mabalane district in Gaza Province. It centers on the River Limpopo from the point where it enters Mozambique at the border area with Zimbabwe and South Africa; but the territory of the zone extends far beyond the river especially to the west. This is a semi‐arid ecology with generally plains‐type or gently undulating terrain, and some more hilly areas towards the western border.
Part of the area is covered by the Limpopo National Park. The altitude is at 200‐500 meters above sea level, and the natural vegetation is bush scrub with a major resource in the mopane tree used for firewood and charcoal. There are also other wood resources for poles and timber. The Zimbabwe‐Maputo railway runs through the zone from north to south, and beside it the main road, so there is a single main artery for trade, linking the main towns. There is a poor internal road network for villages, often impassable in the rainy season, and on the whole the zone is relatively isolated from the commercial centers in the south of the country.
The population density is extremely low at 2.3 people per square kilometre taking the zone as a whole, but there is a concentration of people in the general riverine area. The alluvial soils are fertile, but annual rainfall, largely from November to March, is low at under 500 mm – sufficient, however, to allow maize‐based subsistence agriculture together with small watered gardens for vegetables. The main (though modest) wealth of the area is in livestock, especially in cattle which overall rival goats in number. Cultivation is by hand‐hoe as well as ox‐plough to a limited extent, and the main food crops apart from maize are cowpeas, groundnuts sweet potatoes and groundnuts (bambara nuts) and there is intercropping also of watermelons and pumpkins. Crop sales, which were insignificant in the reference year ‐ not a good year, included a small amount of vegetables (tomatoes, cabbages). People buy treated seeds but almost no chemical fertilizers.
Apart from cattle there are goats and poultry, but no pigs. The constraints which limit the possession of livestock for the poorer households are the lack of cash to invest in new animals, and then the pressure to sell animals to buy food, so that it is a vicious cycle. For the wealthier households too, sale of animals is required every year for subsistence, and they also lose animals to diseases, including foot‐and‐mouth, although there is a vaccination service from the Ministry of Agriculture. There is some disease contamination from the wild animals of the national park.
4 Field work for the current profile was undertaken in October‐November 2010. The information presented refers to February 2009‐ January 2010, a below average year for food security by local standards. Provided there are no fundamental and rapid shifts in the economy, the information in this profile is expected to remain valid for at least five years (i.e. until at least 2015). All prices referred to in the document are for the reference year.

20
Mar Apr May Jun Jul Aug Sep Oct Nov Dec Jan FebSeasonsLegendLand PreparationWeedingMaizeCow peasGroundnutsPumpkinsWatermelonSw eet potatoes season 1 season 1 season 2 season 2
BeansVegetablesWild FoodsCharcoal prod/saleLivestock salesAnimal births Goats CattleCasual LaborLocal alcohol saleLean seasonFood aid
Harvest Planting Land preparation GH Green harvest
peak sales
Rainy seasonDry season
Poorer households look for local casual work on farms, but their main cash income is from ‘self‐employment’ ‐ essentially making and selling charcoal ‐ whilst brewing income is also important. Every year a good number of people go to South Africa to work in the gold mines; in bad years others also go into South Africa to look for farm work.
Markets
Amongst the livestock traded, it is cattle that bring in by far the most cash, but goats and chickens are also marketed throughout the year. The demand from Maputo for meat reaches as far as Chicualacuala, and so the majority of livestock are taken from the villages or local markets directly to Maputo, and the trade continues throughout the year with a peak in August and September.
For much of the year, but especially in the months before the end of the harvest (i.e. from September to February) cereals are imported into the zone from Zimbabwe, from Maputo on the railway, and by truck from Chokwe – maize as well as rice for those who can afford it.
Charcoal is usually sold to traders who come to the village, rather than taken to market by the individual sellers. The traders are often from Maputo or Chokwe (outside of this livelihood zone in general). Charcoal sales occur throughout the year.
Seasonal Calendar
Wild foods: Fruits include timuambo, tilhampsua, tintoma, baobab; Nuts include canyu, macuácua. Two important activities are not seasonal at all: charcoal making and brewing of alcoholic beverages. Livestock too are sold throughout the year, but in the months leading up to the festivities of the end of the year and the New Year, the demand for meat from Maputo increases and so this is the time of peak offtake by traders. (For cattle the peak time for births is the rainy season from September, whilst goats give birth especially from the end of the rainy season in March.)

21
HH sizeLand area cultivated
(ha)Crops cultivated Livestock holdings Other Assets
Very poor 4‐8 0.5 ‐ 1Maize, cowpeas, sweet potatoes, groundnuts, pumpkins, water
melons, vegetables
Chickens 0‐5 Goats 0‐5
2‐3 adults capable of working
Poor 5‐9 1 ‐ 2Maize, cowpeas, sweet potatoes, groundnuts, pumpkins, water
melons, vegetables
Chickens 0‐10 Goats: 0‐10 Cattle 0‐10
3‐4 adults capable of working
Middle 8‐10 2 ‐ 4Maize, cowpeas, sweet potatoes, groundnuts, pumpkins, water
melons, vegetables
Chickens 10‐15 Goats: 10‐20 Cattle 5‐15
4‐5 adults capable of working
Better off 7‐13 3 ‐ 7Maize, cowpeas, sweet potatoes, groundnuts, pumpkins, water
melons, vegetables
Chickens 15‐25 Goats: 15‐30 Cattle 15‐50
4‐5 adults capable of working
Wealth Groups Characteristics
0% 20% 40%% of households
It is cultivation which is necessarily more seasonal, as it relies essentially on the rains, although sweet potatoes,beans and vegetables are grown with irrigation by bucket by the river. Cultivation activities are necessarily seasonal, depending as they do principally on one season of rains from September to March. Maize is already eaten ‘green’ in February and March, breaking the lean season which comes in the previous months. Wild foods are mainly gathered in these months to help eek out cereals which by then are mainly purchased, because harvest stocks are finished for at least the poorer households. The intercropped pumpkins are gathered well after the maize harvest, whilst the water‐melons are ready with the green maize. Casual labor performed on local farms is naturaly most busy in the rainy season when there is peak activity for final land preparation, planting and weeding.
Wealth Breakdown
Given the typical sizes of households, the proportion of the population ( as opposed to households) that is very poor is approximately 24 percent, poor 23 percent, middle 27 percent and better off 26 percent, so that the wealthier two groups have a slight majority. The most determinant factor is livestock ownership, although there is a large reported variation in ownership within each wealth group as well as between wealth groups. While cattle are the most valuable animals, goats are important particularly for poorer households, and even very poor households may have a handful of them.
As regards the area of land typically cultivated by households in each wealth group, it is all alta land except for roughly one‐tenth of a hectare of baixa garden land cultivated by all wealth groups. There is something of a divide between the poorer two groups and the wealthier two, just as with livestock. Nevertheless the five or so hectares cultivated by the better off is rather modest. There seems little incentive to go beyond subsistence production: by contrast in the Lower Limpopo Irrigation Scheme livelihood zone the better off cultivate 10‐20 hectares. It is not surprising that, as is shown below in the Sources of Cash section, employment income is a relatively minor part of the earnings of poorer households. Wealthier households do hire labor, but not much. A poor household, with 3‐4 members capable of adult‐type work, is unlikely to fully use this potential on their 1.5 hectares or their small garden, nor evidently do they find much local employment. Therefore the incentive to make money from charcoal and brewing is high, and there is also an incentive to look for migrant work in South Africa, especially in the gold mines.

22
Poorer households are evidently quite highly market dependent for a good part of the year, and are therefore vulnerable to price hikes or market disturbance. The wealthier households, with their numbers of cattle, are able to consume enough milk to make a substantial difference to the quality and palatability of their diet.
Sources of Food for the Reference Year (2009‐2010)
In this below average production year the very poor went hungry: they could not afford to purchase the extra food they needed to make up the extra shortfall in their harvest. They would be even worse off if they had not received food relief for about 5 percent of their food intake.
All the other groups also depended very heavily on the market, a pattern which in a normal‐harvest year likely reduces considerably for at least the wealthier households. But it is not likely that the poorer households come near to fulfilling their basic food requirement from their own harvest even in a normal year.
Sources of Food
In the graph, food access is expressed as a percentage of minimum food requirements, taken as an average food energy intake of 2100 kcals per person per day.
Sources of Cash for the Reference Year (2009‐2010)
Sources of Cash Income
The graph provides a breakdown of total cash income according to income source.
The graph shows that livestock sales are the biggest overall cash source in this zone. The biggest value is in cattle sales. Crop sales are absent in this below average crop year. The ‘free’ natural wood resource is the source of the other major earnings ‐ the charcoal sales which make up most of the ‘self‐employment’ category for the very poor, poor and middle households. By comparison brewing brings in much less money for them, although at their low levels of income any addition is very important. For the better off, ‘self‐employment’ means petty trade plus some income also from brewing.
Very poor Poor Middle Better off
Annual income (MT)
10,000 ‐ 17,000
17,000 ‐ 25,000
25,000 ‐ 35,000
35,000 ‐ 80,000
05000
1000015000200002500030000350004000045000500005500060000
Very Poor
Poor Middle Better Off
Ann
ual c
ash
inco
me
in M
T
casual employment
livestock sales
crop sales
0%
20%
40%
60%
80%
100%
120%
V.Poor Poor Middle Better Off
wild foods
food aid
purchase
payment in kind
livestock prod.
crops

23
0%
20%
40%
60%
80%
100%
V.Poor Poor Middle Better offRel
ativ
e A
nnua
l HH
Exp
endi
ture
(M
T)
other
clothes
social serv.
inputs
water
HH items
non-staple food
staple food
Expenditure Patterns for the Reference Year (2009‐2010)
Expenditure Patterns
The graph provides a breakdown of total cash expenditure according to category of expenditure.
The pattern of staple food purchase between the groups appears to mirror the pattern of consumption of own crops in the “sources of food” graph above. But in absolute terms, with their larger budget and larger households, the better off actually spent a bit more than twice as much on staple purchase as the very poor. Consumption of rice rises according to wealth, although every group buys maize meal, and the very poor also buys the cheaper un‐milled maize. As regards non‐staple food purchases, poorer and wealthier households spent roughly similar
amounts of cash per head; all groups purchased similar amounts of oil per head, but wealthier households consumed per head around twice as much sugar as the poorer households. In order to obtain enough food of whatever quality, poorer households need to limit expenditure on other items which are nevertheless considered essential: for instance very poor households spent five to six times less on soap than better off households.
The expenditure on production inputs by the better off stands out: they are the households that invest most in treated seed, hiring labor, and restocking their livestock.
Hazards
The main hazard that occurs in this livelihood zone is the chronic lack of rain, reducing the potential for satisfactory crop yields. Factors that damage crops and livestock every year are crop pests, some livestock diseases, violent storms and wild animals.
As regards intermittent or periodic hazards, there are years when the red‐billed sparrow descends on crops in unusually large numbers. In some years too, there is particularly bad attack from rodents and/or grasshoppers. Periodically also there is an upsurge in ticks and skin‐disease in cattle.
Coping Strategies
Very poor and poor: The poor sell off extra livestock – especially goats or, in more extreme circumstances, their few cattle. Both the poor and very poor try to increase their production and sales of alcoholic beverages and charcoal. They also try to find more casual labor jobs, whether in local agriculture and house construction, or through travelling into South Africa.
Middle and better off households: Extra sales of livestock are the first recourse, and better off people especially attempt to engage more in small‐scale trading activities. They also look to increasing their renting‐out of oxen, but the prospects of this must be very limited given the constraints in a bad year on their chief customers: the poorer households.

24
Program Implications
Development priorities raised by village interviewees
1. Water fountains / potable water
2. Hospital with maternity, nurses and ambulance
3. Oxen for traction
4. Food shops
5. School teaching up to grade 10 and 12; schools built of conventional materials, housing for teachers
6. Agricultural projects
7. Electrical power
8. Mobile phone network
9. Animal vaccination campaigns
10. Irrigation system; ponds, pumps
11. Transport 12. Credit for businesses 13. Mills

25
Mozambique Livelihood Baseline Profile, Zone 38
Upper Limpopo Massingir Riverine Livelihood Zone
December 20105
Zone Description
This livelihood zone centers on the River Dos Elephantes up to the point where it joins the Limpopo; but the whole area of the zone stretches far to the north of the river. The zone contains most of Massingir District of Gaza Province. This is a semi‐arid ecology with generally plains‐type or gently undulating terrain, and some more hilly areas towards the border with South Africa to the west. Part of the area is covered by the Limpopo National Park. The altitude is at 200‐500 metres above sea level, and temperatures are 21‐30 degrees Celsius in the rainy season and 24‐37 degrees in the dry season. The natural vegetation is mainly bush scrub, and Mopani predominates – a prime firewood source. The soils are a mix of clay and sandy loam and are at least of moderate – and often good – fertility, and rainfall at 300‐500mm per annum is sufficient to support crops. Yet the zone is best described as ‘agro‐pastoral’ in that households generally depend at least as much livestock as on crops, and especially on cattle. On the other hand this is a relatively poor zone, and cattle holdings are actually lower than in other more agriculturally‐based zones.
The main food crops are maize, cowpeas, groundnuts and sweet potatoes, and there is intercropping also of watermelons and pumpkins. Orange trees are maintained, and there is a small amount of vegetable production. The population density is very sparse with some 5 people per square kilometre, and the natural vegetation offers an abundance wood for processing into charcoal, most of which is destined for urban markets beyond the zone. Although Massingir town is connected to Chokwe by a good road, and thus there is a trade route through to the Maputo‐Inhambane highway as well as the railway line, the zone is relatively isolated from the commercial centers within the country, and the road network beyond the main road to the villages is poor and often impassable in the rainy season. In addition, the lack of major commercial activity means that local transport is not easily available. Nor is there a highway link into South Africa, although that is a target of migrant work especially in bad years for local production. Normally poorer people look for employment locally on the land of the wealthier households, and sometimes part of the payment is for the employer to lend his oxen and plough to the worker, since poorer people rarely own a pair of oxen and this limits their crop production potential. But it is ‘self‐employment’ – essentially selling cut firewood and charcoal, as well as grasses – that brings in most money for the poorer households, whilst brewing income is also important.
Apart from cattle there are goats and poultry, but few if any pigs. The constraints which limit the possession of livestock for the poorer households are the lack of cash to invest in new animals, and then the pressure to sell animals to buy food, so that it is a vicious cycle. For the wealthier households too, sale of animals is required every year for subsistence, and they also lose animals to diseases, including
5 Field work for the current profile was undertaken in October‐November 2010. The information presented refers to February 2009‐ January 2010, a below average year for food security by local standards. Provided there are no fundamental and rapid shifts in the economy, the information in this profile is expected to remain valid for at least five years (i.e. until at least 2015). All prices referred to in the document are for the reference year.

26
foot‐and‐mouth, although there is a vaccination service from the Ministry of Agriculture.
Markets
Amongst the livestock traded, cattle bring in the most cash but goats and chickens are also marketed throughout the year. The demand from Maputo reaches as far as Massingir, and so the majority of livestock are taken from the villages or local markets directly to Maputo, and the trade continues throughout the year with a peak in August and September. The most traded crops are sweet potatoes in first place, then groundnuts, then vegetables especially in June to August. This is local trade, from villages to the town market, with Massingir town as the biggest of these. For much of the year, but especially in the months before the end of the harvest (i.e. from September to February) cereals are imported into the zone by truck from Chokwe – maize as well as rice for those who can afford it. Market prices for cereals increase as local and regional stocks dwindle before the beginning of the harvest (i.e. between September and December). Fishing is done on a small to medium scale in this livelihood zone and the market for the fish is mainly large towns outside the zone.
Seasonal Calendar
Food source/
Income activity Feb Mar Apr May Jun Jul Aug Sep Out Nov Dec Jan
Rains X X X X XLand preparation X X X X Weeding X XMaize GC1 H1, P2 H1 GC2 H2 P1 W1 GC1Cowpeas GC H H H P WGroundnuts W GC H H PPumpkin H H H P W WWatermelon H H H P W WSweet potato H1 H2 P2 H2 H2 P1 Beans P W H Pigeon peas W H H P Vegetables LP P/W H H H Lean season X X X Wild foods* X X X X X X X X X X Charcoal X X X X X X X X XLivestock sale X X X X X X XX XX X X X XAlcohol sale XX XX XX X X X X X XX XX XX XCasual labour X X X X X XAnimal births Goats Cattle Fish X X X XHuman diseases X X X X XPlant diseases X X X X X X XPests X XAnimal diseases X X X X X X X X X
Migration (SA) X mines
X
farms
Xfarms
X
mines Purchase of food X X X X X Own production sale X X X X Wild animals X X X X X X Price increases X X X X
*Wild foods: Fruits (Tinhire, canyu, timuambo, tilhampsua, tintoma, mahimbe, macuácua, cholo, nkua)
Nuts (canyu, macuácua)
Legend: P = planting, W= weeding, GC = green consumption, H = harvesting, 1 = 1st season, 2 = 2nd season One advantage of a seasonal calendar is to be able to see things together. Here, for instance, we see a story about the period from October to January – the rainy season. If we look from top to bottom of the calendar we see that these are the months of heavy work on land preparation, planting and weeding. But we see also that this is the lean season, at least up to the moment when people can cut immature ‘green’ maize for consumption. We see that they gather wild foods in this lean time to bolster their dwindling

27
food stocks or substitute for grain purchases. Looking at the bottom of the calendar we see the months of highest prices before the new harvest relieves the market. Returning to the middle of the calendar, we see that a very important cash‐earning activity ‐ charcoal making and selling – continues through this season even though people must work on their fields, or seek extra cash working on other people’s fields when labor demand is at peak (the ‘casual labor’ line). This is also a time of year when alcohol sales increase – is this because the brewers try harder because they need money for food, or is it because people’s consumption rises at a time of heavy work? The rising river and other water areas in the rains offer the advantage of more abundant fish to catch. On the negative side, this time of so much important economic activity is blighted for many households by the fact that key working members go down with malaria. This is not, of course the whole story of the calendar – important things also happen in the rest of the year, beginning above all with the first maize harvest from March as well as the digging up of the sweet potato crop. Sweet potatoes are harvested in the dry season as they are grown by the river with irrigation. Livestock have their own calendar too: for cattle the peak time for births is the rainy season, whilst goats give birth especially at the end of the rainy season in February and for the first two dry season months.
Wealth Breakdown
HH sizeLand area
cultivated (ha)Crops cultivated Livestock Holdings Other Assets
Very poor 5‐71‐2 ha total (0.5‐1.5 alta, 0.5 baixa)
Maize, cowpeas, groundnuts, root crops, pumpkins
Chickens 2‐102 adults capable of
working
Poor 7‐91‐3 ha total (0.5‐2 alta, 0.5‐1 baixa)
Maize, cowpeas, groundnuts, root crops, pumpkins
Chickens 5‐10 Goats 0‐10 Cattle 0‐5
2‐3 adults capable of working
Middle 8‐122‐4 ha total (1.5‐2.5 alta, 0.5‐1.5 baixa)
Maize, cowpeas, groundnuts, root crops, pumpkins
Chickens 5‐15 Goats 5‐15 Cattle 10‐15
3 adults capable of working
Better off 11‐154‐6 ha total (2‐4 alta, 1‐3 baixa)
Maize, cowpeas, groundnuts, root crops, pumpkins
Chickens 10‐25 Goats 10‐20 Cattle 20‐40
5 adults capable of working
Wealth Groups Characteristics
0% 20% 40%% of households
The bars in the wealth breakdown refer to the proportion of households in each wealth group. If we take account of the different numbers of people typically per household, and we look at the number of people in each wealth group, we see that in fact the proportion of the population that is very poor is 20‐25 percent, poor 20‐30 percent, middle 25‐35 percent and better off 20‐30 percent.
Therefore the wealthier part of the population forms a slight majority (because of their large household sizes). The most critical factor is clearly cattle ownership and here the better off stand out sharply: they possess nearly three times as many cattle as the middle and fully nine times as many as the poor. It is notable that overall, cattle are more numerous than goats. At the other end of the scale the very poor have neither cattle nor goats but rather just a handful of chickens. If we add their cultivation of only 1‐2 hectares of land, then it is clear that they must depend on something other than their own farm production – in fact, self‐employment and employment (see Sources of Cash below). Land areas cultivated are not as differentiated between the wealth groups as livestock ownership, and the roughly five hectares of the better off is not an impressive amount, given the size of their households.
Clearly this is an agro‐pastoral zone with an accent on the pastoral for the wealthier households. The poor do own more than chickens, but a couple of cattle and a handful of goats is by no means the basis of a livelihood, and so they are essentially in a similar position to the very poor: dependent on activities off

28
their land. Even the middle, with their 10‐15 cattle and 5‐15 goats, are not comfortably placed in a livestock‐oriented economy. Finally, the proportion of working adults to overall household size does not differ much between wealth groups. In that herding is less labor‐intensive than cultivating or other self‐employment activities such as wood cutting, the wealthier households have an advantage here.
for the better off wealth group. This means that all groups purchase most of their food and therefore are vulnerable to market conditions, especially food price hikes. The very poor are evidently critically vulnerable to such hikes.
In terms of quality of diet, milk/butter consumption plays an important role for those who have cows, notably for very young children, and here the few cattle of the poor bring a reward, whilst the wealthier groups consume substantial amounts of milk (milk has low calorie density yet provides them with 5‐8 percent of their annual calories).
Sources of Food for the Reference Year (2009‐2010)
The graph illustrates that in a bad year for production, the most vulnerable households – the very poor – go hungry during the lean season: they cannot gain access to enough food to meet their minimum energy requirement. They would have been even worse off if their children did not receive free school meals (food aid).
It is clear that this is not a food self‐sufficient zone even in normal years: even a tripling of the contribution of their own crops to the household’s overall consumption would hardly result in much more than 50 percent self‐sufficiency across the board.
Crop production per capital is low even
Sources of Food
In the graph, food access is expressed as a percentage of minimum food requirements, taken as an average food energy intake of 2100 kcals per person per day.
0%
20%
40%
60%
80%
100%
120%
V.Poor Poor Middle Better Off
food aid
purchase
livestock prod.
crops

29
Sources of Cash for the Reference Year (2009‐2010)
The graph below shows that livestock sales are the biggest overall cash‐earner in this zone. What is missing is equally striking: no‐one sells crops, but this is to be expected when nobody is close to self‐sufficiency in staple production. It is unlikely that there are significant maize sales even in a normal year. The pasture resource promotes the ownership of cattle by wealthier households, but another big local resource is wood, and this is exploited in the form of charcoal production by all wealth groups, constituting part of ‘self‐employment’ earnings. But in fact the very poor and poor make more money from brewing alcoholic beverages, also under ‘self‐ employment’. The very poor also sell grasses and reeds; the better off engage in a little trade.
Sources of Cash Income by Wealth Group (2009‐2010)
The graph provides a breakdown of total cash income according to income source.
The middle households catch fish for sale: they have the capital for equipment, unlike poorer households, while the better off prefer to concentrate effort on other things. The main element of casual employment is work by the poorer households on the land of the wealthier. The very poor also labor locally on house construction. However especially in bad years people also look for work outside the zone, mainly in South Africa – going to the mines from January and looking for agricultural work from April.
Very poor Poor Middle Better off
Annual income (MT) 15‐25,000 25‐35,000 35,000‐45,000 50,000 – 90,000
0
10000
20000
30000
40000
50000
60000
70000
80000
Very Poor
Poor Middle Better Off
Ann
ual c
ash
inco
me
in M
T
fishing
self-employment
casual employment
crop sales

30
0%
20%
40%
60%
80%
100%
V.Poor Poor Middle Better offRel
ativ
e A
nnua
l HH
Exp
endi
ture
(MT)
other
clothes
social serv.
inputs
water
HH items
non-staple food
staple food
Expenditure Patterns for the Reference Year (2009‐2010)
Expenditure Patterns
The graph provides a breakdown of total cash expenditure according to category of expenditure.
Given the low cereals production across the board, it is not surprising that every wealth group needs to put a substantial proportion of its annual budget into buying staple food – even the better off spent some 40‐45 percent of their money in this way in the reference year. For the very poor it was around 70 percent of their budget, and given their very low overall income, this left very little indeed for all the other expenses of life. All wealth groups buy maize grain, maize meal and rice, the better off buying somewhat more rice than the others.
But a greater sign of the more diversified and better quality diet of the better off is that they spend very much more than others, both proportionately and in absolute cash terms, on non‐staple food, notably sugar and pulses. And they spend substantially more than others on production inputs, including seeds, hired labor and veterinary drugs – three times more in absolute terms than the middle households and over ten times more than the very poor.
Hazards
The main hazard that occurs in this livelihood zone is the chronic lack of rain, reducing the potential for satisfactory crop yields. Factors that damage crops and sometimes livestock every year are crop pests, violent storms and wild animals.
As regards intermittent or periodic hazards, there are years when the red‐billed sparrow descends on crops in unusually large numbers. In some years too, there is particularly bad attack from rodents and/or grasshoppers. Periodically also there is an upsurge in ticks and skin‐disease in cattle.
Coping Strategies
Very poor and poor: The poor sell off extra livestock – goats or, in more extreme circumstances, their few cattle. Both the poor and very poor try to increase their production and sales of alcoholic beverages and charcoal. They also try to find more casual labor jobs, whether in local agriculture and house construction, or through travelling into South Africa. Very poor and poor households also increase dependency on wild foods, but these are relatively minor sources of food and income.
Middle and better off households: Extra sales of livestock are the first recourse, and better off people especially attempt to engage more in small‐scale trading activities. They also look to increasing their renting‐out of oxen, but the prospects of this must be very limited, given the constraints in a bad year on their chief customers: the poorer households.

31
Program Implications
Development priorities raised by village interviewees
1. Water fountains / potable water
2. Hospital with maternity, nurses and ambulance
3. Oxen for traction
4. Food shops
5. Construction material shops
6. A complete primary school, and school teaching up to grade 10 and 12; schools built of conventional materials, housing for teachers
7. Support for orphans
8. School snacks
9. Agricultural projects; employment
10. Electrical power 11. Mobile phone network
12. Animal vaccination campaigns, pest control
13. Irrigation system; ponds, pumps
14. Credit for businesses 15. Mills
16. Training (e.g. an eco‐tourism course)
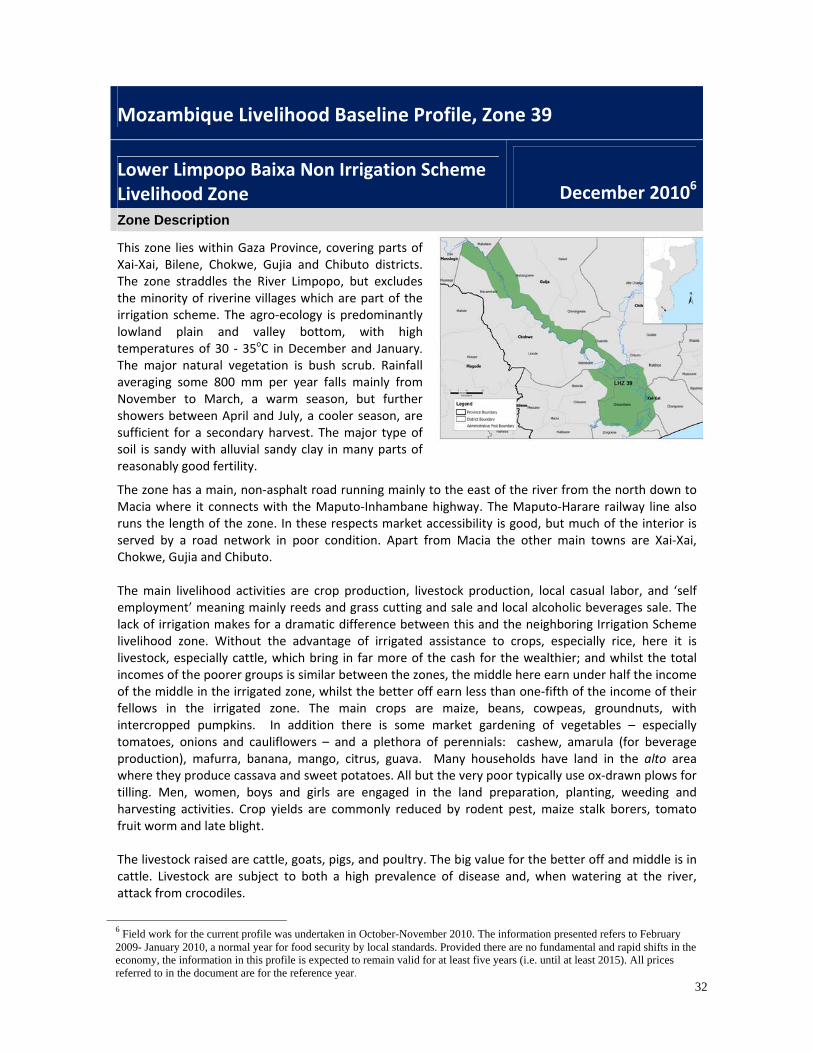
32
Mozambique Livelihood Baseline Profile, Zone 39
Lower Limpopo Baixa Non Irrigation Scheme Livelihood Zone
December 20106
Zone Description
This zone lies within Gaza Province, covering parts of Xai‐Xai, Bilene, Chokwe, Gujia and Chibuto districts. The zone straddles the River Limpopo, but excludes the minority of riverine villages which are part of the irrigation scheme. The agro‐ecology is predominantly lowland plain and valley bottom, with high temperatures of 30 ‐ 35oC in December and January. The major natural vegetation is bush scrub. Rainfall averaging some 800 mm per year falls mainly from November to March, a warm season, but further showers between April and July, a cooler season, are sufficient for a secondary harvest. The major type of soil is sandy with alluvial sandy clay in many parts of reasonably good fertility.
The zone has a main, non‐asphalt road running mainly to the east of the river from the north down to Macia where it connects with the Maputo‐Inhambane highway. The Maputo‐Harare railway line also runs the length of the zone. In these respects market accessibility is good, but much of the interior is served by a road network in poor condition. Apart from Macia the other main towns are Xai‐Xai, Chokwe, Gujia and Chibuto. The main livelihood activities are crop production, livestock production, local casual labor, and ‘self employment’ meaning mainly reeds and grass cutting and sale and local alcoholic beverages sale. The lack of irrigation makes for a dramatic difference between this and the neighboring Irrigation Scheme livelihood zone. Without the advantage of irrigated assistance to crops, especially rice, here it is livestock, especially cattle, which bring in far more of the cash for the wealthier; and whilst the total incomes of the poorer groups is similar between the zones, the middle here earn under half the income of the middle in the irrigated zone, whilst the better off earn less than one‐fifth of the income of their fellows in the irrigated zone. The main crops are maize, beans, cowpeas, groundnuts, with intercropped pumpkins. In addition there is some market gardening of vegetables – especially tomatoes, onions and cauliflowers – and a plethora of perennials: cashew, amarula (for beverage production), mafurra, banana, mango, citrus, guava. Many households have land in the alto area where they produce cassava and sweet potatoes. All but the very poor typically use ox‐drawn plows for tilling. Men, women, boys and girls are engaged in the land preparation, planting, weeding and harvesting activities. Crop yields are commonly reduced by rodent pest, maize stalk borers, tomato fruit worm and late blight. The livestock raised are cattle, goats, pigs, and poultry. The big value for the better off and middle is in cattle. Livestock are subject to both a high prevalence of disease and, when watering at the river, attack from crocodiles.
6 Field work for the current profile was undertaken in October-November 2010. The information presented refers to February 2009- January 2010, a normal year for food security by local standards. Provided there are no fundamental and rapid shifts in the economy, the information in this profile is expected to remain valid for at least five years (i.e. until at least 2015). All prices referred to in the document are for the reference year.

33
Mar Apr May Jun Jul Aug Sep Oct Nov Dec Jan FebSeasons Rainy seasonLegend RF RF RF RF RF RFMaize H1LP2 P2 W2 W2 GC2 H2 LP1 LP1 P1 W1 W1 GC1
Cow pea W W GC GC H H LP P PBeans LP P W H HGround nuts H H LP LP P P W WPumpkin H H LP LP P W WLC LCTomato P P W H H LPOnion P P W W H LPCassava LP P W W H LP P W W WSw eet potato LP2 P2 LC2 H2 LP1 P1 LC1 H1Agricultural local labor LL LL LL LLPeak Livestock sale LS LS LS LSPeak livestock heat & births HE HE B B HEMalaria M M M MLean season HS HS HS HSReed cut and sale RS RS RS RS RS RSGrass mow ing ans sale GS GS GSLocal alcooholic drink preparation MA MA MA AA AA AAHiring Agricultural equipments HAE HAE HAE
Harvest Planting Land preparation GH Green harvest
Dry season
Markets
The major crops sold by the households in the zone are maize, tomatoes, beans, onions and cauliflowers. Maize and tomatoes are sold by all wealth groups while beans, onions and cauliflower are sold only by better off wealth group. Maize and beans are essentially marketed for local consumption, but tomatoes and other vegetables are destined for the major towns: Maputo, Chibuto, Xai Xai and Macia. The link to these towns is problematic for villagers who do not live near the main roads and the railway line, but overall market access is good in this livelihood zone.
All types of livestock are sold, but there are no separate livestock markets. The peak sales of livestock occur in the run‐up to festivals – November, December, January and June.
The staples purchased by households as their harvest stocks run out are supplied to the local market system from neighboring areas in Chimoio, Chokwe and Xai‐Xai districts.
Seasonal Calendar
Legend: Rf = rainfall, BS = bird scoring, LP= land preparation, P = planting , W= weeding, GC = green consumption, LC= leaf consumption, LL= local labour, LS = livestock sale, B= livestock births, HE = livestock in heat, M = malaria, RS= reeds sale, GS = grass sale, AD= alcoholic drinks sale and HAE = hiring agricultural equipment, 1 = 1st season, 2 = 2nd season
There are two cropping seasons in the year. The first warm, main rainy season ‐ Mananga ‐ is the principal crop growing season with rainfall lasting from November to March. The main types of crop grown or started in this season are maize, cowpeas, groundnuts, pumpkins, tomatoes, onions, cassava and sweet potatoes. The second crop season is the cool Uchika, with showers during April to July in what is otherwise the ‘dry season’. The main items grown in this season are a second maize crop and beans. Maize and cassava are long‐cycle crops, sweet potatoes are short‐cycle. In most cases maize is intercropped with cowpeas, beans, and pumpkins, and cassava with groundnuts; tomato, onions and sweet potatoes are produced as single stands.

34
The lean period is from October to December, broken by the availability of sweet potatoes in January, and consumption of immature ‘green’ maize from February. Malaria peaks in the rainy season months, affecting work output in the most crucial time for cultivation as well as reed cutting for sale and craftwork. These are also the months of diarrhoea outbreaks. Grasses are cut for sale in the ‘dry’ season.
Wealth Breakdown
Wealth in the livelihood zone is determined by household size, number of livestock owned (cattle, goats and pigs), size and type of land area cultivated (both the total area and the baixa area for cash crop production), access to irrigation pumps, number of perennial trees owned, methods of land preparation, duration of consumption from their own harvest, types of crops produced, number of adults capable for work, number of children sent to school, level of school attendance, etc. Very poor and poor households prefer to produce staple foods like maize, beans, cassava and sweet potatoes rather than vegetables because these cash crops require more labor and agricultural inputs than othercrops. Poor and very poor households grow crops like ground nuts and cow peas, which are not grown by better of households.
HH size
Land area cultivated
(ha)Livestock holdings Others
Very Poor 4 - 61 - 2
(0-1 alta, 0.5-1.5 baixa)
0-4 goats, 0-10 ducks and 8-12 chickens
Use hoes for tilling; 1-3 working adults; 1-3 children in school (stay up
to 5th grade)
Poor 5 - 71 - 3
(0-1 alta, 1-2 baixa)
0-10 cattle, 0-3 oxen, 3-7 goats, 0-10 pigs, 5-10 ducks
and 8-12 chickens
Use hoes and ox-plough for tilling; 2-4 working adults; 1-3 children in school (stay up to 7th grade);
Middle 7 - 93 - 4
(0-1 alta, 2-4 baixa)
10-15 cattle, 2-4 oxen, 10-20 goats, 5-10 pigs, 5-15 ducks
and 10-20 chickens
Use ox-plough and hired tractor for tilling; 2 wives per man; 3-5 working
adults; 1-3 children in school (stay up to 10th grade)
Better-off 9 - 114-10
(0-1 alta, 4-9 baixa)
15-30 cattle, 4-6 oxen, 20-40 goats, 0-10 pigs, 10-20 ducks
and 20-30 chickens
Use tractors and ox-plough for tilling, 3-5 working adults; 2 wives per man;
2-4 children in education (go up to university level)
Wealth Groups Characteristics
0% 20% 40%
% of households

35
The graph to the right represents the sources of food for households in different wealth groups in the livelihood zone for the period February 2009 – January 2010. February represents the start of the consumption year since it is when the green maize harvest starts. This was a normal year for food production.
It should first be noted that the graph may be deceptive insofar as it suggests that wealthier households are not potentially self‐sufficient in food.
In fact, as can be seen from the
Sources of Food
0%
20%
40%
60%
80%
100%
120%
V.Poor Poor Middle Better Off
purchase
payment in kind
livestock prod.
crops
In the graph, food access is expressed as a percentage of minimum food requirements, taken as an average food energy intake of 2100 kcals per person per day.
‘wealth breakdown’ table above, both the better off and middle households could well feed themselves all year with their maize and pulse production, but they choose to sell at least half of their maize production partly to buy preferred foods which they don’t grow, especially rice and bread which together make up some 10‐15 percent of their total calorie food intake. It is the poorer households who mostly could not cover the whole year with their own production (in the case of the very poor even with the maize they receive as wage payment‐in‐kind). Nevertheless, even the very poor manage to obtain more than three‐quarters of their staples consumption from their limited land. But such is the attraction of rice and bread to diversify their diet that even with their minimal incomes they also typically buy these for about 4 percent of their total calorie intake in addition to 5 percent of intake from buying the cheaper maize meal. All households buy extra groundnuts amounting to 3‐5 percent of their overall calorie consumption.
Non‐staples bought in greater or lesser amounts by all households include sugar, oil, meat and fish. Very poor and poor households purchase extra vegetables because they produce little. The food from livestock is meat rather than milk – beef, pork, and goat meat. Of this the very poor get virtually none.
Sources of Food for the Reference Year (2009‐2010)
Sources of Cash for the Reference Year (2009‐2010)
The graphs below present the sources of cash income for households in different wealth groups for the period February 2009 – January 2010. The graph on the left shows cash income in Mozambique Meticais; the graph on the right shows the sources of cash as a proportion of annual income. In the reference year, all wealth groups sold maize, although the amounts sold by the poorer groups were very small. Only middle and better off households sold beans, cow peas, cassava, tomatoes, onions and cauliflowers. As regards livestock, the very poor have no cattle to sell, while each group sells goats, chicken and ducks in greater or lesser numbers. It is cattle, however, that bring in by far the biggest reward. Milk, butter and animal skins are not sold in this livelihood zone.

36
Sources of Cash Income
Very poor Poor Middle Better off
Annual income (MT)
10,000‐ 20,000 15,000‐30,000 35,000‐50,000 50,000‐150,000
‘Self employment’ means brewing and selling cut reeds and grasses. The left‐hand graph shows the great disparity in earnings by the different wealth groups: the very low income of the very poor, and how very much more than everyone else is earned by the better off (although the picture is not, in fact, as polarized as in the neighbouring Irrigation Scheme livelihood zone).
Expenditure Patterns for the Reference Year (2009‐2010)
0
20
40
60
80
100
Very Poor Poor Middle Better Off
% o
f ann
ual h
ouse
hold
exp
endi
ture other
water
clothes
social serv.
inputs
HH items
non-staple food
staple food
The graph gives the proportions of total annual cash expenditure according to the categories shown.
The graph represents expenditure patterns for the reference year February 2009 – January 2010. The proportion of annual expenditure that goes on staple food is very low across all the wealth groups even for the very poor (who get little food in the form of payment‐in‐kind). This is the positive food picture in a normal year, which can however change acutely with one bad production season. The main staple foods purchased in the reference year were rice and maize‐flour, with some bread in addition. Non‐staple foods take by far the greater share of food expenditure, and this testifies to some dietary variety even for poorer households, who buy
0
20000
40000
60000
80000
100000
Very Poor Poor Middle Better Off
Ann
ual c
ash
inco
me i
n M
T self-employment
casual employment
livestock sales
livestock products
crop sales
0%
20%
40%
60%
80%
100%
V.Poor Poor Middle B.Off
% a
nnua
l cas
h in
com
e

37
bread, groundnuts, oil, sugar, condiments, fish and even very occasionally meat, admittedly all in very modest quantities.
Better‐off households spend considerably more than the poorer on non‐staple foods in absolute terms. But it is their expenditure on production inputs that stands out, including fertilizers, pesticides, veterinary drugs, and the hiring of labor. All the wealth group households spend money on purchasing drinking water. The ‘social services’ category includes education and traditional and non‐traditional medical expenses. The ‘other’ category represents transportation, cigarettes, alcohol (both traditional and non‐ traditional), community obligations and phone air time. The absolute cash spent on these items increases markedly with wealth.
Hazards
The main chronic hazards are crop pests (rodents, insects, birds) and crop diseases; and crocodile attacks on cattle and goats watering at the river (and even on humans fetching water) in the Limpopo River. Amongst human illnesses, malaria most affects the performance of labor during the peak farming operation period (November and December). Prevalent animal diseases range from Newcastle in poultry, to foot and mouth disease and anthrax in cattle and swine pox in pigs. Wind damages crops in the fields and household assets like residences and floods affect crop and livestock feed in the field and damage assets like residential houses and livestock.
The biggest periodic hazard is rain failure, sometimes in the severe form of drought, which without the buffer of available irrigation affects the widest set of elements: crop yields and with that the availability of livestock feed from crop residues, pasture, and water both for drinking and agriculture. Crops and dwellings are damaged by violent winds about once in four year and by serious flooding once in 10 years.
Coping Strategies
In the face of production failures households respond in various ways:
Increased consumption of wild foods: Most households collect and consume a few wild foods in normal years. In bad years, the poor households much increase the amounts and types of wild food collected and consume them over a longer period of time.
Search for paid employment: Local agricultural employment may not be very expandable in bad production years, and so failing this, some very poor and poor households also look to migration for work in South Africa and elsewhere in Mozambique.
Selling of animals: Poor, middle and better‐off wealth groups sell off additional livestock. Since there is a limit to how many animals a household can sell without negatively affecting future production and livelihoods, poorer households are less able to expand this strategy, as their normal livestock holdings are very small.
Switching expenditure: Non‐essential expenditure is reduced or cut out entirely (e.g. in the case of clothing, local alcoholic drinks, cigarettes/tobacco and phone air‐time) in bad years, but there is less flexibility with this option for the very poorest households, who may then reduce more essential household items such as soap, and may cut educational expenditure.
Increase self‐employment activities: Normally, very poor and poor households sell reeds, grass, firewood sale and local alcoholic drinks. In bad years all the theses activities increase to the extent that demand can be found.
Growing drought‐resistant and short‐season crop varieties: The experience of rain failure has prompted people to be prepared to grow more cassava, sweet potatoes and beans. In addition, middle and better off wealth groups use their reserve grain stock.

38
Program Implications
In this livelihood zone, crop and livestock production and other income generating activities are the main livelihood strategies. In order to monitor these livelihood strategies, production of crops (maize, cowpea, beans, cassava, ground nuts, tomato, onion and cauliflower), cattle, goats and pigs and, price of crops (maize, beans tomato, onion and cauliflowers), livestock (cattle, goats, pigs) and availability and price of other income generation activities are important key parameters.
The main constraints to crop production by all wealth groups are prevalence of crop pest problems (rodents, grass hoppers, maize stalk borers), shortage of rainfall, limited access to agricultural equipments and inputs, lack of dam and/or irrigation access and prevalence of human epidemics (malaria, Cholera and HIV/ AIDS).
Livestock production is constrained by animal diseases, lack of improved animal breeds and proper management skills and wild animal (crocodile) attack. The middle and better‐off wealth groups overcome some of these constraints by purchasing animal drugs and employing people for casual agricultural labor and to look after their animals.
Therefore, the overall major constraints of the community in the livelihood zone are:
• Lack of pure drinking water supply • Crop pest problems(rodents, grass hoppers, maize stalk borers) • Shortage of rain fall which affects both crop and livestock production • Limited access to agricultural equipment and inputs (seeds, fertilizer, pesticides and animal drugs) • Prevalence of animal diseases • Inadequate health center facilities and lack of hospitals • Human health epidemics like malaria, Cholera, and TB • Limited market access to agricultural products and staple food for consumption • Limited all‐weather road access • Limited electric power supply at village level • Lack of elementary and high schools at village level • Lack of dam and irrigation schemes to supply water for both crop production and animals • Flood and wind damage
Based on the above identified constraints, some of the development/ intervention priorities suggested by the different wealth groups are:
• Provision of drinking water sources (suggested by all wealth groups) • Provision of agricultural equipment and inputs (hoes, oxen plow, fertilizer, seed, pesticides, animal drugs, tractor, harvesting machine and irrigation water pump ( suggested by all the wealth groups) • Establishment and upgrading of health center at village level( suggested by all wealth groups) • Provide road and transport access (suggested by all wealth groups) • Construct dam and irrigation scheme( suggested by better off wealth groups)

39
Mozambique Livelihood Baseline Profile, Zone 42 Lower Limpopo Baixa Irrigation Livelihood Zone December 20107
Zone Description
This livelihood zone covers parts of Chokwe and Xai‐Xai Districts of Gaza Province. The villages of the zone constitute only a minority of the villages of the two districts as a whole; they are the villages with irrigation. The original irrigation scheme was constructed along the Limpopo in the time of Portuguese colonization, the main channel following by the road‐side, so that the irrigation has been principally gravity‐fed. Most recently the flooding in 2000 caused considerable damage, and some farmers have turned to using pumps to take water from the damaged channel. Access to irrigation is varied: wealthier farmers have more extensive land in the access area, whilst poorer people have only small parcels and otherwise depend on land in the rain‐fed upland part. Access to irrigation is the chief determinant of differences in wealth, and because of the increased diversity and dependability of crops permitted by the assurance of irrigation, the wealthier households – especially the better off – have very high cash incomes in comparison with their counterparts in other livelihood zones. Rice particularly depends on irrigation, and is therefore much more produced by the wealthier than by the poorer households.
This is a predominantly lowland ecology characterized by the valley bottom of the lower Limpopo, and the zone constitutes a strip of land on either side of the river merging into plains. There are some very small irrigated patches down to the coast, but the map shows the principal area of the zone. The natural vegetation is bush/scrub, and part of the baixa is wetland. The major type of soil is sand‐based, with sandy clay with alluvial deposits in many parts which make for relatively high fertility. Rainfall slowly begins in October/November and extends up to February/March. The annual precipitation is on average 700‐800mm. The temperature in the zone is relatively high for Mozambique, ranging between 30‐35OC, with the highest temperatures recorded in December and January.
The population is settled in a very scattered manner. Their livelihood pattern contains the typical elements of agricultural communities, with staple crop and livestock production, and extra cash earnings from casual labor and brewing. But proximity to the river brings special elements too: not only the irrigated agriculture where rice and vegetables are profitable crops, but riverine/wetland resources of reeds and grasses for sale or craftwork which also bring in money. In addition the zone has market advantages in that there is a paved road from Chokwe town to the Maputo‐Inhambane highway, and the Harare‐Maputo railway line runs through the zone.
The zone is known for its rice and maize, but also for its tomatoes, onions, cabbages, lettuce, cauliflowers,
7 Field work for the current profile was undertaken in October‐November 2010. The information presented refers to February 2009‐ January 2010, a normal year for food security by local standards. Provided there are no fundamental and rapid shifts in the economy, the information in this profile is expected to remain valid for at least five years (i.e. until at least 2015). All prices referred to in the document are for the reference year.

40
cucumbers and peppers, all produced in the baixa irrigated area. Various beans are grown, and the better off also sell green beans before the main harvest. Additional crops are groundnuts and cowpeas. The households using alta land produce cassava and sweet potatoes. There are also perennial tree crops: bananas, citrus, cashew and mango for minor domestic food consumption, and marula fruit (Sclerocarya birrea) and mafura nuts (Trichilia emetica) for domestic beverages and oil. The zone is self‐sufficient in basic food and indeed produces a surplus; there has been no history of food aid in the past years. Most households use oxen as draft power for land preparation, but the majority of the better off famers also use tractors for land preparation and harvesting machines for harvesting and threshing. Only the very poor and some poor households solely till by hand‐hoe. Everyone ‐ men, women, boys and girls ‐ is engaged variously in the land preparation, planting, weeding, bird‐scaring and harvesting activities. Birds, rodents, maize stalk borers, tomato fruit worm and late blight are the major threats to crop quantity and quality. There is only minor use of agricultural inputs such as improved vegetable seeds, chemical fertilizer and pesticides. Apart from oxen, cattle, goats, pigs, sheep, chickens and ducks are commonly reared by households for both consumption and cash income.
Markets
Market access is very good, since most of the villages are situated along or near the main motor road from Chokwe with direct connection to Maputo. Other main towns within easy marketing distance are Xai‐Xai and Macia. All these markets are the target for grain sales and vegetable sales at or soon after their harvesting times (see the seasonal calendar below). Livestock are sold throughout the year, but especially when the lean season kicks in properly in November and December and cash is most needed by poorer people to buy maize and rice mainly coming from sources in Chokwe and Xai‐Xai Districts. Animal sales also peak sharply in response to demand at festival times in December, January and June. Reeds are cut for sale early in the main rainy season, between October and December; mature grasses are cut for sale mainly after the long rains and into the period of the short rains, from April to June.
Seasonal Calendar
The seasonal calendar below shows the annual timing of crop production, livelihood activities and food purchases.
There are two rain‐based cropping seasons in the year, but irrigation is practiced throughout the year in that farmers bring on water whenever there is a period of reduced moisture from rains, and in the dry months. The main wet season is the warm, long‐rains growing season, Mananga, with rainfall from November to March. The main crops grown in this season are long‐cycle cereals – rice from November to May, and maize from November to April/May; also cassava, sweet potatoes, cowpeas, groundnuts and tomatoes. The second season is the cooler Uchika with lesser rains falling during April to July, although this is part of what is usually referred to as the ‘dry season’. This is the season of the second maize harvest, but also the main time for the vegetables cash crop: tomatoes, cabbage, lettuce, cucumbers, cauliflowers and peppers. Sweet potatoes are a late planted, short‐cycle crop (November to January) and beans are chiefly a dry‐season irrigated crop. In most cases maize is intercropped with cowpeas and beans while rice, vegetables, sweet potato and cassava are planted as single stands.
The lean season is from October to December, ending with the consumption in January of immature or ’green’ maize before the main February harvest of the mature crop. Diseases like malaria and diarrhoea also peak during this main rainy period.

41
Mar Apr May Jun Jul Aug Sep Oct Nov Dec Jan FebSeasons Rainy seasonLegend RF RF RF RF RFRice BS BS H H LP LP P P W WMaize LP2 P2 W2 W2 GC2 H2 LP1 LP1 P1 P1 W1 W1 GC1 H1
Tomato W1 H1 H1 LP2 P2 W2 H2 H2 LP1 P1
Onion P W H H LP PCabbage LP P W W HCucumber P W H H LP PLettuce P W H LPPepper P W H LPBeans LP P W2 HSw eet potato LP P LC LC HLocal ag. labor LL LL LL LL LLPeak livestock sale LS LS LSPeak livestock heat & births B B B HE HE HEMalaria M MLean season HS HS HSReed cut and sale RS RS RSGrass cutting and sale GS GS GSLocal alcohol sales AD ADHiring agricultural equipment HAE HAE HAE
Harvest Planting Land preparation GH Green harvest
Dry season
Code: Rf = rainfall, BS = bird scaring, LP= land preparation, P = planting , W= weeding, GC = green consumption, LC= leaf consumption, LL= local labour, LS = livestock sale, B= livestock births, HE = livestock heat, M = malaria, RS= reeds sale, GS = grass sale, AD= alcoholic drinks sale and HAE = hiring agricultural equipment
Wealth Breakdown
The main determinants of wealth in this zone are: access to irrigated land in the baixa area, area of land cultivated, number of livestock owned, number of adults capable of work and type of income source. The area of land cultivated increases with wealth. This is not a result of differences in land areas owned, but rather the ability to cultivate the land owned through access to oxen and labor. The crops cultivated are the same across wealth groups, and fruit and alcohol sales occur in all wealth groups (although the quantities for all of these vary by wealth group).
The most striking thing here is the status of the better off: their household economy appears to be of a different order to the rest, with twice to four times as much land as the middle households, around threetimes as much cattle and many more banana trees, ownership of their own tractors and water pumps, and children who go to university.
At the other end of the scale the very poor have far less of everything, and they are the only people without access to ox‐plowing while at the same time having the fewest working adults ‐ a major disadvantage in an area where the main cash crops ‐ the garden produce ‐ require heavy labor as well as agricultural inputs they can hardly afford. At the same time they tend to have a higher dependency ratio than other wealth groups, i.e. more young children. The poor are, however, not very much higher in assets, and like the very poor, in place of substantial garden produce they tend to grow groundnuts and cowpeas, crops not grown at all by wealthier households.

42
Sources of Food for the Reference Year (2009‐2010)
The main foods consumed by all wealth groups are maize, rice, cassava, sweet potatoes, vegetables and beans. As regards the sources of food, the contribution of own crop production to annual consumption is notably within the same range for all wealth groups ‐ 70‐80 percent ‐ despite great differences in assets and income. The reference year was normal in terms of production, and what might seem surprising is that the wealthier groups appear less self‐sufficient than the poorer groups. This is because the wealthier are able to provide or hire the labor for garden cash crops which are more profitable than the staple cereals and pulses, and so they devote more of their land and effort to that, and easily buy all the extra staples they need.
Sources of Food
In the graph, food access is expressed as a percentage of minimum food requirements, taken as an average food energy intake of 2100 kcals per person per day.
Thus the influence of cash‐crops is that the wealthier you are, the more you purchase your food – although in fact everybody grows by far the greater part of the staples they eat. On the other hand the poorer and some middle households tend to add cowpeas and groundnuts to their diet and to limit the purchase of more expensive foods – especially meat which they do not produce for themselves, unlike the better off and middle. All households do normally purchase maize flour, sugar, oil and fish.
HH size
Land area cultivated
(ha)Livestock holdings Others
Very Poor 4-6
1 - 1.5 (0.25-0.75 alta, 0.5-1
baixa)
0-2 goats, 8-12 chickensUse hoes for tilling; 1-3 working
adults; 1-3 children in school (stay up to 7th grade)
Poor 6 - 8
1 - 3 (0-2 alta, 0.5-1.5 baixa)
0-5 cattle, 0-10 goats, 0-2 oxen, 10-20 chickens
Use hoes and ox-plough for tilling; 2-4 working adults; 1-3 children in
school (stay up to 10th grade)
Middle 7 - 94 - 6
(0-2 alta, 3-5 baixa)
5-15 cattle, 2-4 oxen, 5-10 goats, 0-10 pigs,15-25 chickens
Use ox-plough and hired tractor for tilling; 3-5 working adults; 2-4
children in school (stay up to 12th grade)
Better-off 8 - 10
10 - 20 (0-2 alta,
12-16 baixa)
20-60 cattle, 3-7 oxen, 15-50 goats, 0-20 pigs, 20-30 chickens
Use own tractor and ox-plough for tilling, 3-5 working adults; 2-4 children in education (go up to
university level);
Wealth Groups Characteristics
0% 20% 40%% of households

43
Sources of Cash Income for the Reference Year (2009‐2010)
Sources of Cash Income
As follows from the assets shown in the wealth breakdown above, the cash income of the better off is about five times greater than for the middle households and more than 30
times greater than for the very poor. For the better off it is rice that brings in nearly one‐half of their income, and for the middle, one‐fifth, while maize hardly figures at all. Amongst the vegetables, it is boxed tomatoes that bring in most cash, followed by cabbages sold in large quantities. For these two groups, apart from crop sales their major other income is from livestock sales; considering their large holdings, they could sell more animals, but are able to conserve them in view of their income from crops. Their ‘self‐employment’ income is from hiring out oxen, tractors and carts.
The poorer households have more diversified sources of income in which self‐employment – brewing and reeds/grass collection – figures highly, while the contribution of casual employment on other people’s fields is more modest, especially for very poor households, who have fewer working adults available for work off their land. Poorer households in general get around 35‐45 percent of their income from crops, but here rice is not as prominent as for wealthier people; rather the crop income comes more from a mixture of rice, groundnuts, cowpeas, tomatoes, sweet potatoes and very small quantities of other items. They sell only a handful of chickens, so that their livestock income is very small in absolute cash terms.
Very poor Poor Middle Better off
Annual income (MT)
10,000‐ 20,000
15,000‐ 30,000
50,000‐ 150,000
200,000‐800,000
0
50000
100000
150000
200000
250000
300000
350000
400000
450000
500000
Very Poor Poor Middle Better Off
Ann
ual c
ash
inco
me i
n M
T self-employment
casual employment
livestock sales
livestock products
crop sales
0%
20%
40%
60%
80%
100%
V.Poor Poor Middle B.Off
% a
nnua
l cas
h in
com
e

44
Expenditure Patterns for the Reference Year (2009‐2010)
Expenditure Patterns The graph provides a breakdown of total cash expenditure according to category of expenditure.
It should be noted that this is a proportional graph, and expenditure in actual amounts of cash reflects the levels of income outlined in the section above, so that the total expenditure of the better off is far above that of anyone else. Given this, the absolute expenditure on staple and non‐staple food is not as different between the groups as other items, nor is per capita expenditure on staple food greatly different, even taking into account the fact that wealthier people have larger families. The items of food purchased do differ. The main staple foods purchased in the reference year were rice, maize and bread.
Only the very poor and poor buy rice, because wealthier households are self‐sufficient in rice. Maize meal is bought by everyone, but in a relatively small amount. Bread is also bought by all groups, but much more by wealthier people: it provides some 2 percent of annual food calories for the very poor and poor, 5 percent for the middle and 10 percent for the better off, included under ‘staple food’. Non‐staple foods such as vegetables and pulses take a far greater proportion of the expenditure of poorer households than wealthier, partly because the latter can grow sufficient amounts for themselves, and would rather spend on such items as vegetable oil and sugar. All the wealth group households pay for drinking water. Only middle and better‐off households spend on agricultural labor (included in ‘inputs’). The ‘social services’ category includes education and traditional and non‐traditional medical expenses by all wealth groups but the absolute amount increases with wealth. The ‘other’ category includes transportation, cigarettes, alcohol (both traditional and non‐traditional), community obligations, phone air‐time, irrigation scheme payments and, significantly for the better off, savings that are irregularly used for large purchases like tractors.
Hazards
The most important chronic hazard affecting the livelihoods of the zone is rain failure. By far the greater part of crop production depends on the rains as well as irrigation, and so poor rains threaten crop yields as well as pasture for livestock, as well as crop residues for feed. Nevertheless, the availability of irrigation reduces harvest losses by comparison with neighboring areas dependent solely on rains. The supply of well‐water is also affected. Then there is crop damage from rodents, insect pests and crop diseases, which reduces the crop yield both in quantity and quality. Thirdly, wild animals, especially crocodiles, attack cattle and goats while drinking at the Limpopo River, and even human beings who are fetching water in the river. Human illnesses, including HIV/AIDS and malaria, affect the availability of agricultural labor during the peak farming operation period (November and December). There are also substantial losses of animals to disease: Newcastle’s in chickens, foot and mouth disease and anthrax in cattle and swine pox in pigs). Intermittent or periodic hazards affecting livelihoods in the area are drought (i.e. extreme rain failure), high crop pest infestations or unusually widespread animal disease, cholera in humans, and wind or flood
0
20
40
60
80
100
Very Poor Poor Middle Better OffRel
ativ
e An
nual
HH
exp
endi
ture
(M
T)
other
water
clothes
social serv.
inputs
HH items
non-staple food
staple food

45
damage to houses and crops (respectively about once in four years and once in 10 years).
Coping Strategies
Agriculture‐related hazards such as rain failure or crop pests result in below‐average harvests for all households and reduced demand for agricultural labor. The impact of hazards on household food and cash access forces households to implement one or more coping strategies. These include:
Increased consumption of wild foods: Most households normally collect and consume some types of wild food, although they do not add significantly to overall calorie consumption. In bad years, poor households greatly increase the amounts and types of wild food collected, and they consume them over a longer period of time, notably e.g. nenuphar/ white or yellow water lily rhizome.
Search for labor: Very poor and poor households try to increase the casual labor work they do locally; some migrate, looking for opportunities in South Africa and Maputo.
Selling of animals: Poor, middle and better off wealth groups sell off additional livestock. Since there is a limit to how many animals a household can sell without negatively affecting future production and livelihoods, poorer households are less able to expand this strategy, as their normal livestock holdings are very small.
Switching expenditure: Non‐essential expenditure is reduced or cut out entirely (e.g. in the case of clothing, local alcoholic drinks, cigarettes/tobacco and phone air‐time) in bad years, but there is less flexibility with this option for the very poorest households, who may then reduce more essential household items such as soap, and may cut educational expenditure.
Increase self‐employment activities: Normally, very poor and poor households sell reeds, grass, firewood and local alcoholic drinks. In bad years all the theses activities increase to the extent that demand can be found.
Growing drought‐resistant and short‐season crop varieties: The experience of rain failure has prompted people to be prepared to grow more cassava, sweet potatoes and beans. In addition, middle and better off wealth groups use their reserve grain stock.
Program Implications
In view of the constraints to livelihoods and the quality of life, development intervention priorities suggested by the different wealth groups were:
• Provision of drinking water supply (suggested by all wealth groups) • Provision of agricultural equipment and inputs, such as hoes, oxen plows, fertilizer, seed,
pesticides, animal drugs, tractors, harvesting machines, and irrigation water‐pumps (suggested by all the wealth groups)
• Establishment and upgrading of health centers at village level (suggested by all wealth groups) • Provision of road and transport access (suggested by all wealth groups) • Construction of dam and improvement/expansion of the irrigation scheme (suggested by the
better off) • Establishment of agro‐processing factories to add value to produce, especially tomato processing,
packaging and grading facilities (suggested by the better off) • Provision of a credit service (suggested by all but the better off) • School provision up‐grading from elementary to high school standard at village level (suggested
by very poor and poor) • Provision of electric power supply (suggested by all wealth groups)

46
Mozambique Livelihood Baseline Profile, Zone 43 Lower Limpopo Alta Cassava Livelihood Zone December 20108 Zone Description
The Alta Cassava Livelihood Zone of the Lower Limpopo Basin falls in parts of XaiXai, Bilene and Chibuto Districts, and is wholly located within Gaza Province. It is bordered to the east by the Indian Ocean and to the north by the Lower Limpopo Alta Maize Livelihood Zone. Its landscape features small gradual hills and flat land dotted with cashew, massala, orange, mango and lemon trees, bushes, savannah and grassland. It also contains areas of deciduous and evergreen broadleaf forest cover. The majority of the land in this zone has an altitude range of 41‐100 meters above sea level, with a few small areas between 100‐300 meters above sea level.9
Rainfall in this zone (and in the baixa areas that border it) is heavier than in the rest of the Limpopo Basin. The most rain falls in the summer months in the southwest corner of the zone (651‐750mm), becoming progressively lighter towards the northeast corner of the zone (471‐540mm). The pattern is the same for winter rainfall, but with smaller quantities (291‐360mm in the southwest to 177‐225mm in the northeast)10. Temperatures range from 16‐27 degrees Celsius in the coldest months (July and August) to 20‐31 degrees Celsius in the hottest months (December and January). The soil covering the majority of the zone is sandy manangas, which is similar to the soils in the semi‐arid interior rather than those of the neighbouring Alta Maize Zone. In this zone the soils have good‐to‐excessive drainage and are rated as marginally suitable for agriculture.
The zone has three main towns, Xai Xai, Macia and Chibuto, two of which are located along the main national highway from Maputo to the north of Mozambique. Xai Xai and Bilene beaches are popular weekend holiday destinations for those living in Maputo and traffic along the national road is high. The Limpopo River empties into the Indian Ocean here, creating a small river mouth livelihood zone that is not included in the Alta Cassava Zone. The main livelihood activities include crop and livestock production, alcohol production, bush product sales (including reeds, poles, charcoal and firewood), casual work (in agriculture and construction) and remittances, along with some salaried employment in the main towns.
The main crops cultivated are cassava, maize, sweet potato, cowpeas, groundnuts, pigeon peas, and pineapple, while mangoes, cashews, oranges and lemons are all also grown. Cassava is the most important
8 Field work for the current profile was undertaken in October‐November 2010. The information presented refers to February 2009‐ January 2010, a below average year for food security by local standards. Provided there are no fundamental and rapid shifts in the economy, the information in this profile is expected to remain valid for at least five years (i.e. until at least 2015). All prices referred to in the document are for the reference year. 9 The altitude, rainfall and temperature information in this section is taken from the Atlas for Disaster Preparedness and Response in the Limpopo Basin, INGC, UEM‐Department of Geography and FEWS NET MIND, 2003. 10 Rainfall amounts provided are average totals for the entire summer (October to March) and winter (April to September) periods.

47
crop, particularly in below average years. Maize is the second most important crop in terms of quantities produced, but is the preferred crop for consumption. In some villages, key informants ranked years11 according to the production of maize rather than cassava. Cassava is important because it is the food poorer households survive on, but maize is the crop that is preferred. While there are no crops produced specifically for the purpose of selling, larger plots of land can produce surpluses.
Wild foods such as massala, mafurra and canhu are widely found and consumed in this zone. Massala is a key ingredient used to distil alcohol, an important income source for all wealth groups in the zone.
Land is cultivated by hand or using oxen, depending on the wealth of the household. Oxen rental is common among those who do not own cattle themselves but who have the means to rent for the purposes of ploughing.
The main types of livestock kept in this zone are cattle, goats, chicken and ducks, with donkeys found in a few villages in Chibuto District. The number of cattle per household is not as high as in the neighbouring Alta Maize Zone, and unlike in that zone, livestock products such as milk are not consumed or sold in the Alta Cassava Zone. Cattle are used primarily for cash income and for ploughing, while goats and chickens are used for both consumption and sale.
Markets
The major market towns in this zone vary by district. Xai Xai, Macia and Chibuto are the major market towns within the districts of Xai Xai, Bilene and Chibuto, respectively. Xai Xai and Macia are both located on the national highway from Maputo to the central and northern regions of Mozambique and receive large amounts of traffic. Chibuto is connected to Xai Xai and Macia by tarmac roads and is very close to a large and productive baixa area.
While transportation between villages and these main towns is quite good, some key informants mentioned that they could go months without ever visiting these towns, and transportation was sometimes mentioned as a problem. Almost all purchases of food items were from traders in these towns. Most sales of goods out of the villages (livestock, crops, alcohol, bush products) occurs along the main roads or to traders who come to villages. Villagers tend not to take goods to larger markets to trade themselves.
Seasonal Calendar
11 The community leaders in each village were asked to rate and describe the current and previous four years according to the scale: 1=very poor/very bad, 2=bad/poor, 3=average, 4=good, 5=very good
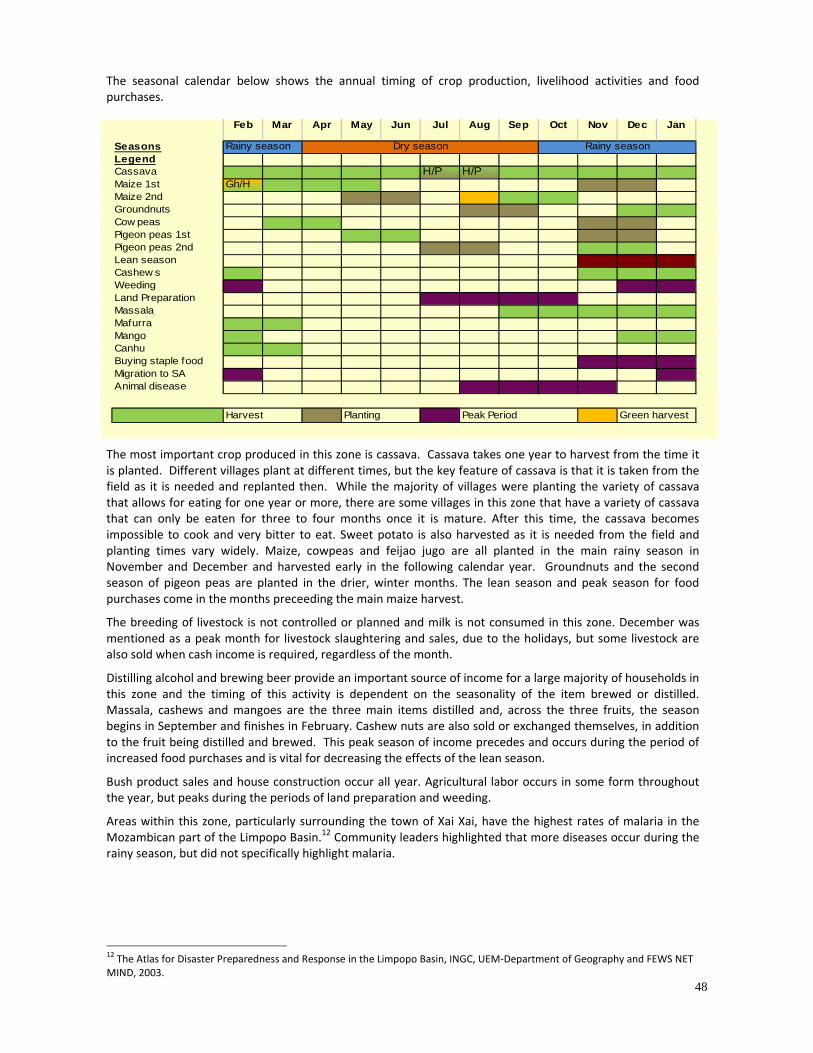
48
Feb Mar Apr May Jun Jul Aug Sep Oct Nov Dec Jan
Seasons Rainy seasonLegendCassava H/P H/PMaize 1st Gh/HMaize 2nd GHGroundnutsCow peasPigeon peas 1st Pigeon peas 2nd Lean seasonCashew sWeedingLand PreparationMassalaMafurraMangoCanhuBuying staple foodMigration to SAAnimal disease
Harvest Planting Peak Period GH Green harvest
Dry season Rainy season
The seasonal calendar below shows the annual timing of crop production, livelihood activities and food purchases.
The most important crop produced in this zone is cassava. Cassava takes one year to harvest from the time it is planted. Different villages plant at different times, but the key feature of cassava is that it is taken from the field as it is needed and replanted then. While the majority of villages were planting the variety of cassava that allows for eating for one year or more, there are some villages in this zone that have a variety of cassava that can only be eaten for three to four months once it is mature. After this time, the cassava becomes impossible to cook and very bitter to eat. Sweet potato is also harvested as it is needed from the field and planting times vary widely. Maize, cowpeas and feijao jugo are all planted in the main rainy season in November and December and harvested early in the following calendar year. Groundnuts and the second season of pigeon peas are planted in the drier, winter months. The lean season and peak season for food purchases come in the months preceeding the main maize harvest.
The breeding of livestock is not controlled or planned and milk is not consumed in this zone. December was mentioned as a peak month for livestock slaughtering and sales, due to the holidays, but some livestock are also sold when cash income is required, regardless of the month.
Distilling alcohol and brewing beer provide an important source of income for a large majority of households in this zone and the timing of this activity is dependent on the seasonality of the item brewed or distilled. Massala, cashews and mangoes are the three main items distilled and, across the three fruits, the season begins in September and finishes in February. Cashew nuts are also sold or exchanged themselves, in addition to the fruit being distilled and brewed. This peak season of income precedes and occurs during the period of increased food purchases and is vital for decreasing the effects of the lean season.
Bush product sales and house construction occur all year. Agricultural labor occurs in some form throughout the year, but peaks during the periods of land preparation and weeding.
Areas within this zone, particularly surrounding the town of Xai Xai, have the highest rates of malaria in the Mozambican part of the Limpopo Basin.12 Community leaders highlighted that more diseases occur during the rainy season, but did not specifically highlight malaria.
12 The Atlas for Disaster Preparedness and Response in the Limpopo Basin, INGC, UEM‐Department of Geography and FEWS NET MIND, 2003.

49
HH size
Land area cultivated
(ha)Crops cultivated Livestock Holdings Other Assets
Very Poor 4-6 0.5-1.5Cassava, maize, sweet
porato, cowpeas, groundnuts, pigeon peas, fruit, cashews
Chickens Goats 0-2
1-2 adults capable of work
Poor 4-7 1-2Cassava, maize, sweet
porato, cowpeas, groundnuts, pigeon peas, fruit, cashews
Chickens Goats 0-5 Pigs 0-2
1-3 adults capable of work
Middle 5-7 2-3Cassava, maize, sweet
porato, cowpeas, groundnuts, pigeon peas, fruit, cashews
Chickens Goats 0-7 Pigs 0-4
2-3 adults capable of work
Better-off 7-10 3-4Cassava, maize, sweet
porato, cowpeas, groundnuts, pigeon peas, fruit, cashews
Chickens Goats 0-15
Pigs 0-4 Cattle 0-8 Oxen 0-3
2-4 adults capable of work
Wealth Groups Characteristics
0% 20% 40%
% of households
Wealth Breakdown
The main determinants of wealth in this zone are: area of land cultivated, number of livestock owned, number of adults capable of work and type of income source. The area of land cultivated increases with wealth. This is not a result of differences in land areas owned, but rather the ability to cultivate the land owned through access to oxen and labor. The crops cultivated are the same across wealth groups, and fruit and alcohol sales occur in all wealth groups (although the quantities for all of these varied by wealth group). The main difference between the very poor and poor wealth groups is the availability of labor in the household and overall household size. Very poor households often consist of elderly people living with grandchildren or younger families just starting out. The difference between the other groups is related to access to oxen and remittances. Poor and middle households do not own oxen or cattle themselves, but often rent or work in exchange for the use of oxen.
The main difference between middle and better off households is the number of livestock owned and the type of income source. There are two different types of better off household. Households that own cattle and thereby cultivate large areas of land are generally considered better off than those who do not own cattle.13 Some of these households obtained cattle through remittances from South Africa in the past. Many obtain large amounts of income through the sale of alcohol, particularly in years when crops fail. Other better off households within the zone have someone in full‐time employment, either in South Africa or within Mozambique. These households may or may not own cattle, cultivate large areas of land and sell alcohol.
13 The exception was in a couple of villages in Bilene District, where key informants stated that no households own cattle.

50
0%
20%
40%
60%
80%
100%
120%
V.Poor Poor Middle Better Off
purchase
payment in kind
crops
0%
20%
40%
60%
80%
100%
120%
V.Poor Poor Middle Better Off
payment in kind
pulses/other
root crops
rice
maize
Sources of Food for the Reference Year (2009‐2010)
The graph presents the sources of food for households in different wealth groups in the livelihood zone for the period February 2009 to January 2010. Despite cassava being the main crop, February represents the start of the consumption year since it is when the green maize harvest begins.
Normally in rural areas, the proportion of food obtained from own crop production increases with wealth. This graph shows an unusual pattern of crop consumption and food purchases and this is mainly because of staple food preferences and the fact that
Sources of Food
In the graph, food access is expressed as a percentage of minimum food requirements, taken as an average food energy intake of 2100 kcals per person per day.
the reference year was a bad year. Very poor households obtained over 60 percent of their food from their own crop production, received some food in exchange for agricultural labor (labelled ‘payment in kind’ in the graph) and purchased approximately a quarter of their food. The contribution of own crop production increased slightly for poor households, while food purchase remained roughly the same. Wild foods were consumed by all groups, but in very small quantities. What is most noteworthy in this graph is that moving from the poor towards the better off wealth group, the contribution of own crops decreased and food purchases increased. This is somewhat perplexing as, although the better off have larger household sizes, they also have larger land sizes and increased means for cultivating that land.
The graph to the right shows a further breakdown of food sources, by food type consumed. As this graph demonstrates, the proportion of maize and rice in the diet increased with wealth in the reference year, while the proportion of cassava and sweet potato (labelled ‘root crops’) decreased. Cassava and sweet potato are the survival crops, making them the most important crops in the zone that year. Maize, however, is the preferred crop, making it desirable for those who are able to afford it.
Sources of Food
In the graph, food access is expressed as a percentage of minimum food requirements, taken as an average food energy intake of 2100 kcals per person per day.

51
The maize component in the graph includes green maize, maize produced, and the purchase of maize grain and maize flour. Cassava and sweet potato were only produced, not purchased, while rice was only purchased, not produced. Pulses and other foods were a combination of purchase and production and ‘other’ consists of cashews, groundnuts, sugar and cooking oil. Payment in kind was mostly cassava, maize and maize flour, but a breakdown of these is not available.
Because middle and better off households have more cash income, they preferred to purchase maize rather than consume cassava. Cassava was highlighted as a crop that is used in years of poor maize production, so perhaps in a very bad year (i.e. a worse year than the reference year) there would be an increase in cassava production and consumption among middle and better off households.
Better off households that received the majority of their cash income through remittances or salaried employment generally had the lowest contribution of own crop production. This could be in part because they do not need to rely on crop production and also because one adult capable of work in the household is not available for cultivating land.
Sources of Cash Income for the Reference Year (2009‐2010)
Sources of Cash Income The graph presents the sources of cash income for households in different wealth groups for the period February 2009 to January 2010. In addition to the differences in total income, the sources of income vary by wealth group.
Very poor and poor households relied on a combination of agricultural labor, alcohol and bush product sales for their income in the reference year. Crop sales among all groups were generally fruit and cashew sales rather than staple crop
Annual income (MT)
4000‐9000
9000‐15000
15000‐30000
30000‐60000
sales, although in a few cases it was a small amount of cassava. This is because crop produc‐
tion in the reference year was below average. In some villages, the very poor relied mainly on exchange of cashews or labor, and so there was actually very little cash exchanged in some households.
The self‐employment category includes both alcohol and bush product sales and was an important income source across all wealth groups in the reference year. Only middle and better off households had remittances (or salaried employment) as an income source. Livestock sales were a common income source for better off households in the reference year, but this was less true in villages in Bilene District than in the other two districts.
Agricultural labor consisted of mainly land preparation and weeding in the reference year, and was generally paid at 25‐30MT per day of work. The price of alcohol was 10‐20MT per liter, and this variance was between villages rather than by the source product (massala, cashew, etc.). Firewood was sold at 10‐15MT per bundle and 150‐250MT per cart. Reeds and poles were sold at 30‐50MT per bundle and grass did not seem to have a specific unit so prices varied considerably from interview to interview.
0
10000
20000
30000
40000
50000
Very Poor Poor Middle Better Off
Annu
al c
ash
inco
me
in M
T self-employment
casual employment
remittances
livestock sales
crop sales

52
0
20
40
60
80
100
Very Poor Poor Middle Better Off
Rel
ativ
e An
nual
HH
exp
endi
ture
(MT)
other
water
clothes
social serv.
inputs
HH items
non-staple food
staple food
Expenditure Patterns for the Reference Year (2009‐2010)
Expenditure Patterns
The graph provides a breakdown of total cash expenditure according to category of expenditure.
The graph presents expenditure patterns for the reference year February 2009 to January 2010. While total expenditure increases with wealth, the expenditure breakdown by percent in this graph demonstrates how much expenditure is spent on different categories. For example, inputs are a much higher proportion of expenditure for better off and middle households than for very poor and poor households. Expenditure on food shows the reverse pattern.
Surprisingly, very poor and poor households did not purchase only cheap maize grain in the ‘staple food’ category. They also purchased large proportions of much more expensive maize meal and rice.
The main ‘household items’ purchased were tea, salt, soap (bar soap and washing powder), kerosene and cooking utensils. Very poor (and in some cases poor) households obtained many of these items in exchange for work or cashews rather than through a direct cash purchase. Firewood was not purchased by any wealth groups in any village, and paying to have grain ground was also not common.
‘Other’ items for the very poor included matches and community obligations, whereas for poor, middle and better off households it was mainly alcoholic beverages and cigarettes. Social services included school and medical expenses. A fee was charged for schooling in some villages and, combined with the associated costs of sending a child to school (uniform, books etc), this expense made up the majority of the social services expenditure with the exception of very poor households, which were often young families with children too young to go to school or elderly people. In most villages in this zone water was not free; a monthly fee of 10‐20MT per month was charged.
Inputs such as livestock drugs and hiring labor were common expenses for middle and better off households. Seed purchase was common for all wealth groups.
Hazards
The main hazard mentioned was inadequate rainfall in roughly one year in every two. Various climate change scenarios in this region predict increased variability in the rains, so this problem is likely to persist. Unlike the neighbouring Alta Maize Zone, lack of rains in this zone does not appear to mean a complete failure of the rains, as the reference year was rated as 2 (bad), yet there was still considerable production.
Coping Strategies
The coping strategies used in bad or very bad years vary by wealth group and the sections above illustrate some of these, since the baseline is for a below average year. In general, households were able to rely a variety of available natural resources, including the production and sale of alcoholic drinks made from cashews, massala and other fruits, and fruit, cashew and bush product sales. The close proximity of main roads and market towns, particularly in the districts of Xai Xai and Bilene allow for sales beyond the village and access to outside sources of cash.
Very poor and poor: The main coping strategies when crop production is low are an increased reliance on cassava (and to some extent sweet potato) rather than maize for food consumption. There is an increase in alcohol and bush product sales in bad years, and an increased dependency on wild foods and gifts, but these are relatively minor sources of food and income. Switching expenditure from more expensive to cheaper

53
staple foods is not a widely used strategy in below average years, but remains an option for very bad years. Reducing expenditure on household items, inputs and social services, in order to purchase more food, is a commonly used coping strategy. There is less cash exchanged and greater barter and exchange for items in bad years, particularly through labor or cashews.
Middle and better off: These households increase their non‐crop income‐generating activities in bad years. Middle households are less able to expand livestock sales than better off households, as their livestock holdings are smaller. In a normal year it is expected that crop sales increase, food purchases decrease, income from oxen rental increases, and expenditure on agricultural labor increases. Non‐essential expenditure is reduced or cut out entirely in bad years, and middle and better off households have more scope to exploit this strategy compared to the very poor and poor.
Program Implications
Development priorities raised by interviewees
All wealth groups
Water access: Additional pumps would decrease the walking distance to collect water as well as the numbers of people using each pump. Small dams or water storage infrastructure for livestock would help to avoid people having to share water sources with livestock.
Access to health services: The distance to hospitals is far with no transportation (ambulances) for emergency cases and often the nearest hospital does not have the required services (maternity).
Electricity: Households are reliant on kerosene for lighting and mentioned electricity as a development priority.
Very poor and poor
Access to cattle/oxen: Through cattle donation schemes or perhaps something more innovative, households within these wealth groups could plough and cultivate larger areas of land.
Seeds: The only seeds available to purchase are often from other regions and do not do well in local soils. An increased availability of locally suitable seeds was highlighted as a priority.
Middle and better off
Development of small baixa areas (irrigation schemes): Some villages have access to small nearby baixa areas which are waterlogged during the rainy season and cannot be cultivated. Key informants stated that they offer development potential.
Phone network: Increased mobile phone coverage was expressed as a priority by these wealth groups, as many areas lack reception.
Access to credit: Small loans were requested for investment in livestock and agriculture and for increasing the ability of households to get through bad years.
Additional Development Priorities: Increased investment in alternatives to alcohol distilling/brewing beer
The sale of alcoholic drinks is a very lucrative activity and an important coping strategy for households in this zone in bad years. It is also unregulated and causes various health problems such as blindness and facial disfigurement. If the brewing or distilling process was regulated, or there was increased investment into the use or processing of fruits and cashews that result in alternative incomes, this could increase the general health of the population while at the same time maintaining or potentially increasing their ability to earn income from these readily available products.

54
Mozambique Livelihood Baseline Profile, Zone 44
Lower Limpopo Alta Maize Livelihood Zone
December 201014 Zone Description
The Alta Maize Livelihood Zone of the Lower Limpopo Basin falls in Guija and Chokwe Districts of Gaza Province. This zone borders the Lower Limpopo Alta Cassava Livelihood Zone to the south, the Semi‐Arid Interior Zone to the Northeast and the Baixa zones throughout. It consists of mainly plains and flat land, but on higher ground than the baixa zones in the same districts, as the zone name implies. The soil types vary, with fertile alluvial soils with poor drainage to the south west of the zone and less fertile sandier soils with good drainage to the east and northeast. Overall the soils in the zone are rated between marginally and moderately suitable for agriculture.
The topography is mainly brush, grassland and forest. Wild fruits such as macuacua, mafurra, massala and nuts such as canhu are found and consumed in the zone, but not in very large quantities compared to the Alta Cassava Livelihood Zone. The altitude range of the zone, while called alta, is actually only 21‐60 meters above sea level.15 There is one main rainy season during the summer months, with rainfall increasing from the north (471‐540mm per year) to the south (541‐600mm per year) of the zone. Additionally, there is a small amount of rain in the winter, ‘dry’ season, with heavier rainfall in the south (177‐225mm per year) than the north of the zone (121‐176mm per year)16. Temperatures range from 15‐27 degrees Celsius in the coldest months (July and August) to 20‐33 degrees Celsius in the hottest months (December and January).
The main towns near the zone are Chokwe and Guija and the major nearby infrastructural points are the railroad from Maputo to Zimbabwe, the road to Chicualacuala and the Macarratane Dam. This zone is one of the most densely populated of all the zones in the Limpopo Basin, with 20‐50 people per square kilometre. The main language is Changana, spoken throughout the zone. As well as crop and livestock production, the people in this zone take advantage of the nearby main roads and railway to sell charcoal and firewood and to access South Africa for additional employment. Combined with local agricultural labor, these activities provide the income required for food purchase in years when crop production is low.
Crop production in this zone is rainfed and inputs such as fertilizer and pesticides are not commonly used.
14 Field work for the current profile was undertaken in October‐November 2010. The information presented refers to February 2009‐ January 2010, a below average year for food security by local standards. Provided there are no fundamental and rapid shifts in the economy, the information in this profile is expected to remain valid for at least five years (i.e. until at least 2015). All prices referred to in the document are for the reference year. 15 The altitude, rainfall and temperature information in this section is taken from the Atlas for Disaster Preparedness and Response in the Limpopo Basin, INGC, UEM‐Department of Geography and FEWS NET MIND, 2003. 16 Rainfall amounts provided are average totals for the entire summer (October to March) and winter (April to September) periods.

55
The main crops cultivated are maize, cowpeas, groundnuts and pumpkin, with root crops cultivated in roughly a third of villages. The land is cultivated manually or with oxen, with the better off renting out or exchanging their oxen for labor with poorer households. There are two main planting seasons and the majority of crops are short‐cycle crops, with the exception of cassava, which is not consistently planted throughout the zone. The zone produces crop surpluses in years when rainfall is normal to good. However, this zone is regularly affected by inadequate rainfall and in such years households do not produce sufficient crops for their own consumption.17
Cattle provide the means to cultivate larger land areas and constitute one of the main determinants of wealth in this zone. Cattle are owned by middle and better off wealth groups and are often obtained through purchase with income earned in South Africa. Goats and chickens were commonly owned among all wealth groups, with a minority of households also owning pigs, donkeys and sheep. Livestock are grazed on the large quantities of uncultivated land that exists throughout this zone. The destruction which occurred during the war was commonly cited as a reason why herd sizes are not bigger. The consumption of cow’s milk constitutes an important caloric contribution for households that own cattle.
The main constraints to production in this zone are lack of rainfall and the time it is taking to rebuild herds since the war. Available land is not a constraint, only a lack of the labor or oxen required for cultivation.
Non‐governmental organizations such as Joint Aid Management (JAM) and Samaritan’s Purse operate in the area providing food at schools and grain distribution to the sick and elderly.
Markets
Chokwe is the main market for all villages in both Chokwe and Guija Districts. Most food and non‐food items are purchased there. The cost of one way transportation to Chokwe ranged from 40‐60 MT per person (plus an additional charge for sacks) in the reference year.
The quality of roads is quite variable between villages. In the rainy season some roads from Chokwe to the villages in this zone are completely impassable. However, the transport links from Chokwe are good. There are direct buses from Chokwe to South Africa, and additionally the main road from Maputo to Chicualacuala and Zimbabwe passes through Chokwe.
Products such as livestock and charcoal are usually sold to traders who come to the village, rather than taken to Chokwe by the individual sellers. The traders are often from Maputo or Chokwe (outside of this livelihood zone in general).
17 According to community leader interviews, the current consumption year (2010‐11) is average to good, while the previous three years have been marked by poor to very poor rainfall.

56
Feb Mar Apr May Jun Jul Aug Sep Oct Nov Dec Jan
Seasons Rainy season Rainy seasonLegendMaize 1st season GH GHMaize 2nd season GHCowpeasCowpeas 2nd seasonGroundnutsGroundnuts 2nd seasonBambara nut 1st seasonBambara nut 2nd seasonPumpkinMelanciaMassalaCanhuLean seasonBuying foodAnimal diseasesLand preparationWeedingHigher pricesMilkMigrat ion
Harvest Planting Peak Period GH Green harvest
Dry season Dry season
Seasonal Calendar
The main rainy season begins in October or November, and this is when the main season of maize (the main crop in this livelihood zone) is planted, along with cowpeas and groundnuts. A second18 maize planting is common from May to July, and a second season of groundnuts, pigeon peas and cowpeas can also be planted at this time, while some villages only plant the second season with groundnuts. The cassava planting varies from village to village, and it takes one year from the time it is planted to mature. As in the Alta Cassava Zone, cassava is not harvested all at once, but instead is taken from the field as it is required by the households. Sweet potato is similarly harvested, usually over a period of about three months, and it can be planted whenever there is sufficient rainfall. The months of the lean season, higher purchases and higher prices all occur at the end of the consumption year, before the first season maize harvest.
Livestock sales in a normal year take place at the end of the year, at the same time as higher food purchases. However, in the reference year, because the rains were poor and production was low, animals were sold throughout the year, as income was required to purchase food. Cows are the only animals milked in this zone, mainly from January to July according to community leaders. There did not appear to be any efforts by farmers to control when calves are born.
Aside from livestock sales, the main sources of income in the reference year were charcoal sales, firewood sales, agricultural labor and working in South Africa. In general these occur throughout the year. Charcoal and firewood sales often decrease during the peak rainy season due to difficulty of access to the forests, time spent working in the fields, wetness of wood and difficulty for traders to access villages. All types of agricultural labor are undertaken, however weeding is the most common and peaks between December and March. Work in South Africa is all year, but the peak recruitment month and time when people leave their village is in January, after migrants have come home for the Christmas holidays. It is common that a potential migrant in a village will wait and go to South Africa with a family member returning in January.
18 Note that what is called the ‘first season’ and ‘second season’ varies from one village to the next.

57
HH sizeLand area cultivated
(ha)Crops cultivated Livestock/Asset Holdings Other Assets
Very poor 4‐6 0.5‐1.0Maize, cowpeas, groundnuts, root
cropsChickens
1‐2 adults capable of working
Poor 6‐8 1‐1.5Maize, cowpeas, groundnuts, root
crops
Chickens Goats: 0‐10
2‐3 adults capable of working
Middle 6‐10 2‐3Maize, cowpeas, groundnuts, root
crops
Chickens Goats: 5‐10 Cattle 2‐10 Oxen:1‐3
1 plough 2‐4 adults capable of
working
Better off 8‐12 4‐5Maize, cowpeas, groundnuts, root
crops
Chickens Goats: 5‐15 Cattle 10‐20 Oxen: 4‐6
2‐3 ploughs 2‐4 adults capable of
working
Wealth Groups Characteristics
Note: Pigs, ducks and donkeys were found in some wealth groups in some villages, but were not common throughout.
0% 20% 40%% of households
High staple food prices occur during the lean season in a normal year. Greater price fluctuations are found between years than within years. Years of poor rain result in an increase in staple food prices and an increase in charcoal and livestock sales that lead to a price decrease for these commodities. These price trends are not usually found in years that are only poor, but very poor.19
Wealth Breakdown
The main determinants of wealth in this zone are: number of livestock owned, area of land cultivated, amount of income from South Africa, and number of adults capable of work. The area of land cultivated increases with wealth, but this is related to the ability to cultivate land (i.e. access to oxen, numbers of people who can work) rather than to the size of land owned. The types of crop cultivated are the same across wealth groups and charcoal and firewood are sold by all (although the quantities for all of these vary by wealth group). The proportion of female‐headed households is high across all wealth groups (estimated by key informants at about 60 percent). Poorer households are often female‐headed because their men have died or left the family. Better off households are often female‐headed because their men are working in South Africa. Although men with one wife tend to be the norm, middle and better off households are more likely to have more than one wife than poorer households, which partly explains their larger household sizes.
The main difference between very poor and poor households is the availability of labor in the household and the overall household size. Very poor households often consist of elderly people living with grandchildren or younger families with a high proportion of small children. The difference between the poorer and better off groups is access to oxen. Very poor and poor households do not own oxen or cattle themselves, but can rent or work in exchange for the use of oxen. (Often four to five days of weeding or 200 MT would earn one day of oxen use.) A sharing system exists where one person can take care of another person’s cattle and gain ownership of one in two calf births, but it seems few people are able to begin owning cattle through this system. More commonly, people purchase cattle with income earned in South Africa.
The difference between middle and better off households is the number of cattle owned, the amount of charcoal they are able to sell or the amount of remittances received from South Africa. The activities are generally the same between the two groups, but the amounts are different.
19 When qualifying the type of year, community leaders were asked to rate the year on a scale from 1 to 5, where 1=Very poor, 2=Poor, 3=Average, 4=Good and 5=Very Good.

58
Charcoal and firewood are income generating activities undertaken by households from all wealth groups, whether or not they are female‐headed, but this is a very labor intensive activity and the forest resources are becoming increasingly further from the villages. Smaller households, and households with less labor, have difficulty in selling as much as larger households due to the time it requires away from the house.
Sources of Food for the Reference Year (2009‐2010)
The graph presents the sources of food for households in different wealth groups in the livelihood zone for the period February 2009 – January 2010. February represents the start of the consumption year since it is when the green maize harvest begins.
The reference year was rated as below average in this livelihood zone, with several villages rating it as very bad. The rains of 2008‐09 were poor and the resulting crop production was low. The main source of food for all wealth groups was food purchase, followed by crop production. The school feeding is a corn‐soya blend porridge that is distributed to schools in Guija and
Sources of Food
In the graph, food access is expressed as a percentage of minimum food requirements, taken as an average food energy intake of 2100 kcals per person per day.
Chokwe Districts by JAM. This project has funding for the next five years.
Although it is a minor source of food, very poor and poor households relied more heavily on wild foods such as macuacua, canhu, massala and mafura than middle and better off households. In contrast, middle and better off households had access to livestock products, particularly cow’s milk. Crop production was low among all wealth groups in the reference year, but middle and better off households were able to produce a slightly higher percentage of their food requirements than very poor and poor households. In some villages, very poor and poor households were able to work in exchange for food, however this was not common across the groups and so this food has been included in purchase in the graphic above instead of being illustrated separately.
Maize, maize meal, and rice were the main foods purchased by all wealth groups. Beans and fish were also purchased by poor, middle and better off households. All of these items were generally purchased throughout the year, rather than being seasonal, along with oil and sugar.
0%
20%
40%
60%
80%
100%
120%
V.Poor Poor Middle Better Off
wild foodsschool feedingpurchasepayment in kindlivestock prod.crops

59
05000
10000150002000025000300003500040000450005000055000
Very Poor Poor Middle Better Off
Ann
ual c
ash
inco
me
in M
T agricultural labour
oxen hire
livestock sales
remittances
firewood/charcoal
Sources of Cash for the Reference Year (2009‐2010)
Sources of Cash Income The graph presents the sources of cash income for households in different wealth groups for the period February 2009 – January 2010. Cash income was particularly crucial in this zone during the period February 2009 to January 2010, given the low level of crop production experienced throughout the zone. In addition to differences in the amounts earned by different wealth groups, differences also exist in the manner in which income was earned. Selling charcoal and firewood provided the majority
Very poor Poor Middle Better off of income for all wealth groups20, but while households within the middle and better off wealth groups also earned
Annual income (MT) 10,000‐ 25,000 20,000‐ 35,000 35,000‐ 50,000 45,000‐ 60,000
income from livestock sales, oxen rental and remittances, the very poor and poor and relied almost completely on firewood and charcoal. Agricultural labor opportunities were very limited in the reference year. Although weeding takes place after planting and before the harvest, this was the third bad year in a row in many villages and the demand for local agricultural labor was much lower than normal.
Charcoal was sold at 120‐200 MT per sack and firewood was sold for 10‐20 MT per bundle or 250‐550 MT per cart in the reference year, depending on the size of the cart and the village. Wage rates for agricultural labor in this zone were approximately 50 MT per person per day for all agricultural activities and oxen were rented out at 200‐250 MT per day for ploughing.
As an income activity, producing charcoal is very labor intensive as the forests are increasingly becoming farther from villages and requires long periods of time spent away from the house. Despite this, women from female‐headed households reported that they are able to produce charcoal. It is the main strategy that households turn to in years when crop production is poor. However, it is an environmentally destructive practice and relies on a limited natural resource.
In a normal year of crop production, it was reported that firewood and charcoal sales would be lower for all wealth groups, income from agricultural labor for very poor and poor households would be greater, and crop sales and oxen rental would be greater for the middle and better off. Regarding remittances, it is likely that more people leave for South Africa after or during a year of poor rains.
20 One village in this zone did not sell charcoal but instead made and sold mats from reeds. The reeds were readily available in this village while the forests for charcoal production were farther away.

60
0%
20%
40%
60%
80%
100%
V.Poor Poor Middle Better offRel
ativ
e A
nnua
l HH
Exp
endi
ture
(MT)
other
clothes
social serv.
inputs
water
HH items
non-staple food
staple food
Expenditure Patterns for the Reference Year (2009‐2010)
Expenditure Patterns
The graph provides a breakdown of total cash expenditure according to category of expenditure.
The graph presents expenditure patterns for the reference year February 2009 – January 2010. While total expenditure increases with wealth, the expenditure breakdown by percent in this graph demonstrates how much expenditure is spent on different categories.
The proportion of expenditure on staple food decreased with wealth. Middle and better‐off households spent much more, in absolute terms, on most other items, including non‐staple foods such as vegetable oil and sugar, and clothing.
The main household items purchased are tea, salt, soap (bar soap and washing powder), kerosene and cooking utensils, and these increase as a percent of total expenditure with wealth. Firewood was not purchased by any wealth groups in any village, and paying to have grain ground was also not common. ‘Other’ items purchased by the very poor included matches and community obligations, whereas for poor, middle and better off households it was mainly alcoholic beverages and cigarettes. Social services included school and medical expenses. Primary school was often free and school expenses included uniform, stationery and textbooks. In most villages in this zone, water was not free; a monthly fee of 10‐20 MT per month was charged. In only one village visited was water purchased by jerrycan. Water expenses were much higher in that village. Inputs were a much higher percentage of expenditure for middle and better off households than for the very poor and poor. Inputs such as seed were purchased by households in all four wealth groups. Oxen rental was common for poor households. Hiring labor was common among households in the middle and better off wealth groups, although it was more common and comprised greater expenditure among the better off households than those in the middle wealth group.
As expected, staple food provided a decreasing percentage of total expenditure moving from the very poor to the better off wealth groups. Interestingly, however, the graph to the left shows the breakdown of type of staple food purchase among wealth groups. With the exception of larger maize purchases by poor households, maize, maize flour and rice purchase does not vary greatly across wealth groups. This is despite the fact that the prices per kilo for maize, maize flour and rice were approximately 11MT, 16MT and 21MT21 respectively in the reference year, and
21 These prices ranged between villages (although most said they purchased in Chokwe) and by the unit purchased (by kg, lata (17.5kg) or sack (25kg or 50kg).
0%
20%
40%
60%
80%
100%
VeryPoor
Poor Middle BetterOff
Percen
t of Staple Food
Purchase
MaizeFlour
Maize
Rice

61
these purchases occurred in a bad year. When asked why cheaper maize grain was not the only staple purchased by very poor and poor households, most key informants replied that they purchased maize flour so they did not have to grind it and because it was sometimes more readily available, while rice was purchased for variety.
Hazards
The main hazard that occurs in this livelihood zone is lack of rain. While the 2010 consumption year has been rated as average to good across the zone, the 2009 consumption year and the two years immediately prior were all rated as bad to very bad due to the failure in quantity, longevity or timing of the rain. As the farmers in this zone have no access to irrigation, poor rains result in crop failure and so they need to resort to other income‐generating activities to purchase food. Drought resistant crops, such as cassava, were found in approximately a third of villages and seed for cassava was mentioned as a constraint to the more widespread production of this crop. In the previous three years, the rains were so poor that some villages mentioned that their cassava had died out. While the reference year for which information was obtained for this baseline was below average, it is possible that this type of year will become increasingly common in future years, depending on the impacts of climate change.
Other hazards were not consistently reported in all villages, but included elephants, pests, monkeys, land mines and various livestock diseases (which periodically kill nearly all chickens, goats and pigs).
Coping Strategies
The coping strategies used in bad or very bad years vary by wealth group and the sections above illustrate some of these, since the baseline is for a below average year.
Very poor and poor: The main coping strategy when crop production and income from agricultural labor are low is to increase charcoal and firewood sales. Very poor and poor households also increase dependency on wild foods and gifts, but these are relatively minor sources of food and income. Switching expenditure from more expensive to cheaper staple foods is not a widely used strategy in below average years, but remains an option for very bad years. Reducing expenditure on household items, inputs and social services, in order to purchase more food, is a commonly used coping strategy.
Middle and better off: Middle and better off households increase livestock sales in bad years. There is a limit to how many animals a household can sell without negatively affecting future production and livelihoods. Middle households are less able to expand this strategy than better off households, as their livestock holdings are smaller. Another strategy for these groups, and particularly for those households that do not receive regular remittances, is to increase sales of charcoal and firewood. This somewhat compensates for the loss of income from oxen rental and possible crop sales in better years. Non‐essential expenditure is reduced or cut‐out entirely in bad years, and middle and better off households have more scope to exploit this strategy compared to the very poor and poor.
Program Implications
The implications for future programming are two‐fold, those that were highlighted by the wealth group interviewees themselves and those made by the assessment team following detailed discussions and observations in the field. All of these suggestions require further detailed research and feasibility studies.
Development priorities raised by interviewees
All wealth groups
Water access: Additional pumps would decrease the walking distance to collect water as well as the numbers of people using each pump. Small dams or water storage infrastructure for livestock would help to avoid people having to share water sources with livestock.

62
Access to health services: The distance to hospitals is far with no transportation (ambulances) for emergency cases and often the nearest hospital does not have the required services (maternity).
Schools: While most villages had a primary school in their village, very few had access to a secondary school nearby, which greatly restricts access to secondary education.
Electricity: Households are reliant on kerosene for lighting and mentioned electricity as a development priority.
Very poor and poor
Access to cattle/oxen: Through cattle donation schemes or perhaps something more innovative, households within these wealth groups could plough and cultivate larger areas of land and, through sales, have an alternative to destructive charcoal production in poor years of crop production.
Middle and better off
Development of small baixa areas (irrigation schemes): Some villages have access to small nearby baixa areas which are waterlogged during the rainy season and cannot be cultivated.
Business development training: The development of businesses in to stimulate commerce and economic activity at village level and ideally reduce dependency on firewood and charcoal sales.
Phone network: Increased mobile phone coverage was expressed as a priority by these wealth groups, as many areas lack reception.
Access to credit: Small loans were requested for investment in livestock and agriculture and for increasing the ability of households to get through bad years.
Development priorities suggested by assessment team
Alternative (and sustainable) income‐generating activities
Households are largely reliant on environmentally destructive practices in years of poor crop production. Firewood and charcoal sales are not sustainable income‐generating activities in the long term. Not only are these resources being depleted, affecting supply, but as African countries begin to adopt cleaner energy strategies demand for this resource may decline in the next few decades. Alternative, sustainable income strategies for all wealth groups in this zone must be considered immediately.
For example, this zone borders the extremely productive baixa zones, which produce large surpluses of high value crops, destined for large Mozambican markets. Whether there is a role for increased agricultural employment, trading, processing or other employment should be explored, together with the existing constraints to these options (labor already oversupplied? transportation access/cost? accommodation access/price? high risk? literacy/business skills? not desirable employment?).
Additional income‐generating opportunities within the zone should be explored. For example, most traders are not local but are instead come from Maputo and Chokwe to purchase livestock, crops and charcoal. An increase in trading activity by people from within the zone could increase self‐employment income while at the same time possibly offering more competitive prices for villagers. The opportunities and constraints to this type of activity should be explored, as well as additional types of income‐generating activity in this area.
Finally, cattle sales provide an important income source and coping mechanism in years of poor production while at the same time facilitating increased production in normal years. Some sort of cattle distribution

63
scheme or accelerated cattle sharing program could be implemented in this area, as the costs of keeping cattle are low due to large areas of uncultivated grazing land. In order to be successful, this would have to be accompanied by efforts to improve animal health services.
Increased facilitation of migrants going to South Africa
Remittances from workers in South Africa were underreported in some interviews, possibly because of wanting to seem poor (in case the assessment team was involved in aid/cattle distribution), as well as fear of unreported income being discovered (and taxed) by the government. However, multiple households mentioned some of the more negative aspects of having a family member migrate to South Africa to work. As many people cross the border illegally, they try to reduce the frequency that they cross, reducing their links (and subsequently their remittances) to their families in Mozambique. It is possible that increased co‐operation between South Africa and Mozambique for the facilitation of temporary employment migration could reduce the risks associated with working in South Africa and assist in maintaining ties between migrant workers and their families in Mozambique.
Drought resistant crops
While maize is the preferred crop in this zone, assuming that years or poor rainfall will continue, more drought resistant crops could possibly be introduced. Cassava is consumed in approximately a third of the villages in this zone, and in these villages it comprises 10‐30 percent of the total kilocalories consumed by households. The reasons that cassava is not grown in all villages in the zone should be explored, together with the feasibility of its introduction.

64
ANNEXES
Methodology22 The profiles in this report describe the major characteristics of eight livelihood zones in the Limpopo Basin of Mozambique. The information for these profiles was gathered using the Household Economy Approach. Livelihood Zone: A livelihood zone is an area within which people share broadly the same patterns of access to food (i.e. they grow the same crops, keep the same types of livestock, etc.). They also share broadly the same access to markets. Patterns of livelihood clearly vary from one area to another. Local factors such as climate, soil, access to markets, etc all influence livelihood patterns. The first step in a Household Economy Analysis is therefore to prepare a livelihood zone map. This map delineates geographical areas within which people share basically the same patterns of access to food and have the same access to markets. The remainder of this section explains some of the terms used in HEA and in this profile. Wealth Breakdown: Where a household lives is one factor determining its options for obtaining food and generating income. Another factor is wealth, since this is the major factor determining the ability of a household to exploit the available options within a given zone. It is obvious, for example, that better off households owning larger farms will in general produce more crops and be more food secure than their poorer neighbours. Land is just one aspect of wealth, however, and wealth groups are typically defined in terms of their land holdings, livestock holdings, capital, education, skills, labour availability and/or social capital. Defining the different wealth groups in each zone is the second step in a Household Economy analysis, the output from which is a wealth breakdown23. For the purpose of this assessment, a household was defined as people eating from the same pot and also sharing the same resources. Household Economy Baseline: Having grouped households according to where they live and their wealth, the next step is to generate household economy baseline information for typical households in each group for a defined reference or baseline year. Food access is determined by investigating the sum of ways households obtain food – what food they grow, gather or receive as gifts, how much food they buy, and so on. The baselines also include detailed information on how much cash income is earned in a year by each wealth group and how that money is spent. Household Coping (or Response) Strategies: Once this baseline is established, an analysis can be made of the likely impact of a shock or hazard in a bad year. This is done by assessing how food access will be affected by a shock, what other food sources can be added or expanded to make up initial shortages, and what final deficits emerge. Outcome Analysis: There is one basic principle underlying the Household Economy Approach. This principle states that: an analysis of local livelihoods is essential for a proper understanding of the impact – at household level – of hazards such as drought or conflict or market dislocation. Total crop failure may, for example, leave one group of households destitute because the failed crop is their only source of staple food. Another group, by contrast, may be able to cope because they have alternative food and income sources. These alternative sources – such as livestock to sell or relatives elsewhere who can assist – can make up the production shortfall. Thus, effective hazard impact assessments must be based on livelihood analysis, and livelihood analysis itself involves several steps. 22 This section has been adapted from the SNNPR Livelihood Profiles Introduction and Regional Overview, prepared by FEG for the USAID FEWS NET project and the Ethiopian Government’s DPPC. 23 It is important to bear in mind for this analysis that we are thinking of wealth in relative (and local) terms. Statistical data may indicate that 80% or even 90% of the population in a particular area lives below the national poverty line, but this is measuring poverty on a national, absolute scale. In a livelihoods analysis we are interested in understanding some of the differences between different groups within the community and the reasons for these – in which case it is not particularly useful to lump 80% or 90% of the population together into one group.

65
The objective is to investigate the effects of a hazard on future access to food and income, so that decisions can be taken about the most appropriate types of intervention to implement. The rationale behind the approach is that a good understanding of how people have survived in the past provides a sound basis for projecting into the future. Three types of information are combined: (i) information on baseline access, (ii) information on hazard (i.e. factors affecting access to food/income, such as own production or market prices) and (iii) information on response strategies (i.e. the sources of food and income that people turn to when exposed to a hazard). The approach can be summarized as follows:
Baseline + Hazard + Response = Outcome
The idea is that once the baselines are compiled they can be used repeatedly for this type of outcome analysis over a number of years – until significant changes in the underlying economy render them invalid. A good household economy baseline will generally be valid for between 3 and 10 years. What varies is the prevailing level of food security, but this is a function of variations in hazard, not variations in the baseline. Put another way, the level of crop or livestock production may vary from year to year (hazard), but the underlying pattern of production (the baseline) does not usually change very rapidly. The profiles are divided into a number of sections: Zone description offers a general description of local livelihood patterns (livestock rearing, crop production, off‐farm income generation etc.). Markets contains basic information on the marketing of local production and on any importation of staple food into the zone. Seasonal Calendar sets out the timing of key activities during the year. This is useful in a variety of ways, e.g. to judge the likely impact of a hazard according to its timing during the year, or to assess whether a particular activity is being undertaken at the normal time in the current year. This is followed by four sections that provide the core information on the ‘household economy’ of the zone. The Wealth Breakdown section describes four main wealth groups (‘very poor’, ‘poor’, ‘middle’ and ‘better‐off’), explaining the differences between these groups and how this affects potential access to food and cash income. The Sources of Food and Sources of Cash sections examine patterns of food and income access at each level of wealth, relating these to the characteristics of each group. An annual picture is presented, with food expressed as a percentage of 2100 kcals per person per day. The Expenditure Patterns section is of interest in showing what proportion of their annual cash budget households at the different wealth levels spend on food, on household items, on production inputs, etc. The sections on Hazards provide information on the different types of hazard that affect the zone, differentiated by wealth group where this is appropriate. Response Strategies describe the various strategies available to different types of household in the zone, together with a judgement of the likely effectiveness of the strategies. The final section, Programme Implications, outlines some ideas for longer‐term programming.

66
The profiles presented here were compiled through a combination of fieldwork and reference to existing secondary data sources.24 To start, a three‐day livelihood zoning (or mapping) workshop was conducted with the directors of the District Economic Activities Services from 14 districts and with representatives from the Provincial Directorate of Agriculture in Gaza Province, the Technical Secretariat for Food Security and Nutrition (SETSAN) in Maputo, the National Institute for Disaster Management (INGC) in Gaza Province, Save the Children, IRD, and Associação para o Desenvolvimento das Comunidades Rurais (ADCR). The fieldwork to gather baseline household economy information was undertaken in October‐November 2010 by four field teams composed of university students with previous experience of HEA fieldwork in Zambezi Region and led by four experienced HEA team leaders. Each team visited at least eight villages in each livelihood zone. The villages were selected in collaboration with district officials and were chosen to be typical or representative of the livelihood zones. Most of the field data was collected directly at village level from community key informants and focus groups through lengthy semi‐structured interviews. At least 10 community leaders and 20 representatives of wealth groups were interviewed in focus groups in each village. Market visits and interviews with traders were also conducted.
24 For a more detailed description, please refer to The Household Economy Approach: A guide for programme planners and policy-makers (2008), available from sale from Save the Children UK (www.savethechildren.org.uk/en/54_5678.htm), or to The Practitioners’ Guide to the Household Economy Approach (2008), available at www.feg-consulting.com/resource/ practitioners-guide-to-hea.

67
Comparing Eight Livelihood Zones in the Limpopo Basin This section briefly compares the eight Limpopo Basin baselines by addressing three questions separately for four wealth groups.
• Firstly, where do people typically get their basic food from, and in what proportions? • Secondly, where do people get their cash from and in what proportions? • Thirdly, what do people spend their cash on and in what proportions?
These results are described in some detail in the profile for each livelihood zone. Here we look at overall patterns and make some more general observations. The average wealth breakdown for the eight livelihood zones taken together is 30% very poor, 30% poor, 24% middle and 16% better off. The variation to this pattern amongst livelihood zones is not great: the very poor and poor add up to 55‐65% in all zones; nowhere are better off households more numerous than the middle households. The most common variation is between the very poor and poor (i.e. whether one or the other is around 25% or 35%). In terms of determinants of wealth, land areas cultivated and livestock holdings are the most important determinants across the zones. Very poor households do not own cattle in any livelihood zone and do not own goats in most zones. Some poor households in the baixa and Upper Limpopo zones own a small number of cattle, but not in the interior and alta zones. Some poor households in all zones own goats. Middle and better off households typically own both cattle and goats. Livestock holdings for these groups are highest in the baixa irrigated zone (although sometimes the livestock are physically located in other zones). Land areas cultivated are smallest across the four wealth groups in the two alta zones and highest in the two interior zones. Wealth breakdowns are only a rough indicator of comparative wealth between zones, and are more relevant to the internal structure of each zone as described in the individual profiles. Looking across the sources of food graphs below, the first question must be about relative food self‐sufficiency (i.e. consumption of own produce) which is represented by the green and white bars for staple crops and livestock products respectively. Overall, the majority of people living in the Limpopo Basin did not produce enough food to feed themselves in the reference year and got most of the balance from the market – the red bar. Certain livelihood zones stand out for particularly low food self‐sufficiency: the Upper Limpopo Massingir Riverine Zone and the Lower Limpopo Alta Maize Zone. It should be noted that the reference year was a below average year in these two zones (and in the Upper Limpopo Chicualacuala Riverine and Lower Limpopo Alta Cassava Zones). Payment in kind made a small contribution to the food sources of very poor and poor households in a few zones. Food aid and ‘other’ sources (wild food and gifts) also made small contributions. Given the heavy dependence of most households on buying basic food, the question of how people get cash is important. With the exception of the two baixa zones (LZ 39 and LZ 42), income from crop sales (in green in the sources of income graphs below) was insignificant in the reference year. Income from livestock sales was important and increased significantly with wealth. For very poor and poor households, income from ‘self employment’ (in pink) and from ‘employment’ (or casual labor, in red) together was the most important across all zones. Income levels were highest for very poor and poor households in the two zones where own production was lowest and the need to purchase food was highest: the Upper Limpopo Massingir Riverine Zone and the Lower Limpopo Alta Maize Zone. Much of the ‘self employment’ income in these zones came from unsustainable sources and at the expense of the local environment in the form of charcoal and firewood sales. Income levels were highest for better off households in the highest potential livelihood zone, which is the Lower Limpopo Baixa Irrigated Zone. In terms of indicators of relative food security, the proportion of expenditure spent on staple food (the green bar in the expenditure graphs below) is important. Expenditure on non‐staple foods, in white, is of some interest too as a clue to the standard of living. Very poor households in the four interior and baixa

68
zones spent around 50% of their income on food (staple and non‐staple food), while those in the four Upper Limpopo riverine and Lower Limpopo alta zones spent around 70% of their income on food. This is most probably a reflection of the fact that the reference year was a year of average production for the former four zones, while it was a year of below average production for the latter four. Expenditure on agricultural and livestock inputs (the yellow bar) tended to increase with wealth.
Sources of Food 2009‐10 (% of 2100 kcals per person per day)
Very Poor Households Poor Households
0%
20%
40%
60%
80%
100%
120%
LZ 34 LZ 35 LZ36 LZ38 LZ 39 LZ 42 LZ 43 LZ 44
Crop production Livestock products Payment in kindPurchase Food aid Gifts, other
0%
20%
40%
60%
80%
100%
120%
LZ 34 LZ 35 LZ36 LZ38 LZ 39 LZ 42 LZ 43 LZ 44
Crop production Livestock products Payment in kindPurchase Food aid Gifts, other
Middle Households Better Off Households
0%
20%
40%
60%
80%
100%
120%
140%
LZ 34 LZ 35 LZ36 LZ38 LZ 39 LZ 42 LZ 43 LZ 44
Crop production Livestock products Payment in kindPurchase Food aid Gifts, other
0%
20%
40%
60%
80%
100%
120%
140%
LZ 34 LZ 35 LZ36 LZ38 LZ 39 LZ 42 LZ 43 LZ 44
Crop production Livestock products Payment in kindPurchase Food aid Gifts, other
LZ 34 = Sorghum dominant semi arid interior LZ 35 = Maize dominant semi arid interior LZ 36 = Upper Limpopo Chicualacuala riverine LZ 38 = Upper Limpopo Massingir riverine
LZ 39 = Lower Limpopo baixa non‐irrigation LZ42 = Lower Limpopo baixa irrigation LZ 43 = Lower Limpopo alta cassava LZ 44 = Lower Limpopo alta maize

69
Sources of Cash Income 2009‐10 (MT per household per year ‐ note scale is different in each graph) Very Poor Households Poor Households
0
5,000
10,000
15,000
20,000
LZ 34 LZ 35 LZ36 LZ38 LZ 39 LZ 42 LZ 43 LZ 44
Crop sales Livestock product salesLivestock sales Employment and remittancesSelf‐employment Other
05,000
10,00015,00020,00025,00030,00035,000
LZ 34 LZ 35 LZ36 LZ38 LZ 39 LZ 42 LZ 43 LZ 44
Crop sales Livestock product salesLivestock sales Employment and remittancesSelf‐employment Other
Middle Households Better Off Households
0
20,000
40,000
60,000
80,000
100,000
LZ 34 LZ 35 LZ36 LZ38 LZ 39 LZ 42 LZ 43 LZ 44
Crop sales Livestock product salesLivestock sales Employment and remittancesSelf‐employment Other
0
100,000
200,000
300,000
400,000
500,000
LZ 34 LZ 35 LZ36 LZ38 LZ 39 LZ 42 LZ 43 LZ 44
Crop sales Livestock product salesLivestock sales Employment and remittancesSelf‐employment Other
Expenditure Patterns 2009‐10 (MT per household per year)
Very Poor Households Poor Households
0%
50%
100%
LZ 34 LZ 35 LZ36 LZ38 LZ 39 LZ 42 LZ 43 LZ 44Staple food Non‐staple food HH itemsWater Inputs Social servicesClothes Other
0%
50%
100%
LZ 34 LZ 35 LZ36 LZ38 LZ 39 LZ 42 LZ 43 LZ 44Staple food Non‐staple food HH itemsWater Inputs Social servicesClothes Other
Middle Households Better Off Households
0%
50%
100%
LZ 34 LZ 35 LZ36 LZ38 LZ 39 LZ 42 LZ 43 LZ 44Staple food Non‐staple food HH itemsWater Inputs Social servicesClothes Other
0%
50%
100%
LZ 34 LZ 35 LZ36 LZ38 LZ 39 LZ 42 LZ 43 LZ 44Staple food Non‐staple food HH itemsWater Inputs Social servicesClothes Other
70
Implications for Future Programming The final section of each livelihood zone profile outlines ideas for programming that were generated at the end of the fieldwork by the field teams. These ideas fall into two broad categories: those that were highlighted by the wealth group interviewees themselves and those made by the assessment team following detailed discussions and observations in the field. These are not exhaustive and are not based on feasibility studies, but are offered by the field teams as ideas for further discussion and exploration.
Livestock: Cattle sales provide an important income source and coping mechanism in years of poor production, while at the same time facilitating increased production in normal years. Some sort of cattle distribution scheme or cattle sharing program could be implemented, as the costs of keeping cattle are low due to large areas of uncultivated grazing land outside the baixa zones. In order to be successful, this would have to be accompanied by efforts to improve animal health services. If targeted to them, households within the very poor and poor wealth groups could cultivate larger areas of land if they had access to plough oxen. Land is plentiful in the non‐baixa zones and is not a constraint to production.
Animal health services: The expansion of treatment and vaccination facilities in rural areas would help increase household incomes. It is important to target endemic diseases that regularly kill livestock and train more people in the provision of animal health services.
Crops: The only seeds available to purchase are often from other regions and do not do well in local soils, especially in the non‐baixa zones. An increased availability of locally suitable seeds was highlighted as a priority. In terms of more general support to crop production, it was also noted that traditional methods of production limit the productivity of households, especially in the non‐baixa zones. A cost‐benefit analysis should be undertaken to determine whether the risk‐reducing benefits of traditional seeds and methods outweighs the potential returns in productivity associated with more modern agricultural inputs. While maize is the preferred crop in this zone, assuming that years or poor rainfall will continue, more drought resistant crops could possibly be introduced in the non‐baixa zones.
Development of small baixa areas (irrigation schemes): Some villages have access to small nearby baixa areas which are waterlogged during the rainy season and cannot be cultivated. Key informants stated that they offer development potential.
Water: Additional pumps would decrease the walking distance to collect water as well as the numbers of people using each pump. Small dams or water storage infrastructure for livestock would help to avoid people having to share water sources with livestock.
Human health services: The distance to hospitals is far with no transportation (ambulances) for emergency cases and often the nearest hospital does not have the required services (maternity). Improving the speed and quality of service delivery in rural areas is seen as crucial for both saving lives and livelihoods. Because of the fundamental reliance on household labor, illness undermines a household’s ability to generate income and food, so reducing disease and treating illnesses quickly will help people maintain their livelihoods.
Schools: While most villages have a primary school, very few have access to a secondary school nearby, which greatly restricts access to secondary education.
Access to credit: Small loans were requested for investment in livestock and agriculture and for increasing the ability of households to get through bad years.
Business development training: The development of businesses to stimulate economic activity at village level and ideally reduce dependency on firewood and charcoal sales in years of poor crop production was suggested by key informants. For example, most traders who operate in these zones are not local but instead come from Maputo and Chokwe to purchase livestock, crops and charcoal. An increase in trading activity by people from within the zones could increase self‐employment income while at the same time

71
possibly offering more competitive prices for villagers. The opportunities and constraints to this type of activity should be explored.
Markets and road infrastructure: Many villages become cut off from main markets in the rainy season. Improved roads and infrastructure would improve access to markets and even out irregularities in supply, hopefully strengthening the purchasing power of local households by lowering prices of imported items.
Agro‐processing facilities: The establishment of agro‐processing factories to add value to produce, especially tomato processing, packaging and grading facilities was suggested by households in the better off wealth group in the productive baixa zones.
Electricity: Households are reliant on kerosene for lighting and mentioned electricity as a development priority.
Phone network: Increased mobile phone coverage was expressed as a priority by the wealthier groups, as many areas lack reception.