livestock and meat policy note - the eis wb livestock and meat... · republic of namibia livestock...
TRANSCRIPT

REPUBLIC OF NAMIBIA LIVESTOCK COMPETITIVENESS, ECONOMIC GROWTH AND OPPORTUNITIES FOR JOB CREATION IN NAMIBIA A POLICY NOTE May 31, 2012 Poverty Reduction Economic Management 1 Southern Africa Africa Region

i
CURRENCY EQUIVALENTS (as of May 18, 2012)
Currency Unit = Namibia dollar (N$)
Namibian dollar 1 = US$ 0.1191 U.S. dollar 1 = N$ 8.3984
GRN FISCAL YEAR
(April 1-March 31)
WEIGHTS AND MEASURES Metric System
ABRREVIATIONS AND ACRONYMS
ACP African, Caribbean and Pacific CAHW Community Animal Health Workers CBA Cost-benefit analysis CBLRM Community Based Livestock & Rangeland Management CBPP Contagious Bovine Pleuropneumonia DEES Directorate of Extension and Engineering Services DRC Democratic Republic of Congo DRFN Desert Research Foundation Namibia EFF Energy For the Future EFTA European Free Trade Association EIA Environmental Impact Assessment EPA Economic Partnership Agreement EU European Union FAO Food and Agriculture Organisation FMD Foot-and-Mouth Disease FTA Free Trade Agreement GDP Gross Domestic Product GRN Government of Republic of Namibia GSP General System of Preferences IPS Independent Power Supplier LRAC Land Reform Advisory Commission LSU Livestock Unit MAWF Ministry of Agriculture, Wildlife and Forestry MCA Millennium Challenge Account MCM Million Cubic Meters NAMLITS Namibian Livestock Identification and Traceability System NAPCOD Nambian Action Plan to Combat Desertification NAU Namibian Agricultural Union NCA Northern Communal Area NDP National Development Plan NMI Namibian Mills Industry NNFU Namibia National Farmers Union NPC National Planning Commission NPI Namibian Poultry Industries NRMPS National Rangeland Management Policy and Strategy NVA Namibia Veterinary Association

ii
NVC Namibia Veterinary Council OIE World Organization for Animal Health PPA Pig Producer’s Association PPP Public-Private Partnership SACU Southern African Customs Union SADC Southern African Development Community. TA Traditional Authorities TAD Transboundary animal diseases TE Tree Equivalent TIPEEG Targeted Intervention Program for Employment and Economic
Growth VCF Veterinary cordon fence VS Veterinary Services WAC Water Advisory Council WRB Water Regulatory Board
Vice President: Makhtar Diop Country Director: Ruth Kagia Sector Manager: John Panzer Task Team Leader: Philip Schuler

Table of Contents
List of figures, tables and boxes .......................................................................................................... iv Acknowledgements ............................................................................................................................... v Executive Summary ............................................................................................................................. vi I. Introduction ................................................................................................................................... 1 II. The livestock sector: An overview ........................................................................................... 1
1. Importance of the livestock sector .............................................................................................. 1 2. Livestock production systems in Namibia .................................................................................. 4 3. Value chains, processing, and marketing .................................................................................... 6
III. Land, climate, and environmental constraints ....................................................................... 9 4. Bush encroachment ..................................................................................................................... 9 5. Rainfall, climate and water resources ....................................................................................... 12 6. Land use and livestock production ............................................................................................ 15
IV. Animal health and disease ...................................................................................................... 16 7. Animal health policies .............................................................................................................. 16 8. Extension and advisory services delivery systems .................................................................... 17
V. The role of policies and institutions in sector development ..................................................... 19 9. Trade policy environment ......................................................................................................... 19 10. Institutions involved in the sector ......................................................................................... 23
VI. Prospects for growth ............................................................................................................... 25 11. Cattle sector .......................................................................................................................... 25 12. Job creation through debushing ............................................................................................ 25
VII. Policy reforms and investment needs .................................................................................... 29 13. Bush encroachment and sustainable resources management ................................................ 29 14. Value-chains structure, marketing and trade ......................................................................... 30 15. Private sector development in the NCA and strengthening services delivery systems ......... 31
VIII. References: ........................................................................................................................... 35 IX. Appendix: Livestock-Beef supply chain in Namibia ............................................................ 37
iv
List of figures, tables and boxes
Figures
Figure 1. Livestock Access by Household Income, 2009/10 .................................................................. 5 Figure 2. Water consumption by livestock ........................................................................................... 14 Figure 3. Namibian Penetration in European Markets, 2005–2011 ...................................................... 20 Figure 4. Wood and Charcoal Exports, 2006–2010 .............................................................................. 27
Tables
Table 1. Value of Production of Major Agricultural Commodities, 2010 .............................................. 1 Table 2. Exports and Imports of Animal Products, 2006–2010 .............................................................. 2 Table 3. Principal Livestock and Meat Trade Partners, 2006–2010 ....................................................... 3 Table 4. Dependence on Ownership or Access to Cattle ........................................................................ 4 Table 5. Livestock Numbers, 2006 ......................................................................................................... 5 Table 6. The extent of bush encroachment ........................................................................................... 10 Table 7. Impacts of bush encroachment ................................................................................................ 11 Table 8. Value added per cubic meter by economic sector ................................................................... 14 Table 9. Estimated domestic wood consumption .................................................................................. 26
Boxes
Box 1. Value Addition Defined ............................................................................................................ 22 Box 2. The impact of price and trade policies on livestock competitiveness: The case of Argentina . 23 Box 3. The use of bush and wood chips for energy generation in the Ohorongo cement factory ........ 28

Acknowledgements This policy note has been prepared by the World Bank at the request of the National Planning Commission of the Government of the Republic of Namibia. A team led by Philip Schuler (Senior Country Economist, World Bank) and comprising Stephane Forman (Senior Lives-tock Specialist, World Bank), Jaap Arntzen (Centre for Applied Research, Botswana), and Nancy Morgan (FAO Liaison to the World Bank) conducted the study. Sylvia Demas, Direc-tor of Development Planning, NPC, was the study’s principal government counterpart. The team gratefully acknowledges the information, hospitality, and feedback provided by of-ficials of the Ministry of Agriculture Water and Forestry, Ministry of Environment and Tour-ism, Ministry of Finance, Ministry of Lands and Resettlement, and National Planning Commission. The team also acknowledges similar contributions from the following non-governmental, parastatal, and private sector organizations: Agra, Agribank, Agricultural Trade Forum, Bank of Namibia, Feedmaster, Hartlief, Meat Board of Namibia, Meatco, Na-kara, Namibia Agricultural Union, Namibia National Farmers Union, Swakara, Veterinary Council of Namibia, and WWF-Namibia. The team received assistance from development partners in Namibia, including the Delegation of the European Commission, Millennium Challenge Account-Namibia, and the UN Food and Agriculture Organization. Overall quality assurance was provided by John Panzer (Sector Manager) and Sandeep Maha-jan (Lead Economist). Peer Reviewers were Francois Le Gal, Michael Morris, and Vincent Palmade. The study benefits from a discussion with staff of the Bank of Namibia, Ministry of Finance and National Planning Commission at a seminar in August 2011, as well as from comments on the draft policy note provided by Bernard Vallat of the World Organization for Animal Health (OIE) and Paul Strydom of the Meat Board of Namibia. The policy note was funded in part from contributions by the governments of Finland, Nor-way, Sweden and the United Kingdom through the Multi-donor Trust Fund for Trade and Development.

vi
Executive Summary
The livestock and meat sector plays a critical role in growth and job creation in Namibia. The commercial farming sector, mainly based on livestock farming, is considered to be the largest source of private employment in the country, providing jobs to 25,000–30,000 workers. Na-mibia enjoys a revealed comparative advantage in exporting cattle and beef, and is one of very few African countries able to meet strict import regulations in Europe. The sector ac-counts for 7 percent of national merchandise exports. While the sector is important for eco-nomic growth and job creation, the relevance of the sector to livelihoods and food security is revealed by the fact that over 40 percent of households own or have access to cattle. While the sector holds promise for generating additional economic growth and job creation in future, there are critical constraints impeding this potential. These include: (i) a myriad of na-tional policies, such as those for land and labor, which create uncertainty about longer term investment in the sector; (ii) a trade policy space encumbered with non-transparent legal re-quirements related to livestock and product trade, which also limit access to inputs, in par-ticular land and labor; (iii) a lack of approved strategic policies for dealing with bush encroachment, a major environmental factor which limits livestock productivity, impedes sustainable management of natural resources and limits animal feeding and access to grazing land; and (iv) ineffective policies and programs supporting the delivery of extension and ad-visory services, in particular those which would strengthen veterinary services in the North-ern Communal Area (NCA), a region with considerable potential for increasing the value of the sector but currently hampered by its animal diseases’ status, currently internationally and characterized as a foot and mouth disease (FMD) buffer zone and restricts both movement of animals and people. These specific policy and institutional challenges which are currently restricting growth in the livestock sector are complicated by broader national issues related to: (i) rising land values and land tenure/ownership challenges which restrict access to land; (ii) a deficit of technical skills and policy restrictions on labor migration which restrict the entry of highly qualified staff from outside the country, even for a temporary period to transfer knowledge; (iii) for-eign currency fluctuations; and (iv) unreliable national data on key indicators, such as animal inventories and land availability which affect investment and national planning for the sector.
While the government’s stated objective is to add value to the raw material originating from the livestock sector, it is not clear that policies in place have optimized the sector’s contribution to the economy. In fact, there is evidence that some policies have adversely affected the sector. However, the overall impact of the policy on the sector is difficult to measure due to the lack of good quality data, in this case animal numbers, and the complexity of disentangling the myriad of factors which affect markets, e.g. shifts in product demand, changes in the structure of the industry, etc. However, a preliminary review of data and ex-pert opinions indicate that animal numbers have declined despite the government’s efforts to the contrary.1
The significant challenges faced by Namibia’s livestock producers in producing the quality animals necessary for slaughter, exports, and job enhancement is aggravated by eroding land productivity and a reduction in the carrying capacity of agricultural land 1 AGRA auction figures and lending trends by Agribank

vii
heavily influenced by bush encroachment. Some farms are rendered entirely unsuitable for livestock production because of bush encroachment. The Namibian Meat Board estimates that present cattle numbers in commercial farming areas are 64 percent lower than the num-bers in 1959, with annual opportunity costs/losses estimated at N$700 million or more.
Managing bush encroachment, which is estimated to affect approximately 26.5 million hectares (or just over one-third of the country), could significantly improve the produc-tivity of the national land base. Many industry stakeholders indicate that effective incen-tives for bush clearing could translate in double the number of current availability of animals and would create a significant number of jobs, as well as growth opportunities in by-product industries. Charcoal production and a combination of use of bush and coal for energy genera-tion can generate jobs and growth. Traditional use of bush for fencing and fuel wood in communal areas strengthens rural livelihoods while improving rangeland productivity.
The policy environment for bush control and re-use needs to be further strengthened. The following measures are recommended:
Adoption of a sustainable rangeland management policy that encourages community-based livestock and rangeland management (CBLRM) in communal areas, adherence to sustainable rangeland management practices throughout the country and provides for technical advice and support from government extension services.
Adoption and implementation of the bush industry strategy, including, Establishment of area-specific bush control and management plans for differ-
ent regions; Facilitation of bush control and re-use in CBLRM areas; Financial support for labor involved in debushing in communal areas, finan-
cial incentives for farmers engaged in debushing in the form of interest subsi-dies and tax rebates and finally financial incentives for private investors, who seek to use bush as a source of energy for their projects;
Monitoring and evaluation by the Directorate of Forestry, whose results should be entered into the data & experience base;
Establishment through private-public sector partnerships of collection, storage and marketing infrastructure for byproducts.
Harmonization and integration of community-based approaches in various sectors, in-cluding livestock, forestry and tourism;
Incorporation of bush-for-energy options in terms of reference for environmental im-pact assessments of projects.
A critical factor influencing the development of the livestock sector in Namibia is the dis-ease-free status of the country. Namibia is one of the few countries in Africa that can export high-value products to major developed country markets. The structure, competiveness, and potential for growth of the livestock sector are heavily influenced by national ani-mal health policies that impact movements of animals and people. Effective disease con-trol in the NCA, an area which houses one-half of the country’s ruminant population, would appear the most promising for generating employment and livelihood enhance-ment, with enhanced animal health interventions stimulating employment not only in the on-farm production segment of the value-chain, but also further down the value chain in processing and marketing.
The government plays a key role in analyzing and investing in disease control strategies, in building capacities in the NCA through training and provision of equipment, by in-

viii
creasing the coverage of veterinary professionals in the NCA, in order to have their Vete-rinary Services complying with OIE international standards on both side of the NCA. Animal health and veterinary legislation needs to be reviewed and updated. These could include in-novative public-private partnerships which bundle funds allocated by the government for cer-tain services in the south and pool them into a “user pays” fund for supporting privately provided services. The implementation of a “sanitary mandate” for supporting private veteri-narians providing public services would serve to strengthen service delivery and set the stage for investment, job creation, and private-sector driven and managed economic growth.
To overcome these obstacles, the Government of Namibia can play an important role as facilitator and originator by promoting small-scale private sector investment in the communal areas and by supporting individual initiatives and entrepreneurship. This should be the subject of a national strategy and action plan to strengthen economic growth and support employment through the development of the livestock sector and lives-tock-related activities, including diversification towards short-cycle species and production systems (dairy, pigs and poultry). Such small businesses could cover feed production, inputs sales, processing and marketing facilities, etc. in the communal areas as well as development of industries based on by products of bush control.
Of particular and immediate concern to the future of the sector are policies currently affecting the structure of the sector, in particular those which are linked to:
a) The unclear role and ownership status of Meatco, the major business entity in-volved in meat slaughter and trading. The government holds no equity in Meatco, but the company is designated by law as a state-owned enterprise. It is expected to func-tion as a profit-oriented business entity while at the same time absorbing losses from operating government abattoirs in the NCA. These two functions are contradictory.
b) The need to better understanding the objectives and structure of the proposed business entity to replace Meatco. An audit of Meatco should be undertaken to per-mit a better understanding of the nature of its pricing system and the magnitude of the losses being incurred due to exchange rate movements and operational losses in the NCA. These losses influence the prices received by producers and affect longer term investment in the sector. The information generated through the audit should be used in carrying out a comprehensive cost-benefit analysis of the implications of restructur-ing the company.
c) Recognizing that a key ingredient of sector development is institutional transpa-rency, with the government working to provide an enabling environment for pri-vate sector growth. In the case of restructuring the industry, it should be noted that the success of cooperatives involves strategic decision making by an elected board of directors and professional management.
d) Making sure policies and institutional mandates make a clearer distinction be-tween private and public responsibilities. Where activities funded exclusively through levies from private entities substitute for what are more appropriately consi-dered public services (for example, disease control), responsibility should be shifted back the state and financed through taxes.
In addition, government investment in the livestock sector should favor interventions which are directly supportive of smallholders and not linked to the development of large enterprises. Direct investment in enterprises by the government should be avoided unless

ix
there is a clearly identified public-private partnership in which the government’s role is to provide a public good or service and thereby leverage additional investments in the sector, particularly related to services and service delivery. Initiatives which support PPPs with local producers/stakeholders, such as focusing on training of traders to promote milk quality and safety, fostering the early adoption of feed technologies, or providing incentives to private veterinarians, would likely stimulate more inclusive sector development through the indirect generation of jobs in rural areas.
The government and industry’s strategic vision for enhancing value addition and growth in the livestock sector needs to be discussed, formulated and implemented with-in an agreed framework, one which clearly outlines strategic goals, defines the role of gov-ernment and industry, is characterized by clear and agreed upon policies, and establishes a baseline which is supported by a monitoring and evaluation (M&E) system. It is preferable that this process be initiated and managed by the private sector, with support from govern-ment, as input into the National Development Plan IV (NDP4) process.
A key priority of the sector should be to introduce stable/balanced policies that are gen-erated through effective and extensive consultation and communicated through a trans-parent and official process with an express goal indicated (for example, economic growth or value addition or employment creation). Policy makers should acknowledge that the aim of value addition should focus on optimizing returns along the entire value chain, through better utilization of all the products produced by the livestock sector. Supportive analysis needs to be undertaken to ensure that all policy initiatives, including those involving strategic invest-ments in animal health initiatives, be reviewed in terms of their impact, so that performance can be monitored and evaluated in terms of mutually agreed key indicators, such as improved prices for producers, profitability/job creation/higher throughput in local abattoirs/processing units, increased exports, stable prices for consumers. All policies should ensure/aim for equitable and positive impact on the majority of stakeholders in the sector.

I. Introduction
2. This is one of a series of three policy notes on growth and employment creation in key sectors of the Namibian economy, namely tourism, transport and logistics, and livestock. These notes are being prepared at the request of the National Planning Commission (NPC) of the Government of the Republic of Namibia (GRN). The notes are intended to contribute to implementation of National Development Plan IV (NDP4), which will guide the govern-ment’s economic policies from 2012 through 2017.
3. Namibia has for many years enjoyed a revealed comparative advantage in live ani-mals, beef, and other meat exports, in part due to the livestock and meat industry’s ability to meet stringent European sanitary standards. In the “Targeted Intervention Program for Em-ployment and Economic Growth” (TIPEEG), NPC identified the agriculture and livestock sector as holding potential to create about 25,000 direct and indirect jobs, including close to 2,000 in livestock production alone. This policy note investigates constraints to realizing that potential. It opens by analyzing production systems, value chains, and export performance. The note then evaluates several major constraints and contributors to competitiveness, includ-ing factors related to land and natural resources, to animal diseases and their control, and to policies affecting marketing and trade. It concludes with a number of recommendations for policy reforms and investments.
II. The livestock sector: An overview
1. Importance of the livestock sector
4. Livestock plays an important role in the Namibian economy and the life of its people. Namibia is one of the few countries in the world where animal stocks exceed population numbers. Low annual rainfall combined with high variability limit much of agricultural activ-ities to livestock farming. As shown in Table 1, seven of the top ten agricultural commodities produced in Namibia are animal products (meat, milk, eggs, wool), and the livestock sector accounts for approximately three-quarters of the value of agricultural production.
Table 1. Value of Production of Major Agricultural Commodities, 2010
Commodity Value of Production
(thousands of U.S. dollars) Indigenous cattle meat 155,664 Roots and tubers, n.e.c. 56,434 Indigenous sheep meat 40,556 Cow milk, whole, fresh 35,762 Indigenous bird meat, n.e.c. 15,386 Indigenous goat meat 14,621 Game meat 13,926 Grapes 12,290 Pulses, n.e.c. 9,735 Indigenous chicken meat 9,431
Source: FAOSTAT database Notes: n.e.c. = “not elsewhere classified”
5. The livestock sector is a major source of employment. It is estimated that the com-mercial farming sector, mainly based on cattle and sheep farming, is the private sector largest employer in Namibia, providing employment to between 25,000 and 30,000 laborers and the

2
dependents (Millennium Challenge Account (MCA), November 2008). These include the households engaged in livestock production, the approximately 1,500 staff working in abat-toirs, as well others along the value chain.
Table 2. Exports and Imports of Animal Products, 2006–2010
Exports 2006 2007 2008 2009 2010 Live animals 654,890,161 694,166,407 484,598,277 550,004,160 871,930,911
Live cattle 447,282,612 495,952,329 327,597,786 415,504,510 685,989,177 Live sheep 185,269,016 180,590,264 117,598,288 109,950,625 151,874,408 Live game 3,205,587 5,910,915 24,680,468 7,199,185 19,172,590 Live breeding cattle 858,000 1,313,440 3,305,863 7,428,258 5,837,216 Live animals, n.e.c. 18,274,946 10,399,459 11,415,872 9,921,582 9,057,520
Meat and meat products 859,601,259 1,017,177,152 1,318,373,314 1,377,915,288 1,300,636,459 Beef 539,847,352 602,054,001 858,530,466 887,433,674 814,841,893 Lamb and mutton 254,400,690 352,832,252 357,194,197 409,680,112 461,353,100 Poultry 16,526,700 21,326,084 60,738,076 59,057,894 7,899,788 Pork 27,042,475 6,781,362 5,898,064 6,049,690 6,233,625 Meat, n.e.c. 21,784,042 34,183,453 36,012,511 15,693,918 10,308,053
Dairy products 6,871,745 11,902,962 13,957,843 19,195,638 27,315,769
Total exports 1,521,363,165 1,723,246,521 1,816,929,434 1,947,115,086 2,199,883,139
Imports 2006 2007 2008 2009 2010 Live animals 29,209,429 31,990,399 51,916,083 70,378,829 50,969,042
Live cattle 6,742,114 10,344,638 11,733,170 30,403,460 19,179,142 Live chicken 4,619,332 9,600,095 9,133,809 9,774,229 10,057,342 Live game 1,507,717 3,433,006 17,188,403 20,416,954 9,296,015 Live breeding cattle 1,122,182 1,106,790 6,480,598 1,057,714 3,496,872 Live sheep 2,964,150 2,816,496 2,621,890 2,092,482 2,406,501 Live swine 349,862 20,470 0 290,898 801,030 Live animals, n.e.c. 11,904,072 4,668,904 4,758,213 6,343,092 5,732,140
Meat and meat products 243,710,748 289,890,464 574,595,444 578,864,421 571,817,591 Poultry 165,231,369 190,364,510 427,526,384 431,831,691 455,669,820 Pork 38,635,191 45,278,012 55,823,501 77,130,828 73,809,649 Beef 27,364,953 39,680,033 58,240,629 48,714,873 28,981,490 Lamb and mutton 4,484,655 3,600,256 207,116 612,640 1,034,647 Meat, n.e.c. 7,994,580 10,967,653 32,797,814 20,574,389 12,321,985
Dairy products 143,314,660 178,940,473 243,882,305 256,311,121 278,149,886
Total imports 416,234,837 500,821,336 870,393,832 905,554,371 900,936,519 Source: Central Bureau of Statistics
6. The Namibian livestock sector is closely integrated into global and regional markets. Foreign sales in 2010 amounted to N$2.2 billion, representing around 7 percent of Namibia’s total merchandise exports, with beef and cattle accounting for almost 70 percent of the sec-tor’s exports (see Table 2 and subsequent discussion). The country both exports and imports beef—it sells high-priced cuts to European consumers and imports lower-priced meat for domestic consumption and as inputs in to processed meat products. Imports continue to be

3
critically important for supplying growing demand for poultry, pig meat and dairy products. Imports rose to N$1 billion in 2011, up from around N$500 million in 2006. Frozen poultry cuts rose to 26,500 tons in 2010, representing 40 percent of total imports by value, while dairy products, in particular cheese, milk powder, yogurt, and butter constituted approximate-ly one third of total livestock products. While imports have been growing, Namibia’s net ex-port position has remained stable at approximately N$1 billion, rising slightly in 2010.
7. South Africa is Namibia’s principal trade partner (see Table 3). Over 95 percent of livestock and 78 percent of meat exports were sent to South Africa in 2010, according to Namibian customs data. Exports to Europe are large and growing, and Namibia succeeded in building a large share of key European markets. Rapid GDP growth in Angola has been driv-ing increased demand for both cattle and beef. The government and private sector have been working to expand exports to the D.R.C., which is also enjoying brisk economic growth, but sales have been erratic.
Table 3. Principal Livestock and Meat Trade Partners, 2006–2010 Exports to 2006 2007 2008 2009 2010 South Africa 1,470,715,808 1,644,452,056 1,600,593,697 1,461,284,295 1,851,874,879 EU + EFTA 4,682,916 19,563,761 91,171,564 193,697,929 261,601,751 Angola 12,888,518 16,982,016 29,928,469 62,929,307 53,114,129 D.R.C. 22,672,875 31,362,991 68,660,047 49,798,046 22,833,667 Botswana 1,135,663 1,112,249 2,543,582 2,286,014 2,008,166 Other Africa 7,683,876 8,848,341 22,252,928 18,642,336 7,108,221 Imports from 2006 2007 2008 2009 2010 South Africa 373,382,550 443,788,781 689,314,069 806,117,649 789,711,045 EU + EFTA 17,241,211 17,547,346 25,051,847 26,550,231 42,884,797 South America 11,713,645 27,967,018 91,274,361 45,913,706 32,253,739 U.S. 10,084 40,272,194 13,961,021 21,212,494 Botswana 1,051,381 950,738 3,047,211 547,752 3,435,180 Other Africa 11,229,524 4,005,321 3,796,226 495,286 48,222 Source: Central Bureau of Statistics
8. South Africa also dominates import purchases: 89 percent of poultry, 88 percent of dairy products, and virtually all live animals were imported from South Africa. Brazil and other South American countries have a much larger foothold among beef imports, where South Africa provides only 41 percent of Namibia’s imports. Europe provides a range of cheeses, powdered milk, and meat products (notably livers).
9. While supporting job creation and trade, the sector plays an important role in areas of social protection, food security, and livelihoods of both poor and rich. Over 40 percent of Namibian households raise cattle. Livestock rearing can be even more important for Nami-bian households whose main source of income is a state pension or social grant (see Table 4).

4
Table 4. Dependence on Ownership or Access to Cattle Percentage share Total population 42.5 Rural population 53.4 Households whose main source of income is a state grant, by type of grant
State special maintenance grants (Disabled, age 16 years or less) 71.9 War veteran grant 66.3 State foster care grant 56.2 State child maintenance grant 45.4 State old age pension 52.9 Disability grant for adults 30.8
Source: Namibia Household Income and Expenditure Survey, 2009/10
2. Livestock production systems in Namibia
10. Different market conditions, animal disease threats and producers’ strategies charac-terize several different systems of livestock production operate in Namibia, and this diversity of production has implications for policy measures that will be discussed later in this note.
11. Ruminants make up the largest part of the livestock sector, which unlike Namibia’s other livestock sectors is export focused. It comprises several very different sub-sectors, cha-racterized by specific production systems:
Commercial operations in the south on privately owned land focus on exports of cat-tle, sheep, and meat to South Africa, Europe, and to a lesser extent other African countries.
The northern communal area (NCA) is characterized primarily by cattle and goat pro-duction in the context of subsistence agriculture, although cattle slaughtering at export abattoirs has been increasing.
The smaller southern communal areas (SCA), which lie within privately-owned areas, are home to sheep, goat, and cattle production.
12. The southern parts of Namibia are free of foot-and-mouth disease (FMD). The NCA is designated as an FMD buffer zone.
13. Cattle inventories are estimated at around 2.4 million by the Directorate of Veterinary Services (DVS), as shown in Table 5 on page 5, although numbers are difficult to verify be-cause the last livestock census was undertaken in 2006.2 With stocks nearly equally divided between North and South, Namibia produces approximately 55,000 tons of beef per annum, 80 percent of which is exported to South Africa and Europe. In addition, 150,000 weaners are shipped to South Africa each year.3
2 Official statistics are derived from vaccination campaigns. The Meat Board estimates that the cattle herd in the south (i.e., including both commercial and communal areas in the FMD-free zone) is around 1.5 million, or just under 12 percent greater than shown in Table 5, based on ear tag sales and information gathered from producers (Meat Board, 2011). 3 Weaners are animals 6–8 months of age, weighting 180–240 kg.

5
Table 5. Livestock Numbers, 2006 Cattle Sheep Goats Region Number Share Number Share Number Share Communal areas 1,433,784 60% 252,858 10% 1,340,929 65%
Northern Communal Area 1,039,309 44% 25,895 1% 774,195 38% Southern Communal Area 394,475 17% 226,963 9% 566,734 27%
Commercial areas 950,176 40% 2,407,394 90% 720,474 35% Total 2,383,960 2,660,252 2,061,403
Source: Directorate of Veterinary Services, Ministry of Agriculture Water and Forestry
14. The number of small ruminants is estimated at 4.7 million, divided almost equally be-tween sheep and goats. The majority of the sheep are Dorper breeds.4 Sheep are raised over-whelmingly by commercial farmers, and sheep ownership rises with income (see Figure 1). This contrasts with the goat production. Goats are owned by a larger share of the population, and goat ownership is less prevalent among wealthier households than among the poor. Goat production provides a vital source of household income and food security for poorer house-holds living in communal areas.
Figure 1. Livestock Access by Household Income, 2009/10
Source: Central Bureau of Statistics, Namibia Household Income and Expenditure Survey 2009/10. Notes: Shares of households reporting ownership or access to animal assets
15. Official statistics on live animal trade, official slaughter and published inventory numbers suggest a decline in livestock numbers in the south.5 While the last agricultural cen-sus was undertaken in 2006, the DVS estimates that the national herds of both cattle and sheep have declined.6 The rate of decline in cattle is exceeded by that in small ruminants, es-pecially sheep. This has resulted in part from policies that discourage the production for ex-port of live sheep, which the note takes up in detail below.7
4 Karakul sheep are also raised in Namibia. Production peaked in the 1960s and 1970s, when exports reached 500 million pelts annually. The world market for karakul pelts imploded in the 1980s. Namibia now exports around 140,000 pelts per year, according to information from Agra, which manages pelt sorting and provides services to the Karakul Board of Namibia 5 Agricultural Statistics Bulletin (2000–2009), Ministry of Agriculture, Water, and Forestry, April 2011. 6 These figures are not nationally representative since they are based on vaccination campaigns and accuracy depends on producer turn-out. 7 Six sheep must be slaughtered domestically for each live sheep exported.
0%
10%
20%
30%
40%
50%
60%
1 2 3 4 5 6 7 8 9 10
Share of Households
Income Decile
Cattle
Sheep
Goats

6
3. Value chains, processing, and marketing
Cattle marketing and structure of the processing sector
16. What is the current experience with cattle production? What players are active in the market? What factors influence decisions?
17. During the past two years, 350 thousand cattle have been sold commercially for slaughter or exported live each year, of which 56 percent were exported as weaners to South Africa, where they are fattened on feedlots for domestic meat production Most of the remain-ing 44 percent of cattle marketed in Namibia were slaughtered at export abattoirs.8
18. Export of weaners: Except for one relatively small feedlot operated by Meatco, the dominant player in slaughtering and meat processing, livestock generally graze on farms until they reach slaughtering weight rather than being fattened on feedlots.9 Several factors influ-ence a producer’s decision to export cattle as weaners versus raising them to slaughtering weight. First, a producer’s capital is tied up longer if animals are raised for slaughter; so many producers prefer to sell animals at a young age. Meatco and banks are piloting a pro-gram, the Ekwatho Financing Scheme, that provides bridging capital and extension services to producers to help them to raise weaners to slaughtering weight (rather than sell at young age to South African feedlots) in return for a commitment to sell oxen to Meatco. In 2010/11, Meatco procured just over 11,000 cattle through this channel (Meacto 2011). Second, operat-ing feedlots in Namibia is costlier than in South Africa. The high cost of grains—a reflection of the general unsuitability of crop production in Namibia—makes feedlot operations less profitable in Namibia.10 Maize silage can be produced competitively in the irrigated areas of the north. Silage is bulky and expensive to transport, however, making it commercially unvi-able as feed in the South, although one element of possible expansion of commercial produc-tion in the NCA. These considerations underscore the importance of rangeland management to increase the carrying capacity of grazing lands, which is discussed below in the context of bush encroachment and control. Finally, appreciation of the South African rand and Nami-bian dollar relative to European currencies in 2010–11 made it even more attractive for some farmers to export weaners to South Africa rather than raising cattle for export to Europe as meat.
19. Market players: Meatco, along with a few other private abattoirs, and Agra, an agri-cultural service provider that coordinates livestock auctioning, are the largest of only a few private sector entities involved in livestock marketing in Namibia. Meatco is the largest com-pany in the slaughter market, averaging 90 percent of cattle slaughter and 30 percent of total marketing. Meatco owns two abattoirs in the south of the country and manages and covers the costs of maintenance and of compliance with veterinary requirements (national food safety legislation) of two government-owned abattoirs in the NCA. These include Oshakati, which slaughters between 5,000–10,000 animals per year, and Katima Mulilo, which slaughters the same number per year, depending on the availability of disease-free stock. This abattoir was closed from May to July 2010 due to an outbreak of foot and mouth disease (FMD). In order 8 Bank of Namibia Annual Report 2011, based on data reported by the Meat Board. These marketing data in-clude only animals sold in the FMD disease-free area. Few data are available on cattle marketed in the NCA. 9 Meatco’s Okapuka feedlot has a bunk capacity of 5,500, and throughput in the 2010/11 financial year was 17,706 (Meatco, 2011). 10 It is worth noting that Namibia, unlike South Africa, prohibits the use of growth-promoting hormones. This policy gives Namibian meat exporters an advantage in certain foreign markets (notably Europe), but also keeps feedlot productivity below that of South Africa. The high cost of grains also reflects neighboring countries’ trade polices, such as restrictions on grain exports imposed from time to time by Zambia.

7
to meet the EU’s increasingly stringent veterinary standards, Meatco reportedly invested N$134 million in infrastructure and fixed assets over the 1992–2005 period to adhere to these standards (ODI, 2007). Meatco markets meat under the Natures Reserve brand to high-end premium retail outlets and restaurant groups in Europe and South Africa. During recent years Meatco has been shifting towards selling directly to end-users and away from selling in the wholesale market. Meatco operates subsidiaries registered in the Netherlands, South Africa, and U.K.
20. Agra is an agricultural cooperative with over 7,000 members. Agra is the largest or-ganizer of livestock auctions and provides a range of services to producers selling directly to Meatco and other abattoirs, including sorting, transaction facilitation (arranging transport, transit insurance, and permits), and monitoring slaughtering. Agra sells weaners to both do-mestic and foreign markets. It is active in related markets as well. Agra collects, sorts and markets karakul pelts, and it sells agricultural products through wholesale and retail channels.
21. Other significant market players include Witvlei Meat and Hartlief Corporation. Witvlei leases an EU-certified abattoir in eastern Namibia from Agribank and shares the beef import quota granted to Namibia by Norway. Hartlief operates an EU-certified small-stock and game abattoir in Mariental, which serves the domestic, South African, and European markets, as well as meat-processing facilities in Windhoek. It produces branded smoked, cooked, and other value-added meat products for local and regional markets.
22. Factors affecting pricing: Meatco purchases animals for slaughter using a pricing scheme that based on reference prices in South Africa, its largest export market. Under this pricing scheme, which is supported by a national grading system, farmers receive a standard price based on nationally specified grades. Questions have been raised as to whether the cur-rent price formulation scheme used by Meatco is optimal for the industry. There is discussion of having a “Namibian” price, rather than one based on the South African price, which is viewed as un-transparent because sellers are not paid after their animals are slaughtered. The Namibian price would presumably incorporate representative EU prices. The Meat Board has been requested to look at options. The challenge of generating a “reference price” derived from prices in other markets, such as the EU, is complicated by exchange rate movements and availability of regular, updated information on prices in relevant markets of carcasses and cuts. Data on domestic market prices are collected by the Namibian Meat Board; however, there are considerable gaps in nationally collected statistics, including trade data.
23. Given that the quality of the animals sold in the NCA is generally lower than the qual-ity of animals sold in the South (animals sold in the NCA are generally older and raised under less favorable conditions), prices offered by Meatco in the NCA are typically low and at times uncompetitive with prices obtained locally at auction or for animals being purchased for export to Angola.11 The government provided additional market incentives to producers (N$1/kg) to compensate for cost of holding animals. This subsidy was discontinued when the quarantine as abolished. Low off-take and abattoir utilization have generated considerable losses to Meatco, N$29.9 million in 2010/11 (Meatco 2011) Aggregate operational losses linked to the two abattoirs in the NCA are reportedly around N$227 million since 1992.
11 At one time cattle in the NCA were required to stay in quarantine for 21 days if meat was going to be sold in the FMD-free zone or exported. This requirement was eliminated through negotiations with South Africa.

8
Moving beyond the cattle sector: challenges for dairy and non-ruminant sectors
24. Unlike the beef sector, which is a net exporter, local consumption of dairy products, poultry, and pig meat is supplied through imports. Although these sectors are challenged by high input prices, there appears to be some growth potential, based on assessments by the Namibian Meat Board, the Namibian Agricultural Union, Namibian Dairies, and the National Statistical Office, and opportunities for import substitution in the future.
25. Pig sector: Despite the challenge of high feed prices in Namibia, the number of pigs slaughtered has reportedly increased four-fold to 28,700 head in 2009 from 7,500 head in 2000, with the animals increasingly sourced over the period from local suppliers. It is esti-mated that there are about 600 pig producers in the country, more than two-thirds of whom raise 3–10 pigs; meanwhile, the number of commercial producers who are members of the Pig Producers Association (PPA) has risen from three producers to over 30.
26. Annual pig meat imports averaged 2,000–4,000 tons between 2000 and 2009 (Minis-try of Agriculture, Water, and Fisheries [MAWF] 2011), which according to the PPA ac-counts for approximately 75 percent of local consumption. In contrast, imports of live pigs have fluctuated considerably from year to year, due to disease outbreaks in supplying coun-tries. Pig prices nearly doubled between 2000 and 2009 (to N$1,138/head from N$534/head). After FMD outbreaks in 2010–2011, many processors, wholesalers, and retailers reported be-ing unable to obtain processed pig meat products.
27. The dairy sector is considered a protected industry under SACU trade provisions and, as indicated by the MAWF 2009–2013 Strategic Plan, the government is actively pro-moting investment in the industry. Milk production is estimated to have remained relatively stagnant over the last decade (2000–2009) at approximately 20,000 tons per year (MAWF 2011), while dairy imports currently account for around one-third of imported livestock and dairy products (as shown above in Table 2 on page 2). In an informal assessment of the dairy sector, FAO indicates that milk and dairy products are a core part of the Namibian diet in many areas, and there appears to be growing demand of milk and dairy products, mainly for local products including fermented milk “Omakehe” and soured buttermilk “Omashikwa.” This is evidenced by movements in producer prices for milk, which rose from N$1.76/liter in 2000 to N$4.32/liter in 2009. Informal reports indicates that these prices have risen exponen-tially since then to N$10–12/liter in the informal sector in 2010 and N$12–17/liter the formal sector. This may be explained by the 2010 FMD outbreak in South Africa, Namibia’s main supplier of imported dairy products, as well as the subsequent restrictions on meat and dairy products. It may also be influenced by volatile international dairy price movements, with global milk product prices reaching US$4,000/ton, the highest since early 2008 and twice his-torically average levels. Finally, infant industry protection also contributes to higher domestic prices.
28. The formal dairy sector is dominated by Namibia Dairies, which was formed in 1997 when two dairies amalgamated into one. It is estimated to employ over 600 people at its pro-duction plant in Sindoek. A N$120 million investment in a rotary milking station in Mariental houses 2,000 milking cows, which produce an estimated 65,000 liters of milk per day. MAWF proposes investing N$180 million in a dairy plant to expand dairy output in NCA, focusing its investment at the Uvhungu-Vungu Irrigation Project in the Kavango Region. This large-scale dairy farm will initially source 750 milk cows from South Africa at N$15,000/cow and is expected to employ 300 temporary workers. Commercial dairy invest-ments were made previously in this region, such as Namibia Dairies’ investment in Groot-

9
fontein, but they were not sustainable. This raises the question as to whether the current gov-ernment-financed operation, with its objective of supplying local markets, will displace local smallholder producers and traders. Research carried out by the International Livestock Re-search Institute (ILRI) has revealed that job creation in the dairy sector is best achieved by supporting the informal sector, where each 20 liters of milk produced creates one job. Gov-ernment initiatives that support PPPs with local producers, focusing on training of traders to promote milk quality and safety, might support a broader based approach to sector develop-ment.
29. Poultry industry: Although many smallholder producers raise small flocks of chick-ens for local consumption, virtually of all of Namibia’s commercial poultry products, or ap-proximately 26,000 tons, are sourced from South Africa, Brazil, and other supplier. These imports, valued at N$376 million, account for 40 percent of total livestock product imports and are critical for maintaining per capita consumption at 22 kg/year. This level is considera-bly above the average annual poultry consumption rates for Africa, which hover around 5 kg/capita, and equal the level consumed in South Africa (24 kg/caput). To support local pro-duction, the Namibian Poultry Industries (NPI) has invested N$500 million, funded by the NMI Group (the parent of Namib Mills and Feedmaster), in a broiler processing unit, which is estimated to generate 600 jobs. Namibia has been granted infant industry protection under SACU for poultry, which allow tariffs to be imposed on imported poultry products. This will push up poultry prices, other factors being equal, raising concerns about the impact on lower-income households who rely on low-priced chicken products.
III. Land, climate, and environmental constraints
30. Rainfall and water availability, climate change, bush encroachment, and land tenure systems all strongly influence land productivity and therefore the potential for growth and employment in the livestock and meat sector.
4. Bush encroachment
Scope of the problem
31. Bush encroachment is the process of “the invasion and/or thickening of aggressive undesired woody species, resulting in an imbalance of the grass/bush ratio, a decrease in bio-diversity, a decrease in carrying capacity and concomitant economic losses” and is the single largest environmental challenge facing the livestock sector in Namibia, affecting around 26.5 million hectares, or just over one-third of the country (De Klerk, 2004). It is a growing prob-lem. In 1970 only 10 million hectares were affected (Honsbein et. al, 2009). Today, almost one-half of the communal areas are affected (see Table 6). The widely accepted norm is that the bush density (expressed in tree equivalents or TE) should be twice the average annual rainfall amount (De Klerk, 2004).12 In reality, bush densities in excess of 20,000 bush-es/hectares are found.
32. The amount of land annually cleared from excess bush is unknown, but it is estimated to represent less than 5 percent of the encroached area, or less than 1.3 million ha. (pers. comm. De Klerk). The most adversely affected areas in the NCA include Omusati, Oshana, Oshikoto and Ohangwana, all of which feature poor to very poor range conditions. Range 12 A tree equivalent (TE) is a tree or shrub of 1.5 m. There is no conversion factor into weight as the weight de-pends on the species and shape of the bush.

10
conditions are improving, however, in areas where human and livestock densities are decreas-ing (MCA, 2011, vol 3).
Table 6. The extent of bush encroachment Bush encroached area in thousands of ha Percent of total land Total 26,300 38.3% Freehold 15,800 33.7% Communal 10 500 48.1% Source: De Klerk, 2004 and recent statistics.
Causes and effects
33. While the causes of bush encroachment are well understood in general terms, little is understood about the relative importance of specific contributing factors. As a consequence, bush control efforts may be addressing symptoms of the problem, rather than the main caus-es, and bush encroachment could re emerge in time. The causes of bush encroachment are natural, human-made, or a combination of both (De Klerk, 2004; Pringle et al, 2009). Natural causes include changes in rainfall amounts and variability, degraded soil conditions and lack of nutrients, and high temperatures. Human causes include high stocking rates, poor rangel-and and livestock management practices, suppression of fires, disappearance of game due to expansion of human activities, and policy (implementation) failures.13 Climate change both stimulates and limits bush encroachment, and the net effect is not yet fully understood and needs further assessment.14
34. If the detailed causes of bush encroachment are still poorly understood, the impacts of bush encroachment are well documented, wide ranging, and significant. They include impacts on the livestock sector itself, on the wider economy, and on the environment. Bush control needs to be a priority issue for the livestock sector (production and income losses), the envi-ronment (i.e. loss of biodiversity and adverse impacts on water resources) and the economy at large (see Table 7). The adverse impacts on groundwater recharge are particularly important in water scarce Namibia.
13 For example, the country has no rural development policy and only a draft national rangeland management policy. The MCA project promotes the adoption of holistic grazing in its community grazing management schemes. However, this is not (yet) common practice in Namibia. In commercial areas, livestock numbers have dropped but this has not led to the reversal of bush encroachment. Individual commercial ranches can be highly successful in range and livestock productivity improvement (e.g., the Sonnleiten ranch,) 14 On the one hand, increased CO2 concentrations favor woody biomass over grass species; on the other hand, a decrease in rainfall slows down primary production.

11
Table 7. Impacts of bush encroachment
Impact area Impact
Livestock sector Livestock productivity losses of over 100 percent due to a decline in carrying capac-ity Reduced land carrying capacity of up to 80 percent (NRMP); Income losses of N$700 million for up to 65,000 households (Quan, 1994); more recent estimates put the lost income at N$1 billion (De Klerk,2004) and even at N$1.6 billion (NAU, in discussion with the WB the team). These figures suggest that annual losses are rising.
Environment Shorter grass growing season and significantly reduced grass productivity Adverse impact on nutrient cycle Loss of species biodiversity and domination by invaders Reduced groundwater recharge. In bush encroached and non-bush encroached areas, recharge rates after a 100 mm downpour were 0.2m and 2m respectively; 89 percent of the high groundwater potential areas in Namibia are bush encroached; Bush thin-ning could save 12 MCM per farm of 5,000 ha A decline in water use efficiency (in terms of producing forage) by three to ten times; Enhanced carbon sink due the increase in woody biomass
Economic (other sectors)
Reduced attraction for tourism due to poor scenery and reduced biodiversity Adverse macro economic impacts: lost value added, exports and economic growth New economic opportunities to: production and marketing of bush removal by-products and switch towards becoming woody biomass farmers
Sources: De Klerk, 2004; Colin Christian & Associates, 2010
Bush control
35. The major purpose of debushing or bush control (the terms are used interchangeably) is to improve land productivity for livestock, boost both the livestock sector and the national economy and/or to release land for other productive uses. Namibia has more experience with bush encroachment and more pilot projects for bush control than most other countries. Exam-ples include the Bush Encroachment Research, Monitoring and Management Project under NAPCOD, the Combating Bush Encroachment for Namibia’s Development carried out by the Desert Research Foundation of Namibia (DRFN), a cost-benefit analysis of different uses of by-products (Honsbein et al, 2009), studies on groundwater impact, and EIAs for bush-for-energy projects.
36. The costs of bush control generally depend on the method employed, the location of the area being targeted (remote or not), and the bush densities. Cost estimates mentioned in the literature and during interviews differ widely, ranging from around N$500/ha to N$2,000/ha, not including costs of aftercare on the order of N$600/ha. These costs cannot be recovered from the land selling price (N$500–1,500/ha depending on the location, according to interviews with officials at the Ministry of Lands and Resettlement), so most farmers do not invest in bush control to increase the land value; higher production must be the main mo-tivation, but the productivity benefits do not (fully) materialize without proper after care and prudent bush control practices.15 In communal areas, grazing land is not titled, so there are no incentives to invest in land improvement, because benefits of bush clearing are shared with
15 Various methods of bush control can be used, sub-divided into chemical and mechanical (with varying de-grees of labor intensity). Bush control requires aftercare after the bushes have been thinned to acceptable stan-dards. Aftercare is important for achieving lasting results, and without proper aftercare, bush densities may actually increase (Colin Christian & Associates, 2010). In that event, repeated debushing cycles are necessary, which will reduce the livestock productivity gains to farmers but also increase the supply of by-products.

12
other farmers. Assuming the average costs of N$1,250/ha for bush control, the total bill of bush control in Namibia would be as high as N$20–32 billion for commercial areas, and N$13.5 billion for communal areas.
37. A cost-benefit analysis of bush control interventions found that bush control is not profitable for livestock farmers unless there is a market for the bush (Honsbein et al, 2009). Some believe that bush control can be operated as a profitable commercial exercise in its own right. The break-even point for bush control is a wood price at the farm gate of N$7.5–35/ton depending on the location and the control method being used. At prices above N$124/ton, wood harvesting would become commercially attractive. If wood transport costs are added, however, the market distance should be not more than 50 km. If transport costs are included in the bush prices, the break-even point varies from 45–58 km (N$124/ton), 107–120 km (N$248/ton) and 169–182 km (N$372/ton). Markets exist in particular around Windhoek and other large settlements, as well as around large commercial projects, as the Ohorongo cement factory has shown.
38. Various methods of bush control can be used, sub-divided into chemical and mechan-ical (with varying degrees of labor intensity). Bush control requires aftercare after the bushes have been thinned to acceptable standards. Aftercare is important for achieving lasting re-sults, and without proper aftercare, bush densities may actually increase (Colin Christian & Ass, 2010). In that event, repeated debushing cycles are necessary, which will reduce the li-vestock productivity gains to farmers but also increase the supply of by-products.
5. Rainfall, climate and water resources
Rainfall, forage, and carrying capacity of the land
39. Rainfall strongly influences the productivity and carrying capacity of land employed in livestock farming and therefore the sector’s contribution to the economy.16 For commercial livestock production, the carrying capacity varies from over 55ha/LSU in the driest parts of the country to 5–6 ha/LSU in the eastern Caprivi.17 The carrying capacity for subsistence li-vestock production is lower, possibly requiring double the land area per LSU, due to low-input strategies. This increases the challenge to the livestock sector, as any increase in lives-tock numbers and production in the NCA has to be accompanied by improved livestock hus-bandry and rangeland management practices. If this does not happen, meat productivity is likely to decrease due to rangeland degradation.
40. Arid and semi-arid conditions in Namibia limit natural forage and also make it diffi-cult and expensive to grow fodder. Food crops such as maize are entirely grown for food se-curity and to reduce food imports. As a result, most fodder is imported at high cost. As discussed earlier, at exchange rates prevailing during much of 2010 and 2011, many farmers found it more profitable to export weaners than to sell fattened animals. Natural grass gener-ally is not cut for forage during the dry season. In communal areas farmers traditionally let livestock graze crop residues on their fields after harvesting. No improved grass species are used to supplement natural grass production. Further research and pilots should be carried out
16 The average annual rainfall in Namibia varies from less than 50 mm/annum in the south-west and the coastal zone to well over 800 mm/annum in the north east. Rainfall variability is highest in areas with the lowest aver-age rainfall (up to 80 percent variability in the coastal areas and south-west). 17 It must be noted that the realized carrying capacity fluctuates considerably depending on the rainfall condi-tions at the time, stocking rates and livestock distribution. The extent and nature of rangeland degradation changes with increasing distance from water points (the ‘piosphere’ effect).

13
to develop cost-effective fodder production systems at the farm and community level, espe-cially ways of harvesting natural grasses and stimulating their re-growth.
Climate change
41. Climate change poses risks to the livestock sector’s ability to generate economic growth and job creation, and it shapes the type of animal production that is possible in Nami-bia. Climate change is generally expected to increase temperatures (a net increase of 2–6 de-grees Celsius by 2100); to increase potential evapo-transpiration (from 4–8 percent in central and eastern Namibia to 8–12 percent in the North and 12–16 percent in the Caprivi Region); to decrease mean annual rainfall (up to 5 percent by 2050); and to increase rainfall variability by 5–10 percent. Moreover, the rainy season is expected to become shorter (University of Namibia, 2008), and groundwater recharge, as well as surface water storage in dams, is likely to decrease (Van den Bosch, 2011).
42. Increased weather variability linked to climate change will affect livestock productivi-ty by limiting supplies of forage, causing more frequent and more severe droughts, causing more frequent and more severe floods, especially in rivers in the NCA, and causing changes in surface water availability and groundwater recharge. Water intake of animals will increase due to higher temperatures. Local fodder production will become even more costly than it already is, due to the decline in primary productivity and rainfall. Turpie et. al. (2010) have estimated that the size of viable livestock rangelands may decline to 57 million hectares in 2050 from 64 million in 2010 and that economic losses in the livestock sector due to climate change could be around 1 to 6 percent of GDP by the year 2030 if nothing is done to adapt and mitigate the effects.
43. On the bright side, climate change could slow down bush encroachment, as the rate of bush encroachment is directly related to rainfall level (De Klerk, 2004; Honsbein et. al., 2009). Increased CO2 levels could, however, favor woody species over grass. The relation-ship between climate change and bush encroachment needs further investigation.
44. Due to climate change, small ruminants are likely to gain comparative advantage over cattle in more areas than at present, and livestock farmers need to adapt their livestock and rangeland management practices to changing climate conditions. A recent review of the like-ly impacts of climate change on the livestock sector recommended several adaptive measures, including accelerated bush control, reduction of cattle numbers in communal areas to sustain-able levels combined with increased off-take rates, a switch to game farming among com-mercial farmers, and greater use of indigenous breeds (AWG, 2011).
Water use efficiency and policies
45. The amount of water consumed by the livestock sector is significant. Using 2006 li-vestock census data and standard water consumption data, Lange (2006) estimated that the livestock sector (cattle, sheep and goats) consumed over 50 million cubic meters in 2006, or around 15 percent of the total national consumption. Cattle account for over 80 percent of the water consumption. Water consumption is evenly split between the north and south (see Fig-ure 2).

14
Figure 2. Water consumption by livestock
Source: Lange 2006 Notes: millions of cubic meters of consumption
46. Livestock depend on groundwater during the dry period, except along perennial riv-ers. In the future, the livestock sector will face increasing competition for water from other economic sectors that create more value added or employment per unit of water. Access to water may be prioritized in future water allocations. Lange (2006) estimates that the water productivity of agriculture (i.e., its contribution to GDP from each cubic meter of water used)
is less than 10 percent of the national average and less than 5 percent of the average outside the agricultural sector. Therefore, increasing the water productivity of livestock will become increasingly important in the future as competition for scarce water resources intensifies.
Table 8. Value added per cubic meter by economic sector Economic Sector Value-added per cubic meter of water used
(constant 1995 Namibian dollars) 1997–98 2001–02 Agriculture
Commercial agriculture Commercial livestock production
Communal agriculture
5.51 4.55
18.45 7.48
4.24 4.07
20.86 4.62
Mining 130.26 166.29 Manufacturing
Food processing 227.67 351.71
226.56 314.32
Utilities 1,077.54 1,013.48 Construction 1,920.70 1,774.40 Services 547.73 575.31 Government 211.06 234.19 Namibia all uses average 59.49 56.21 Namibia all use average excl. agriculture 157.26 170.15 Source: Lange, 2006, p. 75.
47. Namibia has a variety of policies and acts that provide an adequate basis for water management in communal rangelands and commercial farms. All water resources are owned by government. Commercial farmers rely on own boreholes and dams in so-called groundwa-ter control areas, where permits are needed to extract water and information must be provided regarding water use (National Water Policy 2000). In communal areas, the government drills and equips boreholes, which are managed by local farmer groups. Water policies have tradi-tionally focused on commercial agriculture, and small-scale water needs of subsistence far-mers have been neglected. The 2004 Water Resources Management Act establishes new institutions such as the Water Advisory Council (WAC), the Water Regulatory Board (WRB) and the Water Tribunal (WT). The Act further provides for the establishment of water user associations (WUAs) and basin management committees. Livestock farmers can establish a
25.1
7.9
19.9 NCA
SCA
Commercial
15
WUA in a particular area, and their water needs and rights will be assessed as part of the overall basin water needs and uses.
48. Through WUAs, grazing pressure can be more evenly distributed, reducing bush en-croachment and opening up underutilized grazing. For example, development of an evenly distributed network of livestock boreholes by GRN in the NCA and SCA would be evaluated within the context of the entire river basin. According to the 2008 Water Supply and Sanita-tion Policy, users of irrigation water should be charged the full financial costs, and farmers on private land should cover the full costs of water supply and sanitation.
6. Land use and livestock production
Land tenure
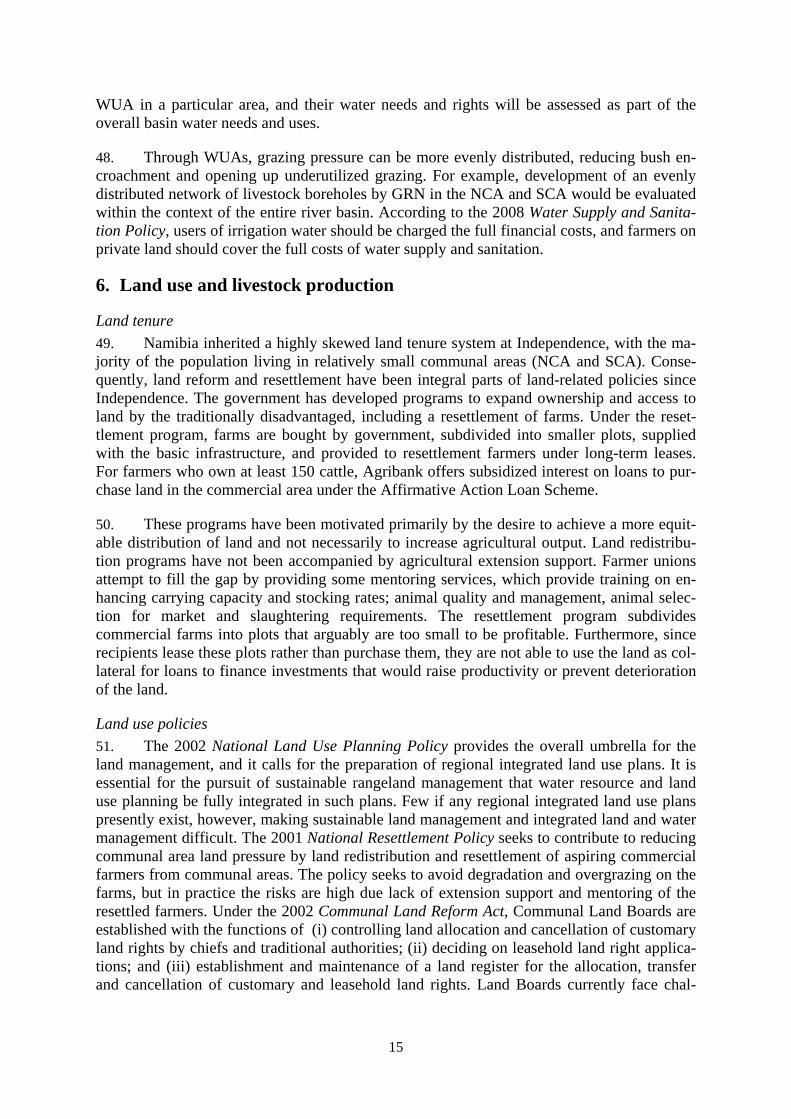
49. Namibia inherited a highly skewed land tenure system at Independence, with the ma-jority of the population living in relatively small communal areas (NCA and SCA). Conse-quently, land reform and resettlement have been integral parts of land-related policies since Independence. The government has developed programs to expand ownership and access to land by the traditionally disadvantaged, including a resettlement of farms. Under the reset-tlement program, farms are bought by government, subdivided into smaller plots, supplied with the basic infrastructure, and provided to resettlement farmers under long-term leases. For farmers who own at least 150 cattle, Agribank offers subsidized interest on loans to pur-chase land in the commercial area under the Affirmative Action Loan Scheme.
50. These programs have been motivated primarily by the desire to achieve a more equit-able distribution of land and not necessarily to increase agricultural output. Land redistribu-tion programs have not been accompanied by agricultural extension support. Farmer unions attempt to fill the gap by providing some mentoring services, which provide training on en-hancing carrying capacity and stocking rates; animal quality and management, animal selec-tion for market and slaughtering requirements. The resettlement program subdivides commercial farms into plots that arguably are too small to be profitable. Furthermore, since recipients lease these plots rather than purchase them, they are not able to use the land as col-lateral for loans to finance investments that would raise productivity or prevent deterioration of the land.
Land use policies
51. The 2002 National Land Use Planning Policy provides the overall umbrella for the land management, and it calls for the preparation of regional integrated land use plans. It is essential for the pursuit of sustainable rangeland management that water resource and land use planning be fully integrated in such plans. Few if any regional integrated land use plans presently exist, however, making sustainable land management and integrated land and water management difficult. The 2001 National Resettlement Policy seeks to contribute to reducing communal area land pressure by land redistribution and resettlement of aspiring commercial farmers from communal areas. The policy seeks to avoid degradation and overgrazing on the farms, but in practice the risks are high due lack of extension support and mentoring of the resettled farmers. Under the 2002 Communal Land Reform Act, Communal Land Boards are established with the functions of (i) controlling land allocation and cancellation of customary land rights by chiefs and traditional authorities; (ii) deciding on leasehold land right applica-tions; and (iii) establishment and maintenance of a land register for the allocation, transfer and cancellation of customary and leasehold land rights. Land Boards currently face chal-

16
lenges in controlling land allocations by chiefs and traditional authorities and no land registry has been established to date.
52. Outside of areas with privately owned land, the chief or traditional authority allocates land for residential and cropping purposes. Grazing land is communal and is controlled by the traditional authority, including through restricting livestock numbers, imposing rotational grazing measures, and granting of grazing rights to non-residents.18 Unused communal land can be allocated for leasehold rights, and fencing of communal areas is prohibited under the act.19 The Land Act establishes the land boards and a Land Reform Advisory Commission (LRAC), and furthermore provides for demarcation of communal land areas and specification of the role of traditional authority and land boards in land allocation and administration. Grazing rights of any resident can be withdrawn by the traditional authority if the person fails to comply with management regulations or has a significant amount of land elsewhere. While the bill provides a comprehensive management framework for communal (grazing) areas, its implementation is proving to be a formidable challenge. Current community-based livestock management schemes are the most promising effort to improve communal rangeland and li-vestock management.
IV. Animal health and disease
53. Animal diseases, both inside and outside Namibia, and measures to manage these dis-eases play central roles in the sector. They government the movement of animals and meat, and they cause separation in livestock production systems inside Namibia. Consequently, ve-terinary and extension services available to producers strongly influence the sector’s competi-tiveness.
7. Animal health policies
54. The livestock sector is highly influenced by the national animal health policy, which restricts movements of animals and shapes any intervention related to this sector. In particu-lar, as a condition for international trade, veterinary services are required to comply with in-ternational standards, in particular related to EU requirements for animal product imports. The country is divided into two areas: The southern part of the country has been officially recognized by the World Organization for Animal Health (OIE) in 1997 as an FMD-free zone where vaccination is not practiced. This area is also free from Contagious Bovine Pleurop-neumonia (CBPP) and most of the major trans-boundary animal diseases (TADs.) This af-fords Namibia access to high-value international export markets such as the European Union, as described earlier in the document.
55. In contrast, the NCA is classified as an FMD buffer zone, and it has never been rec-ognized as FMD-free. Outbreaks of FMD are detected every year in Kavango and Caprivi Districts, most likely linked to wildlife reservoirs, as well as to weak animal movement and border controls, and CBPP occurs along the border with Angola. The rest of the NCA has not reported any outbreaks of these two diseases for many years. This disease status limits movements of animals and their products from the NCA to the southern part of the country,
18 Individuals are not permitted to have over 300 cattle in communal areas. Enforcement of this ceiling has prov-en to be difficult, especially since owners often have different herds in different locations. . 19 Fencing is still rife in communal areas as individuals pay traditional authorities to get land allocated. A field visit by the team showed that community-based livestock management has the potential to halt this practice of land fragmentation and reduction of grazing commonages.

17
but producers in the NCA are nonetheless able to supply local markets and neighboring coun-tries having the same animal disease status, such as Angola or DRC.
56. The MAWF recently adopted the Policy for the Eradication of Transboundary Animal Diseases in the NCA of Namibia, aiming at improving the Animal Health in this area so as “to eventually declare the NCA, or parts thereof, free of FMD and CBPP through the implemen-tation of animal diseases surveillance and control strategies.” This policy is currently guiding a series of investments proposals to strengthen the Veterinary Services and the animal diseas-es information system in the NCA. In particular, a review of the VS organizational structure and position descriptions was carried out in 2009 and led to a proposal for a significant re-structuring of the Directorate of Veterinary Services (DVS) (see section VII.15 below on page 31) that is being considered by the Public Service Commission.
8. Extension and advisory services delivery systems
Public extension systems
57. One of the major constraints to livestock productivity in the communal areas remains the weakness of extension and advisory service delivery systems. Whereas commercial far-mers can afford and are often willing to pay for these services from private service providers, this is more challenging for producers from communal areas. The public extension services lack the capacity to provide services to all producers. Estimations show that for commercial farms, the number of extension officers has decreased from one officer for 70 farms in the 1970–1980’s to one officer for 400 farms currently. The ratio is even more skewed for com-munal producers, with one extension officer for several thousand livestock-keeping house-holds. In addition, the lack of specialization among the staff from the Directorate of Extension and Engineering Services (DEES) limits the efficiency of the few staff available. Because of the lack of staff, crop production specialists are often called upon to advise lives-tock producers, even though their knowledge is often insufficient. It is now widely recog-nized that an animal production extension service delivery system must be highly specialized to generate visible impact and maintain the trust of producers. Innovative technologies and practices are emerging rapidly, and extension officers must be livestock specialists by back-ground and participate in in-service training program to update their knowledge on a regular basis. The same applies to sustainable resources and rangelands management practices. Given the plethora of national and local producers groups, innovative linkages need to be forged to link the emergence of a private advisory and extension service delivery system to stated needs of members of local producer groups. However, the lack of organization of these groups makes this process difficult.
58. In addition to depressing livestock productivity and slowing technology adoption by farmers, these constraints are also jeopardizing implementation of the government’s policy and strategy in the sector. For instance, farmers accessing new lands through the resettlement program implemented by the Ministry of Lands and Resettlement are supposed to make pro-ductive use of the land yet without knowledge transfer, technical assistance and training on farm management, this objective is currently rarely reached. To try tackling this problem, some isolated initiatives are currently occurring in the form of mentorships programs. For instance, the Meat Board and the Namibia Development Bank are funding two programs aim-ing at mentoring new farmers from the NCA who have been resettled in the south of the country. These programs, which use experienced commercial farmers as trainers and mentors, are focusing on marketing, productivity and sustainable rangelands management issues. Al-though promising, these programs are too limited in scale to generate benefits for the entire

18
livestock sector, and the problem of advisory and extension services delivery system should now be tackled at the national level.
59. Any initiative to reinforce the livestock extension system could provide an opportuni-ty for job creation and capacity building activities, both in the public and private sectors. In-creasing the number of service providers, and making investments designed to reinforcing their capacities, would have a strong positive impact on livestock productivity in the medium-term. Producers Organizations that are already in place under the NNFU should be seen as the entry point to better reach grassroots level communal farmers. Building capacity among the POs would also increase their bargaining skills and help them access to cheaper inputs, increasing their competitiveness.
Animal health status and the role of veterinary services
60. The Namibian Veterinary Services is well organized and operated by competent pro-fessionals, especially in the South. In this area, the private veterinary sector is even well sup-ported by 90 veterinarians. There is no official agreement between DVS and private veterinarians. Collaboration nevertheless takes place, specifically related to information flows in the case of suspicion of notifiable animal disease outbreaks. The DVS 2009 annual report highlights that the DVS budget seems adequate and has increased to N$127 million in FY2009 from N$91 million in FY2008. The establishment of an identification and traceabili-ty system in the South is robust and allows veterinarians to trace back any sanitary emergen-cy, as required to maintain official disease-free status.
61. In August 2008, the OIE conducted an Evaluation of the Performance of the Veteri-nary Services, using the OIE PVS Tool. The country PVS report was disclosed in 2009. A sub-sequent gap analysis was completed in October 2010, and the corresponding report is about to be finalized by being reviewed by the MAWF. The country PVS evaluation report confirms that the quality of VS in southern Namibia mostly complies with international stan-dards, but it raises important concerns regarding: (i) the future staffing of the VS, as return of foreign veterinarians to their countries of origin (notably Zimbabwe) is envisaged once the political situation there improves; (ii) the vacant positions within the VS due to the lack of professionals in Namibia (92 vacant budgeted posts out of 737 available in 2010); (iii) the strong difference between high-quality VS and traceability systems in the south and their global weakness in the NCA; and (iv) the lack of cooperation between public and private ve-terinarians and the absence of formal partnerships, though the “sanitary mandate” for in-stance.20
62. A major concern for sector growth is the difference in the quality of VS between the South and the NCA. During the past few years, the NCA has reported isolated outbreaks of FMD only in the Kavango and Caprivi districts and of CBPP along the border with Angola. Despite higher population densities of humans, cattle and goats, the NCA is characterized by a lower level of knowledge and organization of producers, thus posing considerable risks of introduction of major diseases from neighboring countries (Angola in particular). With only 12 State Veterinarians available to run and manage the seven State Veterinary regions of the NCA, including the Ondangwa laboratory and six quarantine facilities, the NCA relies on its network of Animal Health Technician Offices and Veterinary Rural Extension Centers (num-bering about 35) for all field-related work, including TAD outbreaks investigation and con-trol, vaccination campaigns, identification and animal health services and products delivery.
20 A sanitary mandate is an accreditation program under which private veterinarians are contracted and paid by the government for providing public good services, such as participating in vaccinating campaigns.

19
There is limited infrastructure, only one understaffed regional laboratory focusing on rabies and parasitology, no permanent border posts, and an absence of private veterinarians in the area. In addition, meat inspection services at the two export-accredited abattoirs (Meatco Oshkati and Katima) are managed by State Veterinarians. This contrasts with hygiene and food safety control of municipal slaughterhouses and local butchers, which are under the re-sponsibility of the Municipality and are often handled by technicians with a lower level of training.
63. The absence of private veterinary practitioners in the NCA (there is only one regis-tered veterinarian in Oshakati, who focuses on pets) is explained by the perceived lack of profitability of veterinary services provision in the NCA. There is undeniably a strong disin-centive for private veterinarians to establish in the NCA. This stems from the production sys-tems (low inputs-low outputs), the unwillingness and often the lack of capacity among farmers to pay for services and products, as well as important transaction and transport costs in the area. This is an additional factor explaining the low veterinary coverage in the NCA, which is a critical factor impeding the efforts of the government of Namibia to: (i) improve animal health status of the NCA, (ii) establish and maintain their disease-free status into the future, and (iii) shape the opportunities for enabling job creation through sector development.
64. Three major issues arise from this analysis of animal diseases and systems for control-ling them in Namibia:
The system has difficulties dealing with so-called “management” diseases, which primarily affect livestock productivity. These include vector-borne diseases, internal parasites, mastitis, and measles. Outbreaks of measles led to abattoir seizure and con-straining the export of nearly 200–300 carcasses per year, reported at the Oshkati Ab-attoir alone. Regarded as not highly contagious diseases that do not affect trade directly, these diseases are neglected because of the lack of resources and lead to im-portant productivity losses for farmers (e.g., high goat and calf death rates, low fertili-ty, etc.).
The early detection and rapid response capacity to any suspicion of notifiable animal disease, although acceptable, is lower in the NCA than in the South. This is accen-tuated by the poor road conditions prevailing in some areas of the NCA, leading to the difficulty to reach some producers and the lack of awareness and knowledge of some communal farmers (they often haven’t seen FMD for more than 20 years and there-fore would have limited ability to diagnosis it in the case of an outbreak).
The system can lead to different food safety levels between meat for export and meat sold locally, and to the persistence of major zoonotic diseases in the area, such as dog rabies.
V. The role of policies and institutions in sector development
65. Livestock marketing, meat production, and international trade take place within a framework of institutions and public policies. These play a strong role in shaping the compe-titiveness of Namibia’s livestock and meat sector.
9. Trade policy environment
66. The Namibian livestock sector is closely linked to international markets, and the poli-cy space influencing the sector is populated with legal requirements related to trade in lives-tock and livestock products, as well as access to inputs, in particular land and labor. These

20
policies range from quantitative restrictions on exports and imports, export tariffs, differential import tariffs, including those linked to a policy of infant industry protection and access to land.
Foreign market access
67. Namibia’s market access for livestock exports is conditioned by preferential access arrangements to its principal export markets, in particular: South Africa under the Southern African Customs Union (SACU), the European Union (Interim Economic Partnership Agreement (EPA)), Norway, the European Free Trade Association (EFTA) and other South-ern African markets through the Southern African Development Community or SADC Trade Protocol.
68. Namibia enjoys duty-free access to South Africa, with meat and dairy import duties for non-SACU members set at 40 percent. Potential free trade agreements between South Africa and non-SACU members, such as Mercosur, a Common Market of the South Ameri-can Cone, could however threaten Namibia’s current tariff protection in that market. An in-fant protection clause allows Namibia, with agreement from SACU to increase tariffs on certain products, such as pasta, dairy, and poultry to support the development of local indus-tries.
Figure 3. Namibian Penetration in European Markets, 2005–2011
Source: UN Comtrade Notes: Shipments of boneless beef, fresh or chilled (HS 020130) and frozen (HS 020230)
69. Preferential access to the EU and Norwegian markets is much more complicated. Pre-viously, under an ACP agreement with the EU, Namibia had an annual EU quota for boneless beef and veal of 13,000 tons, which was assessed a preferential rate 24.2 euro/100kg.21 This equates to a 92 percent tariff reduction (Meyn 2007). ACP preferences have enable Namibia to capture a large and generally rising share of the UK’s imports of beef from outside of the EU, as seen above in Figure 3).22
21 Africa, Caribbean, Pacific agreement under the Cotonou agreement which expired in 2008, to be replaced by EPAs 22 Namibia was the UK’s largest non-EU supplier of fresh boneless beef (HS 020130) from 2008–2010.
‐
1,000
2,000
3,000
4,000
5,000
6,000
7,000
2005 2006 2007 2008 2009 2010 2011
Tons im
ported
Shipments to U.K.
Fresh
Frozen
0%
5%
10%
15%
20%
25%
30%
35%
2005 2006 2007 2008 2009 2010 2011
Share of non‐EU im
port m
arket
U.K. Market Share (non‐EU)
Fresh Frozen
0
250
500
750
1,000
1,250
1,500
2005 2006 2007 2008 2009 2010 2011
Tons im
ported
Shipments to Norway
Fresh
Frozen
0%
20%
40%
60%
80%
100%
2005 2006 2007 2008 2009 2010 2011
Share of im
port m
arket
Norway Market Share
Fresh
Frozen

21
70. The ACP, however, has been suspended, and market access is now being renegotiated under the EPA. Currently, in the context of an unsigned EPA, Namibia is able to export de-boned beef duty free to the EU; however, difficulties in procuring high-quality animals for slaughter has historically limited Namibia’s ability to fill its quota, with quota fills for 1994-2006 estimated at 71 percent (Meyn 2007). Discussions are ongoing about signing the EPA, with both South Africa and Namibia still negotiating. The EU has imposed a deadline for rati-fication of January 2014. Should the agreement not be signed, Namibia beef exports would face full MFN tariffs. According to an Overseas Development Institute study, this result in Meatco paying an additional €30.8 million in tariffs (based on €47.2 million in beef imports in 2005), thus eroding industry profitability and the competitiveness of Namibian products in the EU market (Meyn 2007).
71. Norway grants a 3,500 ton beef quota to Botswana and Namibia under the SACU-Norway Agricultural Agreement. This concession has enabled Namibia to supply the over-whelming majority of Norway’s fresh beef imports and around one-third of its imports of fro-zen beef (Figure 3). SACU is proposing that the beef import quota be expanded to 8,000 tons, 6,000 tons under SACU-EFTA and 2,000 tons under GSP. This proposal will be considered by the Norwegian parliament later in the year. One challenge to the request is related to the fact that Namibia exports boneless cuts to Norway. This is opposed by Norwegian trade un-ions, who indicate that meat-cutting jobs in Norway are being lost; they would prefer the im-port of carcasses, which is not allowed.
72. The industry and government are working to diversify export markets beyond SACU and Europe. Meatco has been investigating the commercial viability of exporting to large emerging markets (notably Russia and China), high-income countries in the Middle East, and nearby African countries. Namibia recently signed a trade agreement with the DRC.23 For several years, Namibia has been working to obtain certification to ship meat to the U.S., which is expected soon. These experiences highlight one factor that complicates diversifica-tion of export markets: the country must invest in often high fixed costs to negotiate access and/or comply with sanitary regulations for each new export market.
Own trade policies
73. Namibia imposes a number of trade restrictions that are intended to promote value addition. Infant industry protection in the poultry and dairy industries has already been dis-cussed. In addition to these, there are a range of restrictions on exports of livestock and ani-mal products. These include, first of all, several export taxes:
Mature, slaughter-ready cattle face an export tax of 30 percent. There is a 30 percent export tax on pickled hides and skins, and a 60 percent export
tax on dray and wet hides and skins.
74. Out of concerns that exports of breeding stock would enable Angola to develop a competing livestock sector, MAWF in 2011 introduced a restriction that a farmer may export no more than five female and one male animal per year to Angola (The New Era, October 11, 2011). In practice this has little effect on Angola and it benefits South African and Brazilian exporters who are currently supplying the Angolan market. Legitimate stud/breeders have
23 The agreement with the DRC establishes an import quota for Namibian beef for a live-weight-equivalent of 500 kg for each bovine exported of the hoof to DRC. In other words, for each live animal weighing an estimated 500 kg live weight, an equivalent quality of beef must be purchased from the NCA.

22
expressed concern about restrictions on lucrative marketing opportunities to export high val-ue breeding stock.24
75. Sheep exports also face restrictions. The Small Stock Marketing Scheme, introduced in 2004, initially required sheep farmers to slaughter one sheep domestically for each live sheep exported. This ratio was increased in 2007 to six sheep slaughtered locally for each live animal exported.25 The export restriction policy appears to have caused an estimated 13 per-cent decline in sheep inventories and a significant shift from live exports (from about 850,000 head in 2003 to approximately 60,000 by 2009) to slaughtering (360,000 in 2003 to 860,00 by 2009). This was reportedly accompanied by a near doubling in abattoir capacity (Schultz, 2009) to 1.3 million head and the estimated creation of approximately 300 jobs (Schultz, 2009). However, these figures do not take into account the job losses in livestock production and live trade sectors.
76. In fact, producers did start to diversify their farming operations by moving to cattle, goat and karakul farming and even to game and tourism farming. Evidence in support of this hypothesis comes from Agra, which reports the opening of cattle auctions in areas unsuitable for cattle production, and from Agribank, which has registered a shift in loan requests for cattle production in previously sheep raising areas. This shift in production is expected to have long term negative impacts, as cattle thrive less well in such arid environments and are less resilient to the type climate change anticipated in Namibia. The policy focus on value addition needs to be balanced with an appreciation for the impact on the structure of the sector and the economic impact on primary producers.
77. The government’s stated livestock policy objective is to add value to the raw material origi-nating from the livestock sector. However, “value addition” is defined solely in terms of production processes (see Box 1), rather than in terms of the value placed on a product by consumers. It is not clear that those objectives have maximized the sec-tor’s contribution to GDP: additional transforma-tion adds costs, but not necessarily value, especially if the additional transformation processes are not internationally competitive. On the contrary, there is evidence that the policies have adversely affected the sector. However, the overall impact of the policy on the sector is difficult to measure, due to the lack of good quality data, in this case animal numbers, and the complexity of disentangling the myriad of factors which affect markets such as shifts in product demand, changes in the structure of the industry, etc. However, a preliminary review of data and expert opinions indicate that animal numbers have declined.26
78. Processing of meat has been disadvantaged by unclear government policies on im-porting meat products that feed into further value addition. Some hold the view that Namibia 24 Producers also assert that the text of the measure was not widely circulated, leading to confusion within the industry about specific provisions of the measure. 25 The restriction was supposed to expire at the end of June 2008, but continued since no new quota ratio was agreed upon. There have been several proposals during the past 3–4 years to replace the quantitative restriction with an export tax. 26 AGRA auction figures and lending trends by Agribank
Box 1. Value Addition Defined The Namibian Cabinet’s definition of val-ue addition, as per decision 6/17.04.07/07, reads as follows: “Value addition is the transformation of an original product into a new product or products by processing and/or manufac-turing operations across the value chain of the industries with special emphasis on the degree of transformation”.

23
should be self-sufficient in red meat production and call for restricting imports and encourag-ing Meatco to focus first on satisfying domestic demand. However, optimizing sector devel-opment is built on two-way trade in meat products: exporting high-priced meats and importing lower priced product, which feeds into local processing. A good example of this occurs in the United States, the world’s largest beef importer. The United States purchases low-quality, manufacturing grade beef from Australia and New Zealand to supply the nation-al fast-food industry. Meanwhile, the United States continues to be one of the world’s largest exporters of high-quality beef cuts. It should be recognized that beef production systems are very heterogeneous, and high quality beef cuts originate from well managed operations which produce high-quality stock. It should also be noted that policies can have negative implica-tions for the competitiveness of agricultural sectors, the Argentina being a good example (see Box 2).
10. Institutions involved in the sector
79. Perspectives on the way that the government implements these policies and on the impact of these policies on the sector are complicated by the diverse nature of four stakehold-ers/institutions that are officially linked into the policy process.
80. Meatco was consolidated from various abattoirs in 1983. The Meat Company Act of 2001 mandates that Meatco serve the interest of all producers—communal, emerging and commercial—and gives the Minister of Agriculture Water and Forestry the authority to ap-point Meatco’s board of directors. The State-Owned Enterprise Governance Act of 2006 lists Meatco as an SOE and therefore subject to additional government control. The state has no ownership stake in Meatco, however, despite the SOE designation.27 In fact there is consider-able ambiguity over who in fact does own the company. Meatco has never issued shares or share capital since it was incorporated in the 1980s. The Meatco Act states that all livestock producers can register as “members” of Meatco, but says nothing about ownership.
81. This ambiguity over ownership creates obvious challenges for corporate governance and accountability, not to mention commercial operations. These are highlighted by the ex-pectation to function as a profit-oriented business entity while at the same time absorbing 27 Some suggest that Meatco was classified as an SOE because it borrowed N$200 million from the government after Independence, which it subsequently repaid (The Namibian, October 12, 2011).
Box 2. The impact of price and trade policies on livestock competitiveness: The case of Argentina In Argentina, restrictive trade policies and domestic price setting for beef introduced by the Government over the past three years have driven away investors, reduced the size of Argentina’s herd by 6 million head, and allowed Uruguay, the nation’s smaller neighbor, to capitalize on a three-year decline in Argentina beef exports, estimated to have fallen by 60 percent. The political decision to micro-manage the sector in an effort to reduce domestic food price inflation led to introduction of export restrictions and price controls on certain beef cuts. Reduced returns to the industry prompted many ranchers to convert their pastures for soy-bean cultivation. In 2011 policy distortions continue to make it difficult to source eligible cattle for the lu-crative EU “Hilton High Quality” beef quota (28,000 tons), and exports are estimated to continue to decline. Meanwhile, despite the devastating impact of these policies on the sector, the government persists in setting prices; maximum retail and sales prices paid to producers and wholesalers of meat products were set as recently as June 2011, and specific prices were announced for live cattle and carcasses (Source: USDA).

24
losses from operating government abattoirs in the NCA. These losses impose negative spil-lovers on the sector as a whole through lower prices that Meatco must offer producers throughout the country, which in turn give a greater incentive to export livestock as weaners rather than raising them to slaughtering weight.
82. A July 2011 Cabinet resolution called for converting Meatco into a cooperative and directed MAWF to finalize the restructuring. Livestock producers interpret “cooperative” narrowly to mean that the restructured Meatco will be owned fully and exclusively by pro-ducers. Some MAWF officials reportedly interpret the Cabinet resolution more broadly and have proposed that the government should own 30 percent of the cooperative because of meat processing’s strategic importance to the economy (The Namibian Sun, October 13, 2011).
83. The Namibian Meat Board was set up under the Meat Industry Act in 1981 and has a mandate to promote the interests of the meat industry of Namibia. It is considered a regula-tory statutory body which is funded by levies approved by GRN as well as by fees generated by branding, slaughter, export, trading and auctioning of livestock and meat producers. In January 2011 the schedule of levies was revised to include a general levy of 0.8 percent col-lected all sales (imports, exports, and domestic sales) of livestock or meat, and special levies of N$10/head for cattle, N$6/head for pigs, and N$2/head for sheep. In addition, there is levy of N$16.45/head for supporting activities in the NCA.
84. The Meat Board is expected to be autonomous and representative of stakeholders and industry participants. However, current representation on the board is not viewed as reflective of the contributors to the levies, thus raising questions about whether board decisions ade-quately represent priority concerns of the membership, which consists mainly of producers, traders, and other stakeholders. Increasingly, levies are being used for purposes that many would consider to be the responsibility of the government, such as the repair of the Veteri-nary Cordon Fence (VCF), construction of international border fences, and mounting emer-gency responses to animal disease outbreaks. The public-private nature of these arrangements needs to be examined.
85. The Namibia National Farmers Union (NNFU) is a national federation of regional farmers unions. It was established in June 1992 to serve as a mouthpiece for Namibian com-munal and emerging farmers. Twelve regional farmers unions of constituency farmers’ or-ganizations are currently affiliated, representing about 137,000 households (100,000 from the NCA and 37,000 from the southern part). Their influence is impeded by weak institutional capacities of regional and constituency bodies of the farmers’ organization, as well as by very limited human resources (fewer than 10 staff) at the national level. The NNFU’s annual oper-ating budget of N$3–4 million is covered by an allocation of 20 percent of the levy charges collected by the Meat Board, supplemented with contributions from the GRN and donors.
86. The Namibia Agricultural Union (NAU), in existence for 62 years, is a union of farmers in Namibia which represents 2,500 commercial farmers (out of the 4,000 to 6,000 existing), with associations organized at local (75), regional (10), and national level. 11 per-sonnel support a variety of producer’s associations including: livestock dairy, poultry, char-coal, agricultural employers, and agronomic board. The NAU finances itself through the subscription of its members, reported at N$1,932/yr, and similarly to the NNFU, a 20 percent allocation of the levy charges taken by the Meat Board.

25
VI. Prospects for growth
11. Cattle sector
87. Additional growth remains feasible. Despite the relatively well organized and ma-ture markets in the south of the country, there remains potential for growth, both in the South and especially in the NCA, pulled by some promising markets—the Meat Board has set a goal of increasing annual cattle marketing to 700,000 per year by 2025 from the current level of around 400,000 (Meat Board, 2011). Markets are emerging in neighboring countries, such as Angola and DRC, although they are currently small and often informal. In these countries, niche markets are also occurring, as for instance Angola needs to restock its livestock popula-tion and wants to import breeding stock. Similarly, high-value markets such as to the EU and South-Africa are not fully exploited and could be reinforced, while new markets might emerge in the near future, as negotiations with the U.S. to export lamb and beef meat are at the final stage.
88. While opportunities exist for enhancing the value of the sector through trade, job crea-tion through the livestock sector appears to be more challenging. In the South, a priority should be placed on maintaining jobs in rural areas and strengthening links along the value chain (e.g., auctions, slaughterhouses, trading, transportation, etc.). Opportunities for job cre-ation may exist in some specific underutilized geographical areas (such as west of Otjozond-jupa and north of Omaheke) or for targeted activities such as bush eradication and charcoal production/selling.
89. The NCA might present more opportunities for employment generation, from the on-farm production segment of the value-chain to processing and marketing. For instance, the Meatco Oshakati Abattoir is currently exporting cut meat to South Africa and Angola.28 Its processing capacity is about 25,000 head of cattle per year, and the demand from South Afri-can and Angola markets is strong. However, the supply of live animals to the abattoir is not sufficient and seasonal, with very few animals supplied in December and January over the past three years. Although growing (current trends show that about 11,000 animals will be slaughtered in 2011, against 4,500 in 2009 and 7,600 in 2010), the abattoir is far from reach-ing its full potential and could absorb more than twice the number of animals every year. Disease-free status would allow the NCA to begin supplying the under-filled quotas to the EU, assuming that high-quality animals can be obtained for slaughter, generating additional jobs in abattoirs currently operating under capacity. There would be also opportunities for individuals interested in investing in feedlotting activities with a secured market for their fat-tened animals.
12. Job creation through debushing
90. Growth potential also exists in bush control and the development of markets and industries for the byproducts of bush control. Bush encroachment restricts livestock prod-uctivity and economic growth. The strategic solution pursued by the country is to control bush to the benefit of the livestock sector and to produce by-products to generate income, growth and employment. The restoration of livestock land productivity would significantly increase livestock production and productivity, and could (partly) reverse past employment loss in the livestock sector. Typically the carrying capacity of land is one LSU per 15 hec-
28 In May 2012 the Oshakati abattoir was approved to deliver free-range certified beef to Woolworths in South Africa.

26
tares or 25kg/ha; however, bush encroachment is reducing land productivity and potentially the supply of animals for slaughter and export.29 The Namibian Meat Board estimates that present cattle numbers is commercial farming areas are 64 percent lower than the numbers in 1959, with annual opportunity costs/losses estimated at N$700 million
91. Many industry stakeholders indicate that debushing could double the current availa-bility of animals. Assuming a bush control program of 1 million hectares per annum, lives-tock productivity could increase by up to 4 percent per annum or N$250 million (assuming livestock productivity loss due to bush encroachment of N$1 billion annually). Such a bush-clearing program could create could generate up to 40,000 jobs (assuming that one person clears 250ha/year). Increased livestock productivity would create employment in the meat processing industry and improve Namibia’s chances of meeting European import quotas. Other benefits include increased groundwater recharge and greater water availability to sup-port growth and employment in other economic sectors.
92. By-products of bush control can be used for a variety of purposes and markets: Wood for fuel, fencing, handicrafts, construction, etc. This primarily serves the sub-
sistence market in communal areas; a small commercial market exists in urban areas; Wood for charcoal production: this market is relatively well developed in Namibia,
mostly on private farms. Wood chips for gasification and energy generation (e.g., power plants). This market is
not yet well established. Studies have explored potential viable uses, ranging from small to large scale use and using wood separately or as supplement to coal.
Wood use for other applications (e.g., crafts, fodder). There is need to do further mar-ket and technology analyses to ascertain the commercial potential.
93. The domestic market for wood is shown in Table 9. It is a large, mostly informal mar-ket. Around 80 percent of the wood is collected and used by the same households. Charcoal is the main commercial wood-based product, sold both in Namibia and abroad. Fuel wood is mostly sold in urban areas. Wood prices range from N$400–600/ton.30 Two-thirds of wood consumption is for fuel wood. Construction and fencing are important non-commercial uses in mixed farming areas (around a quarter of consumption). While providing limited formal employment, wood collection and use is an important in-kind source of livelihoods, particu-larly in rural areas, and absorbing a significant amount of household labor. Export of fuel wood logs has almost doubled in the period 2006–2010 to 13,500 tons, valued at N$21.3 mil-lion. Export growth could further boost the market for fuel wood.
Table 9. Estimated domestic wood consumption Wood uses Domestic use (no cash) Commercial use Total use Fuelwood 983,000 100,000 1,083,000 Charcoal 0 240,000 240,000 Construction & fencing 316,000 0 316,000 Carvings 0 440 440 Mopane roots 1,000 1,000 Total 1,299,000 341 440 1,640,440 Source: Mendelson and Obeid, 2005 Note: Amounts are expressed in cubic meters
29 One ha optimally generates 300 kg of dry matter; an animal of 450kg is estimated to require 4 tons of dry mat-ter/year. 30 The price of fuel wood in a Windhoek supermarket was N$19/10kg or N$1,900/T (May 2011).

27
Figure 4. Wood and Charcoal Exports, 2006–2010
Source: Central Bureau of Statistics
94. The market for charcoal, produced mostly from bush removed from commercial farms in central Namibia, has grown rapidly over the last decade. Some 50,000 to 60,000 tons of charcoal is produced annually (LAC, 2010), requiring 250,000–300,000 tons of wood (con-version efficiency of 20 percent). Assuming 10 tons of excess wood in bush-encroached areas, this amount of charcoal would be produced from bush control operations carried out on 25,000 to 30,000 hectares annually. Annual charcoal sales amount to N$75–100 million. While local sales of charcoal may be loss making (a reported price of N$250–850/ton accord-ing Honsbein et al (2009)), exports to southern Africa and Europe are profitable. The sector has continued to grow rapidly but the recent floods affected production and exports. Exports in 2009 reached a peak of 97,310 tons, valued at N$175.7 million (see Error! Reference source not found.), with the majority going to South Africa. The charcoal industry employs 4,800 workers, each of whom can earn up to N$1,900/month (LAC, 2010). Given the availa-ble markets and resource abundance, the charcoal industry has significant growth potential, primarily through exports. Employment opportunities could grow to between 10,000 and 20,000 jobs.
95. Current sector constraints include low efficiency of the production process, indiscri-95. Current sector constraints include low efficiency of the production process, indiscri-minate wood-cutting instead of selective thinning, high labor and transport costs, and poor working conditions. Expanded commercial production would necessitate a careful review of the MAWF’s monitoring and permitting procedures to ensure a balance between conservation and utilization of forests.
96. The energy market offers additional possibilities for absorbing the by-products of bush control. Unlike the charcoal market, the bush-for-energy market is still in its infancy stage, even though its energy generating potential is substantial (Leinonen et. al, 2008). Cur-rent know-how suggests that two applications may be most feasible. First, some large-scale applications could be feasible. The example of the combined use of coal and bush for Oho-rongo cement factory, financed with private sector investment, is given in Box 3. If the ce-ment factory project is successful, more applications for future large projects in bush encroached areas should be considered (e.g., the broiler project). Second, by-products from bush control operations can be gasified to generate power. One such project will become an independent power supplier.
0
50
100
150
200
2006 2007 2008 2009 2010
millions of Nam
ibian dollars fuelwood logs charcoal

28
97. A number of bush-for-energy pilot studies have been carried out for different, mostly small-scale, applications (Leinonen et. al, 2008; Honsbein et. al, 2009). The results indicate that: (i) most bush for energy applications are not yet economically viable in areas where us-ers have access to the grid; (ii) bush-cum-coal applications for power plants are better than pure bush applications; and (iii) bush-for-energy applications cannot afford to pay a price for the bush resource and are more attractive in (remote) areas that lack access to the national power grid.31
98. The viability of bush-for-energy projects is expected to improve in the future as Nam-power increase prices and new technologies emerge that reduce the cost of generating energy from bush. There may be growth opportunities in small-scale applications on farms and in remote areas as well as well-conceived, large-scale industrial and agro-processing applica-tions in areas with heavy bush encroachment. Use of removed bush in a small power plant could employ 49 to 173 persons per plant of 5MW and 20MW respectively (Honsbein et. al., 2009). Job creation is limited as labor-intensive technologies of bush control are uneconomic without subsidies.
99. Current bush energy market constraints include high transport costs, low Nampower electricity costs, technology limitations, and lack of skills. It is clear that there is an excess supply of wood resources whose removal can be promoted and whose economic uses need to be optimized. As an example, under the right circumstances a one million hectares of bush-encroached area could generate the following productive values:
31 The energy price from bush then needs to be compared with the price of alternatives such as solar power or diesel.
Box 3. The use of bush and wood chips for energy generation in the Ohorongo cement factory The Ohorongo cement factory started operations in December 2010 with a production capacity of 700,000 T/annum, creating around 300 jobs. The factory uses a combination of coal and wood chips (from bush) as energy sources. Planned bush control: annually 4,250 hectares, with a maximum of 200 hectares on any individual farm. The planned harvest is 85,000 tons, saving coal imports of some 55,000 tons. At a price of US$90/ton, savings would amount to US$5 million per annum. No figures were available to estimate the actual wood chip production and coal savings. The wood harvesting and chipping system works as follows: teams will go out to nearby farms in 50 km radius of the plant and cut bushes by mechanical means. Bushes will then be transported to nearest road and collected. Further processing will occur at the cement factory. The farmers are responsible for the aftercare and they do not get paid for the bush removed. The bush removal would be limited to 200/ha/farm. The re-sources within a 50 km of the plant could last 38 years; those within a 70 km radius would last 78 years. The bush control and wood chipping system is expected to employ 45 persons (semi skilled and skilled). Management contracts are concluded between Energy for Future (EFF) and Ohorongo cement factory and between farmers and EFF. MWAF provides licenses for bush clearing and is responsible for inspection and monitoring. Farmers are responsible for aftercare and compliance with the Environmental Management Plan (EMP). EFF (wood harvesting and chipping) invests an estimated Euro 11 million. The Ohorongo Cement factory will spend €1–5 million at the plant. The EFF company will get a 10-year supply contract with the cement factory. Both companies belong to the same German parent company. Farmers will pay for aftercare activities. Sources: company info and CCA, 2008.
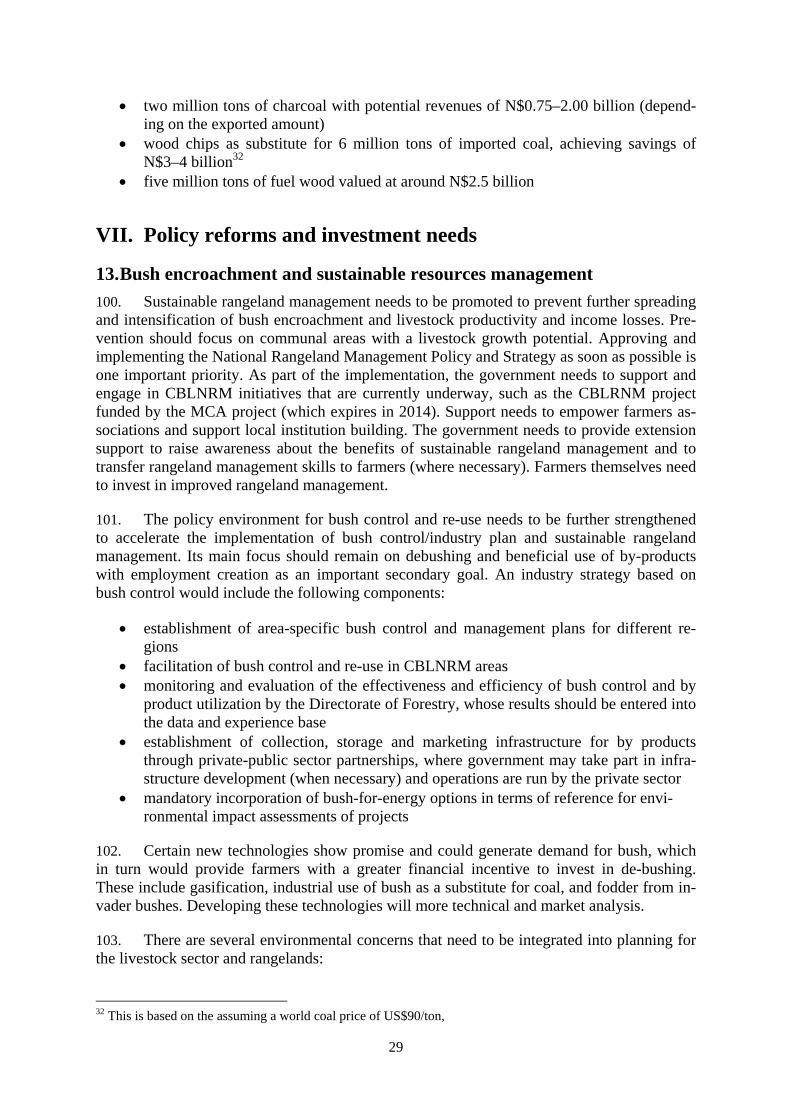
29
two million tons of charcoal with potential revenues of N$0.75–2.00 billion (depend-ing on the exported amount)
wood chips as substitute for 6 million tons of imported coal, achieving savings of N$3–4 billion32
five million tons of fuel wood valued at around N$2.5 billion
VII. Policy reforms and investment needs
13. Bush encroachment and sustainable resources management
100. Sustainable rangeland management needs to be promoted to prevent further spreading and intensification of bush encroachment and livestock productivity and income losses. Pre-vention should focus on communal areas with a livestock growth potential. Approving and implementing the National Rangeland Management Policy and Strategy as soon as possible is one important priority. As part of the implementation, the government needs to support and engage in CBLNRM initiatives that are currently underway, such as the CBLRNM project funded by the MCA project (which expires in 2014). Support needs to empower farmers as-sociations and support local institution building. The government needs to provide extension support to raise awareness about the benefits of sustainable rangeland management and to transfer rangeland management skills to farmers (where necessary). Farmers themselves need to invest in improved rangeland management.
101. The policy environment for bush control and re-use needs to be further strengthened to accelerate the implementation of bush control/industry plan and sustainable rangeland management. Its main focus should remain on debushing and beneficial use of by-products with employment creation as an important secondary goal. An industry strategy based on bush control would include the following components:
establishment of area-specific bush control and management plans for different re-gions
facilitation of bush control and re-use in CBLNRM areas monitoring and evaluation of the effectiveness and efficiency of bush control and by
product utilization by the Directorate of Forestry, whose results should be entered into the data and experience base
establishment of collection, storage and marketing infrastructure for by products through private-public sector partnerships, where government may take part in infra-structure development (when necessary) and operations are run by the private sector
mandatory incorporation of bush-for-energy options in terms of reference for envi-ronmental impact assessments of projects
102. Certain new technologies show promise and could generate demand for bush, which in turn would provide farmers with a greater financial incentive to invest in de-bushing. These include gasification, industrial use of bush as a substitute for coal, and fodder from in-vader bushes. Developing these technologies will more technical and market analysis.
103. There are several environmental concerns that need to be integrated into planning for the livestock sector and rangelands:
32 This is based on the assuming a world coal price of US$90/ton,

30
The impacts of climate change on the livestock sector and rangelands based on chang-ing comparative advantages of livestock and vegetation: The current switch towards cattle farming in the south should be discouraged as it is unsustainable. Game farming and use of resilient indigenous breeds may be better adaptations.
Competition for and efficient use of water resources: As competition for water re-sources will increase in future, the livestock sector needs to uses water as efficiently as possible. De-bushing will increase groundwater recharge and it is recommended that if range conditions permit, more water points be established in communal areas to distribute grazing pressure more evenly.
Pesticides (e.g., for tick control and dipping) and arboricides needs to be properly ap-plied and their use closely monitored. Chemical spraying for bush control is likely to have adverse impacts on vegetation and needs to be minimized. Where used, it needs to be closely monitored.
14. Value-chains structure, marketing and trade
104. The government and industry’s strategic vision of enhancing value addition and growth in the livestock sector needs to be discussed, formulated and implemented based upon an agreed framework, one which clearly outlines strategic goals, establishing a baseline which is supported by a M&E system. It is preferable that this process be initiated and ma-naged by the private sector, with supportive input from the government as input into the NDP4 process.
105. This strategy should ensure that policies and institutional mandates clearly distinguish between public and private interests, specifically as they relate to the Meat Board and Meat-co. It is appropriate to fund the Meat Board’s services to producers, marketing, and industry promotion activities through fees and levies collected by the board. In contrast, activities such as constructing fences at international borders or responding to disease emergencies fall more inside the domain of the government. Such activities should arguably be undertaken by the state and financed through taxes. Similarly, to the extent that operating loss-making abattoirs is essentially a public service rather than a commercial decision in Meatco’s long-term inter-est, it would be more appropriate to use alternative means to support farmers in commercial areas that impose fewer negative spillovers.
106. Policies to promote value addition should focus on optimizing returns along the en-tire value chain through the better utilization of all products produced by the livestock sec-tor. Value addition is not just exclusively though the slaughtering and cutting of meat products. Supportive analysis needs to be undertake to ensure that all policy initiatives are be reviewed in terms of their impact, agreeing upon and monitoring key indicators such as im-proved prices for producers, profitability/job creation/higher throughput in local abat-toirs/processing units, increased exports, stable prices for consumers. All policies should ensure/aim for equitable and positive impact on the majority of stakeholders in the sector.
107. In this light, it would be useful to undertake review of the full scope of taxes, levies, public expenditures, and parastatal activities to assess government interventions in the lives-tock sector and to evaluate effectiveness of these measures as well as options for increasing the provision of services through different and innovative business models. This should in-clude a review of industry support through levies generated through the various statutory bo-dies.

31
108. Meatco’s ambiguous ownership structure needs to be resolved promptly. As MAWF and the private sector respond to the July 2011 Cabinet directive, it should be recognized that the success of cooperatives involves strategic decision-making by an elected board of direc-tors and professional management. A review of successful cooperatives points to three key factors which ensure success, profitability, and sustainability: (i) an oversight board elected by producer members; (ii) professional management and skilled personnel; and, (iii) li-mited/minimal involvement by government. It is clear that changing the structure of the com-pany would entail considerable time and resources, and the reasons and objectives for the restructuring needs to be presented to stakeholders. Meanwhile, an audit of the financing of Meatco should be immediately undertaken to better understand the nature of its pricing sys-tem and the implications of magnitude of losses, both due to exchange rates and losses in the NCA. These losses influence the prices received by producers and longer term investment in the sector and this information should be used in a comprehensive cost-benefit analysis of the implications of restructuring the company.
109. A key priority of the sector should be aimed at stable/balanced policies that are gener-ated through effective and extensive consultation and communicated through a transparent and official process with an express goal indicated, i.e., economical growth or value addition or employment creation, or whatsoever, etc. An accessible platform for accessing all circulars and other government documents related to policies should be established.
110. The future of productive land is uncertain in the context of current land redistribution efforts. To better understand the implications of these policies on prospects for the livestock sector, data availability needs to be reviewed as to determine how many commercial farmers have been transferred through resettlement policies. In addition, case studies should be under-taken to review how resettlement has affected land productivity and cattle numbers.
111. Government investment in the sector should favor interventions which are directly supportive of smallholders and not be linked to the development of large enterprises. Direct government investment in production enterprises should be avoided unless there is a clearly identified public-private partnership where government’s role is to promote a public good and leverage additional investments in the sector, particularly related to services. Initiatives which support PPPs with local producers/stakeholders, such as focusing on training of traders to promote milk quality and safety, fostering the early adoption of feed technologies, or provid-ing incentives to private veterinarians, would likely support a broader based approach to sec-tor development through the indirect generation of jobs in rural areas.
15. Private sector development in the NCA and strengthening services deli-very systems
112. As previously described in this note, there is potential for the emergence of a com-mercial small-scale livestock production sector in the communal areas. However, few initia-tives are currently on-going, and these opportunities are prevented by many factors described previously, including land issues, the lack of education, awareness and knowledge from many communal producers, the weakness of the advisory and extension services delivery system and the high costs of start-up investments.
113. If these obstacles are to be overcome, the GRN could play the role of facilitator and originator by promoting private investment in the communal areas and by supporting individ-ual initiatives and entrepreneurship. This should be the subject of a national strategy and ac-tion plan to strengthen economic growth and support employment through the development

32
of the livestock sector and livestock-related activities, including diversification towards short-cycle species and production systems (dairy, pigs and poultry) such as feed production, inputs sales, processing and marketing facilities, etc. in the communal areas. Possible axes of inter-ventions could be:
Better enforcement of existing policies related to communal lands management and the fencing ban. For the purpose of productive livestock-related activity, fencing should be authorized only when it complies with an integrated regional land use plan, has been subject to a social and environment impact assessment, is supported by the local population, and the farmer (or farmers’ association) has a sound livestock and rangeland management plan.
To improve the network of basic infrastructure related to water access, animals treat-ments, marketing, etc.
To increase the availability of technical, administrative, business, and farm manage-ment advisory services
To support the establishment and strengthening of producers organizations and build capacity among them to increase producers’ bargaining power, representativeness and markets access.
114. Regarding the advisory and extension services delivery system, small-scale and iso-lated initiatives will never be sufficient to have an impact on the overall development of the livestock sector, specifically in the communal areas. A full redesigning of the system should be undertaken which includes a reform of the Directorate of Extension and Engineering Ser-vice of the MAWF. Staff levels should be rationalized, which some broader specialized in animal production, including animal feeding, genetic, habitat, improved husbandry practices, livestock micro-economic, farm and rangelands management. To complement public initia-tives, the development of a private services providers’ network could be facilitated. The latter is often conditioned to the existence of dynamic producers’ organizations, as smallholders producers can rarely pay individually to access it.
115. With both NAU and NNFU established in Namibia, commercial and communal far-mers are represented by organizations that should be able to support them in the areas of in-puts supply, marketing and training activities. The GRN should work with the NNFU to expand their role in the NCA.33 Subsidies to the Unions might be useful for very specific and well-targeted activities linked to support for services in the NCA, but such a support should more take the form of technical assistance and capacity building to structure the communal producers at the grass-root level, train them through training of trainers mechanisms and or-ganize communication and public awareness campaigns to promote the advantages of getting together and structured in well-recognized Producers’ Organizations. The roles and mandates of such Unions and Associations should also be better defined, depending of the level: na-tional, regional and local. Mechanisms and activities allowing them to ensure self-sustainability should also be developed and implemented, with GRN and donors support if needed at the beginning but with clear exit strategies.
116. Related to animal health issues, investments aiming at reinforcing the VS and its go-vernance in the NCA should be promoted. Since Independence, the GRN has been committed to removing the veterinary cordon fence (VCF) that separates the NCA from the commercial areas of the South. Implementing this policy should be supported by studies undertaken to 33 NNFU is only indirectly involved in NCA through their marketing committees, but not as directly as they are involved with farmers associations in southern communal areas.

33
assess the risks in different scenarios. An incremental path toward the progressive removal of the VCF is seen as a possible solution but would probably be strengthened by the analysis, planning and implementation of an international effort aiming at establishing a buffer zone in Angola. Such an initiative should be undertaken in close collaboration with international technical institutions (OIE and FAO) and research institutes to assess and monitor risks and impacts. Meanwhile, current initiatives to strengthen disease controls in the NCA and minim-ize the differences in capacity and governance between communal and commercial areas should continue.
117. If infrastructure such as abattoirs, quarantine stations or veterinary offices construc-tion or rehabilitation is needed, more emphasis should be placed on strengthening capacities through training and equipment, but also through increasing the coverage of the NCA by ve-terinary professionals, both veterinarians and veterinary para-professionals. This aspect of human resources is compulsory if one wants to improve early detection and rapid control ca-pabilities in case of animal disease outbreak occurrence. Fulfilling vacant positions in the public VS is crucial but will not be sufficient. Creating new ones seems essential too. A pro-posal to restructure the Directorate of Veterinary Services has been developed by the MAWF following the internal review of its organization and the OIE PVS evaluation, and submitted to the Public Services Commission. This proposal is very ambitious and aims at increasing the number of staff from about 700 today to 1800, meaning a 250 percent increase. However, it is recommended to diversify the qualifications for senior positions and bring other skills such as managerial, monitoring and evaluation and planning skills in the DVS. In addition to this, new needs for infrastructures have been identified in the proposal. If the restructuring is accepted by the Public Services Commission, a bigger issue will be to find the budget for such an important reform. To fulfill all the requests, it is estimated that the annual budget of the DVS should be increased by about 300 percent – which seems rather challenging, but is supported by technical experts from the OIE.
118. Another solution, more cost-effective in the long-term, would be to promote the estab-lishment of private veterinarians in these areas through different mechanisms (taxes exemp-tions, start-up kits, government support through PPPs, such as the sanitary mandate. This option should include a stronger partnership between public veterinary authorities and private veterinarians. An accreditation program and the implementation of the “sanitary mandate” should be considered by the Namibian government and consultations between both parts (public veterinary services, Namibia Veterinary Council and Namibia Veterinary Associa-tion) should be launched to define modalities of such a program. This mechanism, while en-suring a better veterinary coverage of the country thus improving the early detection and rapid response system, would also ensure a minimum income for private veterinarians who wish to get established in communal areas where business starts from zero. It would be an excellent incentive to promote the development of the private veterinary sector in the NCA notably.
119. Finally, the review and amendments of the outdated animal health and veterinary leg-islation is currently on-going. The consultative process should be broadened and involve in-ternational expertise to ensure that the new legislative framework fully complies with international standards. It is recommended to the VS to consult the OIE in such a process as the organization is currently implementing a program within the PVS Pathway aiming at sup-porting countries in updating their animal health legislation while using OIE guidelines on veterinary legislation.

34
120. In conclusion, and recognizing that the problems faced by small-scale producers in the NCA, where much of the potential for growth lies, and other communal lands are specific and different from those faced by large commercial producers, the priorities should be to promote and support the emergence of a small-scale commercial sector by: (i) strengthening extension and advisory services delivery system, through an increase and a specialization of staff, (ii) strengthening the Veterinary Services according to the recommendations made in the OIE-PVS pathway, including increasing the coverage of the NCA by Animal Health pro-fessionals and promoting public-private partnerships with private veterinarians to support their establishment in rural areas. This will contribute in improving the early detection and rapid response system of TADs such as FMD, first required step for a progressive removal of the VCF; and (iii) improving livestock-specific and other infrastructure network. Comple-mentary measures could be to reinforce producers’ organizations and introduce financial in-centives for individual or groups/cooperatives investments.

35
VIII. References:
Agra (Co-operative) Ltd. 2010. Annual Report 2009.
Collin Christian & Associates. 2010a. Energy for Future: bush to fuel project. EIA report. Windhoek.
Collin Christian & Associates. 2010b. Energy for Future: bush to fuel project. Environmental Man-agement Plan.
De Klerk, N. 2004. Bush Encroachment in Namibia. Ministry of Environment and Tourism
Diekckmann, U. and T .Muduva, 2010. Namibia’s black gold: charcoal production, practices and im-plications. Legal Assistance Centre.
Honsbein, D., D.Joubert, and CAR. 2009. Incentive scheme for invader bush management: a cost-benefit analysis.
Humavindu, M., J. Barnes, C. Nott, N. de Klerk, and B. Kruger. 2011. Economic valuation of good rangeland management and incentives for efficient implementation for the National Rangeland Strategy. Country Pilot Partnership (CPP) Programme Namibia. Supported by the Global Envi-ronment Facility through the United Nations Development Programme (UNDP).
IDC, 2003. An EIA on bush control methods proposed under the bush encroachment research moni-toring & management project. Prepared for NAPCOD, DEA-MET.
Lange, G.M. 2006. Water accounts and water policy in Namibia.
Lange, G.M. and R. Hassan (eds.). 2006. The economics of water management in southern Africa. Edward Elgar Publishers, UK & USA.
Meatco. 2011. Annual Report 2010/11.
Mendelsohn, J., and S. el Obeid. 2005. Forests and Woodlands of Namibia. Raison, Windhoek.
Millennium Challenge Corporation. 2008. Millennium Challenge Account; Namibia Compact: Vo-lume 3: Thematic Analysis Report—Livestock, Namibia Strategic Environmental Assessment.
Ministry of Agriculture Water and Forestry, Directorate of Planning. 2011. Agricultural Statistics Bul-letin, 2000–2009.
Ministry of Agriculture Water and Forestry, Directorate of Veterinary Services. 2009. Annual Report 2009.
———. 2010. List of Namibian Establishments approved to export 2010/2011, Policy for the eradica-tion of Transboundary Animal Diseases in the NCA.
Namibia Agricultural Union. 2010a. The effect of Bush encroachment on groundwater resources in Namibia: a desktop study.
———. 2010b. Training Manual on Livestock Marketing in Namibia.
Namibia Meat Board. 2011. Namibia Livestock Sector Strategy: Final Report.
Namibia National Farmers Union. 2008. Training Manual on Livestock Marketing in Namibia.

36
National Planning Commission. 2011. Targeted Intervention Program for Employment and Economic Growth
OIE. 2008. Tool for the Evaluation of the Performance of the Veterinary Services – Namibia Report.
Meyn, Mareike. 2007. Analysis of the Economic and Social Effects of Namibia’s Potential Loss of Current Preference to the European Union. Overseas Development Institute
Schutz, Willem. 2009. A Critical Analysis of the Namibian Vlaue Addition Policy With Reference o the Small Stock Marketing Scheme. unpublished master’s thesis
Turpie, J. et al. 2010. Climate change vulnerability and adaptation assessment for Namibia’s biodiver-sity and protected area system. Ministry of Environment and Tourism, Windhoek.
UNAM, 2008. Research on farming systems change to enable adaptation to climate change.
Van den Bosch, S. 2011. Climate change in Namibia: impact, decisions, opportunities. Democracy project.

Cattle Numbers held by Commercial and Communal
Farmers in the South and NCA
2.4 million head
Marketing estimated at
352,613 head
Short Term Feeding of Weaners
Export Abattoirs in the FMD-free zone
Municipal Abattoirs, Local Butchers
Live animal exports to South Africa
Municipal Abattoirs, Export Abattoirs, Local Butchers (in NCA)
15,489 head, 4% 127,141 head, 36 %
193,310 head, 55%
Local do-mestic mar-kets
Exports: EU/South Africa
12,556 head, 4 %
Average Cattle/Beef Prices in 2010:
N$ 18.5/kg carcass (down from N$ 21. 8 in Janu-ary), source: Meat Board
Auction price N$11.5 (source: Agra) Price per ton for export cuts to the EU: $43.37/kg
(US$6.3/kg or US$6,285/ton (source: Meat Board) Namibian weaner price, January 2011, N$ 18/kg
live weight (up from approximately N$14/kg in early 2010). (source: Meat Board)
Okapuka Feedlot
(MeatCo)
17,706 head
1/ 2010 figures from Namibian Meat Board estimates
IX. Appendix: Livestock-Beef supply chain in Namibia