living arrangements of older adults in the developing
TRANSCRIPT

Living Arrangements of Older Adults in the Developing World: An Analysis of
DHS Household Surveys
John Bongaarts Zachary Zimmer
John Bongaarts is Vice President and Zachary Zimmer is Research Associate, PolicyResearch Division, Population Council.
Abstract
Using data from Demographic and Health Surveys, this study examines living arrangements of older adults in 43 developing countries and compares patterns by gender, world regions, and macro-level measures of socioeconomic development. Indicators include household size, headship, relationship to head, and coresidence with spouse, children, and others. Unweighted regional averages and OLS regressions determine whether variations exist. Average household sizes are large, but a substantially higher proportion of elderly adults live alone than do individuals in other age groups. Females are more likely than males to live alone and are less likely to live with a spouse or to head a household. Heading a household and living in a large household and with young children are more prevalent in Africa than elsewhere. Coresidence with adult children is most common in Asia and least common in Africa. Coresidence is more frequently with sons than with daughters in both Asia and Africa, but not in Latin America. Variations in living arrangements within regions are explained in part by associations between national levels of education and household structure. As a country’s level of schooling rises, most living arrangement indicators change, with families becoming more nuclear. Urbanization and GNP have no significant effects on living arrangements. The associations with education may be attributable to a variety of intermediating factors, such as migration of children and preferences for privacy.
G e n e r a ! L ib r a r y S y s t e m U n iv e r s i ty o f W i s c o n s i n - M a d i s o n 7 2 8 S t a t e S t r e e t M a d i s o n , W l 5 3 7 0 6 - 1 4 9 4 U .S .A .
This material may not be reproduced without written permission from the authors.

Western industrialized countries have developed social security, pension, and
public health systems to support older adults and supplement their personal and family
resources. In contrast, in many developing countries little or no such government-funded
institutional support is available. Older adults in developing countries of Africa, Asia,
and Latin America often require social, economic, and physical assistance, but many are
ill equipped to provide for themselves because of poor health and a lack of private sav
ings. As a result, they tend to rely heavily on members of their household and family for
their well-being and survival. Households throughout the developing world represent
the main institution responsible for the distribution of goods and services between gen
erations, and they are the principal venue through which age and kinship roles are ex
pressed (Thornton, Chang, and Sun 1984; Becker 1991; Kuznets 1978). Many cultures
have imbedded within them norms about respect for older adults and the responsibility
of the young to care for the old when the need arises (Martin 1990; Nydegger 1983).
Some countries, such as China, have even written such norms into their laws and consti
tution (Wu 1994). Policymakers value these familial systems of care for the elderly and
prefer to maintain them rather than introducing other, potentially expensive, govern
ment programs (Knodel, Chayovan, and Siriboon 1992). As a result, it is primarily mem
bers of one’s household who provide familial support for older adults.
Issues concerning household structure and support for older adults in developing
countries are becoming increasingly important as population aging begins to influence
many of these societies. The mortality and fertility declines that move populations through
their demographic transitions inevitably result in increases over time in the proportion
of a population who are old (Coale 1964; Grigsby 1991). Population aging is already
advanced in Western industrialized countries, where the proportion aged 65 and older is
now 14 percent, and this proportion is projected to double by 2050 (United Nations
1999). In much of the developing world population aging is less pronounced because
the transition to low levels of fertility and mortality is still underway. In a number of
developing countries, particularly in East and Southeast Asia, fertility declines began
relatively early and proceeded rapidly. As a result, increases in the older segment of
these populations are now occurring at rates that exceed those experienced in most of
the developed world. If future fertility and mortality declines proceed as now projected

by the United Nations (1999), population aging will become a universal phenomenon in
all developing countries and all world regions in the next few decades. While policy
options for responding to population aging through the reform of social security, pension,
and health care systems have received increasing attention in the developed world, much
less attention has been given to these issues elsewhere (OECD 1998; World Bank 1994).
Population aging in many developing countries is occurring at a time when such
countries are also experiencing rapid socioeconomic and demographic changes. Econo
mies are growing as industry replaces agriculture, literacy levels rise, urbanization pro
ceeds rapidly, women bear fewer children, and people live longer and healthier lives.
The effects of these trends on families, households, kin networks, and subsequent sup
port for older adults are complex and not well documented. A generally held view among
family sociologists is that the size and complexity of households and residential fami
lies decrease as a society industrializes and urbanizes (Goode 1963; Burch 1967; United
Nations 1973; McDonald 1992). In largely rural traditional societies, residential fami
lies are more often extended, either horizontally or vertically, than in modem industrial
ized societies where the independent nuclear family predominates. McDonald (1992)
refers to this generalization as the convergence theory of family structure and considers
William Goode its originator. Goode (1963) predicted the convergence of family sys
tems around the world to the conjugal type: “Wherever the economic system expands
through industrialization, family patterns change. Extended kinship ties weaken, lin
eage patterns dissolve, and a trend toward some form of the conjugal system generally
begins to appear— that is, the nuclear family becomes a more independent kinship unit”
(p. 6). According to Goode one of the implications of this transition is a “weakening of
ties with the older generation” (p. 15), but he provides few details. Presumably, this
weakening of ties refers to a reduction in social interaction and financial and physical
support for the older generation, as well as to greater prevalence of separate living ar
rangements as countries develop. Little research has been undertaken to confirm this
hypothesis, in part because the data needed to analyze these issues are difficult to collect.
Our study examines the living arrangement dimension of Goode’s convergence
theory. The size and composition of households clearly vary over time and among soci
eties, and this variation has implications for the well-being of older adults. Studies of
4

living arrangements of older adults can therefore make an important contribution to
understanding the determinants of the survival and functioning of older populations and
have been the starting point for many studies of aging in developing countries (Martin
and Kinsella 1994). Ideally, extended time-series data on living arrangements and a compre
hensive set of development indicators should be used for such an analysis. Unfortunately
these data are not readily available. Hence, the current analysis relies on contemporary
data for a large number of developing countries in order to investigate how living ar
rangements vary among countries at different levels of development and across broad world
regions, and to identify the factors associated with differences in living arrangements.
BACKGROUND
Previous studies of living arrangements of older adults in developing countries
have generally focused on one or at most a few countries. Analysts have given particular
attention to East and Southeast Asia, where reductions in family size make the availabil
ity of supporting family members a matter of concern and where the availability of
necessary data has been greatest (Ahn et al. 1997; Asis et al. 1995; Cameron 2000;
Casterline et al. 1991; Chan 1997; Chen 1996; DaVanzo and Chan 1994; Domingo and
Casterline 1992; Kim and Rhee 1997; Knodel and Chayovan 1997; Martin 1989;
Natividad and Cruz 1997). Some studies have also been conducted in Latin America
(De Vos 1998, 1990; Palloni, De Vos, and Palaez 1999) but few focus on Africa. A
typical investigation describes household size and composition, coresidence with chil
dren, and other living arrangement indicators and analyzes their socioeconomic corre
lates. The most consistent findings from this research are that older adults rarely live
alone and usually reside with a spouse and/or adult child. Older males are more likely
than older females to live with a spouse. Coresidence of older adults with one of their
adult children is most common in the least developed societies because levels of parent-
child coresidence are inversely related to socioeconomic development (Asis et al. 1995).
Parents and children both benefit from living together. Older adults receive the social,
financial, and health support they require from the younger generation. Reciprocal ex
changes take place when older adults assist with caretaking of younger children or look
after the home when other adults are away.
5

The gender of a coresiding child has implications for the nature and level of
support provided to older adults (Ahn et al. 1997; Ofstedal, Knodel, and Chayovan 1999).
Social structures and related gender preferences differ systematically among countries.
For example, Mason (1992) identified two dominant patterns in Asia. One is the patri
lineal system, where males dominate ownership of resources, while women, when they
marry, take the identification of the husband’s family. In these types of societies (for
example, in China and most of India) adults tend to live with a married son and most
likely receive care, when needed, from a daughter-in-law. The other Asian system, found
in countries such as Thailand and Cambodia, is bilateral. In these cases, women and men
are considered to be equal members of their natal families, and there is little if any
preference with respect to the gender of the coresident child. Since patriarchal or bilat
eral structures primarily affect where children live after marriage, stronger preferences
can be most easily noticed among married children.
Although a few analysts have examined the household structure of older adults
across countries within regions (Hashimoto 1991; Martin 1989; Ofstedal, Knodel, and
Chayovan 1999), studies of living arrangements from a broader geographic perspective
across many developing countries and several world regions are lacking. Such studies
are desirable because they can determine whether particular types of household struc
tures and living arrangement patterns among older adults are consistent across regions.
In addition, relatively little is known about the association between living arrangements
and different macro-level factors (for example, levels of income, urbanization, and edu
cation). Using data from a large number of countries would allow the introduction of
country-level measures to analyze these issues in more detail.
A clear deterrent to such studies has been the difficulty in obtaining comparable
data that cover a wide range of countries in the developing world. To add a global dimension to research on living arrangements, the current study employs data from De
mographic and Health Surveys (DHS) conducted in a large number of countries in Af
rica, Asia, and Latin America. The main objective of these surveys is to collect data on
matters related to reproductive behavior and child health, but information gathered in
the household questionnaire also allows the analysis of the structure of a random sample
of households in each country. Although this information is limited in scope, the DHS
6

provides a valuable and underused source of information on household structures in the
developing world.
D a t a a n d M e t h o d s
This study relies on data from household surveys conducted in the following 43
countries that have participated in the DHS program between 1990 and 1998:
Africa: Benin, Burkina Faso, Cameroon, Central African Republic, Comoros, Cote
d’Ivoire, Egypt, Ghana, Kenya*, Madagascar, Malawi, Mali*, Morocco, Mozambique,
Namibia, Niger*, Nigeria, Rwanda*, Tanzania, Togo, Uganda, Zambia, Zimbabwe.
Asia: Bangladesh, India*, Indonesia, Kazakhstan, Kirgizstan, Nepal, Pakistan*,
Philippines, Turkey, Uzbekistan*, Yemen*.
Latin America: Bolivia, Brazil*, Colombia*, Dominican Republic, Guatemala*,
Haiti, Nicaragua, Paraguay*, Peru.
In countries where multiple surveys were implemented between 1990 and 1998,
we employ only the latest available survey. In general, the surveys were nationally rep
resentative, but in 12 countries certain parts of the countries were excluded for various
practical considerations. In these cases, indicated with an asterisk above, coverage ranged
from 90 to 99 percent. (For details see Ayad, Barrere, and Otto 1997.)
The main objective of DHS household surveys is to identify women aged 15-49 who
are eligible for a subsequent detailed interview on their reproductive and health behavior.
For each household member the household questionnaire records age, sex, relationship to
head, education level, and residential status; and, for children, it records the presence and
survival status of their parents. In a small number of surveys marital status of members is
also noted. In addition, characteristics of the household (for example, source of drinking
water, availability of electricity, type of toilet facilities, household possessions) are recorded.
The size of the household sample varies among countries, with the majority between 3,000
and 10,000. These data, available in standardized computer data files, are a unique source for
comparative analysis of demographic characteristics of households and their members in the
developing world (Ayad, Barrere, and Otto 1997).
To examine some aspects of the living arrangements of older adults, it is neces
sary to reconstruct relationships among household members using the older adult, rather
7

than the household head, as the index person. In particular, the presence of spouses and
adult children of older adults are key variables in our subsequent analysis. Determining
these aspects of living arrangements is straightforward for the large majority of older
adults because they are the head, the spouse of the head, or the parent or parent-in-law of
the head (on average 97 percent of males and 92 percent of females fall into one of these
categories). Identifying the precise relationship between an older adult and all other
individuals in the household is not possible with the information collected in the DHS.
The data from DHS household surveys have other limitations for any analysis of
the living situation of older adults. For example, the number of living children of older
adults is not known because information on children living outside the household is not
collected. If there are non-coresident children, their proximity to the older adult is also
unknown. Furthermore, the absence of information on the age and birth order of all
living children prevents an analysis of the preference of older adults for living with
younger or older children. In most surveys the marital status of children in the house
hold is not recorded, but it is possible to determine indirectly whether older adults are
living with married sons or daughters on the basis of information about the presence of
sons-in-law and daughters-in-law in the household and the presence of the spouse of the
household head. Information is also lacking on exchanges between older adults and
their children, both within the household and with kin and others living elsewhere.
Although these data limitations restrict the scope of analysis, the DHS makes up
in breadth of coverage across geographic regions what it lacks in detail. We examine
several indicators of living arrangements of older adults, including size of household,
percent living alone, headship, relationship to head, and coresidence with kin and oth
ers. We also present measures of the prevalence of coresidence with a spouse, with adult
children, or with other adults. The last implies living in a “complex” household struc
ture that extends beyond a nuclear family consisting of spouse and children. Since co
residence with adult children is an important component of the support system of older
adults in the developing world, we examine this living arrangement and the gender of
the coresident adult child.
In our analysis of the household structures of older adults, the country is the unit
of analysis, and results are summarized as country averages for various living arrange
8

ment indicators, usually separately for elderly males and females and for different re
gions. For our purposes, the mean is considered an appropriate summary measure be
cause for nearly all indicators the skew of the distribution of country estimates was
negligible or very small. It is important to note that regional averages (that is, averages
across countries within each region) are unweighted. For instance, to determine the av
erage household size for elderly males in Africa, their average household sizes are summed
for the 23 African countries and this sum is divided by 23. In these calculations of the
regional mean, each country is given the same weight regardless of population size.
The central part of our analysis examines the role of socioeconomic factors in
explaining variation in living arrangement indicators among countries and regions. Spe
cifically, regression analyses determine whether country averages for these indicators
are associated with levels of education, life expectancy, GNP per capita, and percent
urban, while controlling for the effects of region and gender. Data for these variables are
obtained from the DHS itself (in the case of urban/rural residence and level of school
ing) or from other sources (United Nations 1999; World Bank 1996).
S i z e , H e a d s h i p , a n d c o m p o s i t i o n o f t h e H o u s e h o l d s
o f O l d e r A d u l t s
S ize
The literature on household and family structure relies on two distinct approaches
to determining the average number of people living together: 1) the average size of
households, which is simply the average number of individuals per household in a popu
lation; and 2) the average “experienced household size,” which equals the number of
household members found in the household of an average individual (Burch 1979; King
and Preston 1990). The unit of analysis in the calculation of the former is the household, and in the latter it is the individual. These two measures differ consistently, as can be
demonstrated with a simple hypothetical example. Assume that half of all households in
a population have one member and the remaining half have nine members. In that case
the size of the average household is five. However, if each individual is asked the size of
his or her household, then 90 percent of the population will report a size of nine and the
remaining 10 percent will report living alone. The average household size experienced
9

by individuals therefore equals 8.2 members: (0.9 x 9) + (0.1 x 1). In general, whenever
households vary in size, average household size is larger when the individual rather than
the household is the unit of analysis. The reason for this finding is obviously that larger
households contain more individuals than do smaller households.
Table 1 presents (unweighted) average household sizes for our three developing
regions (regional standard deviations noted in parentheses), as measured from these two
perspectives (the household and the individual). The differences are in the expected
direction in every region. For example, the average household size for all countries is
5.2 members, but the country average for experienced household size is 6.9 members.
Similar differences are observed in all regions and individual countries (data for the latter not
shown). In our subsequent analyses we rely exclusively on household characteristics as mea
sured from the perspective of the individual, or “experienced household size.”Since the present discussion focuses on older adults, it is of interest to compare
the size of households in which older persons reside (defined here as those aged 65 and
older) with the household size experienced by all individuals. Across all countries, the
average household size for older adults is 5.5 members. The regional estimates are quite
similar for Asia (5.5) and Africa (5.8), but are somewhat lower for Latin America (4.5).
(The last column shows P-values representing the significance level of F-ratios deter-
Table 1 Average household size and percent living alone by region and gender
Africa AsiaLatin
America Total P-valueAverage household size 5.3 (0.7) 5.2 (0.9) 4.8 (0.5) 5.2 (0.8) 0.187
Experienced household size All individuals All 65 +Males 65 +Females 65 +
7.4 (1.3)5.8 (1.4)5.9 (1.3) 5.8 (1.6)
6.5 (1.2)5.5 (1.4)5.6 (1.3) 5.4 (1.4)
6.0 (0.6)4.5 (0.6)4.6 (0.6) 4.4 (0.7)
6.9 (1.3)5.5 (1.4)5.6 (1.3) 5.4 (1.5)
0.0090.0340.0260.067
Percent who live aloneAll individuals All 65 +Males 65 +Females 65 +
2.0 (1.4) 9.7 (5.4) 7.3 (4.4)
12.3(7.0)
1.0 (0.8) 7.3 (5.4) 3.6 (2.0)
10.2 (6.9)
1.4 (0.5)8.4 (3.0)7.8 (2.4)8.9 (3.8)
1.6 (1.6) 8.8 (5.0) 6.5 (3.9)
11.1 (6.5)
0.0680.4160.0150.364
Unweighted averages for 43 countries. Standard deviations in parentheses.
10

mined from an analysis of variance procedure. The regional differences for household
size are statistically significant.)
All of these estimates are significantly lower than corresponding averages for all
individuals, with the differences ranging from 1.0 in Asia to 1.6 in Africa. This indicates
that while older adults typically live in households that are smaller than average, they
nevertheless live with several other household members. Subtracting 1 from the esti
mates gives the number of other members. The average elderly adult across the 43 coun
tries therefore lives in a household with 4.5 other members. The last two rows of the
middle panel of Table 1 compare the household sizes experienced by older males and
females. Males live in slightly larger households than do females, in part because of a
greater likelihood that older females are widowed and living without a spouse, although
further tests revealed that these differences are not statistically significant.
Although the presence of others in the household is often desirable for older
adults, and household sizes are generally large in the developing world, some older
adults, nevertheless, live alone. The third panel in Table 1 presents statistics on these
circumstances. Only a very small percentage of individuals of all ages live alone— on
average 1.6 percent across all countries. However, this percentage is substantially higher
for older persons (8.8). The average proportion living alone across all countries is nearly
twice as high for women (11.1 percent) as for men (6.5 percent). Living alone is uncom
mon among older men in Asia (3.6 percent), probably because patriarchy is a stronger
institution in this region than elsewhere. Differences are less noticeable across regions
for women living alone. Many older adults who live alone have kin living nearby with
whom support is exchanged; the extent of this presence is likely to differ by region and
gender, but we cannot examine this issue with the limited data available in the DHS.
One other regional difference worth noting is in the country variation of the indi
cators assessed in Table 1. For instance, the standard deviation for household size among
all adults 65 and older is more than twice as great across African and Asian countries
than it is across countries in Latin America. This lack of variation in Latin America
relative to other regions is evident for most indicators in Table 1, except for the percent
of older men living alone, where the smallest variation exists across Asia. The standard
deviations are generally highest for African countries. This finding suggests that the
greatest diversity in living arrangement patterns exists within Africa, and the least diver
11

sity exists within Latin America. Similar results will be found in a number of the other
tables presented below.
Relationship to head
Table 2 indicates the percent distribution, by region, of elderly males and females
according to their relationship to the head of the household. Relationships among house
hold members can be varied and complex, especially in large households. The DHS lists
numerous categories of relationship to the head for every household member: head,
spouse, parent or parent-in-law, son/daughter, sons-/daughters-in-law, grandchild, brother/
sister, co-wife, adopted/fostered, other relative of the head (cousin, nephew/niece, uncle/
aunt), and nonrelative (for example, domestic servant). The large majority of males—
more than four out of five in every region— are heads of their households. This is not an
unexpected finding, given established social customs throughout the developing world.
Still, African males are more likely to be household heads than are those in Asia and
Latin America. Most men who are not the head are the parent of the head. This is par
ticularly the case in Asian countries, where 10.9 percent of older males are the parent of
Table 2 Average percent of males and females aged 65 and older according to their relationship to head of household, by region
Africa Asia Latin America Total P-valueMales 65+Head 89.0 (7.5) 83.1 (5.3) 83.9 (6.1) 86.4 (7.2) 0.033Spouse 2.1 (2.6) 1.8 (2.7) 3.2 (3.6) 2.3 (2.8) 0.500Parent 4.4 (2.7) 10.9 (5.7) 5.5 (2.6) 6.3 (4.5) 0 .0 0 0Parent-in-law 0.7 (1.6) 1.7 (1.9) 2.2 (1.5) 1.3 (1.8) 0.081Sibling 1.0 (0.7) 0.7 (0.6) 1.1 (0.4) 0.9 (0.6) 0.405Other relative 1.8 (2.6) 1.3 (0.8) 2.3 (0.8) 1.8 (2.0) 0.519Not related 0.7 (0.6) 0.2 (0.2) 1.3 (0.7) 0.7 (0.6) 0 .0 0 0Females 65+Head 40.2 (14.3) 26.3 (17.3) 39.7 (7.6) 36.5 (15.1) 0.028Spouse 21.7 (6.7) 27.2 (7.7) 29.3 (6.3) 24.7 (7.5) 0.012Parent 23.9 (11.3) 33.0 (16.6) 16.3 (4.4) 24.6 (13.0) 0.012Parent-in-law 4.1 (4.6) 6.6 (5.0) 6.6 (4.2) 5.2 (4.7) 0.215Sibling 2.4 (1.6) 0.9 (0.5) 2.1 (0.6) 1.9 (1.4) 0.012Other relative 6.5 (5.1) 5.1 (3.9) 3.6 (1.2) 5.6 (4.3) 0.218Not related 0.6 (0.5) 0.5 (0.4) 1.8 (0.9) 0.8 (0.7) 0 .0 0 0Unweighted averages for 43 countries. Standard deviations in parentheses.
12

the household head. Otherwise, only very small proportions of elderly males are categorized as spouse, parent-in-law, brother/sister, other relative, or unrelated. The only other
noteworthy difference is that males in Latin America are significantly more likely to be
unrelated to the household head than are males in Africa or Asia, where nonrelatives
living in the same household are particularly rare.
The corresponding estimates for females show considerably more diversity in relationship to head and greater variation across regions. Three categories are relatively common among older females: 1) head—ranging from 26.3 percent in Asia to 40.2 percent in Africa; 2) spouse—ranging from 21.7 percent in Africa to 29.3 percent in Latin America; and 3) parent—ranging from 16.3 percent in Latin America to 33.0 percent in
Asia. These three categories together account for more than 80 percent of older females. Compared with their male counterparts, older females are more likely to be a parent-in- law, brother/sister, or other relative of the head, even though each of these categories accounts for only a small fraction of the total. As was the case for males, females are
more likely to be a household head in Africa, a parent of the head in Asia, and unrelated
to the head in Latin America.
Composition of householdsRegional averages for the percent of elderly males and females living with differ
ent types of kin and others are presented in Table 3. A substantial majority of older males
(76.7 percent) coreside with their spouse. Most also live with at least one of their adult
children (52.5 percent) or with at least one young child (65.4 percent), and the large majority of them live with at least one adult (92.4 percent). The topic of coresidence
with adult children will be discussed in more detail in a later section. A smaller but
substantial proportion of males live with an adult who is not a child or spouse (27.2 percent) or with another elderly adult (29.8 percent).
The proportion of older females living with a spouse is much smaller than in the
case of males (27.8 percent). Women experience a higher risk of death of a spouse because men are usually older than their wives and have higher age-specific mortality
rates than women. Partly as a result, the proportions of women living with adult children
(55.9 percent) and with other adults (40 percent) are generally higher than for men. The
average proportion of females in Africa living with any adult (78.4 percent) is lower
13

Table 3 Average percent of males and females aged 65 and older coresiding withspecific kin, by region
A frica A sia L a tin A m erica T o ta l P -v a lu e
M ales 65+Spouse 78.2 (7.5) 77.8 (5.8) 70.4 (4.6) 76.7 (7.2) 0.013Adult child (18+) 45.9 (10.9) 66.3 (11.6) 52.5 (7.1) 52.5 (13.3) 0.000Any young child (0-17) 70.3 (8.6) 63.5 (15.3) 55.1 (10.1) 65.4 (12.3) 0.004Any adult (18+) 91.1 (5.0) 96.0 (1.9) 91.3 (2.6) 92.4 (4.5) 0.005Other adult (18-64) 31.6 (14.5) 17.5 (6.1) 27.7 (6.9) 27.2 (12.7) 0.008Other elder (65+) 24.1 (5.5) 34.8 (9.7) 38.4 (4.0) 29.8 (9.0) 0.000
Fem ales 65+Spouse 23.8 (6.2) 32.1 (7.4) 32.9 (5.3) 27.8 (7.6) 0.000Adult child (18+) 49.7 (8.8) 68.3 (11.9) 56.7 (7.3) 55.9 (12.1) 0.000Any young child (0-17) 69.8 (9.6) 64.3 (15.0) 55.7 (11.0) 65.5 (12.5) 0.011Any adult (18+) 78.4 (9.7) 88.6 (7.0) 87.0 (4.3) 82.8 (9.4) 0.002Other adult (18-64) 43.7 (14.8) 32.7 (8.8) 39.5 (8.4) 40.0 (13.0) 0.067Other elder (65+) 31.0 (5.4) 34.7 (7.9) 37.0 (3.5) 33.2 (6.2) 0.029Unweighted averages for 43 countries.Standard deviations in parentheses.
than in other regions, while the proportion living with a young child (69.8 percent) is higher. In fact, about one in ten older women in Africa live with children and no adult. The relatively high probability that elderly African males and females live with a young child is mostly attributable to the higher fertility during the past 18 years in this region compared with the other two developing regions.
Variations across regions for these coresident situations are quite significant and
some of these are worth noting. Both men and women in Asia have the highest likelihood of living with an adult child but the lowest likelihood of living with another adult. Elderly Latin American males are less likely than those in other regions to be living with a spouse or with any young child. Older African males and females are less likely than their counterparts elsewhere to be living with another elderly person.
SO C IO E C O N O M IC D IF F E R E N T IA L S IN L IV IN G
A r r a n g e m e n t s o f t h e E l d e r l y
To this point our focus has been on averages of measures of living arrangements of older adults across countries and regions in the developing world. We turn now to
14

differentials between the urban and rural elderly and between those with and without
formal education. Many demographic indicators (for example, fertility, mortality, age at marriage) differ between urban and rural areas and vary with level of education, and it is plausible to assume that living arrangements of older adults also vary among these groups. This assumption is borne out in previous country- and region-specific studies of older adults. For instance, DaVanzo and Chan (1994) found that older men in Malaysia with
higher education are less likely to coreside with children, although less educational varia
tion was found among older women. De Vos (1990) showed extended living arrange
ments to be more common in rural areas of Latin America than in urban areas, while
Natividad and Cruz (1997) found that place of residence distinguished between a vari
ety of living arrangements. These various arrangements have been explained as reflecting preferences and needs of older adults (DaVanzo 1994; Kim and Rhee 1997). Before
exploring this issue further it should be noted that the socioeconomic characteristics of
the elderly differ substantially from those of the general population. Compared with
persons aged 18 to 65, older adults are more likely to live in rural areas and to have had
substantially less schooling. In our sample of countries more than half of older males
and about three-quarters of older females have had no schooling. This finding is not surprising because the elderly surveyed in the 1990s were of school-going ages in the early part of the twentieth century when school enrollment rates were much lower than they are today. In fact, in some of the least developed countries (Burkina Faso, Mali, Niger, and Yemen) the large majority of the elderly have had no schooling; indeed in
Yemen the DHS recorded not a single older woman with schooling. Schooling levels are
systematically higher among older males than females and this difference is found in
every country.
Table 4 shows living arrangements of the elderly according to whether they have had some schooling or none. Although the DHS provides information on the number of years of schooling, only two levels are used here because in a substantial number of countries the fraction of older persons who have been to school is small, especially among females. Living arrangement indicators do not differ widely between urban and
rural areas. For example, the average experienced household size is 5.7 for the urban elderly and 5.5 for rural elderly, and this difference is not statistically significant. Ur-
15
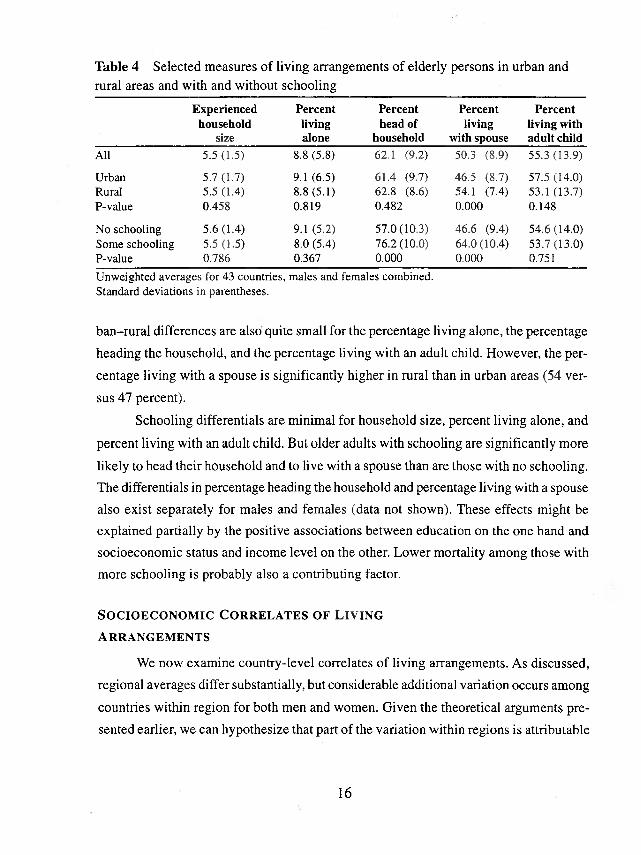
Table 4 Selected measures of living arrangements of elderly persons in urban andrural areas and with and without schooling
Experiencedhousehold
size
Percentlivingalone
Percent head of
household
Percent living
with spouse
Percent living with adult child
All 5.5 (1.5) 8.8 (5.8) 62.1 (9.2) 50.3 (8.9) 55.3 (13.9)
Urban 5.7 (1.7) 9.1 (6.5) 61.4 (9.7) 46.5 (8.7) 57.5 (14.0)Rural 5.5 (1.4) 8.8 (5.1) 62.8 (8.6) 54.1 (7.4) 53.1 (13.7)P-value 0.458 0.819 0.482 0.000 0.148
No schooling 5.6 (1.4) 9.1 (5.2) 57.0(10.3) 46.6 (9.4) 54.6 (14.0)Some schooling 5.5 (1.5) 8.0 (5.4) 76.2(10.0) 64.0(10.4) 53.7(13.0)P-value 0.786 0.367 0.000 0.000 0.751
Unweighted averages for 43 countries, males and females combined.Standard deviations in parentheses.
ban-rural differences are also quite small for the percentage living alone, the percentage
heading the household, and the percentage living with an adult child. However, the per
centage living with a spouse is significantly higher in rural than in urban areas (54 ver
sus 47 percent).
Schooling differentials are minimal for household size, percent living alone, and
percent living with an adult child. But older adults with schooling are significantly more
likely to head their household and to live with a spouse than are those with no schooling. The differentials in percentage heading the household and percentage living with a spouse
also exist separately for males and females (data not shown). These effects might be explained partially by the positive associations between education on the one hand and
socioeconomic status and income level on the other. Lower mortality among those with more schooling is probably also a contributing factor.
S o c i o e c o n o m i c C o r r e l a t e s o f L i v i n g
A r r a n g e m e n t s
We now examine country-level correlates of living arrangements. As discussed, regional averages differ substantially, but considerable additional variation occurs among
countries within region for both men and women. Given the theoretical arguments presented earlier, we can hypothesize that part of the variation within regions is attributable
16

to differences in levels of development between countries. If levels of development are
operationalized according to standard socioeconomic indexes, such as GNP per capita
or the percent with schooling, then we would expect countries scoring higher on these indexes to exhibit weaker extended kinship ties in their living arrangements and to be characterized by smaller household sizes and a higher percentage of older adults living alone. To test this hypothesis, we calculated a set of six regressions, one for each of the
living arrangement measures discussed earlier. Explanatory variables include four coun
try-level socioeconomic indicators—life expectancy, GNP per capita, percent with any
schooling, and percent urban— as well as region and gender. For each country two data points are included, one for males and the other for females; each of the six regressions is therefore based on 86 observations.
The regression results are summarized in Table 5. The table shows that the hypothesized link between socioeconomic development and living arrangements is confirmed through strong and consistent associations between level of schooling (as mea-
Table 5 Percentage regression results for specific living arrangement indicators
Householdsize
Livingalone
Householdhead
Livingwith
spouse
Livingwithadultchild
Livingwithotheradult
Gender (1=F) -0 .162 4.579** ^49.672** -48.863** 3.400 12.833**
RegionAfrica — — — — — —
Asia -0 .294 -2 .702 -11.655** 4.888* 13.713** -12.217**Latin America -0.894* -4.242* -7 .070 1.592 4.659 -3 .728
Socioeconomic variablesLife expectancy 0.055* -0 .196 -0 .223 -0.171 0.968** 0.322GNP per capita
($1000 US units) 0.004 -0.041 -0 .006 0.165 0.052 0.020Percent with any
schooling -0.045** 0.118** 0.324** -0.043 -0.262** -0.317**Percent rural 0.000 -0 .087 0.069 0.026 0.130 -0.121
Constant 5.389 18.209 78.959 82.604 -0 .442 39.657R2 0.733 0.628 0.893 0.926 0.651 0.509F 12.98** 7.27** 93.39** 139.482* 20.808** 11.556**
* .05 > p > .01; ** p < .01Results from 43 countries with male and female data points for each country.
17

sured by the proportion of the adult population with schooling) and all indicators of living arrangements, except the proportion living with a spouse. Schooling is positively
correlated with percent living alone and percent heading the household, but is negatively correlated with household size, percent living with an adult child, and percent
living with another adult. Possible reasons for these findings will be discussed in the
concluding section.Among the other socioeconomic variables, two— GNP per capita and percent
rural—have no apparent association with living arrangements. Life expectancy is associated only with household size and percent living with an adult child. As expected, both of these associations are positive. When life expectancy rises, the risk of household reduction due to death declines, which in turn decreases the risk of widowhood and increases the availability of children with whom older persons can coreside.
Another important finding in the table is that regional and gender effects remain
strong after controlling for other factors, suggesting that not all of the associations seen earlier are a result of differences in socioeconomic characteristics. Asia differs in several ways from the other two regions. Negative regression coefficients indicate that the
elderly in Asia are less likely to be household heads and less likely to live with another
adult. Positive coefficients indicate that older Asians are more likely to be living with a
spouse and with adult children. Latin America is not significantly different from Africa on four of the six measures; the exceptions are household size and percent living alone.
After controlling for the role of region and socioeconomic factors, the effects of gender (that is, the female-male difference) on the various indicators are similar in size
and direction to those found in earlier analyses that had no controls. Fewer females than
males are household heads or are living with a spouse, while significant positive coeffi
cients indicate that more females live alone or with another adult. There are no significant gender effects when it comes to household size and living with adult children.
C o r e s i d e n c e w i t h a d u l t C h i l d r e n
Coresidence of the elderly with an adult child is considered to be a central feature
of the familial support system in much of the developing world (United Nations 2000). The bars in Figure 1 represent the regional means of the percent of older adults who
18

Figure 1 Percent of elderly males and females aged 65 and older living with an adult child, by region100
80
60
40
20
coreside with an adult child. These results indicate substantial variation among coun
tries within regions but small differences between males and females across regions. The average across all countries is 53 percent for males and 56 percent for females. The regional average for coresidence with an adult child is substantially higher in Asia (66.3
percent for males and 68.3 percent for females) than elsewhere. Hence, although coresi
dence with adult children is common throughout the developing world, the likelihood of finding an older adult living with an adult child is greater in Asia than in Africa and
Latin America. Country averages for each of the 43 DHS surveys are included in Figure 1. The variation across countries is largest in Africa, where the percent of older men living with an adult child ranges from 25 percent in Mozambique to 70 percent in Egypt. The range for older males in Latin America is narrower, reaching a low of 41 percent in
Bolivia and a high of 60 percent in Peru. In Asia, the highest proportion of older men
living with an adult child (80 percent) is observed in Pakistan. Similar levels of varia
tion in country averages are observed for women, and according to the regression results
Males
Pakistan
Egypt
K azakhsi in
Peru
Bolivis■ ^
Africa Asia Latin America
Females
Bangladesh
Morocco
—
_____Africa
Colombia
Asia Latin America
19

in Table 5 there is no significant difference between women and men in the percent
living with an adult child.We next examine whether older adults are more likely to be living with male or
female children, and whether the observed tendency differs significantly across regions and other macro-level correlates. To do this, we construct a gender ratio, which is the percent of older adults within a country who coreside with a male adult child divided by
the percent who coreside with a female adult child. For example, if 40 percent of older
adults in a country coreside with an adult male child and 20 percent coreside with an
adult female child, the gender ratio is 2.0, which implies a predominance of coresidence
with male children. Based on the available DHS data, we can calculate gender ratios for all coresident children. Since the marital status of household members is not available for most DHS surveys, gender ratios for unmarried children cannot be determined. The gender ratios for married children are estimated indirectly by assuming that if an older
adult lives with a son-in-law or daughter-in-law, then he or she is living with, respectively, a married daughter or a married son.
This gender ratio for all children (married and unmarried) can be interpreted as an indicator of gender preference if the availability of children of both genders is the same. This is approximately the case in the 43 countries in this analysis. However, infer
ring gender preferences from gender ratios is more problematic for married children,
because equal availability of married male and female children cannot be assumed. Since
the average age at marriage is usually lower for females across the developing world,
one would expect availability to be higher for married daughters than for married sons. Only when gender ratios are very high do they definitely indicate a preference for living
with sons rather than daughters.
Gender ratios by region and gender of the older adult are presented in Figure 2
for all coresident children and in Figure 3 for married coresident children. Point estimates for the individual countries are plotted on a logarithmic scale, so that a country
with ratio of, say, 2.0 lies the same distance above the 1.0 line as a country with a ratio
of 0.5 lies below 1.0. This arrangement is appropriate because each of these two points
indicates the same coresidence tendency, though the first is for male offspring and the
second is for female offspring, and a gender ratio of 1.0 implies a perfect gender bal-
20

Figure 2 Gender ratios for all children coresiding with males and females aged 65 andolder, by region
ance. Three conclusions can be drawn from Figure 2: 1) Coresidence with male off
spring predominates. In all 43 countries the average gender ratio is 2.7, with 31 countries showing a male dominance compared to just 12 with a female dominance. 2) Regional differences are substantial, with the ratios considerably above 1 in most Asian and African countries, but not in Latin America. 3) Gender ratios of coresident children
are similar for older males and females.Figure 3 presents the average gender ratios for coresident married children in the
three regions as well as point estimates for individual countries. Gender ratios are substantially higher for married children than for all children in Asia and Africa. In both of these regions, the average is about 15 married males for every married female coresiding with older parents, but ratios in a few countries surpass 100:1 in favor of living with
males. These ratios are higher than those for all children and are probably more indica
tive of societal preferences. This is because unmarried children often live with their
parents until they marry, and elderly parents’ preferences for coresiding with them are
21

Figure 3 Gender ratios for all married children coresiding with males and females aged65 and older, by region
1000
100
10
l
0.1
0.01
typically weaker than their preferences for coresiding with married children. For instance, in the patriarchal system discussed by Mason (1992) it is clearly the norm for
older adults to be financially supported by sons and cared for by a daughter-in-law.
Although nearly all societies in Africa and Asia display son preference, there is some
variation. Comoros, for instance, has a ratio of 0.14, indicating parents’ preference for
living with daughters. Latin America is vastly different from Asia and Africa in that the
gender ratio of coresident married children is near 1.0, and there is far less variation among countries. It is possible that in Latin America a modest preference for males is offset by a greater availability of married female offspring, but this question cannot be examined further for lack of marital status information.
In an earlier section we presented a regression analysis in which the proportion of older adults living with an adult child was the dependent variable. The main result from
this regression was that, after controlling for other factors, coresidence with adult chil-
Burkina Faso Males
Uzbekistan Burkina Faso
Females
Yemen
—
— = ~
— ==— Guatemala “ “— — —SS
■ —
DominicanRepublic
Indonesia Brazil Philippines Colombia
- Comoros Comoros
Africa Asia Latin America Africa Asia Latin America
22

dren is positively associated with life expectancy and negatively associated with school
ing levels. In addition, coresidence was significantly higher in Asia than elsewhere. We now extend this analysis by calculating regressions in which the gender ratio of adult coresident offspring (log) is the dependent variable, using the same set of explanatory
variables (region, gender, life expectancy, GNP per capita, percent with schooling, and
percent urban). The results are presented in Table 6, separately for all and for married
coresident children. For ease of interpretation, the regression coefficients have been
converted to multiplicative factors. For instance, in the regression for married coresi
dent children (last column in Table 6), the coefficient for gender equals 0.636, which
means that the gender ratio for elderly females is 0.636 times that for elderly males. This
result, while not statistically significant, suggests that elderly females are more likely than elderly males to be living with female married children.
These regressions indicate that Asian countries have the highest gender ratios and Latin American countries the lowest. These regional effects are substantially greater
for married offspring than for all coresident offspring. The level of schooling, earlier
Table 6 Regression results for gender ratios of coresident childrenAll coresident children M arried coresident children
Gender (1=F) 1.023 0.636
RegionAfrica 1.198 4.259**Asia 2.565** 6.593**Latin America - - —
Socioeconomic variablesLife expectancy 1.016 1.025GNP per capita ($1000 US units) 1.000 1.004Percent with any schooling 0.985** 0.969**Percent rural 1.001 1.003
Constant 1.123 3.062R2 0.470 0.460F 9.89** 9.48**
* .05 > p > .01; ** p < .01Results from 43 countries with male and female data points for each country. Constant represents the expected gender ratio when all variables equal zero. Dependent variable is the log of the ratio.Coefficients represent multiplicative factors.
23

found to be inversely related to coresidence with an adult child, is also inversely related
to the gender ratio of coresiding children. In other words, older adults who live in coun
tries with higher levels of education are less likely to coreside with an adult child, and
when they do they are less likely to coreside with a male adult child. None of the other
explanatory factors is significantly associated with the average gender ratio.
C o n c l u s i o n
In concordance with previous studies, we found that most older adults in the 43 developing countries studied here tend to live in large households, and they are likely to be living with an adult child, who is more likely to be male than female. However, there is substantial variation in living arrangements by gender and education, and several regional patterns exist. Estimates based on (unweighted) country averages indicate that nearly one in ten older adults lives alone, and the probability of living alone is greater for older women than men. Women are much less likely to live with a spouse or to head
the household, while a slightly greater proportion of older women than men live with
adult children.Regional patterns include higher rates of coresidence in Asia, where nearly two-
thirds of both men and women live with adult children. Although rates of coresidence
are high in Africa, where nearly 50 percent of older adults live with an adult child, the
elderly in Africa are most likely to live alone, to be head of a household, and to live with
adults who are not offspring or spouses. Household sizes for the elderly are lowest in the
Latin American countries studied here, while at the same time older Latin Americans are the least likely to be living alone. This is the result of less variation in household size
among countries in this region than in Asia and Africa. Latin American countries dis
played less variation in a number of other respects, such as the percent living with an
adult child and the gender ratio of the coresiding children. The least amount of gender preference for coresiding children was observed across Latin America, and Asian countries displayed the strongest preference for living with male children. But these regional patterns should not cloud the substantial variations that exist among countries within regions, particularly in Africa and Asia. The most noteworthy finding from a set of
regressions aimed at explaining these variations is a strong correlation between levels of
24

On page 24, the sixth line of the final paragraph should read:
Latin American countries studied here, while at the same time older Asians are
ER RA TU M , W orking Paper No. 148
I!

schooling and most living arrangement indicators. Where levels of education are higher, older adults live in smaller households, with fewer children and other adults, and are more likely to be alone.
The association between older adults’ schooling and living arrangement patterns tends to substantiate the hypothesis that older adults living in developing countries with
higher scores for socioeconomic indicators are less likely to be living in extended families. This result seems to be in accordance with Goode’s (1963) convergence theory,
suggesting a movement toward family nuclearization and a weakening of extended family links in conjunction with socioeconomic development. But not all of the socioeconomic variables we tested were correlated with living arrangement patterns. In fact, GNP per capita, percent rural, and life expectancy, measures that are considered important indicators of development, exhibited very little association with any living arrange
ment indicator. Apparently there is something unique about schooling and its influence
on the households of older adults across the developing world. A full explanation of this
association is beyond the scope of this study, but levels of schooling may be correlated with a variety of other factors that influence living arrangements. For example, coun
tries with higher levels of education tend to have larger internal migration flows, as well as better government-funded social security and health programs for older adults. Despite the migration of adult children away from their parents, older adults may be more
financially secure, in part as the result of remittances from their children. Furthermore,
older adults with higher levels of schooling are generally better able to care for them
selves because they are in better health and have greater earning power. The observed
association between education and household structure may also be explained in part by
a stronger preference for privacy among better-educated older adults or by a preference for privacy that cannot be expressed by the poor and least educated.
Besides displaying regional effects, gender ratios of coresident children also varied strongly by level of education. Older adults in countries with lower levels of education have higher levels of coresidence with male rather than female adult children (net of regional differences). One possible explanation is that in countries where education is lower, older adults own fewer resources. They are therefore more dependent on adult children, especially on male offspring, who are more likely to control household re
25

sources. In these situations, the best strategy for an older person is to coreside with a
male child.
Several weaknesses with the DHS data do not allow us to examine certain asso
ciations between parents and their children in greater detail, although these could pro
vide impetus for future data collection efforts. Most of the DHS surveys contain limited
information on the marital status of household members. It was therefore not possible to
analyze gender ratios for unmarried children. More detailed information on the age of
living children would also have been beneficial for further examining coresidential pref
erences across developing countries as they pertain to birth order (for instance, living
with the youngest or older child). Moreover, information on noncoresident children and
their proximity of residence to the older adult would be helpful. Past research has shown
that the well-being of older adults depends not only on household members but also on
contributions from noncoresident children (Siriboon and Knodel 1994). In a number of societies, the expression of independence by adult children is fulfilled by setting up a
separate residence, but one that is near enough to parents so that opportunities remain
for frequent contact and continued assistance. Perhaps most important, DHS surveys
provide almost no information on the specific types of exchanges that take place within
households. Although such information is sometimes collected in sample surveys of
older adults in both developed and developing countries, we are clearly a long way from
being able to investigate variations in the types of assistance provided to older adults across regions and levels of socioeconomic development.
Although these weaknesses suggest how future data collection efforts may improve our understanding of the determinants of living arrangements and well-being in developing countries, current DHS surveys have been an underutilized resource and future research could easily take further advantage of their breadth of geographic coverage. The rapid aging of many of the populations covered by DHS surveys, and the rapid socioeconomic and demographic changes now taking place throughout the developing world, provide impetus for further examining the conditions of older adults, including
their living arrangements. In the current study, we focused on broad regional and socioeco
nomic variations and have, for the most part, ignored country-by-country differences that are
no doubt interesting. Even though the scope of this study does not allow us to provide de
26

tailed explanations for these patterns, DHS data can be used to undertake further in-depth analyses of country differences within regions. Africa and Latin America have been particularly understudied for lack of comparable data on older adults and their living arrangements, and we suggest that these regions are a legitimate focus for future research.
Acknowledgments
The authors gratefully acknowledge comments on an earlier draft of this paper from Linda Martin and assistance from Paul Hewett and Brian Pence in the preparation of the DHS data files. Comments should be sent to Zachary Zimmer, Population Council, One
Dag Hammarskjold Plaza, New York, NY 10017. E-mail: [email protected].
References
Ahn, T. S., B. T. Cuong, D. Goodkind, and J. Knodel. 1997. “Living arrangements, patrilineality and sources of support among elderly Vietnamese,” Asia-Pacific Population Journal 12(4): 69-88.
Asis, M. M. B., D. Domingo, J. Knodel, and K. Mehta. 1995. “Living arrangements in four Asian countries: A comparative perspective,” Journal o f Cross-Cultural
Gerontology 10: 145-162.
Ayad, M., B. Barrere, and J. Otto. 1997. “Demographic and socioeconomic characteristics of households,” DHS Comparative Studies No. 26. Calverton, MD: Macro International Inc.
Becker, G. S. 1991. A Treatise on the Family. Enlarged Edition. Cambridge, MA: Harvard University Press.
Burch, T. K. 1967. “The size and structure of families: A comparative analysis of census data,” American Sociological Review 32: 347—363.
--------- . 1979. “Household and family demography: A bibliographic essay,” PopulationIndex 45:173-195.
Cameron, L. 2000. “The residency decision of elderly Indonesians: A nested logit analysis,” Demography 37: 17-27.
27
Casterline, J. B. et al. 1991. “Differences in the living arrangements of the elderly in four Asian countries: The interplay of constraints and preferences,” Comparative
Study o f the Elderly in Asia Research Reports, No. 91-10. Ann Arbor: Population Studies Center, University of Michigan.
Chan, A. 1997. “An overview of the living arrangements and social support exchanges of older Singaporeans,” Asia-Pacific Population Journal 12(4): 35-50.
Chen, C. 1996. “Living arrangements and economic support for the elderly in Taiwan,” Journal o f Population Studies 17: 59-81.
Coale, A. J. 1964. “How a population ages or grows younger,” in R. Freedman (ed.), Population: The Vital Revolution. Garden City, NY: Doubleday.
DaVanzo, J. and A. Chan. 1994. “Living arrangements of older Malaysians: Who coresides with their adult children?” Dem ography 31: 95-113.
De Vos, S. 1990. “Extended family living among older people in six Latin American countries,” Journal o f Gerontology 45: S87-S94.
--------- . 1998. “Regional differences in living arrangements among the elderly in Ecuador,” Journal o f Cross-Cultural Gerontology 13: 1—20.
Domingo, L. J. and J. B. Casterline. 1992. “Living arrangements of the Filipino elderly,” Asia-Pacific Population Journal 7(3): 63-88.
Goode, William J. 1963. World Revolution and Family Patterns. New York: Free Press of Glencoe.
Grigsby, J. S. 1991. “Paths for future population aging,” The G erontologist 31: 195— 203.
Hashimoto, A. 1991. “Living arrangements of the aged in seven developing countries: A preliminary analysis,” Journal o f Cross-Cultural Gerontology 6: 359-381.
Kim, C. S. and K. O. Rhee. 1997. “Variations in preferred living arrangements among Korean elderly parents,” Journal o f Cross-Cultural Gerontology 12: 189-202.
King, M. and S. H. Preston. 1990. “Who lives with whom? Individual versus household measures,” Journal o f Family H istory 15: 117—132.
2 8
Knodel, J. and N. Chayovan. 1997. “Family support and living arrangements of Thai elderly,” Asia-Pacific Population Journal 12(4): 51-68.
Knodel, J., N. Chayovan, and S. Siriboon. 1992. “The familial support system of Thai elderly: An overview,” Asia-Pacific Population Journal 7(3): 105-126.
Kuznets, S. 1978. “Size and age structure of family households: Exploratory comparisons,” Population and Development Review 4: 187—223.
Martin, L. G. 1989. “Living arrangements of the elderly in Fiji, Korea, Malaysia, and the Philippines,” Demography 26: 627-643.
--------- . 1990. “The status of South Asia’s growing elderly population,” Journal of Cross-Cultural Gerontology 5: 93-117.
Martin, L. G. and K. Kinsella. 1994. “Research on the demography of aging in developing countries,” in L. G. Martin and S. H. Preston (eds.), Demography of Aging. Washington, DC: National Academy Press, pp. 356-403.
Mason, K. O. 1992. “Family change and support of the elderly in Asia: What do we know?” Asia-Pacific Population Journal 7(3): 13-32.
McDonald, Peter. 1992. “Convergence or compromise in historical family change?” in E. Berqu6 and P. Xenos (eds.), Family Systems and Cultural Change. New York: Oxford University Press, pp. 15-30.
Natividad, J. N. and G. T. Cruz. 1997. “Patterns in living arrangements and familial support for the elderly in the Philippines,” Asia-Pacific Population Journal 12(4): 17-34.
Nydegger, C. N. 1983. “Family ties of the aged in cross-cultural perspective,” The Gerontologist 23: 26-32 .
OECD. 1998. Maintaining Prosperity in an Ageing Society. Paris: Organisation for Economic Co-operation and Development.
Ofstedal, M. B., J. Knodel, and N. Chayovan. 1999. “Intergenerational support and gender: A comparison of four Asian countries,” Southeast Asian Journal of Social Science 27: 21 —42.
29

Palloni, A., S. De Vos, and M. Palaez. 1999. “Aging in Latin America and the Caribbean,” Working Paper No. 99-02, Center for Demography and Ecology, University of Wisconsin-Madison.
Siriboon, S. and J. Knodel. 1994. “Thai elderly who do not reside with their children,” Journal of Cross-Cultural Gerontology 9: 21-38. >
Thornton, A., M. C. Chang, and T. H. Sun. 1984. “Social and economic change, intergenerational relationships, and family formation in Taiwan,” Demography 21: 475-499.
United Nations. 1973. The Determinants and Consequences o f Population Trends: New Summary o f Findings on Interaction o f Demographic, Economic and Social Factors. New York: United Nations.
--------- . 1999. World Population Prospects: The 1998 Revision. Volume I: Comprehensive Tables. New York: United Nations.
--------- . 2000. United Nations Technical Meeting on Population, Ageing, and Living Arrangements of Older Persons: Critical Issues and Policy Responses. New York: United Nations.
World Bank. 1994. Averting the Old Age Crisis. New York: Oxford University Press.
--------- . 1996. From Plan to Market: World Development Report 1996. New York: Oxford University Press.
Wu Cangping. 1994. “The ageing process and income security of the elderly under reform in China,” in The Ageing o f Asian Populations: Proceedings o f the United
Nations Round Table on the Ageing o f Asian Populations, Bangkok, 4 -6 May 1992. New York: United Nations, pp. 58-65.
30