lixiviation of argillaceous rocks: impact of oxidation degree states on organic compound...
TRANSCRIPT

www.fuelfirst.com
Fuel 86 (2007) 426–433
Lixiviation of argillaceous rocks:Impact of oxidation degree states on organic compound mobilization
Pierre Faure *, Chantal Peiffert
CREGU, BP 23, 54501 Vandoeuvre Les Nancy Cedex, France
Received 25 November 2005; received in revised form 7 July 2006; accepted 11 July 2006Available online 17 August 2006
Abstract
This work aims to study the influence of oxidation degree state which reached by organic matter included in argillaceous rocks onlixiviation and mobilization of compounds. Experimental lixiviation was carried out on two argillaceous rocks sampled in the surfacedeposit of the Andra laboratory (Bure, France). Molecular and spectroscopic characterizations of the organic matter extracts revealtwo different oxidation levels reached by these samples: (i) a well preserved and (ii) an oxidized samples. Dissolved organic matter contentand molecular investigation of sediment bitumen show that hydrophobic molecules (hydrocarbons) remain stable during lixiviationwhereas specific polar compounds (alkanoic acids) are progressively removed by water. Moreover, occurrence of secondary alkanols witha molecular distribution similar to initial n-alkanes suggests that even in the well preserved sample, oxidation already occurs and thatsecondary alkanols can be used as specific markers for low intensity oxidation.� 2006 Elsevier Ltd. All rights reserved.
Keywords: Oxidation markers; Pentacyclic triterpanes; 2-Alkanols
1. Introduction
The development of underground research studies fordeep disposal of high level wastes evolved a new interestto investigate the behavior of organic matter during oxida-tion. The digging of galleries in underground sedimentsfavors the contact between the fossil organic matter withoxygen. Moreover, surface storage of sediment extractedfrom the galleries can undergoes effect of weathering (oxi-dation, biodegradation, lixiviation). Air oxidation of theorganic matter can be intense [1], especially when this latteris included in argillaceous sediment in low proportion [2].At the end of the underground storage exploitation, itcan be decided to use the same matrix (sediment storedin surface) for the galleries filling. However, it is crucialto evaluate consequences (i) of ‘‘weathering’’ on the chem-istry of the sediment stored at the surface and (ii) of oxida-
0016-2361/$ - see front matter � 2006 Elsevier Ltd. All rights reserved.
doi:10.1016/j.fuel.2006.07.008
* Corresponding author. Tel.: +33 3 83 68 47 40; fax: +33 3 83 68 47 01.E-mail address: [email protected] (P. Faure).
tion on the organic matter included in the geologicalbarrier because of the ventilation.
Several authors have already studied the evolution ofthe organic matter face to oxidation on natural and exper-imental oxidized argillaceous sediment [3,4]. Experimentaloxidations allow to better understand what happen duringabiotic oxidation in controlled conditions whereas naturaloxidized samples allow to validate experiments [1].
Such works describe main phenomena which occur dur-ing abiotic oxidation. During a first step, the extractableorganic fraction is the only fraction which exhibits an evo-lution [4]. During this first stage, the distribution of satu-rated hydrocarbons shows major modifications in relationwith the alteration of the high molecular mass compounds.In parallel, unsaturated biomarkers (pentacyclic triter-penes) disappear from the hydrocarbon fraction and areprobably altered in oxygenated triterpanes as also observedin the case of petroleum abiotic oxidation [5]. The secondstep is characterized by an alteration of the kerogen [4].Rock Eval pyrolysis of progressive oxidized argillaceoussediments shows a regular incorporation of oxygen in the

P. Faure, C. Peiffert / Fuel 86 (2007) 426–433 427
kerogen (oxygen index increases from to 62 to more than170 mg of CO2/g of TOC – total organic carbon) and inparallel, the decrease in petroleum potential (hydrogenindex from 90 to 30 mg of HC/g de TOC) suggesting gen-eration of compounds. Correlated with this kerogen alter-ation, the organic extract amount increases and exhibitsmajor chemical modifications in particular in the polarfraction. Indeed, these polar compounds exhibit shorterand shorted aliphatic chain length and an increase in theoxygenated functions (especially hydroxyl and carbonylfunctions). As a matter of fact, oxidation of organic matterinduces the formation of reactive and soluble compoundswhich could have an impact on chemical properties ofthe geological barrier. Oxidation degrees undergone byorganic matter should control the nature and the contentof compounds potentially mobilized by water.
The aim of this paper is to evaluate the influence of theoxidation degree reached by organic matter included inargillaceous sediment during lixiviation. Two different sam-ples, exhibiting two different oxidation degrees were lixivi-ated. The molecular and spectroscopic characteristics ofthe extractable organic matter included in these two argil-laceous sediments were followed during lixiviationexperiments.
2. Experimental
2.1. Sample location and preparation
This study concerns the Bure site of Andra, which islocated in the North-East of France (http://www.andra.fr).Two kimmeridgian argillaceous sediments (sample No. 1and No. 2) were sampled in the surface deposits of theexperimental laboratory of Andra (Bure, Haute Marne,France). These sediments come from the boring access wellof the underground laboratory and were stored about 4years at surface undergoing ‘‘weathering’’.
Sample No. 1 was in powder form whereas sample No. 2corresponds to a block.
Samples were freeze-dried, then ground (500 lm), andstored under argon at 4 �C in order to avoid any air oxida-tion before characterization and lixiviation experiments.
2.2. Lixiviation
Lixiviation tests of kimmeridgian sediment were carriedout according to the experimental procedure recommendedby the AFNOR NF X31-210 French standard relative tothe characterization of ultimate industrial waste.
The experiments were carried out at room temperature.Samples (30 g of sediment) were placed in 500 ml bottlesand mixed with 300 ml of dezionized water (water–sedi-ment ratio equal to 10). A bacteria inhibitor (sodium azo-ture) was added (60 mg) in each bottle in order to avoidbiodegradation during experiments.
These bottles were placed horizontally on stirringmachine at the rate of 60 tr./min. during 62, 120 and 190
days. After leaching, the solution was filtered using ultrafiltration membrane (pore diameter: 0.45lm). A water ali-quot was used to determine the dissolved organic carboncontent. The very low organic content in the water doesnot allow us to carry out a molecular characterization ofthe dissolved organic matter. After leaching experiments,sediments were freeze dried and ground (500 lm) beforecharacterizations.
2.3. Analytical
2.3.1. Extraction–fractionation
The bitumen fraction of raw and lixiviated materialwas recovered by automatic solvent extractor (ASE 200Dionex) with dichloromethane (100 �C, 100 bars, statictime: 7 min). Raw and lixiviated samples were treated bythe same procedure. The aliphatic, aromatic and polarfractions were isolated by liquid chromatography on asilica column with successive elution by pentane, pentaneand dichloromethane (65/35, v/v) and methanol/dichloro-methane (50/50, v/v) respectively. After each step, therecovered fractions were weighed and mass balancescalculated.
2.3.2. Gas chromatography–mass spectrometry (GC–MS)
Aliphatic and aromatic hydrocarbons as well as polarcompounds were analyzed by gas chromatography–massspectrometry (HP 5890 Serie II GC coupled to a HP5971 MS), using a split-splitless injector, a 60 m DB-5J&W, 0.25 mm i.d., 0.1 lm film fused silica column.The temperature program was 70–130 �C at 15 �C/min,then 130–315 �C at 3 �C/min followed by an isothermalstage at 315 �C for 15 min (constant helium flow of1.4 ml/min).
Because of the presence of alkanoic acids and alkanolsin the polar fractions, silylation using BSTFA + TMCS(99/1) was carried out in order to improve the chromato-graphic resolution [6,7]. A small aliquot of polar com-pounds is dissolved with the derivative solution at a8 mg/ml concentration and treated during 15 min at60 �C. Then, 1 ll of the solution is directly injected in thegas chromatograph.
2.3.3. Fourier transform infrared microspectroscopy (FTIR)
Polar compounds were analyzed using a special samplepreparation technique [8] avoiding drawbacks usuallyencountered when using bulk infrared on KBr pellets suchas contamination by water adsorbed on the highly hygro-scopic KBr [9]. Polars aliquots (m < 0.5 mg) were placedbetween the two diamond windows (2 mm diameter,1 mm thickness) of a compression cell (7.5 cm · 5.1 cm,Spectra-Tech int.). After compression of the sample byscrewing, the top window was removed. The visible light·10 objective gives an enlarged image of the sample andallows the selection of the area to be analyzed. Themicro-FTIR analysis was performed on a Brucker IFS-88equinox spectrometer coupled with a Brucker multipurpose

428 P. Faure, C. Peiffert / Fuel 86 (2007) 426–433
infrared microscope which was fitted with a 250 lm narrowband MCT detector cooled to 77 K. The standard analyti-cal conditions were ·15 infrared objective, 40–60 lm diam-eter infrared spot, 60 scans (30 s), and spectral resolution of4 cm�1. Spectra were ratioed to the background collectedon a clean diamond window in the same analytical condi-tions. The assignments of the main IR bands were deter-mined by reference to previous works [10,11].
2.3.4. Dissolved organic carbon (DOC)
The dissolved organic carbon was quantified using aDohrmann DC190 High Temperature apparatus (Rose-mount Analytical Inc. Dohrmann Division).
3. Results
3.1. Raw samples
Total organic carbon (TOC) (Table 1) of No. 1 sample islow whereas No. 2 sample exhibits a TOC four timesgreater. The proportion of saturated and aromatic hydro-carbons as well as polar compounds is close for these twosamples (Fig. 1). These bitumens are dominated by polarcompounds (�60%) whereas saturated and especially aro-matic hydrocarbons are low.
Table 1Total organic carbon (% of dry sediment), dissolved organic carbon (% of TOC(% of bitumen) of raw samples and lixiviated samples during 62, 120 and 190
TOC(% of sed.)
DOC(% TOC)
Satu(% o
Raw No. 1 sample 0.58 – 28.8Sample No. 1 – 62 days 0.57 1.60 36.4Sample No. 1 – 120 days 0.61 1.85 49.0Sample No. 1 – 190 days 0.48 2.12 58.2
Raw No. 2 sample 2.81 – 26.7No. 2 Sample – 62 days 2.41 0.44 26.8No. 2 Sample – 120 days 2.57 0.64 25.6No. 2 Sample – 190 days 2.33 0.62 29.8
0
10
20
30
40
50
60
70
Rawsample
62 days 120 days 190 days
Saturated
Aromatic
Polar Co
Rel
ativ
e ab
unda
nce
(%)
Fig. 1. Relative abundance of saturated hydrocarbons, aromatic hyd
Molecular analysis of the saturated hydrocarbons andespecially n-alkanes distribution (m/z = 57) show clearlydifferences between No. 1 and No. 2 samples (Fig. 2a andb). No. 1 sample is characterized by the occurrence of n-alkanes in the nC14–nC39 range with a limited odd overeven carbon number predominance in the range C25–C34
(CPI = 1.43; [12]), an intense odd over even predominancein the range C14–C22 and an intense UCM (unresolvedcomplex mixture) generally considered as an iso- andcyclo-alkanes mixture [13]. n-Alkanes in the nC14–nC41
range occur in sample No. 2 with a marked odd over evenpredominance in the nC14–nC23 range but also in the nC25–nC34 range (CPI = 2.40).
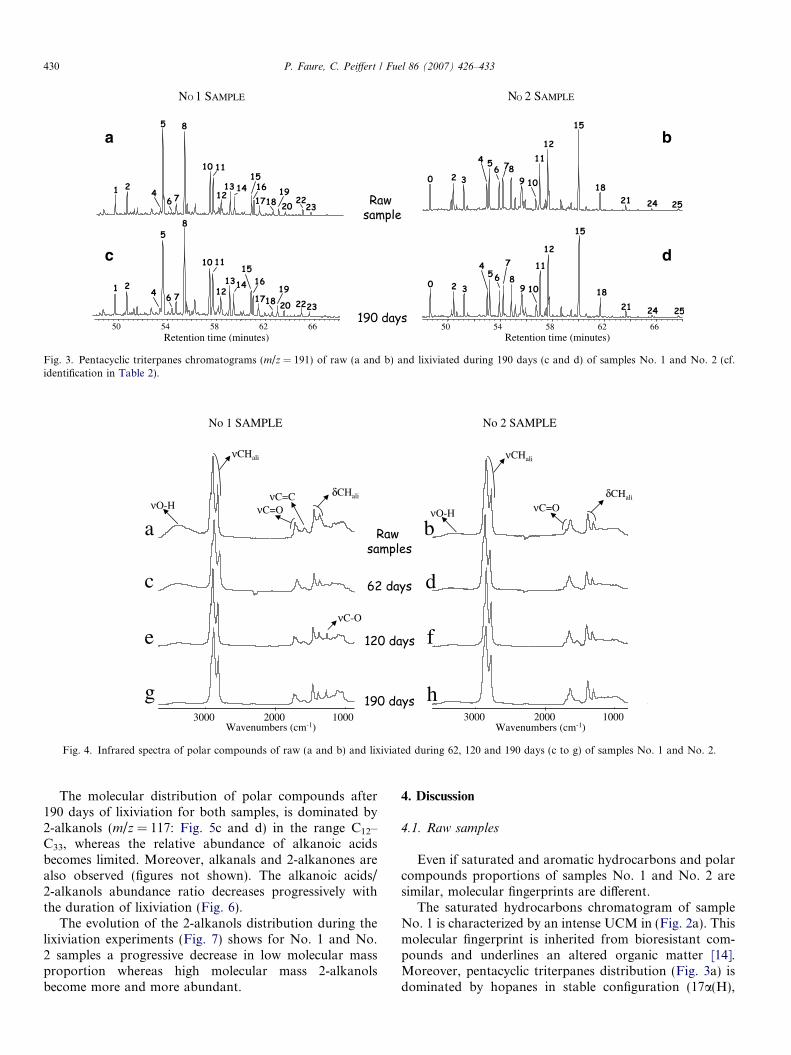
The distribution of the pentacyclic triterpanes (m/z =191) confirms the different signature of No. 1 and No. 2samples (Table 2, Fig. 3a and b). No. 1 sample is charac-terized by the presence of stable configuration pentacy-clic triterpanes (predominance of 17a(H),21b(H) and 22Sconformations: peaks 5, 8, 10, 13, 16, 19, 22). On thecontrary, sample No. 2 is dominated by pentacyclic triter-penes (peaks 0, 4, 6) and pentacyclic triterpanes in biolog-ical conformation (17b(H),21b(H): peaks 9, 12, 15, 18, 21,24, 25).
Investigation of polar compounds by lIRTF reveals forNo. 1 and No. 2 samples an intense mCHali band and a
), saturated hydrocarbons, aromatic hydrocarbons and polar compoundsdays
rated hydrocarbonsf bitumen)
Aromatic hydrocarbons(% of bitumen)
Polar compounds(% of bitumen)
9.6 61.517.0 46.619.4 31.612.5 29.3
16.8 56.417.1 56.117.1 57.317.0 53.2
Rawsample
62 days 120 days 190 days
hydrocarbons
hydrocarbons
mpounds
rocarbons and polar compounds of raw and lixiviated samples.

Pr Ph
nC17
nC18
nC19
nC20 nC
21nC
22nC
23nC
24nC
25nC
26 nC27
nC28
nC29
nC30
nC31
nC16
nC15
UCM
nC35
nC33nC
32
nC34
nC17
nC18
nC19
nC20 nC
21nC
22nC
23nC
24nC
25nC
26
nC27
nC28
nC29
nC15
nC16
nC39
nC37
UCM
nC30
nC31
nC35
nC33
nC34
nC32
nC14
Pr
Ph
Retention time (minutes)
nC17
nC18
nC19
nC20
nC21
nC22
nC23
nC24
nC25
nC26
nC28
nC29
nC30
nC31
nC27
nC16
nC15
nC14
nC32
nC35
nC37
nC39
nC41
PhPr
nC33
nC26
nC28
nC30
nC17
nC18
nC19
nC20 nC
21nC
22nC
23nC
24nC
25
nC29
nC31nC
27
nC33
nC41
nC39
nC35
nC15
nC16
nC37
nC34
nC14
Ph
Pr
nC32
nC36
nC40
nC38
Retention time (minutes)
a
c
b
d
10 20 30 40 50 60 70 80 10 20 30 40 50 60 70 80
nC37
nC39
No 2 SAMPLE No 1 SAMPLE
Fig. 2. Saturated hydrocarbons chromatograms (m/z = 57) of raw (a and b) and lixiviated during 190 days (c and d) of No. 1 and No. 2 samples (nCicorrespond to n-alkanes with i = carbon number).
Table 2Identification of pentacyclic triterpanes and triterpenes of Fig. 3
Symbol Compound name Carbon number
0 22,29,30-Trisnorhop-13(18)-ene C271 18a(H)-trisnorhopane (Ts) C272 17a(H)-22,29,30-Trisnorhopane (Tm) C273 17b(H)-22,29,30-trisnorhopane C274 30-Norneohop13(18)ene C295 17a(H),21b(H)-30-norhopane C296 hop(17)21ene C307 17b(H),21a(H)-30 normoretane C298 17a(H),21b(H)-hopane C309 17b(H),21b(H)-30 norhopane C29
10 22S-17a(H),21b(H)-30 homohopane C3111 22R-17a(H),21b(H)-30 homohopane C3112 17b(H),21b(H)-hopane C3013 22S-17a(H),21b(H)-30 bishomohopane C3214 22R-17a(H),21b(H)-30 bishomohopane C3215 17b(H),21b(H)-30 homohopane C3116 22S-17a(H),21b(H)-30 trishomohopane C3317 22R-17a(H),21b(H)-30 trishomohopane C3318 17b(H),21b(H)-30 bishomohopane C3219 22S-17a(H),21b(H)-tetrakishomohopane C3420 22R-17a(H),21b(H)-tetrakishomohopane C3421 17b(H),21b(H)-30 trishomohopane C3322 22S-17a(H),21b(H)-pentakishomohopane C3523 22R-17a(H),21b(H)-pentakishomohopane C3524 17b(H),21b(H)-30-tetrakishomohopane C3425 17b(H),21b(H)-30-pentakishomohopane C35
P. Faure, C. Peiffert / Fuel 86 (2007) 426–433 429
moderate mC@O band (Fig. 4a and b). However, No. 1sample exhibits an intense mO–H band not observed inthe case of No. 2 sample.
Molecular distribution of alkanoic acids and 2-alkanols(m/z = 117 – Fig. 5a and b), similar for No. 1 and No. 2samples, are dominated by alkanoic acids in the C10–C28
range with an even over odd carbon number predomi-
nance. Moreover, in lower proportion, 2-alkanols aredetected in the C11–C23 range with an odd over even pre-dominance. Other alkanols position isomers (except1-alkanols) and 2-alkanones with the same type of distribu-tion (odd over even predominance) are also observed(chromatograms not shown).
3.2. Lixiviation experiments
The composition of the organic extract during lixivia-tion can be seen to evolve differently for samples No. 1and No. 2 (Fig. 1). The relative amount of saturated hydro-carbons increases over time for sample No. 1 whereas theproportion of polar compounds decreases. In contrast,sample No. 2 exhibits a stable organic extract compositionthat is dominated by polar compounds.
Even though the total organic content is higher for sam-ple No. 2 (Table 1), the dissolved organic carbon (DOC) isabout four time more abundant for No. 1 sample than No.2 sample after 190 days of the experiment. For both sam-ples, the DOC increases with the duration of waterleaching.
The saturated hydrocarbons distribution is relativelystable between raw samples and lixiviated samples(Fig. 2). Specific fingerprints of No. 1 and No. 2 samples(see Section 3.1) are preserved. The CPI is not affected bythe lixiviation and remains stable, as does the distributionof pentacyclic triterpanes (Fig. 3).
The infrared spectroscopy of polar compounds (Fig. 4d,f and h) remains stable for sample No. 2 whatever thelixiviation time. On the contrary, sample No. 1 shows aprogressive decrease in the intensity of the mO–H band(Fig. 4c, e and g). Moreover, the mC–O band appears after120 days of lixiviation and still occurs after 190 days oflixiviation.
a b
c d
Fig. 3. Pentacyclic triterpanes chromatograms (m/z = 191) of raw (a and b) and lixiviated during 190 days (c and d) of samples No. 1 and No. 2 (cf.identification in Table 2).
No 1 SAMPLE No 2 SAMPLE
Wavenumbers (cm-1)
νCHali
νC=OνC=C δCHali
20003000 1000 Wavenumbers (cm-1)
νO-H
νCHali
νC=OδCHali
b
d
f
h20003000 1000
a
c
e
g
νO-H
νC-O
Fig. 4. Infrared spectra of polar compounds of raw (a and b) and lixiviated during 62, 120 and 190 days (c to g) of samples No. 1 and No. 2.
430 P. Faure, C. Peiffert / Fuel 86 (2007) 426–433
The molecular distribution of polar compounds after190 days of lixiviation for both samples, is dominated by2-alkanols (m/z = 117: Fig. 5c and d) in the range C12–C33, whereas the relative abundance of alkanoic acidsbecomes limited. Moreover, alkanals and 2-alkanones arealso observed (figures not shown). The alkanoic acids/2-alkanols abundance ratio decreases progressively withthe duration of lixiviation (Fig. 6).
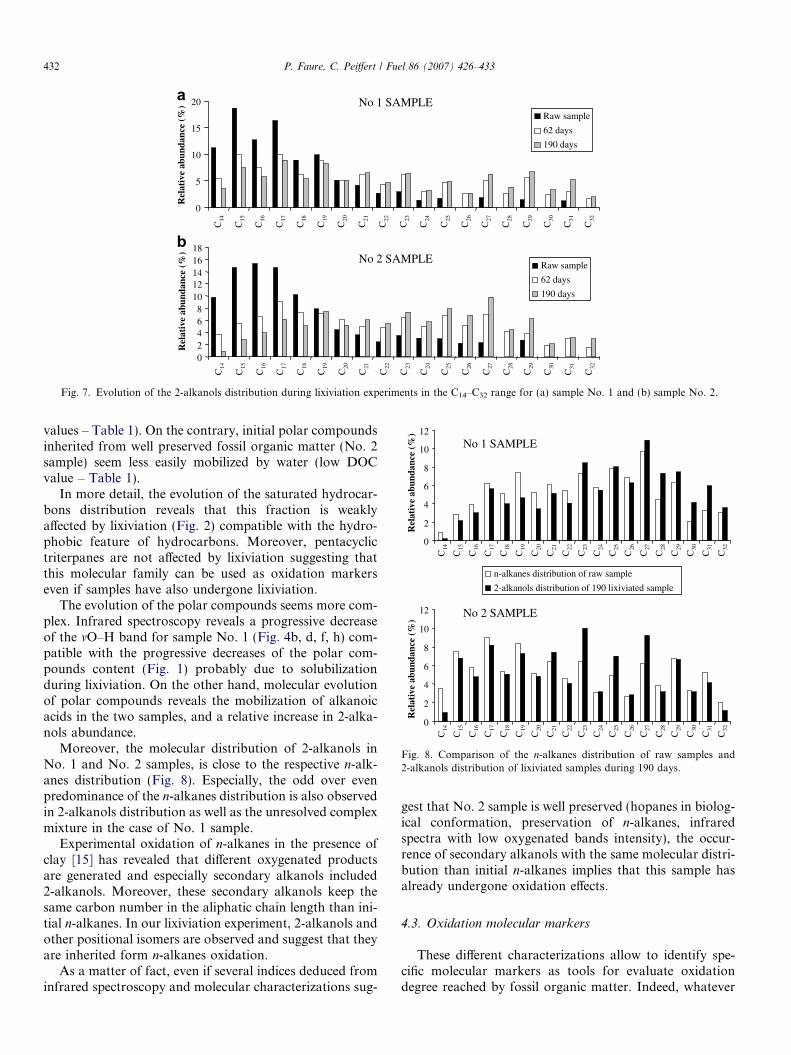
The evolution of the 2-alkanols distribution during thelixiviation experiments (Fig. 7) shows for No. 1 and No.2 samples a progressive decrease in low molecular massproportion whereas high molecular mass 2-alkanolsbecome more and more abundant.
4. Discussion
4.1. Raw samples
Even if saturated and aromatic hydrocarbons and polarcompounds proportions of samples No. 1 and No. 2 aresimilar, molecular fingerprints are different.
The saturated hydrocarbons chromatogram of sampleNo. 1 is characterized by an intense UCM in (Fig. 2a). Thismolecular fingerprint is inherited from bioresistant com-pounds and underlines an altered organic matter [14].Moreover, pentacyclic triterpanes distribution (Fig. 3a) isdominated by hopanes in stable configuration (17a(H),

C17
C15 C
16
20 30 40 50 60 70
Retention time (minutes)
a
C18
C16
PC11 C
14
C15
C22
C24
C26
C28
C13
C12
c
C15
P
C17
C19
C21
C23
C25 C
27
C29
C31
C33
C34
C20 C
22
C24
C26
C28
C32C
30
C14
C12
C13
C16
C18
C35
C23
C20
C21C19C
10
d
UCM
C19
C21
C23
C25 C
27
C29
C31
C33
C28
C20
C22
C24
C32C
30
C18
C26
C17
b
C18
C16
C10
C14
C26
C24
C17
C22
C11
C13
C12
C15
C19 C20
C21
C23
C14
C13
20 30 40 50 60 70
Retention time (minutes)
No 2 SAMPLE No 1 SAMPLE
C12
Fig. 5. Alkanoic acids and 2-alkanols chromatograms (m/z = 117) from silylated polar compounds of raw (a and b) and lixiviated during 190 days (c andd) of samples No. 1 and No. 2 (s Ci = 2-alkanols, d Ci = alkanoic acids with i = carbon number, P: 6,10,14-trimethylpentadecan-2-ol).
0
0.5
1
1.5
2
2.5
3
3.5
0 50 100 150 200
Lixiviation time (days)
No1 Sample
No 2 Sample
Alkanoic acids / 2-alkanols ratio
Fig. 6. Evolution of the alkanoic acids/2-alkanols abundance ratio duringlixiviation experiments.
P. Faure, C. Peiffert / Fuel 86 (2007) 426–433 431
21b(H) and 22S conformations). Such distribution wasalready observed in the case of intense oxidation of fossilorganic matter [1,4] and was attributed to the specific alter-ation of the kerogen (breakdown of the kerogen structure).Finally, the intense mO–H band in the infrared spectra ofpolar compounds from sample No. 1 suggests occurrenceof polar compounds rich in hydroxyl functions and under-lines oxygenated polar compounds generated during oxida-tion [4].
Occurrence of pentacyclic triterpanes (Fig. 3b) in biolog-ical configuration (17b(H),21b(H) conformations) in thesaturated hydrocarbons chromatogram of No. 2 samplesuggests a well preservation of No. 2 sample organic matterface to alteration and especially oxidation. Indeed, suchmolecules are known to be sensitive to abiotic oxidation[1,4]. Moreover, the absence of hydroxyl band in the infra-
red spectra of polar compounds from sample No. 2(Fig. 4b) confirms a well preserved sample.
All these molecular and spectroscopic characterizationsallow distinguishing two different oxidation degrees under-gone by No. 1 and No. 2 samples. No. 1 sample is oxidizedwhereas No. 2 sample is well preserved. These different oxi-dation levels seem to be controlled by the physical state ofthese samples. No. 1 sample, in powder form, is highlyaltered (favor oxygen and water access) whereas sampleNo. 2, in block form, is well preserved because of thelimited porosity.
4.2. Lixiviation experiments
The different oxidation degrees of No. 1 and No. 2samples allow us to better understand the effect of previ-ous oxidation on lixiviation and especially consequenceson the mobilization of compounds generated duringoxidation.
During lixiviation experiments, the relative amount ofpolar compounds from No. 1 sample decreases whereasthis amount is stable for No. 2 sample. It suggests thatpolar compounds which occur in No. 1 sample, partiallyinherited from oxidation of kerogen, are easily mobilizedby water whereas initial polar compounds inherited fromgeological history of the kimmeridgian formation (No. 2sample) are less mobile. Experimental oxidation [4] hasshown that polar compounds generated by kerogen oxida-tion are more oxygenated with shorter aliphatic chainlength than initial polar compounds. These characteristicsare compatible with an important water solubility of polarcompounds observed for oxidized No. 1 sample (high DOC
0
5
10
15
20
C14
C15
C16
C17
C18
C19
C20
C21
C22
C23
C24
C25
C26
C27
C28
C29
C30
C31
C32
Raw sample
62 days
190 days
02468
1012141618
C14
C15
C16
C17
C18
C19
C20
C21
C22
C23
C24
C25
C26
C27
C28
C29
C30
C31
C32
Raw sample
62 days
190 days
No 2 SAMPLE
No 1 SAMPLE
Rel
ativ
e ab
unda
nce
(%)
Rel
ativ
e ab
unda
nce
(%)
Fig. 7. Evolution of the 2-alkanols distribution during lixiviation experiments in the C14–C32 range for (a) sample No. 1 and (b) sample No. 2.
0
2
4
6
8
10
12
Rel
ativ
e ab
unda
nce
(%)
C14
C15
C16
C17
C18
C19
C20
C21
C22
C23
C24
C25
C26
C27
C28
C29
C30
C31
C32
No 2 SAMPLE
n-alkanes distribution of raw sample
2-alkanols distribution of 190 lixiviated sample
0
2
4
6
8
10
12
Rel
ativ
e ab
unda
nce
(%)
C14
C15
C16
C17
C18
C19
C20
C21
C22
C23
C24
C25
C26
C27
C28
C29
C30
C31
C32
No 1 SAMPLE
Fig. 8. Comparison of the n-alkanes distribution of raw samples and2-alkanols distribution of lixiviated samples during 190 days.
432 P. Faure, C. Peiffert / Fuel 86 (2007) 426–433
values – Table 1). On the contrary, initial polar compoundsinherited from well preserved fossil organic matter (No. 2sample) seem less easily mobilized by water (low DOCvalue – Table 1).
In more detail, the evolution of the saturated hydrocar-bons distribution reveals that this fraction is weaklyaffected by lixiviation (Fig. 2) compatible with the hydro-phobic feature of hydrocarbons. Moreover, pentacyclictriterpanes are not affected by lixiviation suggesting thatthis molecular family can be used as oxidation markerseven if samples have also undergone lixiviation.
The evolution of the polar compounds seems more com-plex. Infrared spectroscopy reveals a progressive decreaseof the mO–H band for sample No. 1 (Fig. 4b, d, f, h) com-patible with the progressive decreases of the polar com-pounds content (Fig. 1) probably due to solubilizationduring lixiviation. On the other hand, molecular evolutionof polar compounds reveals the mobilization of alkanoicacids in the two samples, and a relative increase in 2-alka-nols abundance.
Moreover, the molecular distribution of 2-alkanols inNo. 1 and No. 2 samples, is close to the respective n-alk-anes distribution (Fig. 8). Especially, the odd over evenpredominance of the n-alkanes distribution is also observedin 2-alkanols distribution as well as the unresolved complexmixture in the case of No. 1 sample.
Experimental oxidation of n-alkanes in the presence ofclay [15] has revealed that different oxygenated productsare generated and especially secondary alkanols included2-alkanols. Moreover, these secondary alkanols keep thesame carbon number in the aliphatic chain length than ini-tial n-alkanes. In our lixiviation experiment, 2-alkanols andother positional isomers are observed and suggest that theyare inherited form n-alkanes oxidation.
As a matter of fact, even if several indices deduced frominfrared spectroscopy and molecular characterizations sug-
gest that No. 2 sample is well preserved (hopanes in biolog-ical conformation, preservation of n-alkanes, infraredspectra with low oxygenated bands intensity), the occur-rence of secondary alkanols with the same molecular distri-bution than initial n-alkanes implies that this sample hasalready undergone oxidation effects.
4.3. Oxidation molecular markers
These different characterizations allow to identify spe-cific molecular markers as tools for evaluate oxidationdegree reached by fossil organic matter. Indeed, whatever
P. Faure, C. Peiffert / Fuel 86 (2007) 426–433 433
the oxidation degree, water leaching reveals an increase inthe proportion of secondary alkanols and especially 2-alk-anols after lixiviation in the polar fraction. The similarityof their molecular distribution compared to n-alkanes(especially odd over even carbon number predominance)and results from previous artificial oxidation of pure n-alk-anes mixture leading to secondary alkanols [2,15] suggestthat n-alkanes have already undergone oxidation even inthe sample supposed to be well preserved. Secondary alka-nols seems to be sensible markers for low oxidation degree.
As a matter of fact two different molecular markers fam-ilies can be used in order to evaluate oxidation degreesreached by immature fossil organic matter:
• Occurrence of secondary alkanols with a molecular dis-tribution similar to n-alkanes suggests limited oxidationaffecting only the bitumen fraction and especially n-alkanes.
• Modification of the hopanes distribution with in a firststep the disappearance of unsaturated hopanes and thentransformation of hopanes from biological conforma-tions (bb) to stable conformations (ab) reveals anintense oxidation reflecting kerogen alteration.
5. Conclusion
Organic matter characterizations of two different argilla-ceous sediments sampled in a surface deposit reveal a highheterogeneity of oxidation level: a sediment is well pre-served whereas the other sediment sampled in the samelocation (several meters) exhibits an elevated oxidationdegree. The oxidation intensity seems to be controlled bythe physical state of the sediment controlling oxygen andwater access.
During water leaching experiments, the molecular com-position of the organic matter is dependant of oxidationstates. Non-oxidized sediment exhibits limited evolution.Especially, the organic extract composition remains stableand only preferential mobilization of alkanoic acid bywater is observed. On the contrary, previous oxidized sam-ple exhibits major evolution during water leaching. Organicextract constitution show a decrease in the polar com-pounds proportion after water leaching. Whereas molecu-lar signature of saturated hydrocarbons remains stable,polar compounds exhibit modification: decrease in alka-noic acids and decrease in the hydroxyl function deducedby infrared spectroscopy.
Moreover, these experiments allow to identify specificmolecular markers as tools for evaluate oxidation degreereached by fossil organic matter. In the case of limited oxi-dation degree, only saturated hydrocarbons are affected
with a preferential oxidation of n-alkanes in secondary alk-anols. For higher oxidation degrees, the kerogen is affectedleading to (i) generation of polar compounds with a highersolubility in water and (ii) molecular modifications of thepentacyclic triterpanes distributions.
Acknowledgements
The authors acknowledge the financial support of theFrench agency for radioactive waste management (Andra)and especially E. Leclerc-Cessac.
References
[1] Elie M, Faure P, Michels R, Landais P, Griffault L. Natural andlaboratory oxidation of low-organic-carbon-content sediments: com-parison of chemical changes in hydrocarbons. Energy Fuel 2000;14(4):854–61.
[2] Faure P, Landais P. Evidence of clays minerals catalytic effects duringlow-temperature air oxidation of n-alkanes. Fuel 2000;79:1751–6.
[3] Clayton JL, Swetland PJ. Subaerial weathering of sedimentaryorganic matter. Geochim Cosmochim Acta 1978;42:305–12.
[4] Faure P, Landais P, Griffault L. Behavior of organic matter fromCallovian shales during low-temperature air oxydation. Fuel 1999;78:1515–25.
[5] Charrie-Duhaut A, Lemoine S, Adam P, Connan J, Albrecht P.Abiotic oxidation of petroleum bitumens under natural conditions.Org Geochem 2000;31:977–1003.
[6] Wenclawiak BW, Jensen TE, Richert JFO. GC/MS-FID analysis ofBSTFA derivatized polar components of diesel particulate matter(NBS SRM-1650) extract. Fresenius J Anal Chem 1993;346:808–12.
[7] Kokinos JP, Eglinton TI, Goni MA, Boon JJ, Martoglios PA,Anderson DM. Characterization of a highly resistant biomacromo-lecular material in the cell wall of a marine dinoflagellate resting cyst.Org Geochem 1998;28(5):265–88.
[8] Ruau O, Landais P, Gardette JL. Quantitative analysis of powderedorganic matter by transmission infrared microspectroscopy using adiamond-window compression cell. Fuel 1997;76(7):645–53.
[9] Painter P, Rhoads C. Fourier transform infrared studies of coaloxidation. Am Chem Soc 1981;26:35–8.
[10] Bellamy LJ. 3rd ed. The infrared spectra of complex molecules, vol.2. New York: Chapman and Hall, Ltd, London, Halsted Press, JohnWiley and Sons, Inc.; 1975. p. 433.
[11] Landais P, Rochdi A. Reliability of semiquantitative data extractedfrom transmission microscopy-Fourier transform infrared spectra ofcoal. Energy Fuel 1990;4:290–5.
[12] Bray EE, Evans ED. Distribution of n-paraffins as a clue torecognition of source beds. Geochim Cosmochim Acta 1961;22:2–15.
[13] Gough MA, Rowland SJ. Characterization of unresolved com-plex mixtures of hydrocarbons in petroleum. Nature 1990;344:648–50.
[14] Peters KE, Walters CC, Moldowan JM. The Biomarker guide, seconded. II. Biomarkers and isotopes in petroleum systems and earthhistory, vol. 2. Cambridge: Cambridge University Press; 2005. p.1155.
[15] Faure P, Schlepp L, Burkle-Vitzthum V, Elie M. Low temperature airoxidation of n-alkanes in the presence of Na-smectite. Fuel 2003;82:1751–62.