~ll progress energy
TRANSCRIPT
Progress Energy
May 2, 2011
Jocelyn Boyd, Esq.Chief Clerk!AdministratorPublic Service Commission of South Carolina101 Executive Center Dr., Suite 100Columbia, SC 292 IO
RE: SCPSC Docket No. 2011- -E
Dear Mrs. Boyd:
In accordance with the Stipulation and Procedure and Mechanism for Recovery of Costsand Incentives for Demand-Side Management and Energy Efficiency ("DSM and EE") Programsapproved by the Commission's June 26, 2009 Order No. 2009-373 in Docket No. 2008-251-E,Carolina Power & Light Company, d/b/a Progress Energy Carolinas, Inc. ("PEC") herebysubmits for filing its DSMlEE Filing Requirements and the Testimony and Exhibits of Robert P.Evans.
PEe seeks Commission approval of its Demand-Side Management and EnergyEfficiency Rider DSMlEE- I, to become effective July 1,201 I.
Sincerely,
~~~0Len S. AnthonyGeneral CounselProgress Energy Carolinas. Inc.
LSA:mhm
STAREG1507
Prog,n, be"" S~mue-,IIlf, llCPO !lui l!QlRaleIgh. He 2fWl
~ll Progress Energy
May 2, 2011
Jocelyn Boyd, Esq.Chief Clerk/AdministratorPublic Service Commission of South Carolina101 Executive Center Dr., Suite 100Columbia, SC 29210
RE: SCPSC Docket No. 2011- -E
Dear Mrs. Boyd:
In accordance with the Stipulation and Procedure and Mechaiusm for Recovery of Costsand Incentives for Demand-Side Management and Energy Efficienc ("DSM and EE") Programsapproved by the Commission's June 26, 2009 Order No. 2009-373 in Docket No. 2008-251-E,Carolina Power & Light Company, d/b/a Progress Energy Carolinas, Inc. ("PEC") herebysubmits for filing its DSM/EE Filing Requirements and the Testimony and Exhibits of Robert P.Evans.
PEC seeks Commission approval of its Demand-Side Management and EnergyEfficiency Rider DSM/EE-I, to become effective July I, 2011.
Sincerely,
LSA:mhm
Len S. AnthonyGeneral CounselProgress Energy Carolinas, Inc.
STAREG1507
Prooreee Coeur Sereioe roreperro. iiCP(l arrr itolRekreih. NC 2/60?
R?~/---'---+- Robert P. Evans
Sworn to and subscribed before me,this the~ay of April, 2011.
My Commission Expires:
STAREG1S07
STATE OF NORTH CAROLINA
COUNTY OF WAKE
DOCKET NO. 2011- -E
PERSONALLY APPEARED before me, Robert P. Evans, who, after first being dulysworn, said that:
I am a Lead DSM Regulatory Specialist in Progress Energy Carolinas, Inc.'s Efficiencyand Innovative Technologies Department;
I am authorized to make this verification;
On May 2, 2011, I caused to be pre-filed seventeen (17) pages of direct testimonysupporting and explaining PEC's DSM/EE Cost Recovery Rider Application filed that samedate. This testimony and application were prepared by me or under my direct supervision andcontrol and are true and accurate,
obert P. Evans
Sworn to and subscribed before me,this the ~ay of April, 2011.
My Commission Expires:
srAREG 1507
PEC Exhibit No. 1 Filing Requirements
Page 1
Progress Energy Carolinas, Inc.
Demand Side Management and Energy Efficiency Programs
Filing Requirements
Pursuant to Procedure and Mechanism for Recovery of Costs and Incentives for Demand-Side Management and Energy Efficiency
Programs Approved in Docket No. 2008-251-E
Docket No. 2011-______ -E
May 2, 2011
Recovery request for actual DSM/EE costs incurred from April 1, 2010 through March 31, 2011 and for forecasted costs covering both the period July 1, 2011 through June 30, 2012. This request will result in the modification of rates associated with the Company’s DSM/EE rider.

PEC Exhibit No. 1 Filing Requirements
Page 2
Contents Listed By Procedural Provision
Provision (f)(2) – List of customers opting out of participation ....................................................................3
Provision (h)(1)(i) - Projected SC retail sales for the rate period ..................................................................4
Provision (h)(1)(ii)a - Total expenses expected to be incurred during the rate period ................................5
Provision (h)(1)(ii)b - Expected cost associated with measures ....................................................................8
Provision (h)(1)(ii)c - Measurement and verification activities for rate period ............................................9
Provision (h)(1)(ii)d - Expected summer and winter peak demand reductions ......................................... 12
Provision (h)(1)(ii)e - Expected energy reductions ..................................................................................... 13
Provision (h)(1)(ii)f - Actual test period costs ............................................................................................. 14
Provision (h)(1)(ii)g – Test period costs associated with measures ........................................................... 17
Provision (h)(1)(ii)h - Measurement and verification activities for test period ......................................... 18
Provision (h)(1)(ii)i - Test period summer and winter peak demand reductions ....................................... 22
Provision (h)(1)(ii)j - Test period energy reductions .................................................................................. 23
Provision (h)(1)(ii)k - Test period findings and results of measures ........................................................... 24
Provision (h)(1)(ii)l - Evaluation of event based measure during test period ............................................ 28
Provision (h)(1)(ii)m – Comparison of impact estimates............................................................................ 30
Provision (h)(1)(ii)n – Determination of utility incentives .......................................................................... 33
Provision (h)(1)(ii)o – Actual revenue from DSM/EE rider ......................................................................... 37
Provision (h)(1)(ii)p – Proposed DSM/EE rider ........................................................................................... 38
Provision (h)(1)(ii)q – Projected SC retail sales for customers opting out of measures ............................ 39
Provision (h)(2) – Supporting workpapers ................................................................................................. 40
Appendix A: Non-Participating Customers ................................................................................................ 41
Appendix B: Allocation Factors .................................................................................................................. 45
Appendix C: Savings By Measure................................................................................................................ 47

PEC Exhibit No. 1 Filing Requirements
Page 3
Provision (f)(2) – List of customers opting out of participation (f) Special Provisions for Industrial or Large Commercial Customers.
(2) At the time the electric public utility petitions for the annual rider, it shall provide the Commission with a list of those industrial or large commercial customers that have opted out of participation in the new demand-side management or energy efficiency measures.
Please refer to Appendix A which provides a listing of industrial and large commercial customers, as of
March 31, 2011, that have opted out of participation in PEC’s new demand-side management or energy
efficiency measures.
PEC Exhibit No. 1 Filing Requirements
Page 4
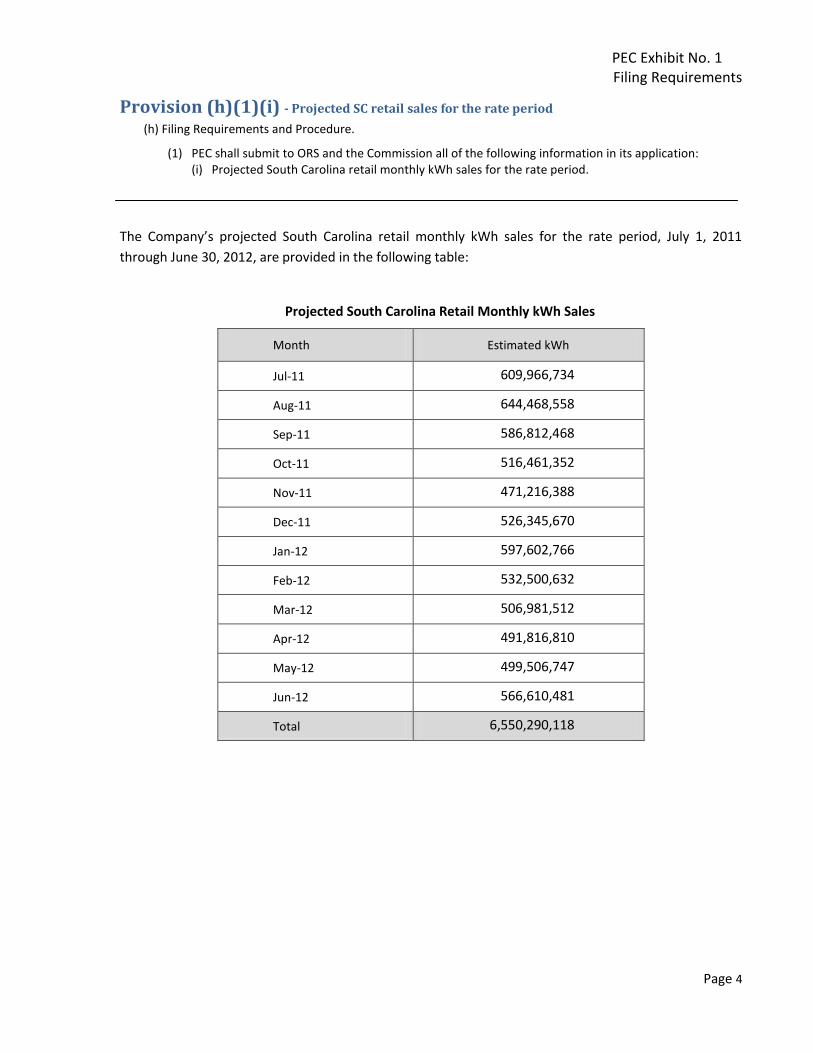
Provision (h)(1)(i) - Projected SC retail sales for the rate period (h) Filing Requirements and Procedure.
(1) PEC shall submit to ORS and the Commission all of the following information in its application: (i) Projected South Carolina retail monthly kWh sales for the rate period.
The Company’s projected South Carolina retail monthly kWh sales for the rate period, July 1, 2011
through June 30, 2012, are provided in the following table:
Projected South Carolina Retail Monthly kWh Sales
Month Estimated kWh
Jul-11 609,966,734
Aug-11 644,468,558
Sep-11 586,812,468
Oct-11 516,461,352
Nov-11 471,216,388
Dec-11 526,345,670
Jan-12 597,602,766
Feb-12 532,500,632
Mar-12 506,981,512
Apr-12 491,816,810
May-12 499,506,747
Jun-12 566,610,481
Total 6,550,290,118

PEC Exhibit No. 1 Filing Requirements
Page 5
Provision (h)(1)(ii)a - Total expenses expected to be incurred during the rate period (h) Filing Requirements and Procedure.
(1) PEC shall submit to ORS and the Commission all of the following information in its application: (ii) For each DSM/EE program for which cost recovery is requested:
a. total expenses expected to be incurred during the rate period in the aggregate and broken down by type of expenditure, per appropriate capacity, energy and measure unit metric and the proposed jurisdictional allocation factors;
For purposes of cost recovery through the DSM/EE rider, the Company’s expected expenses for the rate
period, July 1, 2011 through June 30, 2012, have been broken down by type of expenditure and
provided in the following table:
Program / Measure O&M Depreciation Capital Costs
Income and General
Taxes
PPI and Net Lost
Revenue
Total Costs and
Incentives
CIG DR 2,664,124 202,258 2,866,382
EnergyWiseTM
12,068,046 1,071,039 13,139,085
DSDR Implementation 9,470,693 6,634,479 9,423,347 5,389,546 - 30,918,065
Res Home Advantage 1,643,620 502,017 2,145,637
Res Home Energy Improve. 7,621,583 1,102,311 8,723,894
Res identia l Low Income-NES 1,965,343 551,991 2,517,334
Res identia l Lighting 6,006,892 10,189,068 16,195,960
Res Appl iance Recycl ing 1,910,544 699,249 2,609,793
Res identia l EE Benchmark 935,091 864,625 1,799,716
Solar Hot Water Heating Pi lot 9,746 - 9,746
CIG Energy Efficiency 8,046,311 6,728,339 14,774,650
CFL Pi lot - 74,224 74,224
Program Subtotals 52,341,993 6,634,479 9,423,347 5,389,546 21,985,122 95,774,487
2,694,172
7,928,641
106,397,300
Carrying Costs
Expenditure Totals
Adminis trative and General
Recoverable Expenditures (System Retai l )
Demand-Side Management Programs
Energy Efficiency Programs

PEC Exhibit No. 1 Filing Requirements
Page 6
Provision (h)(1)(ii)a - Continued
The following table provides the program costs, excluding Program Performance Incentives and the
recovery of net lost revenues, per appropriate capacity, energy and measure unit metric, over the
various program lives. It is important to note that unitized costs will vary from year to year and should
be viewed over program lives. Program cost estimates over the life of the program were supplied with
the Company’s original program applications.
Program / Measure System Costs DSM Costs / (MW x
Years) 1
EE Costs / (MWH x
Years) 2
Demand-Side Management Programs (Calculated on EOY 2011 MW Capabilities - at the meter)
CIG DR $ 2,664,124 $3,747 NA
EnergyWiseTM 12,068,046 $4,072 NA
DSDR Implementation 30,918,065 $9,543 NA
Energy Efficiency Programs (Calculated Using Incremental 2011 MWH Savings - at the meter)
Res Home Advantage 1,643,620 NA $25
Res Home Energy Improvement 7,621,583 NA $78
Residential Low Income-NES 1,965,343 NA $46
Residential Lighting 6,006,892 NA $12
Res Appliance Recycling 1,910,544 NA $30
Residential EE Benchmark 935,091 NA $65
Solar Hot Water Heating Pilot3 9,746 NA NA
CIG Energy Efficiency 8,046,311 NA $10
CFL Pilot NA NA NA
1 DSM programs statistics, by their nature, do not reflect energy related savings.
2 EE program statistics, by their nature, do not reflect capacity related savings.
3 Solar Water Heating Program statistics will be determined through 2011 M&V evaluation.

PEC Exhibit No. 1 Filing Requirements
Page 7
Provision (h)(1)(ii)a - Continued
For purposes of cost recovery through the South Carolina DSM/EE rider, the Company’s expected
expenses for the rate period, July 1, 2011 through June 30, 2012, have been broken down for South
Carolina jurisdictional retail customers by type of expenditure and provided in the following table:
The Company’s proposed jurisdictional allocation factors for the rate period, July 1, 2011 through June
30, 2012, are provided in attached Appendix B.
Program / Measure O&M Depreciation Capital Costs
Income and General
Taxes
PPI and Net Lost
Revenue
Total Costs and
Incentives
CIG DR 359,923 27,992 387,915
EnergyWise TM 1,630,393 148,232 1,778,625
DSDR Implementation 1,291,893 905,006 1,285,434 886,874 - 4,369,207
Res Home Advantage 237,832 70,835 308,667
Res Home Energy Improve. 1,102,843 155,536 1,258,379
Res identia l Low Income-NES 284,385 77,886 362,271
Res identia l Lighting 869,197 1,437,677 2,306,874
Res Appl iance Recycl ing 276,456 98,664 375,120
Res identia l EE Benchmark 135,308 121,999 257,307
Solar Hot Water Heating Pi lot 1,410 - 1,410
CIG Energy Efficiency 1,164,301 949,369 2,113,670
CFL Pi lot - 10,473 10,473
Program Subtotals 7,353,941 905,006 1,285,434 886,874 3,098,663 13,529,918
380,719
1,210,732
15,121,369
Recoverable Expenditures (South Carol ina)
Demand-Side Management Programs
Energy Efficiency Programs
Carrying Costs with Income Taxes
Expenditure Totals
Adminis trative and General

PEC Exhibit No. 1 Filing Requirements
Page 8
Provision (h)(1)(ii)b - Expected cost associated with measures
(h) Filing Requirements and Procedure.
(1) PEC shall submit to ORS and the Commission all of the following information in its application: (ii) For each DSM/EE program for which cost recovery is requested:
b. total costs that PEC expects to incur during the rate period as a direct result of the measure in the aggregate and broken down by type of cost, per appropriate capacity, energy and measure unit metric, and the proposed jurisdictional allocation factors as well as any changes in the estimated future amounts since last filed with the Commission;
The total costs that PEC expects to incur during the rate period as a direct result of the measure in the
aggregate and broken down by type of cost, per appropriate capacity, energy and measure unit metric,
are provided in Provision (h)(1)(ii)a. The Company’s proposed jurisdictional allocation factors for the
rate period, July 1, 2011 through June 30, 2012, are provided in attached Appendix B. In terms of
variations in estimated future amounts since its last reporting, PEC is currently unaware of any material
differences associated with its offerings.
PEC Exhibit No. 1 Filing Requirements
Page 9
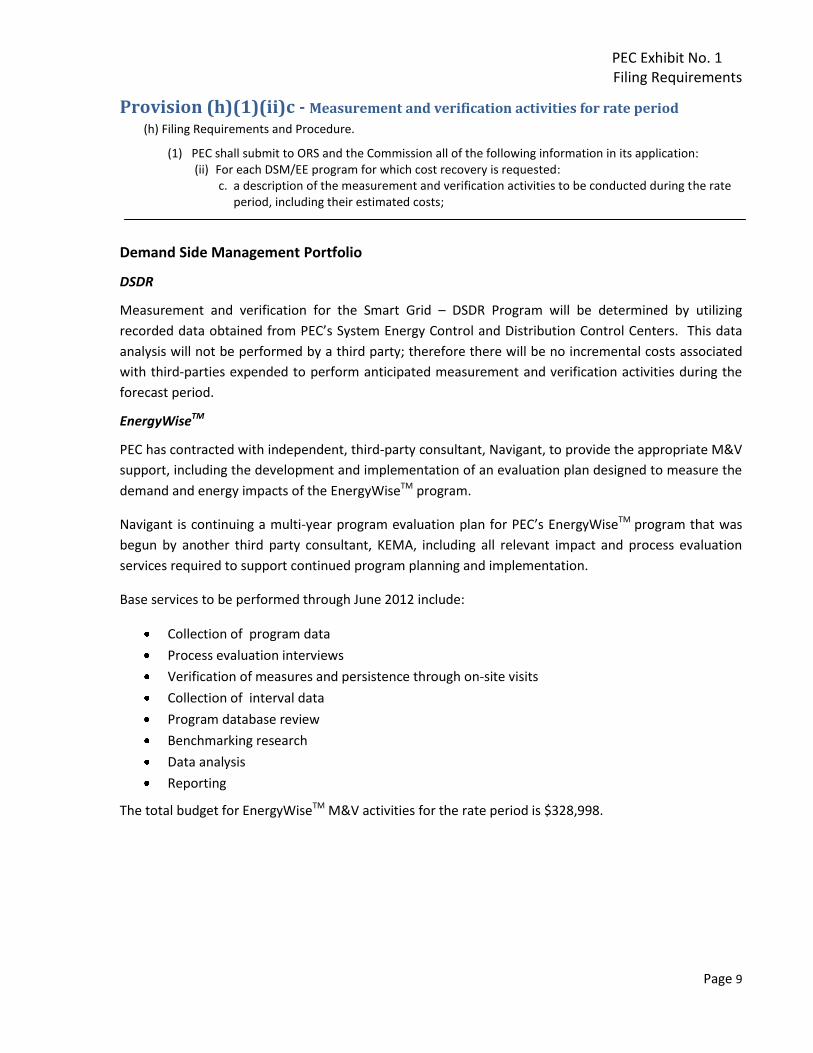
Provision (h)(1)(ii)c - Measurement and verification activities for rate period
(h) Filing Requirements and Procedure.
(1) PEC shall submit to ORS and the Commission all of the following information in its application: (ii) For each DSM/EE program for which cost recovery is requested:
c. a description of the measurement and verification activities to be conducted during the rate period, including their estimated costs;
Demand Side Management Portfolio
DSDR
Measurement and verification for the Smart Grid – DSDR Program will be determined by utilizing
recorded data obtained from PEC’s System Energy Control and Distribution Control Centers. This data
analysis will not be performed by a third party; therefore there will be no incremental costs associated
with third-parties expended to perform anticipated measurement and verification activities during the
forecast period.
EnergyWiseTM
PEC has contracted with independent, third-party consultant, Navigant, to provide the appropriate M&V
support, including the development and implementation of an evaluation plan designed to measure the
demand and energy impacts of the EnergyWiseTM program.
Navigant is continuing a multi-year program evaluation plan for PEC’s EnergyWiseTM program that was
begun by another third party consultant, KEMA, including all relevant impact and process evaluation
services required to support continued program planning and implementation.
Base services to be performed through June 2012 include:
Collection of program data
Process evaluation interviews
Verification of measures and persistence through on-site visits
Collection of interval data
Program database review
Benchmarking research
Data analysis
Reporting
The total budget for EnergyWiseTM M&V activities for the rate period is $328,998.
PEC Exhibit No. 1 Filing Requirements
Page 10
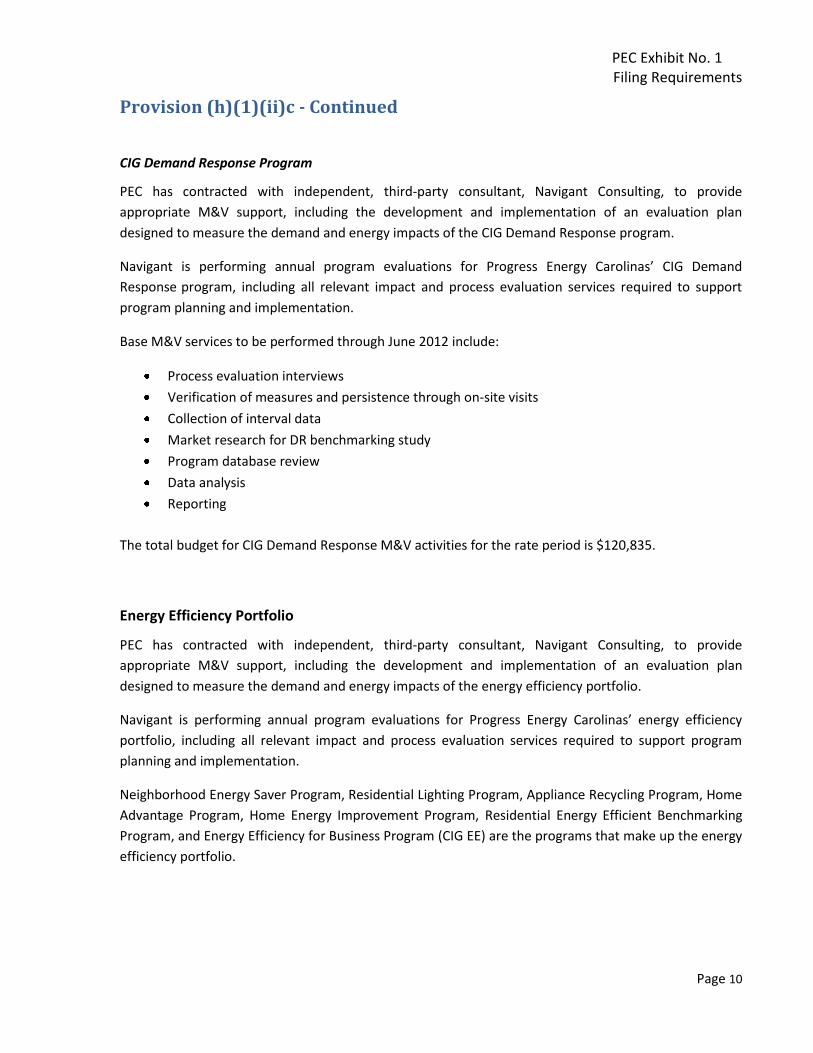
Provision (h)(1)(ii)c - Continued
CIG Demand Response Program
PEC has contracted with independent, third-party consultant, Navigant Consulting, to provide
appropriate M&V support, including the development and implementation of an evaluation plan
designed to measure the demand and energy impacts of the CIG Demand Response program.
Navigant is performing annual program evaluations for Progress Energy Carolinas’ CIG Demand
Response program, including all relevant impact and process evaluation services required to support
program planning and implementation.
Base M&V services to be performed through June 2012 include:
Process evaluation interviews
Verification of measures and persistence through on-site visits
Collection of interval data
Market research for DR benchmarking study
Program database review
Data analysis
Reporting
The total budget for CIG Demand Response M&V activities for the rate period is $120,835.
Energy Efficiency Portfolio
PEC has contracted with independent, third-party consultant, Navigant Consulting, to provide
appropriate M&V support, including the development and implementation of an evaluation plan
designed to measure the demand and energy impacts of the energy efficiency portfolio.
Navigant is performing annual program evaluations for Progress Energy Carolinas’ energy efficiency
portfolio, including all relevant impact and process evaluation services required to support program
planning and implementation.
Neighborhood Energy Saver Program, Residential Lighting Program, Appliance Recycling Program, Home
Advantage Program, Home Energy Improvement Program, Residential Energy Efficient Benchmarking
Program, and Energy Efficiency for Business Program (CIG EE) are the programs that make up the energy
efficiency portfolio.

PEC Exhibit No. 1 Filing Requirements
Page 11
Provision (h)(1)(ii)c - Continued
Base M&V services to be performed through June 2012 for all energy efficiency portfolio programs
include:
Development of evaluation action plan
Process evaluation interviews
Collection of program data
Verification of measures and persistence through on-site visits
Program database review
Data analysis
Reporting
Rate period budget for EE portfolio M&V activities is summarized in the following table
Program Rate Period Budget
Neighborhood Energy Saver $ 115,248
Residential Lighting 209,919
Appliance Recycling 96,753
Home Advantage 136,750
Home Energy Improvement 124,421
Energy Efficiency for Business 443,750

PEC Exhibit No. 1 Filing Requirements
Page 12
Provision (h)(1)(ii)d - Expected summer and winter peak demand reductions (h) Filing Requirements and Procedure.
(1) PEC shall submit to ORS and the Commission all of the following information in its application: (ii) For each DSM/EE program for which cost recovery is requested:
d. total expected summer and winter peak demand reduction per appropriate capacity, energy, and measure unit metric and in the aggregate;
The following tables provide estimated summer and winter cumulative peak demand reductions, at the
meter, for the measures in which the Company is seeking cost recovery1. The reductions are provided
by measure and in aggregate.
Expected Summer Peak Demand Reduction (MW)
CIG DR
Energy WiseTM
DSDR Res Home Advantage
Residential HEIP
Res Low Income
Res Lighting
Res Appl. Recycling
Res EE Bench-marki
CIG Energy
Efficiency
CFL Pilot Total
2011 23.7 93.5 108.0 2.2 12.6 1.4 14.3 1.7 2.6 20.2 0.6 280.8
2012 37.7 133.5 241.0 4.2 18.4 2.0 20.6 3.5 2.6 31.2 0.6 495.3
2013 51.8 170.6 248.8 7.1 24.8 2.7 25.7 5.5 2.1 43.4 0.6 583.1
2014 65.8 207.7 257.4 10.6 31.8 3.3 29.8 7.9 2.6 56.3 0.6 673.8
Expected Winter Peak Demand Reduction (MW)2
CIG DR
Energy WiseTM
DSDR Res Home Advantage
Residential HEIP
Res Low Income
Res Lighting
Res Appl. Recycling
Res EE Bench-mark
CIG Energy
Efficiency
CFL Pilot Total
2011 - 5.3 - - - - - - - - 0.7 6.0
2012 - 7.4 - - - - - - - - 0.7 8.1
2013 - 9.5 - - - - - - - - 0.7 10.2
2014 - 11.7 - - - - - - - - 0.7 12.4
1 Values associated with PEC’s Residential Solar Hot Water Heating Program will be supplied upon completion of
measurement and verification process. 2 With the exception of PEC’s EnergyWise
TM program, PEC’s DSM/EE measures are focused on its summer peak.
The winter peak reductions associated with PEC’s measures, including those from the EnergyWiseTM program, will be determined through the measurement and verification (M&V) process. The Company’s CFL Pilot benefits are based on M&V results.

PEC Exhibit No. 1 Filing Requirements
Page 13
Provision (h)(1)(ii)e - Expected energy reductions (h) Filing Requirements and Procedure.
(1) PEC shall submit to ORS and the Commission all of the following information in its application: (ii) For each DSM/EE program for which cost recovery is requested:
e. total expected energy reduction in the aggregate and per appropriate capacity, energy and measure unit metric
The following table provides estimated cumulative energy reductions, at the meter, for the measures in
which the Company is seeking cost recovery1. The reductions are provided both by measure and in
aggregate.
Expected Energy Reductions (MWH)
CIG DR
Energy WiseTM
DSDR Res Home Advantage
Residential HEIP
Res Low Income
Res Lighting
Res Appl. Recycling
Res EE Bench-mark
CIG Energy
Efficiency
CFL Pilot Total
2011 317 333 30,275 6,242 13,11 9,119 150,739 10,334 14,400 89,806 6,706 331,782
2012 570 626 54,931 11,426 20,520 13,295 217,774 18,210 14,400 134,983 6,706 493,441
2013 823 834 56,082 19,174 28,229 17,471 271,402 27,582 11,520 185,200 6,706 625,023
2014 1,076 1236 57,194 28,303 36,710 21,647 314,304 38,528 14,400 238,200 6,706 758,304
1 Values associated with PEC’s Residential Solar Hot Water Heating Program will be supplied upon completion of
measurement and verification process.
PEC Exhibit No. 1 Filing Requirements
Page 14
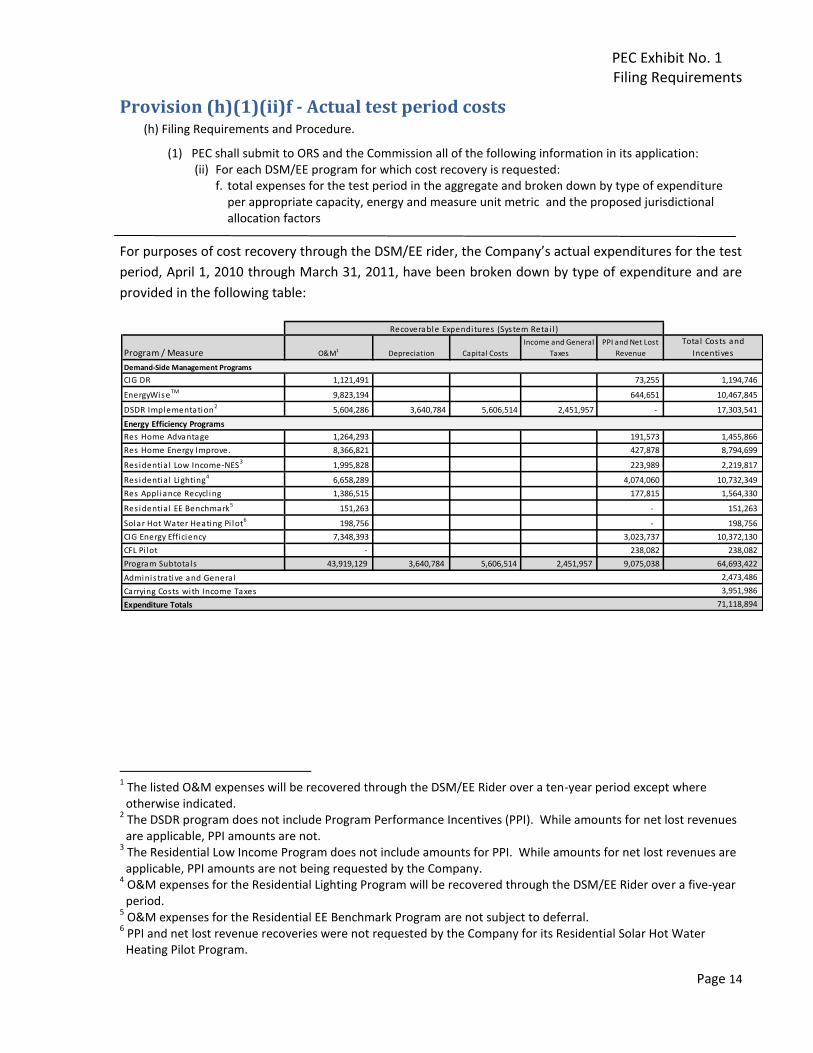
Provision (h)(1)(ii)f - Actual test period costs (h) Filing Requirements and Procedure.
(1) PEC shall submit to ORS and the Commission all of the following information in its application: (ii) For each DSM/EE program for which cost recovery is requested:
f. total expenses for the test period in the aggregate and broken down by type of expenditure per appropriate capacity, energy and measure unit metric and the proposed jurisdictional allocation factors
For purposes of cost recovery through the DSM/EE rider, the Company’s actual expenditures for the test
period, April 1, 2010 through March 31, 2011, have been broken down by type of expenditure and are
provided in the following table:
O&M1 DSDR Implementation2 Residential Low Income-NES3 Residential Lighting4 Residential EE Benchmark5 Solar Hot Water Heating Pilot6
1 The listed O&M expenses will be recovered through the DSM/EE Rider over a ten-year period except where otherwise indicated.
2 The DSDR program does not include Program Performance Incentives (PPI). While amounts for net lost revenues are applicable, PPI amounts are not.
3 The Residential Low Income Program does not include amounts for PPI. While amounts for net lost revenues are applicable, PPI amounts are not being requested by the Company.
4 O&M expenses for the Residential Lighting Program will be recovered through the DSM/EE Rider over a five-year period.
5 O&M expenses for the Residential EE Benchmark Program are not subject to deferral.
6 PPI and net lost revenue recoveries were not requested by the Company for its Residential Solar Hot Water Heating Pilot Program.
Program / Measure O&M1 Depreciation Capital Costs
Income and General
Taxes
PPI and Net Lost
Revenue
Total Costs and
Incentives
CIG DR 1,121,491 73,255 1,194,746
EnergyWise TM 9,823,194 644,651 10,467,845
DSDR Implementation2
5,604,286 3,640,784 5,606,514 2,451,957 - 17,303,541
Res Home Advantage 1,264,293 191,573 1,455,866
Res Home Energy Improve. 8,366,821 427,878 8,794,699
Res identia l Low Income-NES3
1,995,828 223,989 2,219,817
Res identia l Lighting4 6,658,289 4,074,060 10,732,349
Res Appl iance Recycl ing 1,386,515 177,815 1,564,330
Res identia l EE Benchmark5 151,263 - 151,263
Solar Hot Water Heating Pi lot6
198,756 - 198,756
CIG Energy Efficiency 7,348,393 3,023,737 10,372,130
CFL Pi lot - 238,082 238,082
Program Subtotals 43,919,129 3,640,784 5,606,514 2,451,957 9,075,038 64,693,422
2,473,486
3,951,986
71,118,894 Expenditure Totals
Adminis trative and General
Recoverable Expenditures (System Retai l )
Demand-Side Management Programs
Energy Efficiency Programs
Carrying Costs with Income Taxes

PEC Exhibit No. 1 Filing Requirements
Page 15
Provision (h)(1)(ii)f – Continued For purposes of cost recovery through the South Carolina DSM/EE rider, the Company’s actual expenses
for the test period, April 1, 2010 through March 31, 2011, have been broken down for South Carolina
jurisdictional retail customers by type of expenditure and are provided in the following table:
O&M1DSDR Implementation2 Residential Low Income-NES3 Residential Lighting4 Residential EE Benchmark5 Solar Hot Water Heating Pilot6
1 The listed O&M expenses will be recovered through the DSM/EE Rider over a ten-year period except where otherwise indicated.
2 The DSDR program does not include Program Performance Incentives (PPI). While amounts for net lost revenues are applicable, PPI amounts are not.
3 The Residential Low Income Program does not include amounts for PPI. While amounts for net lost revenues are applicable, PPI amounts are not being requested by the Company.
4 O&M expenses for the Residential Lighting Program will be recovered through the DSM/EE Rider over a five-year period
5 O&M expenses for the Residential EE Benchmark Program are not subject to deferral.
6 PPI and net lost revenue recoveries were not requested by the Company for its Residential Solar Hot Water Heating Pilot Program.
Program / Measure O&M1 Depreciation Capital Costs
Income and General
Taxes
PPI and Net Lost
Revenue
Total Costs and
Incentives
CIG DR 158,098 9,897 167,995
EnergyWise TM 1,384,322 87,092 1,471,414
DSDR Implementation2
793,881 515,874 794,279 397,116 - 2,501,150
Res Home Advantage 184,768 27,721 212,489
Res Home Energy Improve. 1,222,405 61,914 1,284,319
Res identia l Low Income-NES3
294,637 32,411 327,048
Res identia l Lighting4 970,544 589,516 1,560,060
Res Appl iance Recycl ing 202,421 25,730 228,151
Res identia l EE Benchmark5 22,114 - 22,114
Solar Hot Water Heating Pi lot6
29,055 - 29,055
CIG Energy Efficiency 1,074,827 437,535 1,512,362
CFL Pi lot - 34,450 34,450
Program Subtotals 6,337,072 515,874 794,279 397,116 1,306,266 9,350,607
357,060
617,739
10,325,406
Recoverable Expenditures (South Carol ina Retai l )
Demand-Side Management Programs
Energy Efficiency Programs
Carrying Costs with Income Taxes
Expenditure Totals
Adminis trative and General
PEC Exhibit No. 1 Filing Requirements
Page 16
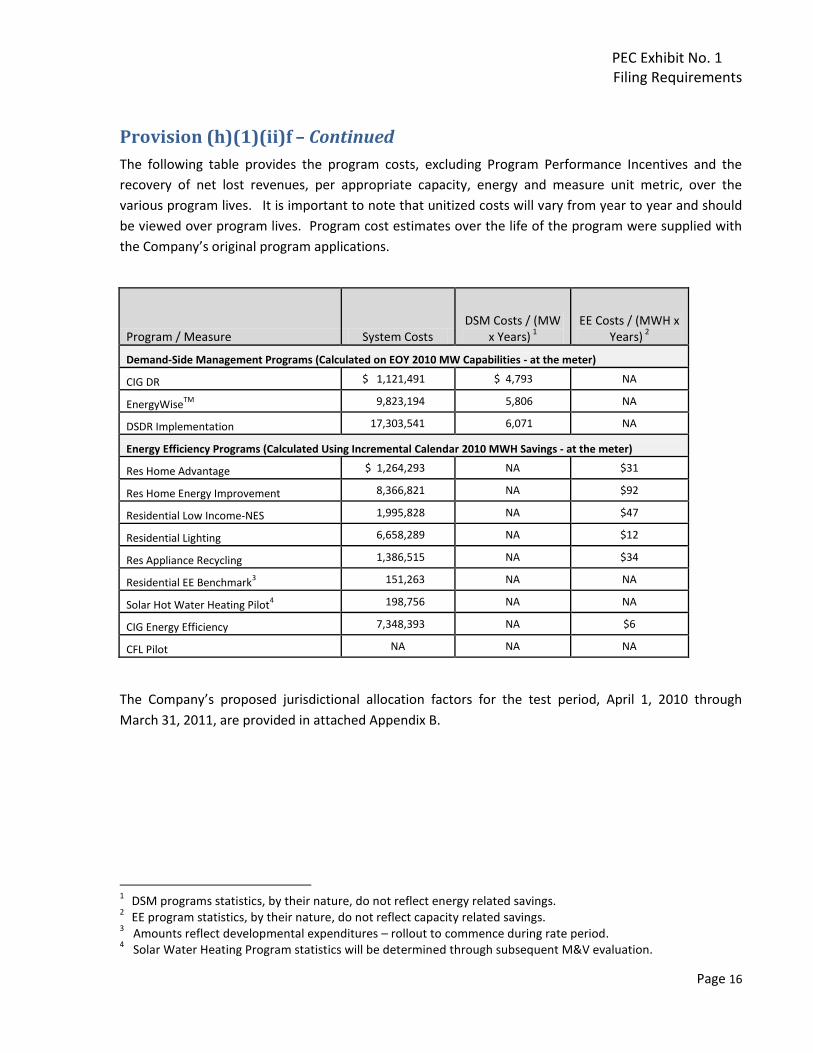
Provision (h)(1)(ii)f – Continued
The following table provides the program costs, excluding Program Performance Incentives and the
recovery of net lost revenues, per appropriate capacity, energy and measure unit metric, over the
various program lives. It is important to note that unitized costs will vary from year to year and should
be viewed over program lives. Program cost estimates over the life of the program were supplied with
the Company’s original program applications.
Program / Measure System Costs DSM Costs / (MW
x Years) 1
EE Costs / (MWH x
Years) 2
Demand-Side Management Programs (Calculated on EOY 2010 MW Capabilities - at the meter)
CIG DR $ 1,121,491 $ 4,793 NA
EnergyWiseTM
9,823,194 5,806 NA
DSDR Implementation 17,303,541 6,071 NA
Energy Efficiency Programs (Calculated Using Incremental Calendar 2010 MWH Savings - at the meter)
Res Home Advantage $ 1,264,293 NA $31
Res Home Energy Improvement 8,366,821 NA $92
Residential Low Income-NES 1,995,828 NA $47
Residential Lighting 6,658,289 NA $12
Res Appliance Recycling 1,386,515 NA $34
Residential EE Benchmark3 151,263 NA NA
Solar Hot Water Heating Pilot4 198,756 NA NA
CIG Energy Efficiency 7,348,393 NA $6
CFL Pilot NA NA NA
The Company’s proposed jurisdictional allocation factors for the test period, April 1, 2010 through
March 31, 2011, are provided in attached Appendix B.
1 DSM programs statistics, by their nature, do not reflect energy related savings.
2 EE program statistics, by their nature, do not reflect capacity related savings.
3 Amounts reflect developmental expenditures – rollout to commence during rate period.
4 Solar Water Heating Program statistics will be determined through subsequent M&V evaluation.

PEC Exhibit No. 1 Filing Requirements
Page 17
Provision (h)(1)(ii)g – Test period costs associated with measures
(h) Filing Requirements and Procedure.
(1) PEC shall submit to ORS and the Commission all of the following information in its application: (ii) For each DSM/EE program for which cost recovery is requested:
g. total costs that PEC incurred for the test period as a direct result of the measure in the aggregate and broken down by type of cost per appropriate capacity, energy and measure unit metric, and the proposed jurisdictional allocation factors, as well as any changes in the estimated future amounts since last filed with the Commission;
The total costs that PEC incurred for the test period as a direct result of the measure in the aggregate
and broken down by type of cost per appropriate capacity, energy and measure unit metric are provided
in the table on the preceding page. A further breakdown of unit metrics associated with test period
activity is provided on attached Appendix C. PEC’s proposed jurisdictional allocation factors have been
provided on attached Appendix B. In terms of variations in estimated future amounts, PEC is currently
unaware of any material differences associated with its offerings.
PEC Exhibit No. 1 Filing Requirements
Page 18
Provision (h)(1)(ii)h - Measurement and verification activities for test period
(h) Filing Requirements and Procedure.
(1) PEC shall submit to ORS and the Commission all of the following information in its application: (ii) For each DSM/EE program for which cost recovery is requested:
h. a description of, the results of, and the costs of all measurement and verification activities conducted in the test period;
Demand Side Management Portfolio
DSDR
Measurement and verification for the Smart Grid – DSDR Program will be determined by utilizing
recorded data obtained from PEC’s System Energy Control and Distribution Control Centers. This data
analysis will not be performed by a third party; therefore there will be no third-party incremental costs
expended to perform anticipated measurement and verification activities during the forecast period.
EnergyWiseTM
PEC contracted with independent, third-party consultant, KEMA, to provide the appropriate M&V
support, including the development and implementation of an evaluation plan designed to measure the
demand and energy impacts of the EnergyWiseTM program.
KEMA conducted the initial phase of a multi-year program evaluation plan for Progress Energy Carolinas’
EnergyWiseTM program, including all relevant impact and process evaluation services required to support
continued program planning and implementation.
Preliminary M&V results for the 2009 Summer and 2009/2010 Winter are contained in the M&V report,
dated December 28, 2010 and filed with the Commission on December 30, 2010.
Base M&V services performed through March 2011 include:
Process evaluation surveys and interviews
End-use interval amperage metering
Communications equipment inspections
Confirmation of signal receipt
Estimation of a normal-use load model
Estimation of over-ride rates
Estimation of control success rate
Actual and projected program impacts
Total cost of EnergyWiseTM M&V activities for the test period through March 2011 was $285,128.
PEC Exhibit No. 1 Filing Requirements
Page 19
Provision (h)(1)(ii)h – Continued
CIG Demand Response Program
PEC has contracted with independent, third-party consultant, Navigant Consulting, to provide the
appropriate M&V support, including the development and implementation of an evaluation plan
designed to measure the demand and energy impacts of the CIG Demand Response program.
Navigant is currently performing a complete program evaluation for PEC’s CIG Demand Response
program, including all relevant impact and process evaluation services required to support program
planning and implementation.
Base M&V services performed through March 2011 include:
Development of evaluation action plan
Collection of interval data
Process evaluation interviews
Market research for DR benchmarking study
Total cost of CIG Demand Response M&V activities for the test period through March 2011 was $38,032.
Energy Efficiency Portfolio
PEC has contracted with independent, third-party consultant, Navigant Consulting, to provide
appropriate M&V support, including the development and implementation of an evaluation plan
designed to measure the demand and energy impacts of the energy efficiency portfolio.
Navigant is performing annual program evaluations for Progress Energy Carolinas’ energy efficiency
portfolio, including all relevant impact and process evaluation services required to support program
planning and implementation.
Neighborhood Energy Saver Program Base M&V services performed through March 2011 include:
Development of evaluation action plan
Collection of program data
Process evaluation interviews
Secondary research of ongoing reviewing results of recent existing homes programs
Total cost of Neighborhood Energy Saver M&V activities for the test period through March 2011 was
$38,990.

PEC Exhibit No. 1 Filing Requirements
Page 20
Provision (h)(1)(ii)h – Continued Residential Lighting Program Base M&V services performed through March 2011 include:
Development of evaluation action plan
Process evaluation interviews
Collection of program data
Total cost of Residential Lighting Program M&V activities for the test period through March 2011 was
$50,003.
Appliance Recycling Program
Base M&V services performed through March 2011 include:
Development of evaluation action plan
Process evaluation interviews
Collection of program data
Perform evaluation requests of NCUC
Total cost of Appliance Recycling Program M&V activities for the test period through March 2011 was
$15,218.
Home Advantage Program
Base M&V services performed through March 2011 include:
Development of evaluation action plan
Process evaluation interviews
Collection of program data
Program database review
Data analysis
Total cost of Home Advantage M&V activities for the test period through March 2011 was $62,020.
PEC Exhibit No. 1 Filing Requirements
Page 21
Provision (h)(1)(ii)h – Continued
Home Energy Improvement Program
Base M&V services performed through March 2011 include:
Development of evaluation action plan
Process evaluation interviews
Collection of program data
Verification of measures and persistence through on-site visits
Program database review
Data analysis
Reporting
M&V results for the year 2009 are contained in the Home Energy Improvement EM&V report dated
April 11, 2011 and filed with Commission on April 25, 2011.
Total cost of Home Energy Improvement M&V activities for the test period through March 2011 was
$217,577.
Energy Efficiency for Business Program (CIG EE)
Base M&V services performed through March 2011 include:
Development of evaluation action plan
Process evaluation interviews
Collection of program data
Verification of measures and persistence through on-site visits
Program database review
Data analysis
Reporting
Total cost of Energy Efficiency for Business Program M&V activities for the test period through March
2011 was $323,353.

PEC Exhibit No. 1 Filing Requirements
Page 22
Provision (h)(1)(ii)i - Test period summer and winter peak demand reductions
(h) Filing Requirements and Procedure.
(1) PEC shall submit to ORS and the Commission all of the following information in its application: (ii) For each DSM/EE program for which cost recovery is requested:
i. total summer and winter peak demand reduction per appropriate capacity, energy, and measure unit metric and in the aggregate, as well as any changes in estimated future amounts;
The information associated with this section has been supplied as a part of Provision (h)(1)(ii)m.
PEC Exhibit No. 1 Filing Requirements
Page 23
Provision (h)(1)(ii)j - Test period energy reductions (h) Filing Requirements and Procedure.
(1) PEC shall submit to ORS and the Commission all of the following information in its application: (ii) For each DSM/EE program for which cost recovery is requested:
j. total energy reduction in the aggregate and per appropriate capacity, energy and measure unit metric, as well as any changes in the estimated future amounts since last filed with the Commission;
The information associated with this section has been supplied as a part of Provision (h)(1)(ii)m and
within attached Appendix C.

PEC Exhibit No. 1 Filing Requirements
Page 24
Provision (h)(1)(ii)k - Test period findings and results of measures
(h) Filing Requirements and Procedure.
(1) PEC shall submit to ORS and the Commission all of the following information in its application: (ii) For each DSM/EE program for which cost recovery is requested:
k. a discussion of the findings and the results of the program or measure;
Neighborhood Energy Saver
The Neighborhood Energy Saver (NES) Program was launched in October 2009 to provide
education and energy conservation measures to encourage the reduction of energy
consumption in low-income homes. A comprehensive package of energy conservation
measures is installed in the homes of low-income families to assist them in reducing their overall
energy use and household energy costs. The Program has served 4,901 participants since April
2010. The program has experienced greater than expected program participation within each
targeted neighborhood with over 85% of solicited eligible residents choosing to participate and
receive program services.
Participation success can be attributed to the efforts made in advance to disseminate
information about the program to residents, working with the local community leaders and
advocacy groups, and the work of the installer teams to ensure every resident’s home has been
contacted.
Home Advantage Program
The Home Advantage Program was launched in January 2009 to encourage home builders and
residential developers to build to ENERGY STAR standards and to install HVAC systems with
greater efficiency ratings than the applicable building code requirements. While participation
was nominal in 2009 partially as a result of the recession and the distressed housing industry,
participation levels rebounded in 2010. For 2010, with 2,203 ENERGY STAR homes built. Of
those, 949 (43%) were Home Advantage homes.
Residential Lighting Program
The Residential Lighting Program was launched in January of 2010. This program utilizes
Compact Fluorescent Light (CFL) bulb manufacturers and retailers to offer PEC customers
discounts at the register when purchasing CFLs. Participation levels for the first twelve months
of the program were higher than originally forecasted. This can be attributed to high customer
interest, low socket penetration of CFLs in the PEC territory and effective promotion of this
program in the marketplace. As the industry moves in the coming years to offer products that
meet new efficiency standards, PEC will evaluate and modify the Residential Lighting Program as
necessary to continue to encourage customer adoption of energy efficient lighting. Continued

PEC Exhibit No. 1 Filing Requirements
Page 25
Provision (h)(1)(ii)k – Continued
customer education will also be imperative to ensure customers are purchasing the right bulb
for the application in order to obtain high satisfaction with this product.
Appliance Recycling Program
The Appliance Recycling Program was launched in mid-April of 2010. Participation levels for the
first year of the program are in line with Program expectations (projected 7,439 units, recycled
8,150 units).
Overall program success can be attributed to customer interest in energy efficiency, PEC’s
rebates, and customer acceptance and appreciation of the environmental benefits associated
with appliance recycling.
Solar Water Heating Pilot Program
The Solar Water Heating Pilot Program launched in June 2009. The purpose of the program is to
determine and validate achievable energy savings associated with residential solar water
heating technologies. A challenge has been that enrollment in the program has been slower
than expected. Monitoring equipment has been installed and captured winter data, and
summer data will be captured in the next few months. A final report is expected to be released
in late summer of 2011.
Home Energy Improvement Program
The Home Energy Improvement Program was launched in July of 2009. The purpose of this
program is to offer customers a variety of energy conservation measures designed to increase
energy efficiency in existing residential dwellings. The program utilizes a network of over 800
prequalified contractors that customers can use to install energy efficiency measures.
Participation levels since the launch of the program are higher than originally forecasted. The
overall program success can be attributed to higher customer interest in energy efficiency,
customers capitalizing on the 2010 federal tax credits in conjunction with PEC’s rebates, and
promotion of the program by contractors. Promotion of the program includes consumer and
contractor program flyers, direct mail, bill inserts, email blasts, trade shows to consumers and
contractor collateral to support the contractor network. The current economy will likely
continue to have a negative impact on program participation due to less disposable income and
the reduction in the 2011 federal tax credit incentive, which makes it harder to justify energy
efficiency improvements with longer term paybacks.
While initial participation rates have exceeded forecasts, measurement and verification (M&V)
studies have indicated that many of the original deemed measure savings were over-stated. As
a result, the verified MWH savings from these measures resulted in lower than anticipated
savings during the test period.

PEC Exhibit No. 1 Filing Requirements
Page 26
Provision (h)(1)(ii)k – Continued
Energy Efficiency for Business (EEB) Program
The Energy Efficiency for Business (EEB) program, CIG EE, promotes energy efficient
construction and retrofit in Progress Energy’s commercial, industrial, and governmental
markets. In its second full year of operation, the program again exceeded expectations and
savings targets. While large customer interest in the EEB program has shown signs of
dampening due to a significant increase in the Rider cost during 2010,PEC has seen strong
participation from K-12 schools and community colleges, especially in the retrofit portion of the
program. The economy continued to serve as an impediment to customers constructing new
buildings, which directly limited participation and the disbursement of new construction and
technical assistance dollars. Lighting was the primary program impact driver in 2010. EEB’s
technical assistance incentives continued to enable customers looking to implement efficiency
projects. The vast majority of customers who have applied for technical assistance have
subsequently implemented energy efficiency projects.
Though large customer participation has waned somewhat, the additional MWh savings in 2010
can be attributed to their choice to opt-in to EEB. PEC has decreased its projected EEB MWh
savings contribution going forward from 2012 based on the expectation of a continued negative
impact due to the rising DSM/EE rider. During program development, there was considerable
uncertainty regarding how the rider may affect program participation over time. After two full
years of program performance, PEC now has a better sense of the negative impact an increasing
rider poses to EEB program.
Residential Load Control Program (EnergyWiseTM)
The summer program (air conditioning load control) has experienced a participation level for the
test period that has been slightly above the Company’s expectationsThe primary form of
enrollment continues to be through business reply cards, which has constituted 71% of all
enrollments. The remainder of enrollments has been through inbound telephone calls at 18%
and through online web enrollments at 11%. The summer program was activated four times
during the test period in response to system reliability alerts and Level 2 alerts under PEC’s
General Load Reduction Plan (GLRP).
Participation levels for the winter program (load control of water heating and auxiliary heat
strips on central electric heat pumps in PEC’s western region) during the test period has been
below the Company’s expectations. Though the winter program is small at approximately 3 MW,
it was activated three times during the test period for testing and response to system reliability
alerts under the PEC GLRP.
PEC Exhibit No. 1 Filing Requirements
Page 27
Provision (h)(1)(ii)k – Continued
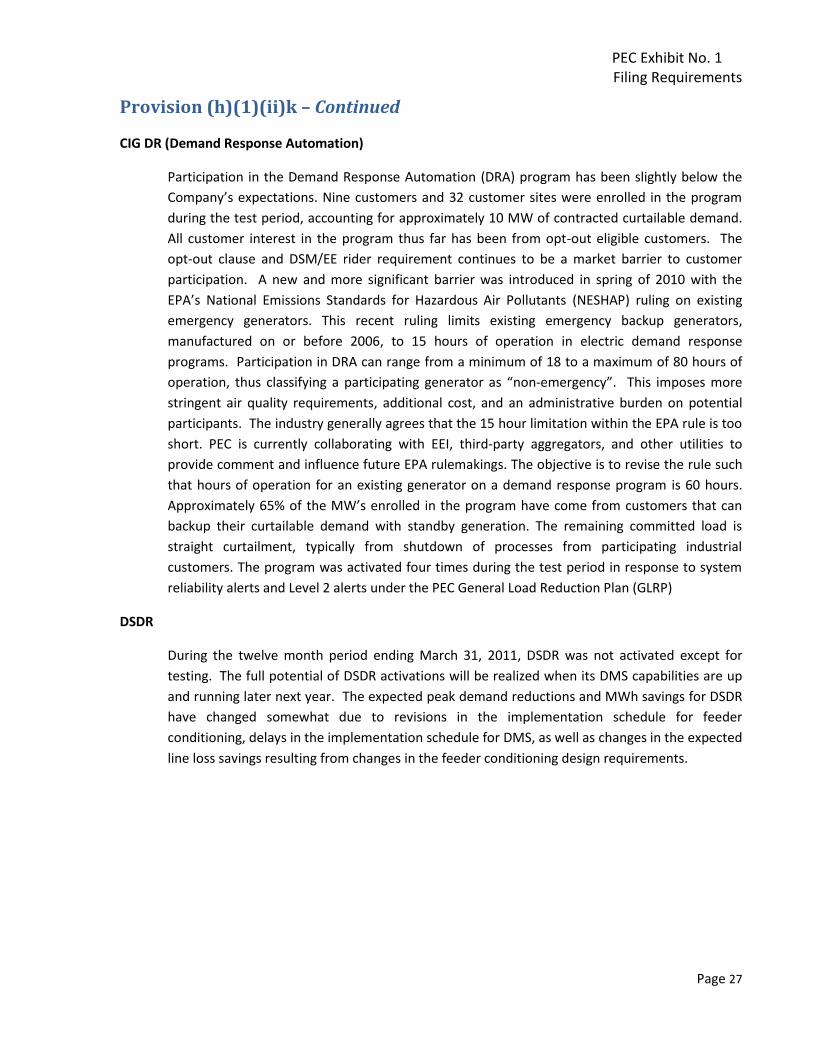
CIG DR (Demand Response Automation)
Participation in the Demand Response Automation (DRA) program has been slightly below the
Company’s expectations. Nine customers and 32 customer sites were enrolled in the program
during the test period, accounting for approximately 10 MW of contracted curtailable demand.
All customer interest in the program thus far has been from opt-out eligible customers. The
opt-out clause and DSM/EE rider requirement continues to be a market barrier to customer
participation. A new and more significant barrier was introduced in spring of 2010 with the
EPA’s National Emissions Standards for Hazardous Air Pollutants (NESHAP) ruling on existing
emergency generators. This recent ruling limits existing emergency backup generators,
manufactured on or before 2006, to 15 hours of operation in electric demand response
programs. Participation in DRA can range from a minimum of 18 to a maximum of 80 hours of
operation, thus classifying a participating generator as “non-emergency”. This imposes more
stringent air quality requirements, additional cost, and an administrative burden on potential
participants. The industry generally agrees that the 15 hour limitation within the EPA rule is too
short. PEC is currently collaborating with EEI, third-party aggregators, and other utilities to
provide comment and influence future EPA rulemakings. The objective is to revise the rule such
that hours of operation for an existing generator on a demand response program is 60 hours.
Approximately 65% of the MW’s enrolled in the program have come from customers that can
backup their curtailable demand with standby generation. The remaining committed load is
straight curtailment, typically from shutdown of processes from participating industrial
customers. The program was activated four times during the test period in response to system
reliability alerts and Level 2 alerts under the PEC General Load Reduction Plan (GLRP)
DSDR
During the twelve month period ending March 31, 2011, DSDR was not activated except for
testing. The full potential of DSDR activations will be realized when its DMS capabilities are up
and running later next year. The expected peak demand reductions and MWh savings for DSDR
have changed somewhat due to revisions in the implementation schedule for feeder
conditioning, delays in the implementation schedule for DMS, as well as changes in the expected
line loss savings resulting from changes in the feeder conditioning design requirements.
PEC Exhibit No. 1 Filing Requirements
Page 28
Provision (h)(1)(ii)l - Evaluation of event based measure during test period
(h) Filing Requirements and Procedure.
(1) PEC shall submit to ORS and the Commission all of the following information in its application: (ii) For each DSM/EE program for which cost recovery is requested:
l. evaluations of event-based programs including the date, weather conditions, event trigger, number of customers notified and number of customers enrolled;
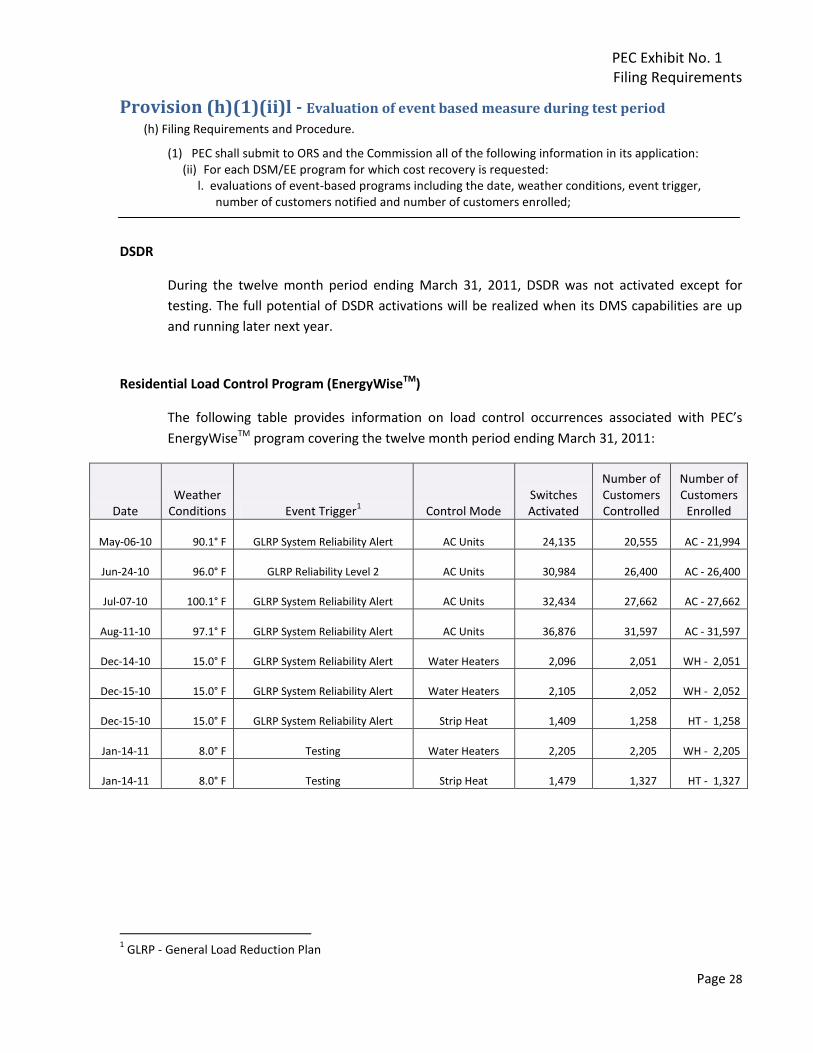
DSDR
During the twelve month period ending March 31, 2011, DSDR was not activated except for
testing. The full potential of DSDR activations will be realized when its DMS capabilities are up
and running later next year.
Residential Load Control Program (EnergyWiseTM)
The following table provides information on load control occurrences associated with PEC’s
EnergyWiseTM program covering the twelve month period ending March 31, 2011:
Date Weather
Conditions Event Trigger1 Control Mode
Switches Activated
Number of Customers Controlled
Number of Customers
Enrolled
May-06-10 90.1° F GLRP System Reliability Alert AC Units 24,135 20,555 AC - 21,994
Jun-24-10 96.0° F GLRP Reliability Level 2 AC Units 30,984 26,400 AC - 26,400
Jul-07-10 100.1° F GLRP System Reliability Alert AC Units 32,434 27,662 AC - 27,662
Aug-11-10 97.1° F GLRP System Reliability Alert AC Units 36,876 31,597 AC - 31,597
Dec-14-10 15.0° F GLRP System Reliability Alert Water Heaters
2,096 2,051 WH - 2,051
Dec-15-10 15.0° F GLRP System Reliability Alert Water Heaters
2,105 2,052 WH - 2,052
Dec-15-10 15.0° F GLRP System Reliability Alert Strip Heat
1,409 1,258 HT - 1,258
Jan-14-11 8.0° F Testing Water Heaters
2,205 2,205 WH - 2,205
Jan-14-11 8.0° F Testing Strip Heat
1,479 1,327 HT - 1,327
1 GLRP - General Load Reduction Plan

PEC Exhibit No. 1 Filing Requirements
Page 29
Provision (h)(1)(ii)l – Continued
CIG DR (Demand Response Automation)
The following table provides information on load control occurrences associated with PEC’s CIG
Demand Response Automation program covering the twelve month period ending March 31,
2011:
Date Weather
Conditions Event Trigger1 Control Mode
Points of Delivery
Controlled
Number of Customers Controlled
Number of Customers
Enrolled
Jun-24-10 96.0° F GLRP Reliability Level 2 NA 18 6 6
Jul-07-10 100.1° F GLRP System Reliability Alert NA 23 6 6
Aug-11-10 97.1° F GLRP System Reliability Alert NA 25 6 6
Dec-15-10 15.0° F GLRP System Reliability Alert NA 9 2 6
1 GLRP - General Load Reduction Plan

PEC Exhibit No. 1 Filing Requirements
Page 30
Provision (h)(1)(ii)m – Comparison of impact estimates
(h) Filing Requirements and Procedure.
(1) PEC shall submit to ORS and the Commission all of the following information in its application: (ii) For each DSM/EE program for which cost recovery is requested:
m. a comparison of impact estimates presented in the measure application from the previous year, those used in reporting for previous measure years, and an explanation of significant differences in the impacts reported and those previously found or used;
The Company’s current impact estimate of capacity savings, estimated savings used in its previous report, and their differences, expressed in megawatts at the meter, are provided in the following tables. Explanations of variances are provided in Provision(h)(1)(ii)k:
Forecasted Summer Capacity Values from Docket No. 2010-161-E
CIG DR
Energy WiseTM
DSDR Res Home Advantage
Residential HEIP
Res Low Income
Res Lighting
Res Appl. Recycling
Res EE Bench-mark
CIG Energy
Efficiency
CFL Pilot Total
2010 9.1 50.0 99.3 0.7 7.6 0.7 5.4 0.4 NA 10.5 0.6 184.3
2011 29.6 87.5 131.0 1.5 11.2 1.4 11.4 1.2 NA 20.4 0.6 295.8
2012 45.1 125.0 241.0 2.7 14.9 2.0 11.4 2.2 NA 34.2 0.6 479.1
2013 50.1 155.4 249.2 4.6 19.1 2.7 11.4 3.4 NA 51.5 0.6 548.0
Actual and Anticipated Summer Capacity Values1
CIG DR
Energy WiseTM
DSDR Res Home Advantage
Residential HEIP
Res Low Income
Res Lighting
Res Appl. Recycling
Res EE Bench-mark
CIG Energy
Efficiency
CFL Pilot Total
2010 7.8 53.4 95.0 1.0 7.3 0.7 7.3 0.5 - 9.7 0.6 183.3
2011 23.7 93.5 108.0 2.2 12.6 1.4 14.3 1.7 2.6 20.2 0.6 280.8
2012 37.7 133.5 241.0 4.2 18.4 2.0 20.6 3.5 2.6 31.2 0.6 495.3
2013 51.8 170.6 248.8 7.1 24.8 2.7 25.7 5.5 2.1 43.4 0.6 583.1
Differences Between Previous and Updated Summer Capacity Values
CIG DR
Energy WiseTM
DSDR Res Home Advantage
Residential HEIP
Res Low Income
Res Lighting
Res Appl. Recycling
Res EE Bench-mark
CIG Energy
Efficiency
CFL Pilot Total
2010 (1.3) 3.4 (4.3) 0.3 (0.3) - 1.9 0.1 - (0.8) - (1.0)
2011 (5.9) 6.0 (23.0) 0.7 1.4 - 2.9 0.5 2.6 (0.2) - (15.0)
2012 (7.4) 8.5 - 1.5 3.5 - 9.2 1.3 2.6 (3.0) - 16.2
2013 1.7 15.2 (0.4) 2.5 5.7 - 14.3 2.1 2.1 (8.1) - 35.1
1 Values associated with PEC’s Residential Solar Hot Water Heating Program will be supplied upon completion of
measurement and verification process.

PEC Exhibit No. 1 Filing Requirements
Page 31
Provision (h)(1)(ii)m - Continued
Forecasted Winter Capacity Values from Docket No. 2010-161-E
CIG DR
Energy WiseTM
DSDR Res Home Advantage
Residential HEIP
Res Low Income
Res Lighting
Res Appl. Recycling
Res EE Bench-mark
CIG Energy
Efficiency
CFL Pilot Total
2010 - 2.8 - - - - - - NA - 0.7 3.5
2011 - 8.8 - - - - - - NA - 0.7 9.5
2012 - 17.9 - - - - - - NA - 0.7 18.6
2013 - 21.6 - - - - - - NA - 0.7 22.3
Actual and Anticipated Winter Capacity Values
1
CIG DR
Energy WiseTM
DSDR Res Home Advantage
Residential HEIP
Res Low Income
Res Lighting
Res Appl. Recycling
Res EE Bench-mark
CIG Energy
Efficiency
CFL Pilot Total
2010 - 3.0 - - - - - - - - 0.7 3.7
2011 - 5.1 - - - - - - - - 0.7 5.8
2012 - 7.4 - - - - - - - - 0.7 8
2013 - 9.5 - - - - - - - - 0.7 10.1
Differences Between Previous and Updated Winter Capacity Values
CIG DR
Energy WiseTM
DSDR Res Home Advantage
Residential HEIP
Res Low Income
Res Lighting
Res Appl. Recycling
Res EE Bench-mark
CIG Energy
Efficiency
CFL Pilot Total
2010 - 0.2 - - - - - - - - - 0.2
2011 - (3.5) - - - - - - - - - (3.7)
2012 - (10.5) - - - - - - - - - (10.6)
2013 - (12.1) - - - - - - - - - (12.2)
1 Values associated with PEC’s Residential Solar Hot Water Heating Program will be supplied upon completion of
measurement and verification process.

PEC Exhibit No. 1 Filing Requirements
Page 32
Provision (h)(1)(ii)m - Continued
The Company’s current impact estimate of energy savings, estimated savings used in its previous report, expressed in megawatt hours at the meter, and their differences are provided in the following tables.
Forecasted Energy Values from Docket No. 2010-161-E
CIG DR
Energy WiseTM
DSDR Res Home Advantage
Residential HEIP
Res Low Income
Res Lighting
Res Appl. Recycling
Res EE Bench-mark
CIG Energy
Efficiency
CFL Pilot Total
2010 99 79 21,245 2,072 10,107 4,700 57,283 3,459 NA 42,269 6,706 148,019
2011 562 249 29,568 4,615 15,087 8,876 125,046 10,491 NA 82,406 6,706 283,606
2012 1,320 506 54,327 8,744 20,247 13,052 125,046 19,085 NA 138,050 6,706 387,083
2013 2,204 850 55,689 14,915 25,647 17,228 125,046 29,311 NA 207,919 6,706 485,515
Actual and Anticipated Energy Values
1
CIG DR
Energy WiseTM
DSDR Res Home Advantage
Residential HEIP
Res Low Income
Res Lighting
Res Appl. Recycling
Res EE Bench-mark
CIG Energy
Efficiency
CFL Pilot Total
2010 93 149 14,787 2,817 7,530 4,861 76,552 4,026 - 46,320 6,706 163,841
2011 317 333 30,275 6,242 13,511 9,119 150,739 10,334 14,400 89,806 6,706 331,781
2012 570 626 54,931 11,426 20,520 13,295 217,774 18,210 14,400 134,983 6,706 493,440
2013 823 834 56,082 19,174 28,229 17,471 271,402 27,582 11,520 185,200 6,706 625,021
Differences Between Previous and Updated Energy Values
CIG DR
Energy WiseTM
DSDR Res Home Advantage
Residential HEIP
Res Low Income
Res Lighting
Res Appl. Recycling
Res EE Bench-mark
CIG Energy
Efficiency
CFL Pilot Total
2010 (6) 70 (6,458) 745 (2,577) 161 19,269 567 - 4,051 - 15,822
2011 (245) 84 707 1,627 (1,576) 243 25,693 (157) 14,400 7,400 - 48,175
2012 (750) 120 604 2,682 273 243 92,728 (875) 14,400 (3,067) - 106,357
2013 (1,381) (16) 393 4,259 2,582 243 146,356 (1,729) 11,520 (22,719) - 139,506
1 Values associated with PEC’s Residential Solar Hot Water Heating Program will be supplied upon completion of measurement and verification process.
PEC Exhibit No. 1 Filing Requirements
Page 33
Provision (h)(1)(ii)n – Determination of utility incentives (h) Filing Requirements and Procedure.
(1) PEC shall submit to ORS and the Commission all of the following information in its application: (ii) For each DSM/EE program for which cost recovery is requested:
n. a detailed explanation of the calculation of the PPI, the actual calculation of the proposed PPI, and the proposed method of providing for their recovery and true-up through the annual rider;
The Company is requesting recovery of (1) net lost revenues, and (2) program performance incentives to create future benefits based on achieved savings from Demand-Side Management (DSM) and Energy Efficiency (EE) programs. The cost recovery mechanism is based upon the Settlement Agreement as approved by the Commission in Docket No. 2008-251-E, and has been summarized below. The specific calculations associated with these amounts are included as a part of the Company’s supporting workpapers.
A. Net Lost Revenues
Net lost revenues are determined by multiplying lost sales by a net lost revenue rate. Net Lost Revenues = Lost Sales X Net Lost Revenue Rate
Lost Sales are those sales that do not occur by virtue of employing the DSM/EE measures. These values are initially based on estimates and subsequently confirmed through the measurement and verification (M&V) process. Net Lost Revenue Rate is the difference between the average retail rate applicable to the customer class impacted by the measure and (1) the related customer charge component of that rate, (2) the fuel component of the rate, and (3) the incremental variable O&M rate. When multiple customer classes are impacted by the DSM/EE measures, a weighted or system wide net lost revenue rate is employed. The recovery of net lost revenues applicable to a given vintage year shall be recovered through the DSM/EE rider only for the first 36 months after the installation of the measurement unit. Thereafter, recovery of Net Lost Revenues shall end.
B. Incentive to Create Future Benefits
DSM and EE Program Performance Incentives (PPI)
For DSM programs, the PPI to be recovered for a given measurement unit and vintage year shall be equal to 8% of the net present value of the DSM program savings based upon the Utility Cost Test (“UCT”). For EE programs, the PPI to be recovered for a given measurement unit and vintage year shall be equal to 13% of the net present value of the EE program savings based upon the UCT. The UCT is an industry standard test, which compares the costs incurred by a utility in offering a DSM/EE program to the benefits as measured by the costs avoided by the utility.

PEC Exhibit No. 1 Filing Requirements
Page 34
Provision (h)(1)(ii)n - Continued
The PPI is converted into a stream of ten (10) levelized annual payments, accounting for and incorporating PEC's overall weighted average net-of tax rate of return approved in PEC's most recent general rate case as the appropriate discount rate.
Pursuant to the Docket No. 2008-251-E based Settlement Agreement, the amount of the PPI ultimately to be recovered for a given program or measure and vintage year shall be trued-up so that the PPI is based on the actual net savings derived from all measurement units specific to the program or measure.
South Carolina jurisdictional estimated lost sales quantities for the Company’s system are provided in the following table. They have been segmented into the recovery periods.
Program / Measure
Sales Loss For Purposes of Lost Revenue Calculation (kWh) – South Carolina
Test Period (4/1/10 through 3/31/11)
Rate Period (7/1/11 through 6/30/12)
Demand-Side Management Programs
CIG DR1 13,150 -
EnergyWise1 22,126 -
DSDR Implementation1 - -
Energy Efficiency Programs
Res Home Advantage 356,752 922,507
Res Home Energy Improve. 778,919 2,076,405
Residential Low Income-NES 555,037 1,346,240
Residential Lighting 8,780,589 22,112,340
Res Appliance Recycling 374,705 1,533,036
Residential EE Benchmark - 2,083,680
Solar Hot Water Heating Pilot - -
CIG Energy Efficiency 5,912,402 13,112,992
CFL Pilot 410,610 -
Total Reduction in Energy (kWh) 17,204,290 43,187,200
1 Net lost revenues for event based measures are based on actual events as opposed to estimated occurrences.
PEC Exhibit No. 1 Filing Requirements
Page 35
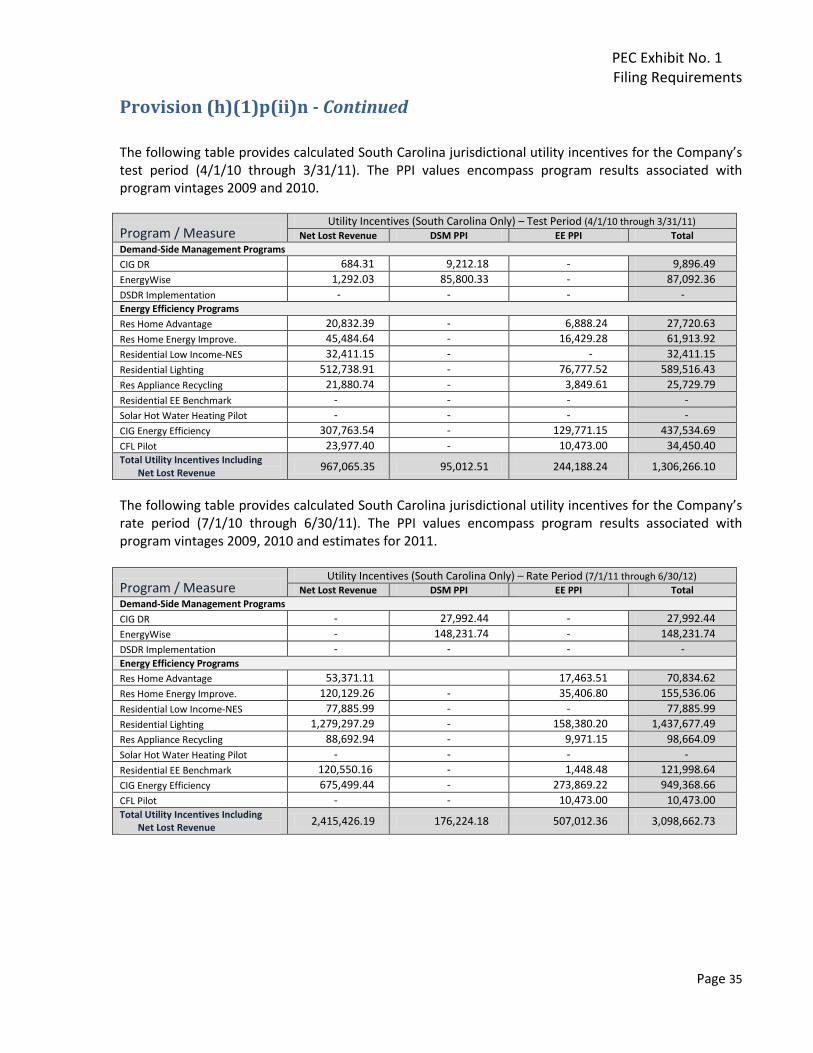
Provision (h)(1)p(ii)n - Continued
The following table provides calculated South Carolina jurisdictional utility incentives for the Company’s test period (4/1/10 through 3/31/11). The PPI values encompass program results associated with program vintages 2009 and 2010.
Program / Measure Utility Incentives (South Carolina Only) – Test Period (4/1/10 through 3/31/11)
Net Lost Revenue DSM PPI EE PPI Total Demand-Side Management Programs
CIG DR 684.31 9,212.18 - 9,896.49
EnergyWise 1,292.03 85,800.33 - 87,092.36
DSDR Implementation - - - - Energy Efficiency Programs
Res Home Advantage 20,832.39 - 6,888.24 27,720.63
Res Home Energy Improve. 45,484.64 - 16,429.28 61,913.92
Residential Low Income-NES 32,411.15 - - 32,411.15
Residential Lighting 512,738.91 - 76,777.52 589,516.43
Res Appliance Recycling 21,880.74 - 3,849.61 25,729.79
Residential EE Benchmark - - - -
Solar Hot Water Heating Pilot - - - -
CIG Energy Efficiency 307,763.54 - 129,771.15 437,534.69
CFL Pilot 23,977.40 - 10,473.00 34,450.40 Total Utility Incentives Including
Net Lost Revenue 967,065.35 95,012.51 244,188.24 1,306,266.10
The following table provides calculated South Carolina jurisdictional utility incentives for the Company’s rate period (7/1/10 through 6/30/11). The PPI values encompass program results associated with program vintages 2009, 2010 and estimates for 2011.
Program / Measure Utility Incentives (South Carolina Only) – Rate Period (7/1/11 through 6/30/12)
Net Lost Revenue DSM PPI EE PPI Total Demand-Side Management Programs
CIG DR - 27,992.44 - 27,992.44
EnergyWise - 148,231.74 - 148,231.74
DSDR Implementation - - - - Energy Efficiency Programs
Res Home Advantage 53,371.11 17,463.51 70,834.62
Res Home Energy Improve. 120,129.26 - 35,406.80 155,536.06
Residential Low Income-NES 77,885.99 - - 77,885.99
Residential Lighting 1,279,297.29 - 158,380.20 1,437,677.49
Res Appliance Recycling 88,692.94 - 9,971.15 98,664.09
Solar Hot Water Heating Pilot - - - -
Residential EE Benchmark 120,550.16 - 1,448.48 121,998.64
CIG Energy Efficiency 675,499.44 - 273,869.22 949,368.66
CFL Pilot - - 10,473.00 10,473.00 Total Utility Incentives Including
Net Lost Revenue 2,415,426.19 176,224.18 507,012.36 3,098,662.73

PEC Exhibit No. 1 Filing Requirements
Page 36
Provision (h)(1)p(ii)n – Continued
As a result of the Company’s receipt of measurement and verification results associated with its Residential Home Energy Improvement Program (HEIP), it has reconciled PPI amounts recovered through its DSM/EE Rider with those based on verified results. The Company over collected PPI amounts equal to $7,469.84. This amount has been used to reduce the revenue requirement associated with its request. In addition, net lost revenues had been overstated by 243 MWH through the test period ending March 31, 2010. Net lost revenue related requirements for the current test period have been reduced by the prior overstatement. This recognition resulted in the equivalent of a $ 14,215 reduction in the test period revenue requirement. These adjustments, coupled with their prospective recognition, effectively finalize values associated with the 2009 vintage of PEC’s Residential Home Energy Improvement Program.
The Company’s proposed jurisdictional allocation factors for the test period, April 1, 2010 through March 31, 2011, and the rate period, July 1, 2011 through June 30, 2012 are provided in attached Appendix B.

PEC Exhibit No. 1 Filing Requirements
Page 37
Provision (h)(1)(ii)o – Actual revenue from DSM/EE rider
(h) Filing Requirements and Procedure.
(1) PEC shall submit to ORS and the Commission all of the following information in its application: (ii) For each DSM/EE program for which cost recovery is requested:
o. Actual revenues produced by the DSM/EE rider during the test period and for all available months immediately preceding the rate period.
The following table provides DSM/ EE revenues billed from July 1, 2010 through March 31, 2011.
DSM/EE Rate Classification Amount
Residential Recoveries $ 3,633,332.88 General Service $ 3,525,646.50 Less: Opt-Out Credits 1,961,735.32
General Service Recoveries $ 1,563,911.18 Lighting $ 0.00 Less: Opt-Out Credits 0.00 Lighting Recoveries $ 0.00
Total DSM/EE Recoveries $ 5,197,244.06

PEC Exhibit No. 1 Filing Requirements
Page 38
Provision (h)(1)(ii)p – Proposed DSM/EE rider (h) Filing Requirements and Procedure.
(1) PEC shall submit to ORS and the Commission all of the following information in its application: (ii) For each DSM/EE program for which cost recovery is requested:
p. The requested DSM/EE rider and the basis for the rider;
Detailed information regarding the determination of the DSM/EE and DSM/EE EMF factors has been
provided as a part of the attached testimony of Robert P. Evans. The following table provides a
summary of the Company’s requested DSM/EE rates exclusive of gross receipts taxes (GRT) and South
Carolina Regulatory Fees.
Rate Class DSM /EE Rate
Residential 0.301¢/kWh
General Service 0.139¢/kWh
Lighting 0.000¢/kWh
The following table provides a summary of the Company’s requested DSM/EE rates including both GRT
and South Carolina Regulatory Fees.
Rate Class DSM /EE Rate
Residential 0.302¢/kWh
General Service 0.140¢/kWh
Lighting 0.000¢/kWh

PEC Exhibit No. 1 Filing Requirements
Page 39
Provision (h)(1)(ii)q – Projected SC retail sales for customers opting out of measures (h) Filing Requirements and Procedure.
(1) PEC shall submit to ORS and the Commission all of the following information in its application: (ii) For each DSM/EE program for which cost recovery is requested:
q. Projected South Carolina retail monthly kWh sales for the rate period for all industrial and large commercial accounts, in the aggregate, that are not assessed the rider charges.
Based on the current proportion of General Service sales associated customers who have “opted-out” of participation in PEC’s DSM/EE programs, PEC estimates that 2,283,226,881 kWh will not be subject to billing under its rider for the twelve month period ending June 30, 2012. A similar analysis estimated that there is another 2,942,406 kWh, associated with the lighting accounts of commercial and industrial customers who have elected to “opt-out”, that would not be subject to billing under its rider. The following table provides the Company’s estimate of South Carolina retail monthly kWh sales in the aggregate, that will not be assessed DSM/EE rider charges.
Estimated “Opt-Out” Sales from with Industrial, Large Commercial & Lighting Customers
Month Estimated kWh
Jul-11 213,913,669
Aug-11 204,569,702
Sep-11 202,886,525
Oct-11 198,473,665
Nov-11 217,387,712
Dec-11 142,903,796
Jan-12 213,416,083
Feb-12 177,492,033
Mar-12 138,025,092
Apr-12 197,324,994
May-12 175,544,914
Jun-12 204,231,102
Total 2,286,169,287

PEC Exhibit No. 1 Filing Requirements
Page 40
Provision (h)(2) – Supporting workpapers (h) Filing Requirements and Procedure.
(2) PEC will file the information described in this procedure, accompanied by workpapers and direct testimony and exhibits of expert witnesses.
Workpapers and supporting documents have been attached to this document along with the testimony
and exhibits of Robert P. Evans providing details associated with the development of the Company’s
proposed DSM/EE rates.

PEC Exhibit No. 1 Filing Requirements
Page 41
Appendix A: Non-Participating Customers
Non-Participant Non-Participating
Accounts
A V M INDUSTRIES 8
ABB POWER DISTRIBUTION INC 1
ADP TAX CREDIT SRVC INC 1
AGRIUM US INC 4
AHLSTROM NONWOVENS LLC 3
ANVIL KNITWEAR INC 2
ASSURANT SPECIALTY PROPERTY 1
BARRINGTON MYRTLE BEACH LLC 1
BECTON DICKINSON & CO 1
BEST BUY LP #826 1
BI-LO LLC 10
BLACKMON 1
BLUE CROSS/BLUE SHIELD OF SC 4
BVP HOLDING LLC 1
CALHOUN FARMS 4
CAROLINA CANNERS INC 7
CAROLINA FURNITURE 3
CAROLINA PINES REGIONAL MED 8
CAROLINAS HOSPITAL SYSTEM 8
CHARLES CRAFT INC 3
CHARLES INGRAM LUMBER CO INC 18
CHAR-WALT INC 2
CHERAW TOWN OF 1
CHESTERFIELD COUNTY SCHOOLS 10
CITI TRENDS INC 1
CITY OF FLORENCE 5
COKER COLLEGE 25
COMMANDR HEALTH CARE FACLT IN 1
CONBRACO INDUSTRIES INC 3
COOPER TOOLS, INC 1
CROWN CORK & SEAL USA INC 3
DARLINGTON CO SCHOOL DIST 2
DARLINGTON SHREDDING INC 1
DEROYAL INDUSTRIES INC 2
DILLON FURNITURE MFG CO INC 1

PEC Exhibit No. 1 Filing Requirements
Page 42
Non-Participant Non-Participating
Accounts
DILLON YARN CORPORATION 2
DIXIE PIPELINE COMPANY 1
DOMTAR PAPER CO LLC 1
E I DUPONT DE NEMOURS & CO 1
EATON CORPORATION 1
ENERSYS DELAWARE INC 3
EVANS 4
EZ PRODUCTS LLC 1
FIRESTONE BUILDING PRODUCTS 3
FLO DARL TECHNICAL COLLEGE 6
FLOCO FOODS INC 8
FLORENCE CO SCHOOL DIST #2 1
FOOD LION INC 18
FRANCO MFG CO INC 2
FRASIER TIRE SERVICE 1
FREEMAN MILLWORK CO 2
G E MEDICAL SYSTEM 1
G E MEDICAL SYSTEMS INC 1
GALEY & LORD LLC 3
GEORGIA PACIFIC LLC 3
H B D INDUSTRIES INC 1
HAIER AMERICA REFRIGERATORS 3
HARRIS TEETER INC 1
HARTSVILLE OIL MILL 3
HARVIN PACKING COMPANY INC 1
HENGST OF NORTH AMERICA INC 1
HIGHLAND INDUSTRIES INC 4
HODGES 1
HONORAGE NURSING HOME 1
INDUSTRIAL FABRICATORS 1
INTERNATIONAL PAPER CO 1
INVISTA S A R L 7
IRIX PHARMACEUTICALS 2
ITW ANGLEBOARD 2
J & M DYERS INC 2
J J HOSPITALITY LLC 3
JOHNSONVILLE CITY OF 1

PEC Exhibit No. 1 Filing Requirements
Page 43
Non-Participant Non-Participating
Accounts
JONES FOODS INC 1
KAYDON CORPORATION 2
KOPPERS CO INC 3
KOPPERS INDUSTRIES INC 2
LEE COUNTY SCHOOL DISTRICT 2
LEWIS MOLA LLC 1
LOCKAMY SCRAP METAL INC 4
MANNING CITY OF 1
MARION COUNTY MEDICAL CENTER 2
MARLEY ELECTRIC HEAT CO 1
MARSH LUMBER COMPANY 1
MARTEK BIOSC KINGSTREE CORP 1
MCCALL FARMS INC 4
MCLEOD MEDICAL CENTER 5
METHODIST MANOR 8
MORRELL MEMORIAL CONVAL CENTE 1
NATIONAL HEALTHCARE CORPORATION 1
NEIGHBORHOOD GROCER LLC 1
NORTHEASTERN TECHNICAL COLLEGE 3
NUCOR COLD FINISH 2
NUCOR STEEL 1
PACIFIC MDF PRODUCTS INC 1
PALMETTO BRICK CO 6
PALMETTO GROCER INC 1
PAPER STOCK DEALERS 1
PEACE TEXTILE AMERICA INC 1
PERDUE FARMS INC 3
PIGGLY WIGGLY 11
PILGRIMS PRIDE CORPORATION 3
POLAR COLD STORAGE INC 2
POLYQUEST INC 2
POSTON PACKING CO 2
PROTECTIVE PACKAGING INC 1
REXAM BEVERAGE CAN COMPANY 1
RIVERSIDE ELEC MOTORS 1
ROCHE CAROLINA 1
S & W MANUFACTURING CO 1

PEC Exhibit No. 1 Filing Requirements
Page 44
Non-Participant Non-Participating
Accounts
SANTEE PRINT WORKS INC 4
SCHAEFFLER GROUP USA INC 7
SCHOOL DIST OF GEORGETOWN CO 4
SHAW AFB 1
SHAW CES CEOEE 1
SLI LIGHTING CORPORATION 4
SMITH 2
SONOCO PRODUCTS CO 10
SONOCO PRODUCTS COMPANY 2
SOPAKCO PACKAGING INC 3
SOUTH ATLANTIC CANNERS INC 3
SOUTHERN GRAPHICS SYSTEMS INC 1
STANLEY TOOLS DIV OF 1
STEELFAB OF SC 1
SUMTER FOODS INC 1
SUMTER PACKAGING CORP 2
T B FOODS INC 1
TALLEY METALS TECHNOLOGY INC 10
THE BROTHERS OF NORTH CAROLINA 1
TREBOL USA LLC 4
TUOMEY HEALTHCARE SYSTEM 2
TUPPERWARE CO INT 1
TYCO HEALTHCARE GROUP LP 1
UNIFIRST CORPORTATION 1
UNIMIN CORPORATION 1
US AIR FORCE 3
VESUVIUS USA CORPORATION 2
VULCRAFT CORP 4
VULCRAFT DECK PLANT 1
VULCRAFT DIV NUCOR CORP 3
W LEE FLOWERS CO INC 1
WALLACES OLD FASH SKINS 1
WALMART STORES INC 10
WEYLCHEM US INC 2
WILLIAMSBURG REGIONAL HOSPITAL 2
YOUNG PECAN SHELLING CO 4
ZIMACS INCORPORATED 4
PEC Exhibit No. 1 Filing Requirements
Page 45
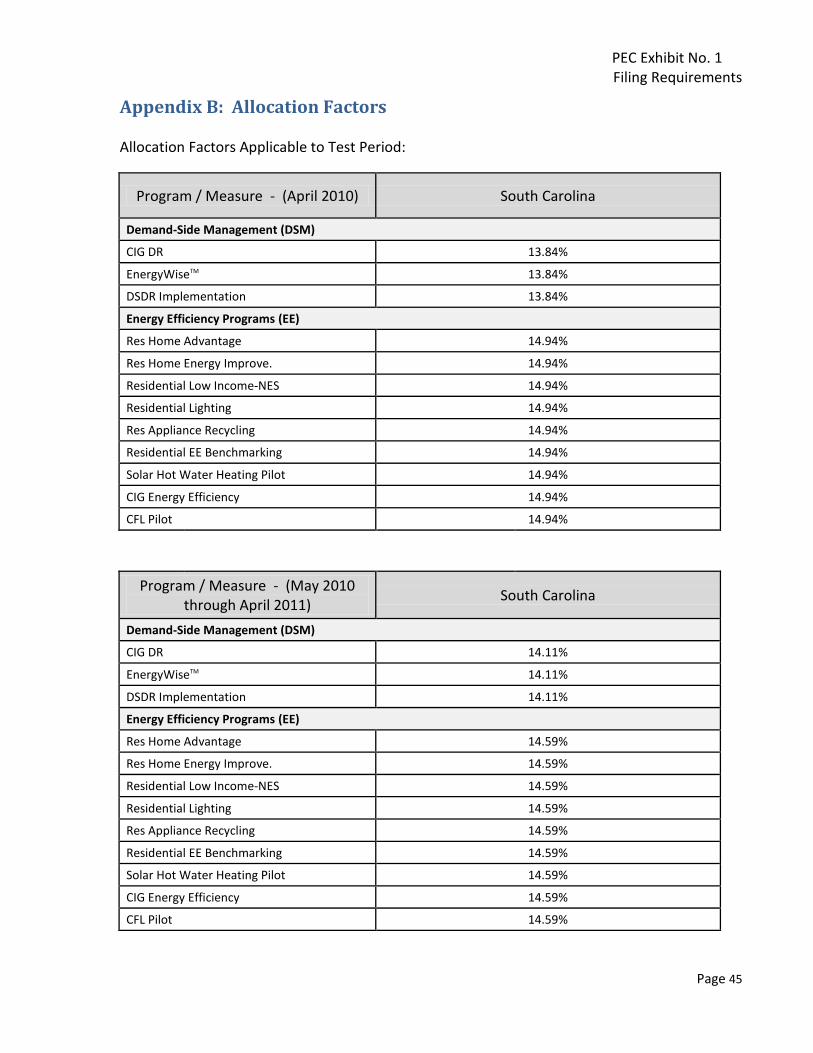
Appendix B: Allocation Factors
Allocation Factors Applicable to Test Period:
Program / Measure - (April 2010) South Carolina
Demand-Side Management (DSM)
CIG DR 13.84%
EnergyWiseTM 13.84%
DSDR Implementation 13.84%
Energy Efficiency Programs (EE)
Res Home Advantage 14.94%
Res Home Energy Improve. 14.94%
Residential Low Income-NES 14.94%
Residential Lighting 14.94%
Res Appliance Recycling 14.94%
Residential EE Benchmarking 14.94%
Solar Hot Water Heating Pilot 14.94%
CIG Energy Efficiency 14.94%
CFL Pilot 14.94%
Program / Measure - (May 2010 through April 2011)
South Carolina
Demand-Side Management (DSM)
CIG DR 14.11%
EnergyWiseTM 14.11%
DSDR Implementation 14.11%
Energy Efficiency Programs (EE)
Res Home Advantage 14.59%
Res Home Energy Improve. 14.59%
Residential Low Income-NES 14.59%
Residential Lighting 14.59%
Res Appliance Recycling 14.59%
Residential EE Benchmarking 14.59%
Solar Hot Water Heating Pilot 14.59%
CIG Energy Efficiency 14.59%
CFL Pilot 14.59%

PEC Exhibit No. 1 Filing Requirements
Page 46
Appendix B – Continued
Allocation Factors Applicable to the Rate Period:
Program / Measure - (May 2011 through June 2012)
South Carolina
Demand-Side Management (DSM)
CIG DR 13.51%
EnergyWiseTM 13.51%
DSDR Implementation 13.51%
Energy Efficiency Programs (EE)
Residential Home Advantage 14.47%
Residential Home Energy Improvement 14.47%
Residential Low Income-NES 14.47%
Residential Lighting 14.47%
Residential Appliance Recycling 14.47%
Residential EE Benchmarking 14.47%
Solar Hot Water Heating Pilot 14.47%
CIG Energy Efficiency 14.47%
CFL Pilot 14.47%
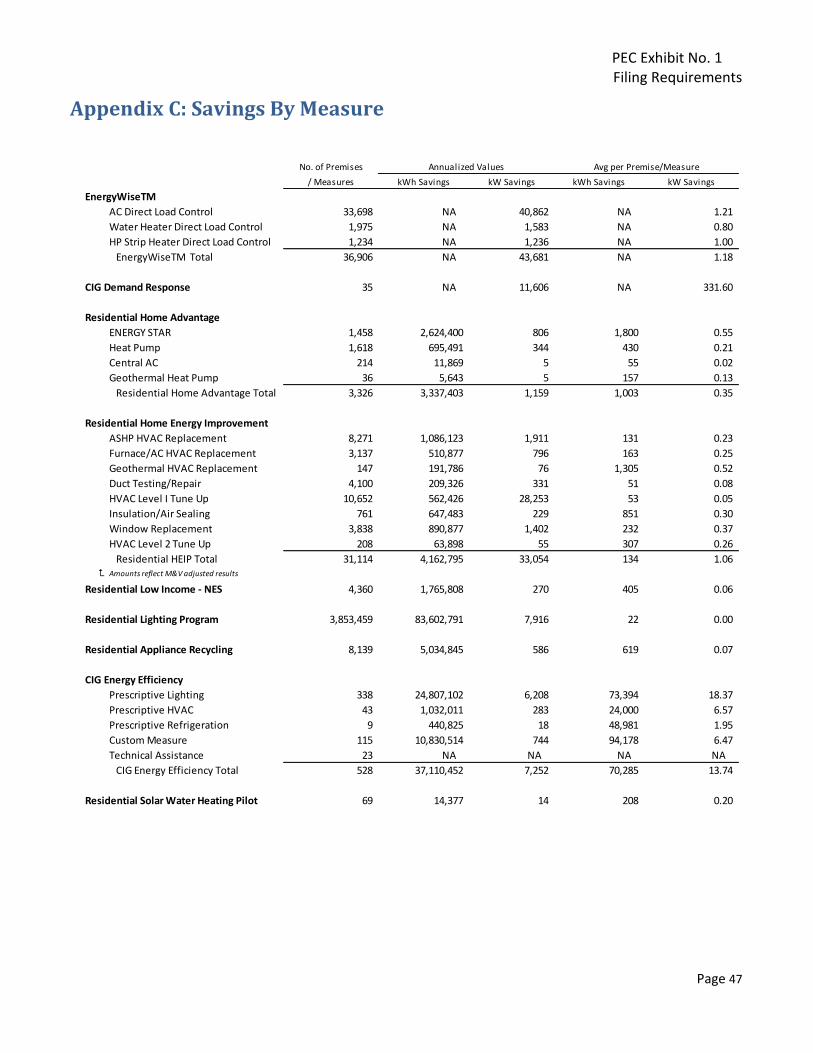
PEC Exhibit No. 1 Filing Requirements
Page 47
Appendix C: Savings By Measure
No. of Premises
/ Measures kWh Savings kW Savings kWh Savings kW Savings
EnergyWiseTM
AC Direct Load Control 33,698 NA 40,862 NA 1.21
Water Heater Direct Load Control 1,975 NA 1,583 NA 0.80
HP Strip Heater Direct Load Control 1,234 NA 1,236 NA 1.00
EnergyWiseTM Total 36,906 NA 43,681 NA 1.18
CIG Demand Response 35 NA 11,606 NA 331.60
Residential Home Advantage
ENERGY STAR 1,458 2,624,400 806 1,800 0.55
Heat Pump 1,618 695,491 344 430 0.21
Central AC 214 11,869 5 55 0.02
Geothermal Heat Pump 36 5,643 5 157 0.13
Residential Home Advantage Total 3,326 3,337,403 1,159 1,003 0.35
Residential Home Energy Improvement
ASHP HVAC Replacement 8,271 1,086,123 1,911 131 0.23
Furnace/AC HVAC Replacement 3,137 510,877 796 163 0.25
Geothermal HVAC Replacement 147 191,786 76 1,305 0.52
Duct Testing/Repair 4,100 209,326 331 51 0.08
HVAC Level I Tune Up 10,652 562,426 28,253 53 0.05
Insulation/Air Sealing 761 647,483 229 851 0.30
Window Replacement 3,838 890,877 1,402 232 0.37
HVAC Level 2 Tune Up 208 63,898 55 307 0.26
Residential HEIP Total 31,114 4,162,795 33,054 134 1.06 < Amounts reflect M&V adjusted results
Residential Low Income - NES 4,360 1,765,808 270 405 0.06
Residential Lighting Program 3,853,459 83,602,791 7,916 22 0.00
Residential Appliance Recycling 8,139 5,034,845 586 619 0.07
CIG Energy Efficiency
Prescriptive Lighting 338 24,807,102 6,208 73,394 18.37
Prescriptive HVAC 43 1,032,011 283 24,000 6.57
Prescriptive Refrigeration 9 440,825 18 48,981 1.95
Custom Measure 115 10,830,514 744 94,178 6.47
Technical Assistance 23 NA NA NA NA
CIG Energy Efficiency Total 528 37,110,452 7,252 70,285 13.74
Residential Solar Water Heating Pilot 69 14,377 14 208 0.20
Annualized Values Avg per Premise/Measure

1
SOUTH CAROLINA UTILITIES COMMISSION
DOCKET NO. 2011-_____-E
DIRECT TESTIMONY OF ROBERT P. EVANS
ON BEHALF OF CAROLINA POWER & LIGHT COMPANY
D/B/A/ PROGRESS ENERGY CAROLINAS, INC.
Q. PLEASE STATE YOUR NAME, YOUR BUSINESS ADDRESS AND POSITION 1
WITH PROGRESS ENERGY CAROLINAS, INC.. 2
A. My name is Robert P. Evans and my business address is 100 E. Davie Street, Post Office 3
Box 1551, Raleigh, North Carolina 27602. I am employed by Progress Energy Carolinas, 4
Inc. (“PEC”) as a Lead DSM Regulatory Specialist in the Company’s Efficiency and 5
Innovative Technologies Department. 6
Q. PLEASE BRIEFLY STATE YOUR EDUCATIONAL BACKGROUND AND 7
EXPERIENCE. 8
A. I graduated from Iowa State University ("ISU") in 1978 with a Bachelor of Science Degree 9
in Industrial Administration and a minor in Industrial Engineering. As a part of my 10
undergraduate work, I participated in both the graduate level Regulatory Studies Programs 11
sponsored by American Telephone and Telegraph Corporation and graduate level study 12
programs in Engineering Economics. Subsequent to my graduation from ISU I received 13
additional Engineering Economics training at the Colorado School of Mines, completed the 14
NARUC Regulatory Studies program at Michigan State, and completed the Advanced 15
AGA Ratemaking program at the University of Maryland. Upon graduation from ISU, I 16
joined the Iowa State Commerce Commission, now known as the Iowa Utility Board 17

2
("IUB"), in the Rates and Tariffs Section of the Utilities Division. During my tenure with 1
the IUB, I held several positions, including Senior Rate Analyst in charge of Utility Rates 2
and Tariffs and Assistant Director of the Utility Division. In those positions I provided 3
testimony in gas, electric, water and telecommunications proceedings as an expert witness 4
in the areas of rate design, service rules, and tariff applications. In 1982, I accepted 5
employment with City Utilities of Springfield, Missouri, as an Operations Analyst. In that 6
capacity, I provided support for rate-related matters associated with the municipal utility's 7
gas, electric, water and sewer operations. In addition, I worked closely with its load 8
management and energy conservation programs. In 1983, I joined the Rate Services staff 9
of the Iowa Power and Light Company, now known as MidAmerican Energy, as a Rate 10
Engineer. In this position, I was responsible for the preparation of rate related filings and 11
presented testimony on rate design, service rules, and accounting issues before the IUB. In 12
1986, I accepted employment with Tennessee-Virginia Energy Corporation, which is now 13
known as the United Cities Division of ATMOS Energy, as Director of Rates and 14
Regulatory Affairs. While in this position, I was responsible for regulatory filings, 15
regulatory relations, and customer billing. In 1987, I went to work for the Virginia State 16
Corporation Commission in the Division of Energy Regulation as a Utilities Specialist. In 17
this capacity I worked with electric and natural gas issues and provided testimony on cost 18
of service and rate design matters brought before that regulatory body. In 1988, I joined 19
North Carolina Natural Gas Corporation ("NCNG") as its Manager of Rates and Budgets. 20
Subsequently, I was promoted to Director-Statistical Services in its Planning and 21
Regulatory Compliance Department. In that position, I performed a variety of work 22
associated with financial, regulatory and statistical analysis, and presented testimony on 23

3
several issues brought before the North Carolina Utilities Commission. I held that position 1
until the closing of NCNG's merger with Carolina Power and Light Company, the 2
predecessor of Progress Energy, Inc., on July 15, 1999. 3
From July 1999 through January 2008 I was employed in Principal and Senior Analyst 4
roles by the Progress Energy Service Company, LLC. In these roles I provided NCNG, 5
Progress Energy Carolinas, Inc. and Progress Energy Florida, Inc. with rate and regulatory 6
support in their state and federal venues as well as financial forecasting support. 7
Q. WHAT ARE YOUR CURRENT RESPONSIBILITIES? 8
A. I am responsible for financial analysis and support of PEC’s Energy Efficiency (EE) and 9
Demand Side Management (DSM) programs. 10
Q. WHAT IS THE PURPOSE OF YOUR TESTIMONY? 11
A. The purpose of my testimony is to explain and support PEC’s Application for a DSM/EE 12
cost recovery rider and to provide the information required by the Stipulation approved by 13
Commission Order No. 2009-373 in Docket No. 2008-251-E. 14
Q. ARE YOU SPONSORING PEC’S DSM/EE COST RECOVERY RIDER 15
APPLICATION? 16
A. Yes. In addition to this testimony and accompanying exhibits, I am sponsoring PEC’S 17
DSM/EE Cost Recovery Rider Application identified as PEC Exhibit No. 1. 18
Q. WHAT IS THE SCOPE OF THE APPROVED STIPULATION IN DOCKET NO. 19
2008-251-E? 20
A. In summary, the Stipulation provided for: filing requirements; program opt-out criteria; 21
procedures for the annual recovery of costs incurred to implement new Demand-Side 22
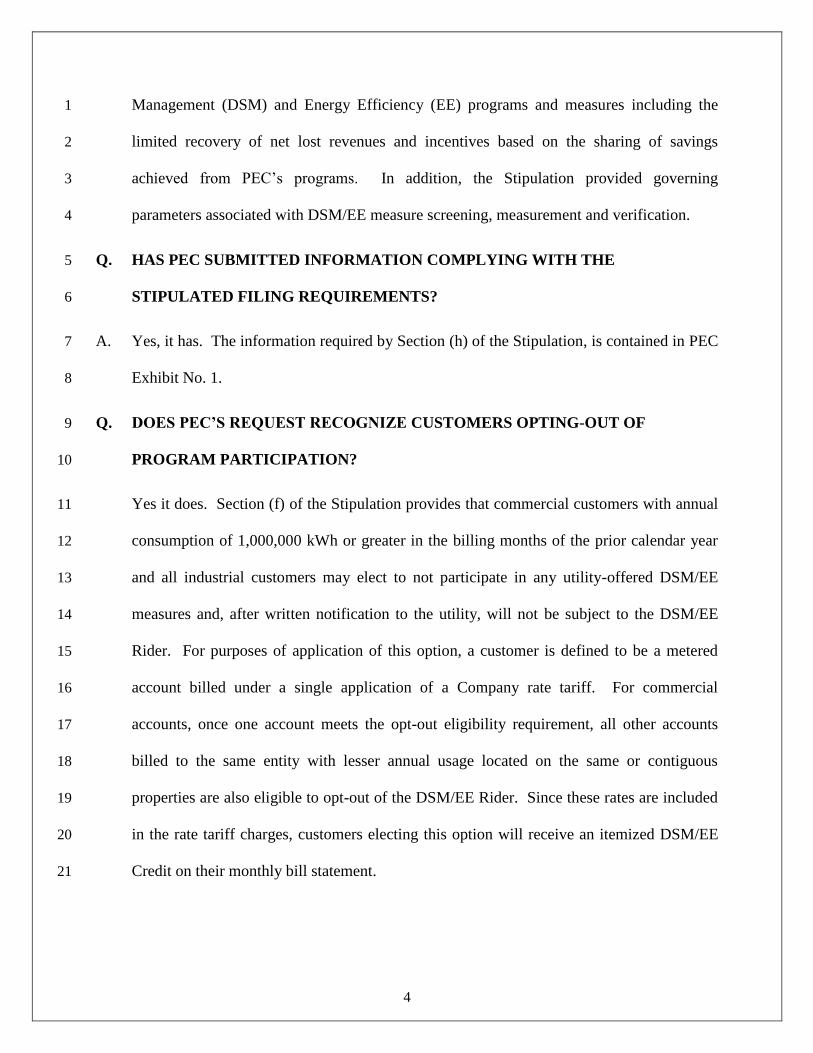
4
Management (DSM) and Energy Efficiency (EE) programs and measures including the 1
limited recovery of net lost revenues and incentives based on the sharing of savings 2
achieved from PEC’s programs. In addition, the Stipulation provided governing 3
parameters associated with DSM/EE measure screening, measurement and verification. 4
Q. HAS PEC SUBMITTED INFORMATION COMPLYING WITH THE 5
STIPULATED FILING REQUIREMENTS? 6
A. Yes, it has. The information required by Section (h) of the Stipulation, is contained in PEC 7
Exhibit No. 1. 8
Q. DOES PEC’S REQUEST RECOGNIZE CUSTOMERS OPTING-OUT OF 9
PROGRAM PARTICIPATION? 10
Yes it does. Section (f) of the Stipulation provides that commercial customers with annual 11
consumption of 1,000,000 kWh or greater in the billing months of the prior calendar year 12
and all industrial customers may elect to not participate in any utility-offered DSM/EE 13
measures and, after written notification to the utility, will not be subject to the DSM/EE 14
Rider. For purposes of application of this option, a customer is defined to be a metered 15
account billed under a single application of a Company rate tariff. For commercial 16
accounts, once one account meets the opt-out eligibility requirement, all other accounts 17
billed to the same entity with lesser annual usage located on the same or contiguous 18
properties are also eligible to opt-out of the DSM/EE Rider. Since these rates are included 19
in the rate tariff charges, customers electing this option will receive an itemized DSM/EE 20
Credit on their monthly bill statement. 21

5
Q. IS PEC REQUESTING PROGRAM PERFORMANCE INCENTIVES IN THIS 1
PROCEEDING? 2
Yes it is. The incentives, identified as Program Performance Incentives (“PPI”), are 3
calculated pursuant to section (e) of the Stipulation, based on the savings achieved by 4
DSM/EE programs as measured by the Utility Cost Test (“UCT”). With regard to DSM 5
measures and programs, PEC will receive an incentive equal to eight percent of the net 6
savings estimated by the UCT, and for EE measures and programs PEC will receive an 7
incentive equal to thirteen percent of the UCT estimated net savings. Using these values, 8
the PPI is established for measures installed during a twelve-month period (i.e. a vintage 9
year) and is recovered in equal annual installments over a ten-year period. The annual 10
installments are calculated through the levelization of the vintage year PPI using PEC’s 11
overall weighted net-of-tax rate of return approved in PEC’s most recent general rate case 12
as a discount rate. 13
In addition, PEC is requesting the recovery of estimated net lost revenues. Pursuant to the 14
Stipulation, recovery of net lost revenues is allowed for no more than three years for 15
measures installed in any given vintage year. Both the recovery of net lost revenue and PPI 16
are subject to true-up on the basis of measurement and verification analysis. 17
SUMMARY OF DSM/EE COSTS 18
Q. CAN YOU PROVIDE A SUMMARY OF THE COSTS FOR WHICH THE 19
COMPANY IS REQUESTING RECOVERY IN THIS PROCEEDING? 20
A. Yes. The Company’s requested recovery of DSM/EE costs, allocated jurisdictionally to 21
South Carolina, associated with this proceeding have been broken into two periods. For the 22
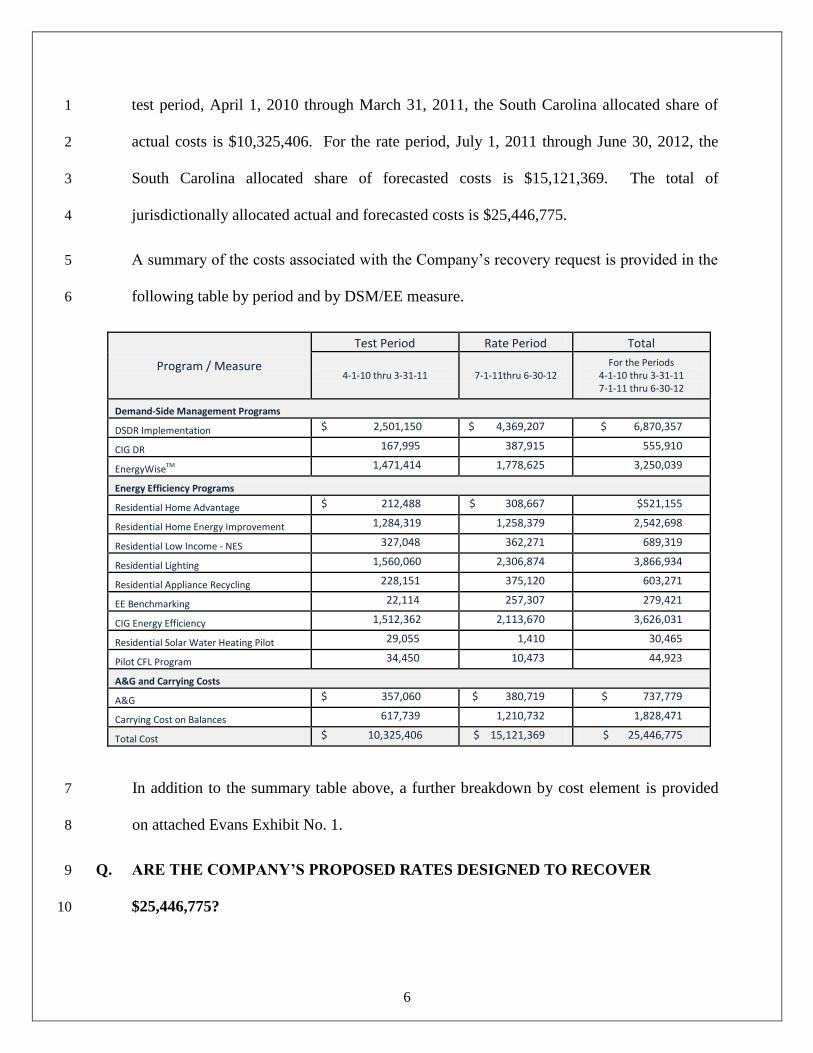
6
test period, April 1, 2010 through March 31, 2011, the South Carolina allocated share of 1
actual costs is $10,325,406. For the rate period, July 1, 2011 through June 30, 2012, the 2
South Carolina allocated share of forecasted costs is $15,121,369. The total of 3
jurisdictionally allocated actual and forecasted costs is $25,446,775. 4
A summary of the costs associated with the Company’s recovery request is provided in the 5
following table by period and by DSM/EE measure. 6
Program / Measure
Test Period Rate Period Total
4-1-10 thru 3-31-11 7-1-11thru 6-30-12 For the Periods
4-1-10 thru 3-31-11 7-1-11 thru 6-30-12
Demand-Side Management Programs
DSDR Implementation $ 2,501,150 $ 4,369,207 $ 6,870,357
CIG DR 167,995 387,915 555,910
EnergyWiseTM 1,471,414 1,778,625 3,250,039
Energy Efficiency Programs
Residential Home Advantage $ 212,488 $ 308,667 $521,155
Residential Home Energy Improvement 1,284,319 1,258,379 2,542,698
Residential Low Income - NES 327,048 362,271 689,319
Residential Lighting 1,560,060 2,306,874 3,866,934
Residential Appliance Recycling 228,151 375,120 603,271
EE Benchmarking 22,114 257,307 279,421
CIG Energy Efficiency 1,512,362 2,113,670 3,626,031
Residential Solar Water Heating Pilot 29,055 1,410 30,465
Pilot CFL Program 34,450 10,473 44,923
A&G and Carrying Costs
A&G $ 357,060 $ 380,719 $ 737,779
Carrying Cost on Balances 617,739 1,210,732 1,828,471
Total Cost $ 10,325,406 $ 15,121,369 $ 25,446,775
In addition to the summary table above, a further breakdown by cost element is provided 7
on attached Evans Exhibit No. 1. 8
Q. ARE THE COMPANY’S PROPOSED RATES DESIGNED TO RECOVER 9
$25,446,775? 10
7
A. No, since many of the expenses incurred to develop and implement the Company’s DSM 1
and EE programs produce benefits covering several years, those expenses pursuant to item 2
(c)(1) of the Stipulation, will be deferred, and recovered over a ten year period. There are 3
exceptions to PEC’s reliance on ten-year recovery periods. As a part of its Residential 4
Lighting Program application, PEC requested that it be allowed to employ a five-year 5
recovery period for the recoupment of costs deferred for the program. As a part of its 6
Residential Energy Efficiency Benchmarking Program, PEC requested current period, non-7
deferred recoveries of its program expenses. The shorter recovery periods associated with 8
these programs are more reflective of their anticipated beneficial measure lives. As a 9
result of these deferrals and the recovery of DSM/EE revenues during the test period, the 10
Company’s rates for this proceeding are designed to recover revenues totaling $9,159,661. 11
Details associated with the development of this amount are provided on Evans Exhibit Nos. 12
1 and 2. 13
Q. HOW MUCH REVENUE WAS RECOVERED DURING THE TEST PERIOD? 14
A. PEC billed its customers $5,197,244 during the test period. This amount is used to offset 15
DSM/EE expenses realized through the end of the test period in the amount of $4,962,529. 16
As illustrated on Evans Exhibit 2, these amounts, adjusted for the prior period balance of 17
$278,080 and current period adjustments totaling $5,556, net to an over-recovery of 18
DSM/EE amounts totaling $518,351 at March 31, 2011. This remainder when added to the 19
forecasted rate period recovery requirements, totals $9,159,661, the amount requested in 20
this proceeding. 21

8
JURISDICTIONAL COST ALLOCATION 1
Q. HOW ARE DSM AND EE PROGRAM COSTS ALLOCATED TO THE SOUTH 2
CAROLINA RETAIL JURISDICTION? 3
A. PEC first reviews all costs to be recovered and separates them into four categories: (1) EE-4
related costs, (2) DSM-related costs, (3) costs that provide a system benefit in support of 5
both EE and DSM programs, and (4) DSDR related costs. For each of these categories, 6
different allocation methods are employed to assign those costs to the appropriate 7
jurisdiction. 8
Q. PLEASE ELABORATE ON THE METHODOLOGY USED TO ALLOCATE 9
DSM/EE COSTS THAT OFFER A SYSTEM BENEFIT. 10
A. Common Administrative and General (A&G) Costs, associated with the programs, provide 11
a system benefit in support of both EE and DSM programs. Since A&G costs relate to both 12
EE and DSM, A&G amounts are divided into both categories. The division of these costs 13
into either the EE or DSM category is based upon the percentage of each type of 14
expenditure anticipated during the next forecast calendar year. For example, if 30% of 15
these costs in the forecast period are EE-related, then 30% of the A&G costs will be 16
considered as EE-related costs for allocation purposes. The use of a forecast period 17
recognizes the types of new programs PEC will offer in the immediate future that will be 18
supported by these administrative costs. The assignment of A&G costs as being either EE 19
or DSM related is reviewed annually each June based upon forecasted costs for the next 20
calendar year. The A&G costs provided for in this proceeding have been assigned to these 21
categories based upon forecasted DSM and EE costs for 2011. 22

9
Q. ON EVANS EXHIBITS 1 AND 2, THE DSDR PROGRAM IS SEPARATED FROM 1
THE OTHER DSM AND EE PROGRAMS. HOW IS THE DSDR PROGRAM 2
CLASSIFIED? 3
A. The DSDR Program has been classified, for purposes of ratemaking, as a DSM program. 4
Due to the scope and nature of this program, its costs are being tracked separately. This 5
separate tracking includes both direct costs and A&G costs associated with the program. 6
Q. HOW ARE COSTS IDENTIFIED AS EE-RELATED ALLOCATED TO THE 7
JURISDICTION? 8
A. Any program costs that are identified as being EE-related, including A&G costs, are 9
allocated to SC retail based upon the ratio, at the meter, of SC retail sales to PEC system 10
retail sales. The allocation percentage is updated each May, and is based on the prior 11
calendar year usage data. 12
Q. HOW ARE COSTS IDENTIFIED AS DSM-RELATED ALLOCATED TO THE 13
JURISDICTION? 14
A. Any program costs that are identified as being DSM or DSDR-related, including assigned 15
A&G costs, are allocated to SC retail based upon the ratio of the SC retail demand to the 16
PEC system retail demand at the hour of the annual system peak. The allocation 17
percentage is updated each May, and is based on the prior calendar year demand data. 18
UTILITY INCENTIVES AND NET LOST REVENUES 19
Q. HOW WERE THE UTILITY INCENTIVES CALCULATED? 20
A. As stated earlier, the PPI is calculated pursuant to section (e) of the Stipulation, based on 21
the savings achieved by DSM/EE programs as measured by the Utility Cost Test (“UCT”). 22
10
The amount of the PPI initially to be recovered for a given measurement unit and vintage 1
year shall be equal to eight percent of the UCT for DSM programs and measures and 2
thirteen percent of the UCT for EE programs and measures. Estimated net savings are 3
determined by multiplying the number of measurement units projected to be installed 4
specific to a program or measure in a vintage year by the most current estimates of the 5
annual per installation kW and kWh savings over the measurement unit's life and by the 6
most current estimates of the annual kW and kWh avoided costs, subtracting the estimated 7
utility costs over the measurement unit's life related to the projected installations in that 8
vintage year and discounting the result to determine a net present value. 9
The PPI for the initial vintage was converted into a stream of ten (10) levelized annual 10
payments, accounting for and incorporating PEC's overall weighted average net-of-tax rate 11
of return approved in the Company’s most recent general rate case as the appropriate 12
discount rate. Pursuant to item (e)(11) of the Stipulation, PPI recoveries are subject to true-13
up on the basis on future measurement and verification results. 14
Q. HOW WERE THE NET LOST REVENUES DETERMINED? 15
Net lost revenues, which are applicable to both DSM and EE programs, are determined by 16
multiplying the estimated reduction in sales associated with a measure by a margin based 17
net lost revenue rate. While subject to a few nuances, the following formula embraces the 18
essence of the adjustment. 19
NET LOST REVENUES = LOST SALES X NET LOST REVENUE RATE 20
Lost Sales are those sales that do not occur by virtue of employing the DSM / EE measures. 21
These values are initially based on engineering estimates and/or past impact evaluations, 22

11
with future periods based on updated impact evaluations conducted through the 1
measurement and verification (M&V) activities and applied prospectively and in 2
conjunction with applicable net lost revenue true-ups. The Net Lost Revenue Rate, itself, 3
represents the difference between the average retail rate applicable to the customer class 4
impacted by the measure and (1) the embedded gross receipts taxes, (2) the related average 5
customer charge component of that rate, (3) the average fuel component of the rate, (4) the 6
incremental variable O&M rate as approved in the Company’s last CSP tariff, and (5) the 7
impact of the uncollectibles adjustment. When multiple customer classes are impacted by a 8
DSM / EE measures, as with the DSDR program, a weighted or system wide net lost 9
revenue rate is employed. 10
Pursuant to item (d)(6) of the Stipulation, net lost revenues are recoverable for only the first 11
36-months of an installed measure’s life and comparable to the PPI, recoveries are subject 12
to true-up on the basis on future measurement and verification results. 13
Q. ARE ALL PROGRAMS ELIGIBLE FOR PROGRAM PERFORMANCE 14
INCENTIVES AND THE RECOUPMENT OF NET LOST REVENUES? 15
A. No. PPI amounts were not calculated for PEC’s DSDR, Residential Low Income, or 16
Residential Solar Hot Water Heating programs. Net lost revenue recoupment was not 17
applied to PEC’s Residential Solar Hot Water Heating Program. While PEC’s DSDR 18
program is eligible for net lost revenue recovery, PEC did not request recovery in this 19
filing. For PEC programs that consist of event driven measures (e.g., EnergyWiseTM
, CIG 20
Demand Response and DSDR), in which revenue losses are a function of their deployment 21
that cannot be accurately predicted in advance, net lost revenue recoveries will be 22
requested based on their actual, as opposed to estimated, deployment. Thus, while PEC has 23
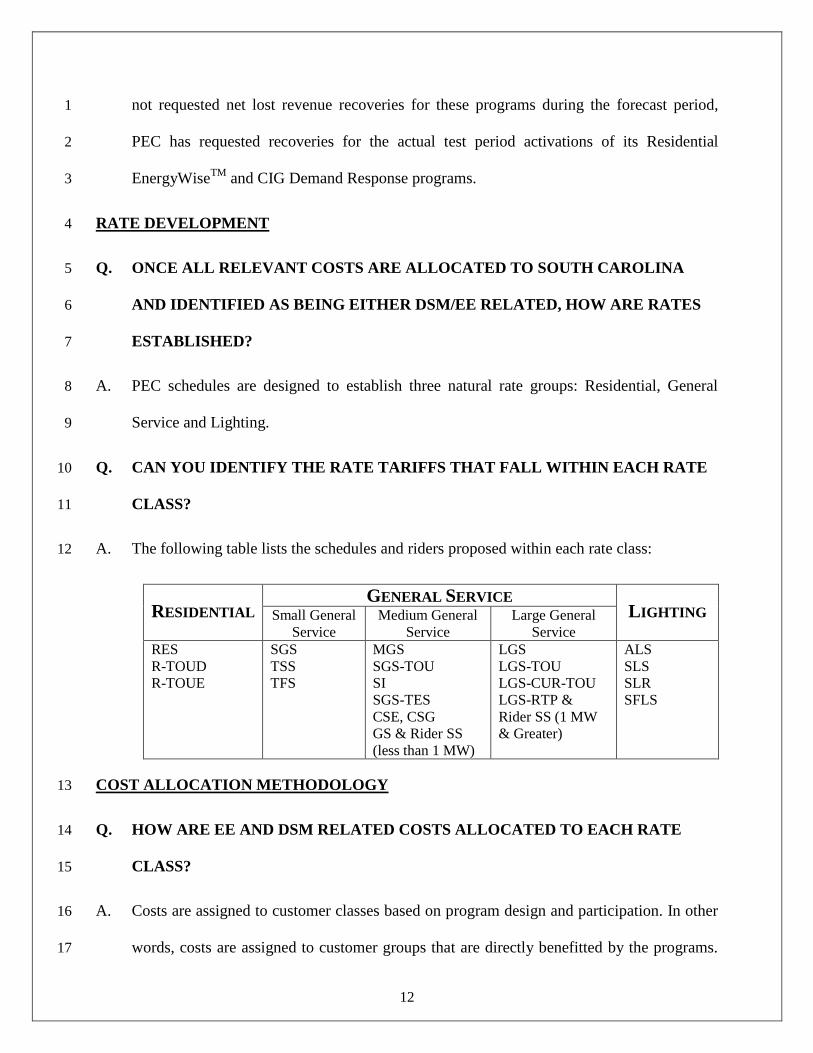
12
not requested net lost revenue recoveries for these programs during the forecast period, 1
PEC has requested recoveries for the actual test period activations of its Residential 2
EnergyWiseTM
and CIG Demand Response programs. 3
RATE DEVELOPMENT 4
Q. ONCE ALL RELEVANT COSTS ARE ALLOCATED TO SOUTH CAROLINA 5
AND IDENTIFIED AS BEING EITHER DSM/EE RELATED, HOW ARE RATES 6
ESTABLISHED? 7
A. PEC schedules are designed to establish three natural rate groups: Residential, General 8
Service and Lighting. 9
Q. CAN YOU IDENTIFY THE RATE TARIFFS THAT FALL WITHIN EACH RATE 10
CLASS? 11
A. The following table lists the schedules and riders proposed within each rate class: 12
RESIDENTIAL GENERAL SERVICE
LIGHTING Small General
Service
Medium General
Service
Large General
Service
RES
R-TOUD
R-TOUE
SGS
TSS
TFS
MGS
SGS-TOU
SI
SGS-TES
CSE, CSG
GS & Rider SS
(less than 1 MW)
LGS
LGS-TOU
LGS-CUR-TOU
LGS-RTP &
Rider SS (1 MW
& Greater)
ALS
SLS
SLR
SFLS
COST ALLOCATION METHODOLOGY 13
Q. HOW ARE EE AND DSM RELATED COSTS ALLOCATED TO EACH RATE 14
CLASS? 15
A. Costs are assigned to customer classes based on program design and participation. In other 16
words, costs are assigned to customer groups that are directly benefitted by the programs. 17
13
Using this method, residential program costs are allocated solely to residential customers, 1
general service program costs are allocated solely to general service customers, and 2
lighting program costs are allocated solely to lighting customers. Where programs benefit 3
multiple customer groups, the costs are allocated to benefitted groups using appropriate 4
annual energy and/or coincident peak demand based allocation factors. 5
Q. HOW ARE ANNUAL ENERGY ALLOCATIONS ADJUSTED FOR THE IMPACT 6
OF “OPT-OUT” CUSTOMERS? 7
A. Rate Class energy allocation factors were developed assuming that the percentage of 8
General Service customer usage “Opted-out” at the end of the test period will continue 9
throughout the rate period. To the extent that actual “Opt-Out” levels diverge from this 10
percentage, recovery variations will be reconciled in subsequent DSM/EE rider true-ups. 11
Estimated commercial and industrial sales forecasted to “Opt-Out” of the DSM/EE rate are 12
provided in Evans Exhibit No. 3. 13
Q. THE SALES FOR “OPT-OUT” CUSTOMERS ARE EASILY IDENTIFIED, BUT 14
HOW IS THE COINCIDENT PEAK OF THESE CUSTOMERS ESTIMATED? 15
A. As previously noted, commercial customers with annual consumption of 1,000,000 kWh or 16
greater in the billing months of the prior calendar year and all industrial customers may 17
elect not to participate in PEC's demand-side management and energy efficiency programs. 18
PEC reviewed its billing records and based upon the current “Opt-Out” rate, anticipates 19
that, 2,286,169,287 kWh would not be subject to billing for the twelve month period 20
ending June 30, 2012. 21
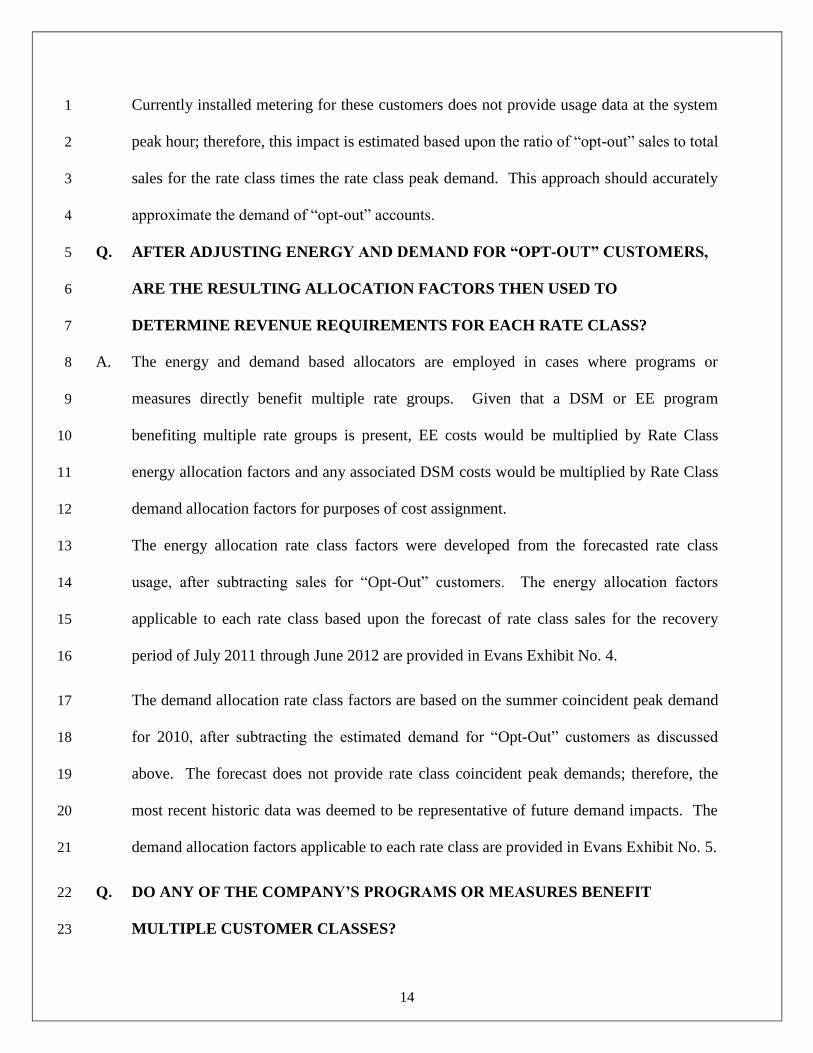
14
Currently installed metering for these customers does not provide usage data at the system 1
peak hour; therefore, this impact is estimated based upon the ratio of “opt-out” sales to total 2
sales for the rate class times the rate class peak demand. This approach should accurately 3
approximate the demand of “opt-out” accounts. 4
Q. AFTER ADJUSTING ENERGY AND DEMAND FOR “OPT-OUT” CUSTOMERS, 5
ARE THE RESULTING ALLOCATION FACTORS THEN USED TO 6
DETERMINE REVENUE REQUIREMENTS FOR EACH RATE CLASS? 7
A. The energy and demand based allocators are employed in cases where programs or 8
measures directly benefit multiple rate groups. Given that a DSM or EE program 9
benefiting multiple rate groups is present, EE costs would be multiplied by Rate Class 10
energy allocation factors and any associated DSM costs would be multiplied by Rate Class 11
demand allocation factors for purposes of cost assignment. 12
The energy allocation rate class factors were developed from the forecasted rate class 13
usage, after subtracting sales for “Opt-Out” customers. The energy allocation factors 14
applicable to each rate class based upon the forecast of rate class sales for the recovery 15
period of July 2011 through June 2012 are provided in Evans Exhibit No. 4. 16
The demand allocation rate class factors are based on the summer coincident peak demand 17
for 2010, after subtracting the estimated demand for “Opt-Out” customers as discussed 18
above. The forecast does not provide rate class coincident peak demands; therefore, the 19
most recent historic data was deemed to be representative of future demand impacts. The 20
demand allocation factors applicable to each rate class are provided in Evans Exhibit No. 5. 21
Q. DO ANY OF THE COMPANY’S PROGRAMS OR MEASURES BENEFIT 22
MULTIPLE CUSTOMER CLASSES? 23

15
A. Yes. The Company’s DSDR DSM program benefits multiple customer classes. To 1
allocate DSDR costs, the Rate Class demand allocation factors are employed. 2
Q. HOW ARE RATE CLASS DSM/EE RATES ESTABLISHED? 3
A. The calculated rate class EE and DSM revenue requirements are divided by rate class sales, 4
after adjustment for “Opt-Out” customers, to establish the rate class DSM/EE rate. Evans 5
Exhibit No. 6 provides the derivation of the Energy Efficiency Rate. Evans Exhibit No. 7 6
provides the derivation of the Demand Side Management Rate. 7
Q. WERE PEC’S ESTIMATES OF DISCOUNTED RESIDENTIAL SALES AND 8
UNCOLLECTIBLE BILLINGS CONSISTENT WITH ACTUAL RESULTS? 9
A. Company estimates were fairly consistent with actual results. The Company’s estimated 10
Residential Service Energy Conservation Discount (“RECD”) based adjustment factor of 11
0.8122% was slightly higher than the resulting actual 0.7994%. The actual impact of 12
RECD discounted revenues is reflected within PEC’s test period revenues. The actual 13
residential uncollectible rate for the period, 0.7019%, was somewhat higher than the 14
estimated value of 0.6407%. This difference resulted in an under-collection of $2,224. 15
The last of these adjustment factors, the general service uncollectible rate associated with 16
the test period of 0.0593%, was less than the estimated value of 0.0791%. This difference 17
resulted in an over-collection of $310. The revised amounts are employed as gross-up 18
factor components used on Evans Exhibit No. 8. The dollar adjustments were used on 19
Evans Exhibit No. 2 to arrive at the residual revenue requirement at the end of the test 20
period, March 31, 2011. 21

16
Q. WHERE ANY ADDITIONAL ADJUSTMENTS APPLIED TO THE TEST 1
PERIOD? 2
A. Yes, as a result of the measurement and verification of the 2009 vintage of PEC’s 3
Residential Home Energy Improvement Program (HEIP), it was determined that previously 4
calculated PPI values and deemed energy savings were in excess of those based on verified 5
values. The recalculated annual PPI recovery was $7,050 less than the amount recognized 6
in the prior test period. As a result, the current test period revenue requirement was 7
reduced by $7,050 as reflected on Evans Exhibit No. 2. 8
The verified HEIP energy savings were less than those employed in the calculation of net 9
lost revenues. As a result, the net lost revenue related requirements for the current test 10
period have been reduced by the prior overstatement, 243 MWH. This reduction in lost 11
sales produces a $14,215 reduction in the test period revenue requirement. These 12
adjustments, coupled with their prospective recognition, effectively finalize values 13
associated with the 2009 vintage of PEC’s Residential Home Energy Improvement 14
Program. 15
Q. WHAT RATES ARE PROPOSED FOR EACH RATE CLASS? 16
A. Evans Exhibit No. 9 calculates the DSM/EE annual rates proposed in this proceeding. The 17
DSM/EE rates recover costs forecasted to be incurred during July 1, 2011 through June 30, 18
2012 and the actual costs incurred through March 31, 2011, net of test period recoveries. 19
PEC proposes the following rates, exclusive of gross receipts taxes and SC Regulatory 20
Fees, for each rate class (shown in cents per kWh): 21

17
Rate Class DSM Rate EE Rate Adjustment*
DSM/EE
Annual
Rider**
Residential 0.1254 0.1710 0.0045 0.301
General Service 0.0654 0.0732 0.0001 0.139
Lighting 0.0000 0.0000 0.0000 0.000
* Adjustment for uncollectible billings and Residential RECD discount
**Billing Rates are rounded to the nearest thousandth of a cent
The proposed billing rates, including gross receipts taxes and SC Regulatory Fees for each 1
class are provided in the following table (shown in cents per kWh): 2
Rate Class DSM /EE Rate
Residential 0.302¢/kWh
General Service 0.140¢/kWh
Lighting 0.000¢/kWh
Q. DOES THIS CONCLUDE YOUR TESTIMONY? 3
A. Yes. 4
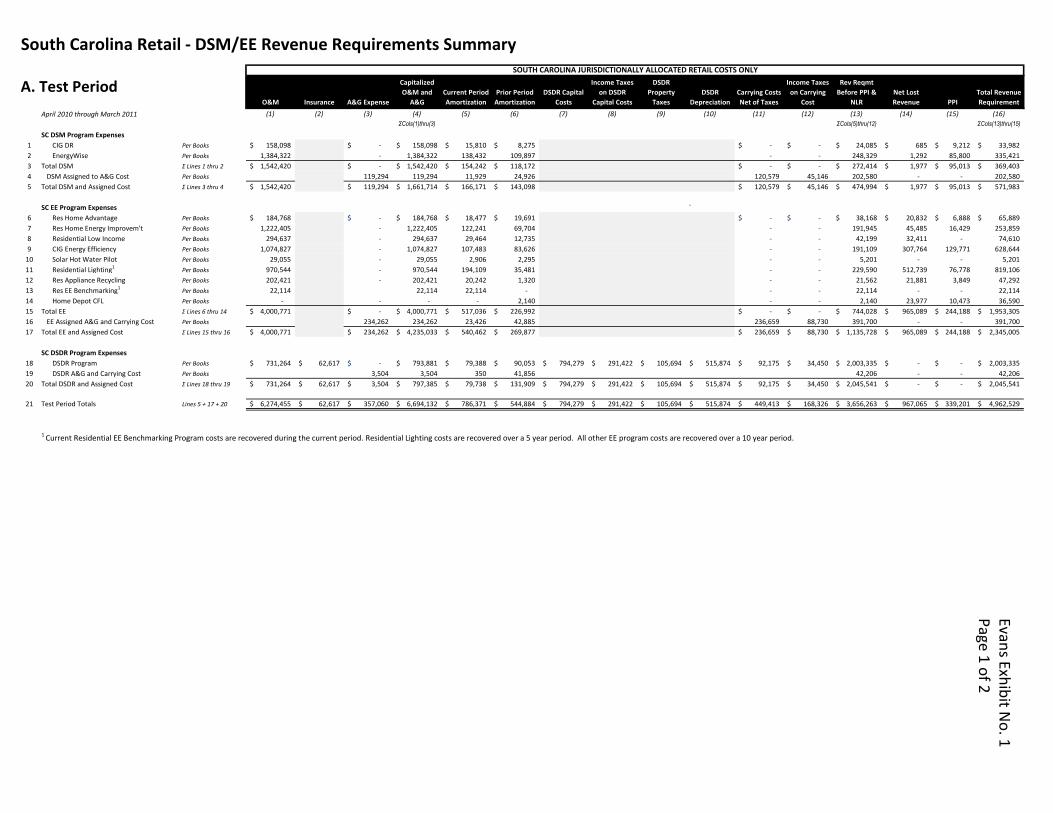
South Carolina Retail - DSM/EE Revenue Requirements Summary
O&M Insurance A&G Expense
Capitalized
O&M and
A&G
Current Period
Amortization
Prior Period
Amortization
DSDR Capital
Costs
Income Taxes
on DSDR
Capital Costs
DSDR
Property
Taxes
DSDR
Depreciation
Carrying Costs
Net of Taxes
Income Taxes
on Carrying
Cost
Rev Reqmt
Before PPI &
NLR
Net Lost
Revenue PPI
Total Revenue
Requirement
April 2010 through March 2011 (1) (2) (3) (4) (5) (6) (7) (8) (9) (10) (11) (12) (13) (14) (15) (16)
ΣCols(1)thru(3) ΣCols(5)thru(12) ΣCols(13)thru(15)
SC DSM Program Expenses
1 CIG DR Per Books 158,098$ -$ 158,098$ 15,810$ 8,275$ -$ -$ 24,085$ 685$ 9,212$ 33,982$
2 EnergyWise Per Books 1,384,322 - 1,384,322 138,432 109,897 - - 248,329 1,292 85,800 335,421
3 Total DSM Σ Lines 1 thru 2 1,542,420$ -$ 1,542,420$ 154,242$ 118,172$ -$ -$ 272,414$ 1,977$ 95,013$ 369,403$
4 DSM Assigned to A&G Cost Per Books 119,294 119,294 11,929 24,926 120,579 45,146 202,580 - - 202,580
5 Total DSM and Assigned Cost Σ Lines 3 thru 4 1,542,420$ 119,294$ 1,661,714$ 166,171$ 143,098$ 120,579$ 45,146$ 474,994$ 1,977$ 95,013$ 571,983$
SC EE Program Expenses `
6 Res Home Advantage Per Books 184,768$ -$ 184,768$ 18,477$ 19,691$ -$ -$ 38,168$ 20,832$ 6,888$ 65,889$
7 Res Home Energy Improvem't Per Books 1,222,405 - 1,222,405 122,241 69,704 - - 191,945 45,485 16,429 253,859
8 Residential Low Income Per Books 294,637 - 294,637 29,464 12,735 - - 42,199 32,411 - 74,610
9 CIG Energy Efficiency Per Books 1,074,827 - 1,074,827 107,483 83,626 - - 191,109 307,764 129,771 628,644
10 Solar Hot Water Pilot Per Books 29,055 - 29,055 2,906 2,295 - - 5,201 - - 5,201
11 Residential Lighting1Per Books 970,544 - 970,544 194,109 35,481 - - 229,590 512,739 76,778 819,106
12 Res Appliance Recycling Per Books 202,421 - 202,421 20,242 1,320 - - 21,562 21,881 3,849 47,292
13 Res EE Benchmarking1Per Books 22,114 22,114 22,114 - - - 22,114 - - 22,114
14 Home Depot CFL Per Books - - - - 2,140 - - 2,140 23,977 10,473 36,590
15 Total EE Σ Lines 6 thru 14 4,000,771$ -$ 4,000,771$ 517,036$ 226,992$ -$ -$ 744,028$ 965,089$ 244,188$ 1,953,305$
16 EE Assigned A&G and Carrying Cost Per Books 234,262 234,262 23,426 42,885 236,659 88,730 391,700 - - 391,700
17 Total EE and Assigned Cost Σ Lines 15 thru 16 4,000,771$ 234,262$ 4,235,033$ 540,462$ 269,877$ 236,659$ 88,730$ 1,135,728$ 965,089$ 244,188$ 2,345,005$
SC DSDR Program Expenses
18 DSDR Program Per Books 731,264$ 62,617$ -$ 793,881$ 79,388$ 90,053$ 794,279$ 291,422$ 105,694$ 515,874$ 92,175$ 34,450$ 2,003,335$ -$ -$ 2,003,335$
19 DSDR A&G and Carrying Cost Per Books 3,504 3,504 350 41,856 42,206 - - 42,206
20 Total DSDR and Assigned Cost Σ Lines 18 thru 19 731,264$ 62,617$ 3,504$ 797,385$ 79,738$ 131,909$ 794,279$ 291,422$ 105,694$ 515,874$ 92,175$ 34,450$ 2,045,541$ -$ -$ 2,045,541$
21 Test Period Totals Lines 5 + 17 + 20 6,274,455$ 62,617$ 357,060$ 6,694,132$ 786,371$ 544,884$ 794,279$ 291,422$ 105,694$ 515,874$ 449,413$ 168,326$ 3,656,263$ 967,065$ 339,201$ 4,962,529$
1 Current Residential EE Benchmarking Program costs are recovered during the current period. Residential Lighting costs are recovered over a 5 year period. All other EE program costs are recovered over a 10 year period.
A. Test PeriodSOUTH CAROLINA JURISDICTIONALLY ALLOCATED RETAIL COSTS ONLY
Evans Exh
ibit N
o. 1
Page 1
of 2
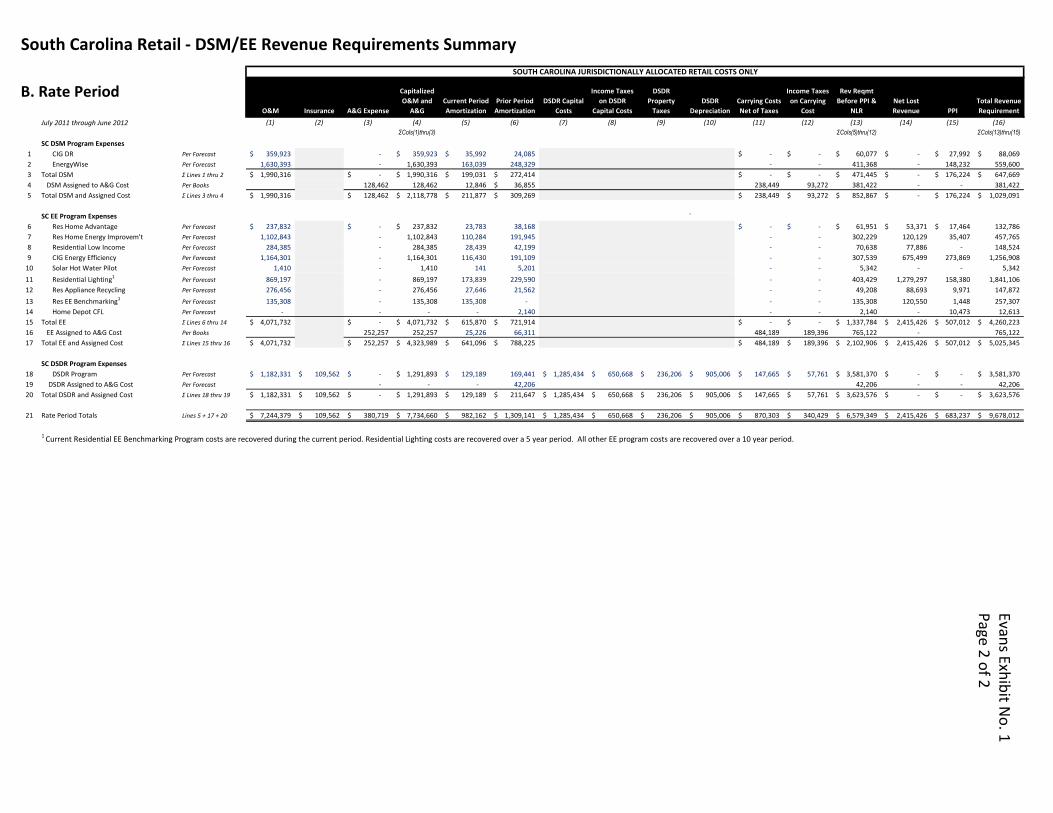
South Carolina Retail - DSM/EE Revenue Requirements Summary
O&M Insurance A&G Expense
Capitalized
O&M and
A&G
Current Period
Amortization
Prior Period
Amortization
DSDR Capital
Costs
Income Taxes
on DSDR
Capital Costs
DSDR
Property
Taxes
DSDR
Depreciation
Carrying Costs
Net of Taxes
Income Taxes
on Carrying
Cost
Rev Reqmt
Before PPI &
NLR
Net Lost
Revenue PPI
Total Revenue
Requirement
July 2011 through June 2012 (1) (2) (3) (4) (5) (6) (7) (8) (9) (10) (11) (12) (13) (14) (15) (16)
ΣCols(1)thru(3) ΣCols(5)thru(12) ΣCols(13)thru(15)
SC DSM Program Expenses
1 CIG DR Per Forecast 359,923$ - 359,923$ 35,992$ 24,085 -$ -$ 60,077$ -$ 27,992$ 88,069$
2 EnergyWise Per Forecast 1,630,393 - 1,630,393 163,039 248,329 - - 411,368 - 148,232 559,600
3 Total DSM Σ Lines 1 thru 2 1,990,316$ -$ 1,990,316$ 199,031$ 272,414$ -$ -$ 471,445$ -$ 176,224$ 647,669$
4 DSM Assigned to A&G Cost Per Books 128,462 128,462 12,846 36,855$ 238,449 93,272 381,422 - - 381,422
5 Total DSM and Assigned Cost Σ Lines 3 thru 4 1,990,316$ 128,462$ 2,118,778$ 211,877$ 309,269$ 238,449$ 93,272$ 852,867$ -$ 176,224$ 1,029,091$
SC EE Program Expenses `
6 Res Home Advantage Per Forecast 237,832$ -$ 237,832$ 23,783 38,168 -$ -$ 61,951$ 53,371$ 17,464$ 132,786
7 Res Home Energy Improvem't Per Forecast 1,102,843 - 1,102,843 110,284 191,945 - - 302,229 120,129 35,407 457,765
8 Residential Low Income Per Forecast 284,385 - 284,385 28,439 42,199 - - 70,638 77,886 - 148,524
9 CIG Energy Efficiency Per Forecast 1,164,301 - 1,164,301 116,430 191,109 - - 307,539 675,499 273,869 1,256,908
10 Solar Hot Water Pilot Per Forecast 1,410 - 1,410 141 5,201 - - 5,342 - - 5,342
11 Residential Lighting1Per Forecast 869,197 - 869,197 173,839 229,590 - - 403,429 1,279,297 158,380 1,841,106
12 Res Appliance Recycling Per Forecast 276,456 - 276,456 27,646 21,562 - - 49,208 88,693 9,971 147,872
13 Res EE Benchmarking1Per Forecast 135,308 - 135,308 135,308 - - - 135,308 120,550 1,448 257,307
14 Home Depot CFL Per Forecast - - - - 2,140 - - 2,140 - 10,473 12,613
15 Total EE Σ Lines 6 thru 14 4,071,732$ -$ 4,071,732$ 615,870$ 721,914$ -$ -$ 1,337,784$ 2,415,426$ 507,012$ 4,260,223$
16 EE Assigned to A&G Cost Per Books 252,257 252,257 25,226 66,311 484,189 189,396 765,122 - 765,122
17 Total EE and Assigned Cost Σ Lines 15 thru 16 4,071,732$ 252,257$ 4,323,989$ 641,096$ 788,225$ 484,189$ 189,396$ 2,102,906$ 2,415,426$ 507,012$ 5,025,345$
SC DSDR Program Expenses
18 DSDR Program Per Forecast 1,182,331$ 109,562$ -$ 1,291,893$ 129,189$ 169,441 1,285,434$ 650,668$ 236,206$ 905,006$ 147,665$ 57,761$ 3,581,370$ -$ -$ 3,581,370$
19 DSDR Assigned to A&G Cost Per Forecast - - - 42,206 42,206 - - 42,206
20 Total DSDR and Assigned Cost Σ Lines 18 thru 19 1,182,331$ 109,562$ -$ 1,291,893$ 129,189$ 211,647$ 1,285,434$ 650,668$ 236,206$ 905,006$ 147,665$ 57,761$ 3,623,576$ -$ -$ 3,623,576$
21 Rate Period Totals Lines 5 + 17 + 20 7,244,379$ 109,562$ 380,719$ 7,734,660$ 982,162$ 1,309,141$ 1,285,434$ 650,668$ 236,206$ 905,006$ 870,303$ 340,429$ 6,579,349$ 2,415,426$ 683,237$ 9,678,012$
1 Current Residential EE Benchmarking Program costs are recovered during the current period. Residential Lighting costs are recovered over a 5 year period. All other EE program costs are recovered over a 10 year period.
B. Rate Period
SOUTH CAROLINA JURISDICTIONALLY ALLOCATED RETAIL COSTS ONLY
Evans Exh
ibit N
o. 1
Page 2
of 2
Evans Exh
ibit N
o. 1

Evans Exhibit No. 2
Page 1 of 1
Residential General Service Lighting Total
1 Prior Period Recovery Balance at March 31, 2010
2 Energy Efficiency Programs Docket No. 2010-161-E 97,372.65$ (11,730.23)$ -$ 85,642.42$
3 Demand Side Management Programs Docket No. 2010-161-E (53,788.71) (5,123.11) - (58,911.82)
4 DSDR Program Expenses Docket No. 2010-161-E (165,758.90) (139,051.65) - (304,810.55)
5 Balance - Prior (Over) or Under Collection Lines 2 + 3 + 4 (122,174.96)$ (155,904.99)$ -$ (278,079.95)$
6
7 Current Period Cost of Service (4-01 to 3-11)
8 Energy Efficiency Programs Exhibit 1 (Page 1 of 2) 552,919.17$ 191,109.00$ -$ 744,028.17$
9 E E A&G and Carrying Cost Allocation Exhibit 1 (Page 1 of 2) 291,089.03 100,610.97 - 391,700.00
10 E E PPI and Net Lost Revenues Exhibit 1 (Page 1 of 2) 771,742.34 437,534.69 - 1,209,277.03
11 Total Energy Efficiency Cost of Service Lines 8 + 9 + 10 1,615,750.54$ 729,254.66$ -$ 2,345,005.20$
12
13 Demand Side Management Programs Exhibit 1 (Page 1 of 2) 248,329.00$ 24,085.00$ -$ 272,414.00$
14 DSM A&G and Carrying Cost Allocation Exhibit 1 (Page 1 of 2) 184,669.25 17,910.75 - 202,580.00
15 DSM PPI and Net Lost Revenues Exhibit 1 (Page 1 of 2) 87,092.37 9,896.73 - 96,989.10
16 Total DSM Cost of Service Lines 13 + 14 + 15 520,090.62 51,892.48 - 571,983.10
17
18 DSDR Program Exhibit 1 (Page 1 of 2) 1,228,548.62$ 774,786.38$ -$ 2,003,335.00$
19 DSDR A&G and Carrying Cost Allocation Exhibit 1 (Page 1 of 2) 25,882.90 16,323.10 - 42,206.00
20 DSDR Net Lost Revenues Exhibit 1 (Page 1 of 2) - - -
21 Total DSDR Cost of Service Lines 18 + 19 + 20 1,254,431.52$ 791,109.48$ -$ 2,045,541.00$
22
23 Cost of Service for 12 ME 3-31-11 Line 11 + Line 16 + Line 21 3,390,272.68$ 1,572,256.62$ -$ 4,962,529.30$
24
25 Cost of Service & Prior Bal at March 31, 2011
26 Energy Efficiency Programs Line 2 + Line 11 1,713,123.19$ 717,524.43$ -$ 2,430,647.62$
27 Demand Side Management Programs Line 3 + Line 16 466,301.90 46,769.37 - 513,071.27
28 DSDR Program Line 4 + Line 12 1,088,672.63 652,057.83 - 1,740,730.45
29 Total Net COS Before Revenue Offsets Lines 26 + 27 + 28 3,268,097.72$ 1,416,351.63$ -$ 4,684,449.35$
30
31 Actual Revenue (4-10 to 3-11)
32 EE Revenue Per Books see W/P R-2 1,643,973.36$ 660,036.68$ -$ 2,304,010.04$
33 DSM Revenue Per Books see W/P R-2 492,101.87 76,716.07 - 568,817.94
34 DSDR Revenue Per Books see W/P R-2 1,497,257.65 827,158.43 - 2,324,416.08
35 Total Test Period Revenue (4-10 to 3-11) Lines 32 + 33 + 34 3,633,332.88$ 1,563,911.18$ -$ 5,197,244.06$
36
37 Adjustments
38 Vintage 2009 Res HEIP M&V PPI True-Up See W/P D-5 (7,469.84)$ -$ -$ (7,469.84)$
39 Uncollectible - Energy Efficiency See W/P B-6 1,006.11 (130.69) - 875.42
40 Uncollectible - Demand Side Management See W/P B-6 301.17 (15.19) - 285.98
41 Uncollectible - DSDR See W/P B-6 916.32 (163.78) - 752.54
42 Total Adjustments Lines 38 + 39 + 40 + 41 (5,246.24)$ (309.66)$ -$ (5,555.90)$
43
44 Revenue Requirement at March 31, 2010
45 EE Portion of Revenue Requirement Lines 26 - 32 + 38 + 39 62,686.10$ 57,357.06$ -$ 120,043.16$
46
47 DSM Portion of Revenue Requirement Lines 27 - 33 + 40 (25,498.80)$ (29,961.89)$ -$ (55,460.69)$
48 DSDR Portion of Revenue Requirement Lines 28 - 34 + 41 (407,668.70) (175,264.38) - (582,933.09)
49 Total DSM/DSDR Portion of Revenue Rqmt Lines 47 + 48 (433,167.50)$ (205,226.27)$ -$ (638,393.77)$
50
51 Total Net Test Period Revenue Requirement Line 45 + Line 49 (370,481.40)$ (147,869.21)$ -$ (518,350.61)$
52 Forecasted Rate Period Revenue Requirement Exhibit 2 (Page 2 of 2) 9,678,011.92
53 Referenced Rate Period Recovery Level Lines 51 + 52 9,159,661.30$
PROGRESS ENERGY CAROLINAS, INC.Determination of Net Revenue Requirement for Test Period

Evans Exhibit No. 3
Page 1 of 1
Rate Class Opt-Out KWHs (1)
Residential 0
General Service 2,283,226,881
Lighting 2,942,406
Total Estimated Opt-Out Sales 2,286,169,287
NOTES:
(1) Opt-Out kWh estimates are based on actual opt-out quantities occurring during the twelve-month
period ending March 31, 2011.
PROGRESS ENERGY CAROLINAS, INC.
Annual DSM/EE Opt-Out Sales Estimate for SC Customers
Annual Sales for the Year Ended June, 2012

Evans Exhibit No. 4
Page 1 of 1
PROGRESS ENERGY CAROLINAS, INC.
Energy Allocation Factors - Applicable to EE Program Costs
South Carolina Rate Class Energy Allocation Factors
Rate Class
Total SC Rate Class
Sales (MWhrs) (1)
Opt-Out Sales(2)
Adjusted SC Rate
Class MWHr Sales
Rate Class Energy
Allocation Factor(1) (2) (3) = (1) - (2) (4) = (3) / SC Total in Column 3
Residential 2,137,681 0 2,137,681 50.13%
General Service 4,319,688 2,283,227 2,036,461 47.76%
Lighting 92,921 2,942 89,978 2.11%
SC Retail 6,550,290 2,286,169 4,264,121 100.00%
NOTES:
(1) Total SC Rate Class Sales (MWHrs) are for the forecasted year ended June 2012.
(2) Opt-Out sales are provided in Evans Exhibit No. 3

Evans Exhibit No. 5
Page 1 of 1
PROGRESS ENERGY CAROLINAS, INC.
Demand Allocation Factors - Applicable to DSM Programs
South Carolina Rate Class Demand Allocation Factors
Rate Class
Total SC Rate
Class Sales (1)
Sales Subject to
Opt-Out (2)
Rate Class
Demand (3)
Revised Rate
Class Demand
Rate Class Allocation
Factor(1) (2) (3) (4) = ((1 - 2) / 1) * 3 (5) = (4)/Total of Column 4
Residential 2,137,681 0 519,138 519,138 61.32517%
General Service 4,319,688 2,283,227 694,463 327,395 38.67483%
Lighting 92,921 2,942 0 0 0.00000%
SC Retail 6,550,290 2,286,169 1,213,601 846,534 100.00000%
NOTES:
(1) Total SC Rate Class Sales (MWHrs) are for the forecasted year ended June 2012.
(2) Opt-Out sales are provided in Evans Exhibit No. 3
(3) The CP demands are based on the 2010 Coincident Peak occurring on August 11 during the hour ended at 5 P.M.

SC Rate Class
Adjusted SC
Rate Class kWHr
Sales (1)
Rate Class
Energy
Allocation
Factor (2)
Residential
Programs(3)
CIG Programs(4)
Common
Programs
Allocated A&G
Costs(5)
Allocated Carrying
Costs(5)
Net Test Period
Revenue
Requirement(6)
Total of Allocated
Costs Total EE Rate(1) (2) (3) (4) (5) (6) (7) (8) (9) = Σ (3 thru 8) (10) = (9) / (1)
Residential 2,137,681,477 50.13% $3,003,315 $0 $0 $70,494 $518,737 $62,686 $3,655,232 $0.001710
General Service 2,036,460,918 47.76% $0 $1,256,908 $0 $21,043 $154,848 $57,357 $1,490,156 $0.000732
Lighting 89,978,436 2.11% $0 $0 $0 $0 $0 $0 $0 $0.000000
SC Retail 4,264,120,831 100% $3,003,315 $1,256,908 $0 $91,537 $673,585 $120,043 $5,145,388 $0.001207
NOTES:
(1) Rate Class Sales, excluding "Opt-Out" sales, are derived in Evans Exhibit No. 4, column (3).
(2) Rate Class Energy Allocation Factor is derived in Evans Exhibit No. 4, column (4).
(3) CFL Pilot, Solar Water Heating Pilot, EE Benchmarking, Res. HEIP, Res. Lighting, Appliance Recycling, Res. Home Advantage and Low Income Program costs are allocated solely to Residential Class.
(4) CIG Energy Efficiency costs are allocated solely to General Service Class.
(5) A&G and Carrying Costs are allocated on the basis of revenue requirements (excluding incentives).
(6) Net Energy Efficiency Revenue Requirements are derived on Evans Exhibit No. 2
PROGRESS ENERGY CAROLINAS, INC.
Energy Efficiency Rate Derivation
EE Revenue Requirements
Evans Exh
ibit N
o. 6
Page 1
of 1
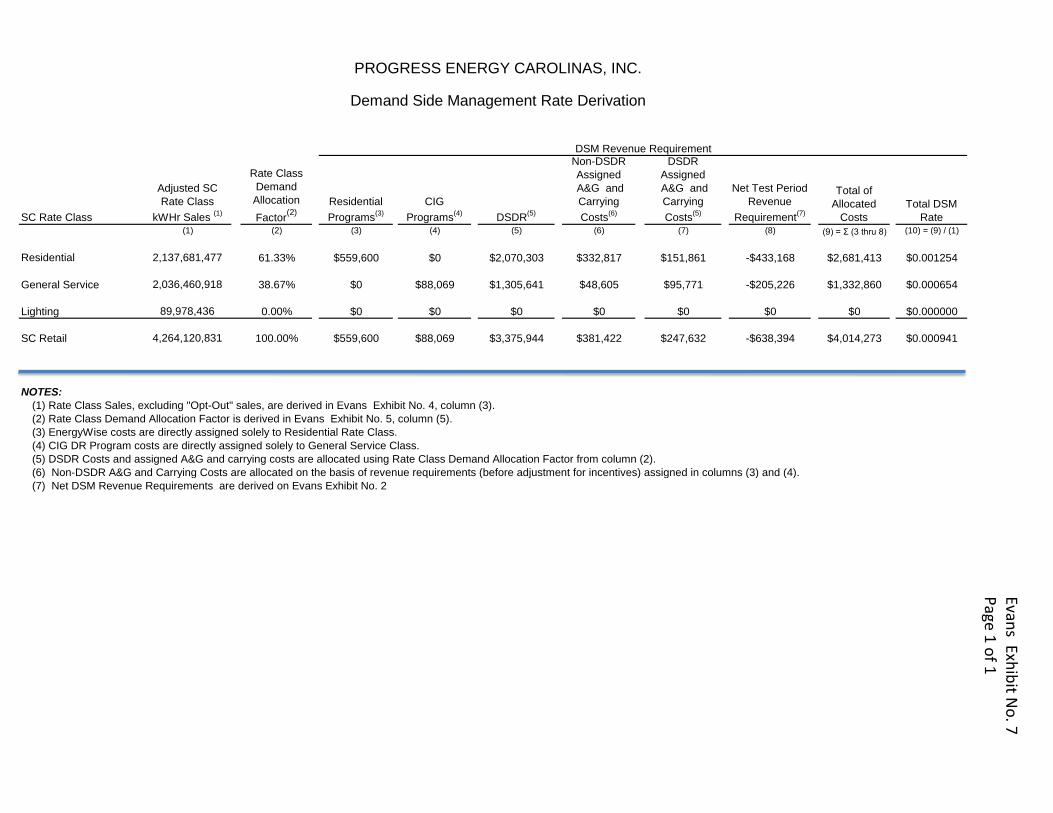
SC Rate Class
Adjusted SC
Rate Class
kWHr Sales (1)
Rate Class
Demand
Allocation
Factor(2)
Residential
Programs(3)
CIG
Programs(4)
DSDR(5)
Non-DSDR
Assigned
A&G and
Carrying
Costs(6)
DSDR
Assigned
A&G and
Carrying
Costs(5)
Net Test Period
Revenue
Requirement(7)
Total of
Allocated
Costs
Total DSM
Rate(1) (2) (3) (4) (5) (6) (7) (8) (9) = Σ (3 thru 8) (10) = (9) / (1)
Residential 2,137,681,477 61.33% $559,600 $0 $2,070,303 $332,817 $151,861 -$433,168 $2,681,413 $0.001254
General Service 2,036,460,918 38.67% $0 $88,069 $1,305,641 $48,605 $95,771 -$205,226 $1,332,860 $0.000654
Lighting 89,978,436 0.00% $0 $0 $0 $0 $0 $0 $0 $0.000000
SC Retail 4,264,120,831 100.00% $559,600 $88,069 $3,375,944 $381,422 $247,632 -$638,394 $4,014,273 $0.000941
NOTES:
(1) Rate Class Sales, excluding "Opt-Out" sales, are derived in Evans Exhibit No. 4, column (3).
(2) Rate Class Demand Allocation Factor is derived in Evans Exhibit No. 5, column (5).
(3) EnergyWise costs are directly assigned solely to Residential Rate Class.
(4) CIG DR Program costs are directly assigned solely to General Service Class.
(5) DSDR Costs and assigned A&G and carrying costs are allocated using Rate Class Demand Allocation Factor from column (2).
(6) Non-DSDR A&G and Carrying Costs are allocated on the basis of revenue requirements (before adjustment for incentives) assigned in columns (3) and (4).
(7) Net DSM Revenue Requirements are derived on Evans Exhibit No. 2
PROGRESS ENERGY CAROLINAS, INC.
Demand Side Management Rate Derivation
DSM Revenue Requirement
Evans Exh
ibit N
o. 7
Page 1
of 1

Evans Exhibit No. 8
Page 1 of 1
Residential Adjustment Factor
1 Billed kWh (12ME 3/31/11) Per Books 2,361,711,406
2 Billed RECD kWh (12ME 3/31/11) Per Books 377,603,054 (a)
3 RECD kWh Percent of Total Billed Line 2 / Line 1 15.9885%
4 RECD Discount Percentage RECD Discount 5.0000% (b)
5 RECD Impact (Weighted Discount) Line 3 x Line 4 0.7994% (d)
6 Uncollectable Estimate for Forecast Period W/P B-6 0.7019% (c)
7 Residential Adjustment Factor for Rate Period Line 5 + Line 6 1.5013% (d)
General Service Adjustment Factor
8 Uncollectable Estimate for Forecast Period W/P B-6 0.0593% (c)
9 General Service Adjustment Factor for Rate Period Line 8 0.0593% (d)
Notes:
(a) Energy billed and discounted pursuant to Residential Energy Conservation Discount, Rider RECD-2B.
(b) Five-percent discount provided under Residential Energy Conservation Discount, Rider RECD-2B.
(c) Estimated incremental level of uncollectables associated with DSM/EE billings.
(d) Estimated impacts of uncollectable and RECD related discounts will be trued up to actual amounts.
PROGRESS ENERGY CAROLINAS, INC.
EE/DSM Billing Rate - July 2011 through June 2012
Revenue Adjustment Factors

Evans Exhibit No. 9
Page 1 of 1
SC Rate Class
Total EE
Rate
Total DSM
Rate
Total
DSM/EE
Rate
RECD &
Uncollectible
Adjustment
DSM/EE
Rate(1) (2) (3) (4) (5)
Residential 0.001710$ $0.001254 0.002964$ $0.000045 $0.00301
General Service 0.000732 0.000654 0.001386 0.000001 $0.00139
Lighting 0.000000 0.000000 0.000000 0.000000 $0.00000
SC Rate Class
DSM/EE
Billing Rate(8)
Residential $0.00301 $0.00001 $0.00302
General Service 0.00140
Lighting 0.00000
NOTES:
(1) Total EE Rate is derived in Evans Exhibit No. 6, column (10).
(2) Total DSM Rate is derived in Evans Exhibit No. 7, column (10).
(3) Total DSM/EE Rate is sum of columns (1) and (2 ).
(4) Adjustment factors derived in Evans Exhibit No. 8 applied to column (3)
(5) DSM/EE Rate is derived from the sum of columns (3) and (4) and rounded to 5 decimal points..
(6) DSM/EE Billing Rate from column (5)
(7) Calculated Gross Receipts Tax and Regulatory Fee at the combined rate of 0.45151% on column (6)
(8) DSM/EE Billing Rate is derived from the sum of columns (6) and (7) and rounded to 5 decimal points.
PROGRESS ENERGY CAROLINAS, INC.
EE/DSM Billing Rate - July 2011 through June 2012
All rates are shown in dollars per kWh
Rates Including SC Gross Receipts Taxes at 0.30% and Regulatory Fee at 0.15151%
0.00001
0.00000
DSM/EE Rate (net of GRT and Regulatory Fee)
Gross Receipts Tax and
Regulatory Fee Adjustment(6) (7)
Rates Net of South Carolina Gross Receipts Taxes (GRT) and Regulatory Fee
0.00139
0.00000

PEC Exhibit No. 1 Workpapers
PROGRESS ENERGY CAROLINAS, INC
Demand Side Management and Energy Efficiency Programs
Workpapers
SC Docket No: 2010 -___- E

Workpapers Section A – Cost Summary & Rate Development
(Exhibits)

South Carolina Retail - DSM/EE Revenue Requirements Summary
O&M Insurance A&G Expense
Capitalized
O&M and
A&G
Current Period
Amortization
Prior Period
Amortization
DSDR Capital
Costs
Income Taxes
on DSDR
Capital Costs
DSDR
Property
Taxes
DSDR
Depreciation
Carrying Costs
Net of Taxes
Income Taxes
on Carrying
Cost
Rev Reqmt
Before PPI &
NLR
Net Lost
Revenue PPI
Total Revenue
Requirement
April 2010 through March 2011 (1) (2) (3) (4) (5) (6) (7) (8) (9) (10) (11) (12) (13) (14) (15) (16)
ΣCols(1)thru(3) ΣCols(5)thru(12) ΣCols(13)thru(15)
SC DSM Program Expenses
1 CIG DR Per Books 158,098$ -$ 158,098$ 15,810$ 8,275$ -$ -$ 24,085$ 685$ 9,212$ 33,982$
2 EnergyWise Per Books 1,384,322 - 1,384,322 138,432 109,897 - - 248,329 1,292 85,800 335,421
3 Total DSM Σ Lines 1 thru 2 1,542,420$ -$ 1,542,420$ 154,242$ 118,172$ -$ -$ 272,414$ 1,977$ 95,013$ 369,403$
4 DSM Assigned to A&G Cost Per Books 119,294 119,294 11,929 24,926 120,579 45,146 202,580 - - 202,580
5 Total DSM and Assigned Cost Σ Lines 3 thru 4 1,542,420$ 119,294$ 1,661,714$ 166,171$ 143,098$ 120,579$ 45,146$ 474,994$ 1,977$ 95,013$ 571,983$
SC EE Program Expenses `
6 Res Home Advantage Per Books 184,768$ -$ 184,768$ 18,477$ 19,691$ -$ -$ 38,168$ 20,832$ 6,888$ 65,889$
7 Res Home Energy Improvem't Per Books 1,222,405 - 1,222,405 122,241 69,704 - - 191,945 45,485 16,429 253,859
8 Residential Low Income Per Books 294,637 - 294,637 29,464 12,735 - - 42,199 32,411 - 74,610
9 CIG Energy Efficiency Per Books 1,074,827 - 1,074,827 107,483 83,626 - - 191,109 307,764 129,771 628,644
10 Solar Hot Water Pilot Per Books 29,055 - 29,055 2,906 2,295 - - 5,201 - - 5,201
11 Residential Lighting1Per Books 970,544 - 970,544 194,109 35,481 - - 229,590 512,739 76,778 819,106
12 Res Appliance Recycling Per Books 202,421 - 202,421 20,242 1,320 - - 21,562 21,881 3,849 47,292
13 Res EE Benchmarking1Per Books 22,114 22,114 22,114 - - - 22,114 - - 22,114
14 Home Depot CFL Per Books - - - - 2,140 - - 2,140 23,977 10,473 36,590
15 Total EE Σ Lines 6 thru 14 4,000,771$ -$ 4,000,771$ 517,036$ 226,992$ -$ -$ 744,028$ 965,089$ 244,188$ 1,953,305$
16 EE Assigned A&G and Carrying Cost Per Books 234,262 234,262 23,426 42,885 236,659 88,730 391,700 - - 391,700
17 Total EE and Assigned Cost Σ Lines 15 thru 16 4,000,771$ 234,262$ 4,235,033$ 540,462$ 269,877$ 236,659$ 88,730$ 1,135,728$ 965,089$ 244,188$ 2,345,005$
SC DSDR Program Expenses
18 DSDR Program Per Books 731,264$ 62,617$ -$ 793,881$ 79,388$ 90,053$ 794,279$ 291,422$ 105,694$ 515,874$ 92,175$ 34,450$ 2,003,335$ -$ -$ 2,003,335$
19 DSDR A&G and Carrying Cost Per Books 3,504 3,504 350 41,856 42,206 - - 42,206
20 Total DSDR and Assigned Cost Σ Lines 18 thru 19 731,264$ 62,617$ 3,504$ 797,385$ 79,738$ 131,909$ 794,279$ 291,422$ 105,694$ 515,874$ 92,175$ 34,450$ 2,045,541$ -$ -$ 2,045,541$
21 Test Period Totals Lines 5 + 17 + 20 6,274,455$ 62,617$ 357,060$ 6,694,132$ 786,371$ 544,884$ 794,279$ 291,422$ 105,694$ 515,874$ 449,413$ 168,326$ 3,656,263$ 967,065$ 339,201$ 4,962,529$
1 Current Residential EE Benchmarking Program costs are recovered during the current period. Residential Lighting costs are recovered over a 5 year period. All other EE program costs are recovered over a 10 year period.
A. Test PeriodSOUTH CAROLINA JURISDICTIONALLY ALLOCATED RETAIL COSTS ONLY
Evans Exh
ibit N
o. 1
Page 1
of 2
W/P D-2
W/P D-1
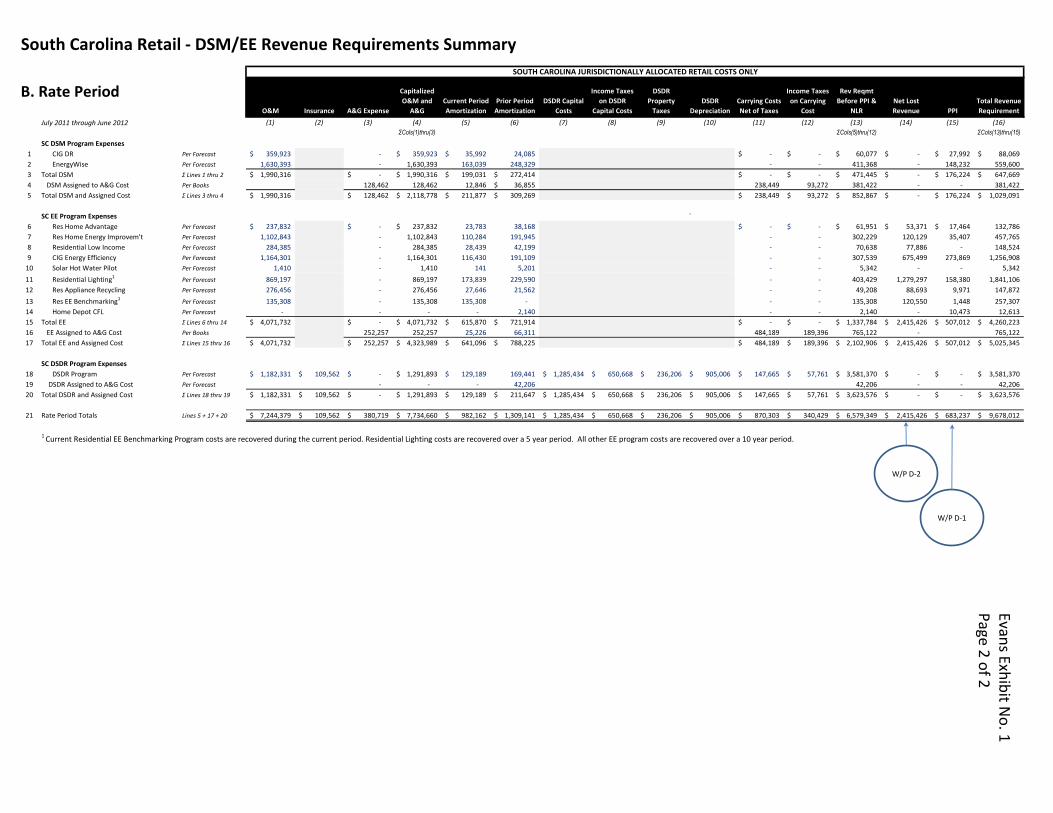
South Carolina Retail - DSM/EE Revenue Requirements Summary
O&M Insurance A&G Expense
Capitalized
O&M and
A&G
Current Period
Amortization
Prior Period
Amortization
DSDR Capital
Costs
Income Taxes
on DSDR
Capital Costs
DSDR
Property
Taxes
DSDR
Depreciation
Carrying Costs
Net of Taxes
Income Taxes
on Carrying
Cost
Rev Reqmt
Before PPI &
NLR
Net Lost
Revenue PPI
Total Revenue
Requirement
July 2011 through June 2012 (1) (2) (3) (4) (5) (6) (7) (8) (9) (10) (11) (12) (13) (14) (15) (16)
ΣCols(1)thru(3) ΣCols(5)thru(12) ΣCols(13)thru(15)
SC DSM Program Expenses
1 CIG DR Per Forecast 359,923$ - 359,923$ 35,992$ 24,085 -$ -$ 60,077$ -$ 27,992$ 88,069$
2 EnergyWise Per Forecast 1,630,393 - 1,630,393 163,039 248,329 - - 411,368 - 148,232 559,600
3 Total DSM Σ Lines 1 thru 2 1,990,316$ -$ 1,990,316$ 199,031$ 272,414$ -$ -$ 471,445$ -$ 176,224$ 647,669$
4 DSM Assigned to A&G Cost Per Books 128,462 128,462 12,846 36,855$ 238,449 93,272 381,422 - - 381,422
5 Total DSM and Assigned Cost Σ Lines 3 thru 4 1,990,316$ 128,462$ 2,118,778$ 211,877$ 309,269$ 238,449$ 93,272$ 852,867$ -$ 176,224$ 1,029,091$
SC EE Program Expenses `
6 Res Home Advantage Per Forecast 237,832$ -$ 237,832$ 23,783 38,168 -$ -$ 61,951$ 53,371$ 17,464$ 132,786
7 Res Home Energy Improvem't Per Forecast 1,102,843 - 1,102,843 110,284 191,945 - - 302,229 120,129 35,407 457,765
8 Residential Low Income Per Forecast 284,385 - 284,385 28,439 42,199 - - 70,638 77,886 - 148,524
9 CIG Energy Efficiency Per Forecast 1,164,301 - 1,164,301 116,430 191,109 - - 307,539 675,499 273,869 1,256,908
10 Solar Hot Water Pilot Per Forecast 1,410 - 1,410 141 5,201 - - 5,342 - - 5,342
11 Residential Lighting1Per Forecast 869,197 - 869,197 173,839 229,590 - - 403,429 1,279,297 158,380 1,841,106
12 Res Appliance Recycling Per Forecast 276,456 - 276,456 27,646 21,562 - - 49,208 88,693 9,971 147,872
13 Res EE Benchmarking1Per Forecast 135,308 - 135,308 135,308 - - - 135,308 120,550 1,448 257,307
14 Home Depot CFL Per Forecast - - - - 2,140 - - 2,140 - 10,473 12,613
15 Total EE Σ Lines 6 thru 14 4,071,732$ -$ 4,071,732$ 615,870$ 721,914$ -$ -$ 1,337,784$ 2,415,426$ 507,012$ 4,260,223$
16 EE Assigned to A&G Cost Per Books 252,257 252,257 25,226 66,311 484,189 189,396 765,122 - 765,122
17 Total EE and Assigned Cost Σ Lines 15 thru 16 4,071,732$ 252,257$ 4,323,989$ 641,096$ 788,225$ 484,189$ 189,396$ 2,102,906$ 2,415,426$ 507,012$ 5,025,345$
SC DSDR Program Expenses
18 DSDR Program Per Forecast 1,182,331$ 109,562$ -$ 1,291,893$ 129,189$ 169,441 1,285,434$ 650,668$ 236,206$ 905,006$ 147,665$ 57,761$ 3,581,370$ -$ -$ 3,581,370$
19 DSDR Assigned to A&G Cost Per Forecast - - - 42,206 42,206 - - 42,206
20 Total DSDR and Assigned Cost Σ Lines 18 thru 19 1,182,331$ 109,562$ -$ 1,291,893$ 129,189$ 211,647$ 1,285,434$ 650,668$ 236,206$ 905,006$ 147,665$ 57,761$ 3,623,576$ -$ -$ 3,623,576$
21 Rate Period Totals Lines 5 + 17 + 20 7,244,379$ 109,562$ 380,719$ 7,734,660$ 982,162$ 1,309,141$ 1,285,434$ 650,668$ 236,206$ 905,006$ 870,303$ 340,429$ 6,579,349$ 2,415,426$ 683,237$ 9,678,012$
1 Current Residential EE Benchmarking Program costs are recovered during the current period. Residential Lighting costs are recovered over a 5 year period. All other EE program costs are recovered over a 10 year period.
B. Rate Period
SOUTH CAROLINA JURISDICTIONALLY ALLOCATED RETAIL COSTS ONLY
Evans Exh
ibit N
o. 1
Page 2
of 2
Evans Exh
ibit N
o. 1
W/P D-1
W/P D-2
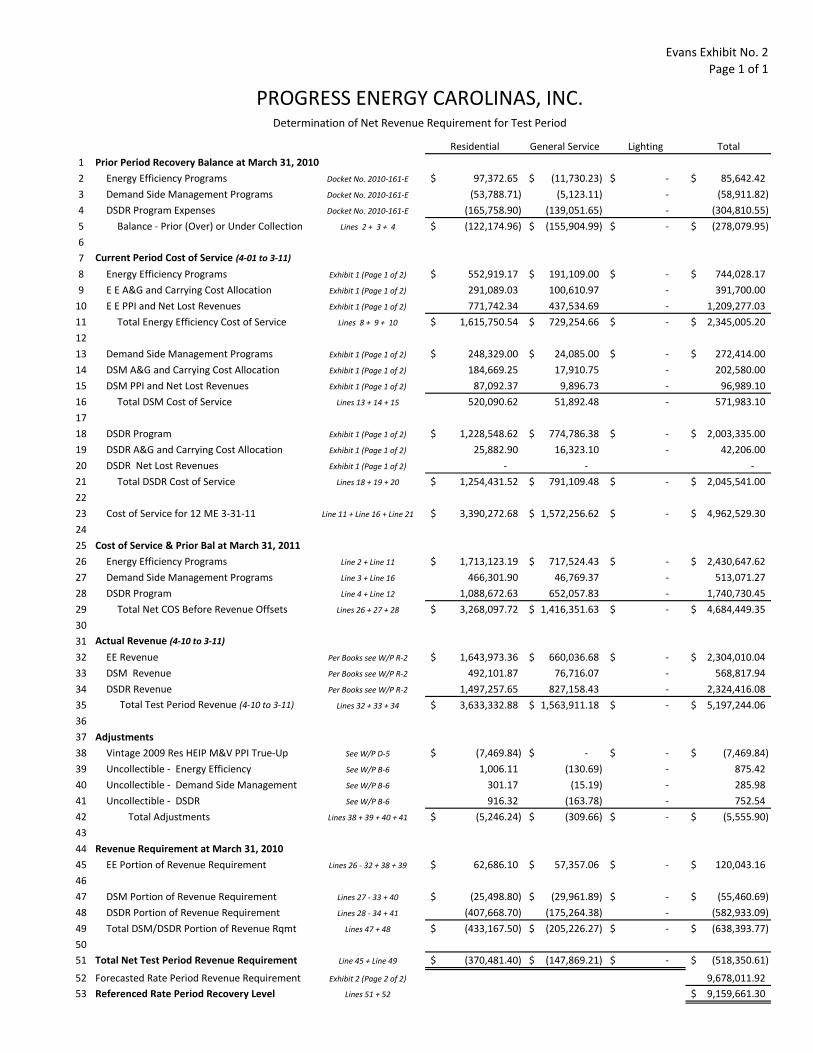
Evans Exhibit No. 2
Page 1 of 1
Residential General Service Lighting Total
1 Prior Period Recovery Balance at March 31, 2010
2 Energy Efficiency Programs Docket No. 2010-161-E 97,372.65$ (11,730.23)$ -$ 85,642.42$
3 Demand Side Management Programs Docket No. 2010-161-E (53,788.71) (5,123.11) - (58,911.82)
4 DSDR Program Expenses Docket No. 2010-161-E (165,758.90) (139,051.65) - (304,810.55)
5 Balance - Prior (Over) or Under Collection Lines 2 + 3 + 4 (122,174.96)$ (155,904.99)$ -$ (278,079.95)$
6
7 Current Period Cost of Service (4-01 to 3-11)
8 Energy Efficiency Programs Exhibit 1 (Page 1 of 2) 552,919.17$ 191,109.00$ -$ 744,028.17$
9 E E A&G and Carrying Cost Allocation Exhibit 1 (Page 1 of 2) 291,089.03 100,610.97 - 391,700.00
10 E E PPI and Net Lost Revenues Exhibit 1 (Page 1 of 2) 771,742.34 437,534.69 - 1,209,277.03
11 Total Energy Efficiency Cost of Service Lines 8 + 9 + 10 1,615,750.54$ 729,254.66$ -$ 2,345,005.20$
12
13 Demand Side Management Programs Exhibit 1 (Page 1 of 2) 248,329.00$ 24,085.00$ -$ 272,414.00$
14 DSM A&G and Carrying Cost Allocation Exhibit 1 (Page 1 of 2) 184,669.25 17,910.75 - 202,580.00
15 DSM PPI and Net Lost Revenues Exhibit 1 (Page 1 of 2) 87,092.37 9,896.73 - 96,989.10
16 Total DSM Cost of Service Lines 13 + 14 + 15 520,090.62 51,892.48 - 571,983.10
17
18 DSDR Program Exhibit 1 (Page 1 of 2) 1,228,548.62$ 774,786.38$ -$ 2,003,335.00$
19 DSDR A&G and Carrying Cost Allocation Exhibit 1 (Page 1 of 2) 25,882.90 16,323.10 - 42,206.00
20 DSDR Net Lost Revenues Exhibit 1 (Page 1 of 2) - - -
21 Total DSDR Cost of Service Lines 18 + 19 + 20 1,254,431.52$ 791,109.48$ -$ 2,045,541.00$
22
23 Cost of Service for 12 ME 3-31-11 Line 11 + Line 16 + Line 21 3,390,272.68$ 1,572,256.62$ -$ 4,962,529.30$
24
25 Cost of Service & Prior Bal at March 31, 2011
26 Energy Efficiency Programs Line 2 + Line 11 1,713,123.19$ 717,524.43$ -$ 2,430,647.62$
27 Demand Side Management Programs Line 3 + Line 16 466,301.90 46,769.37 - 513,071.27
28 DSDR Program Line 4 + Line 12 1,088,672.63 652,057.83 - 1,740,730.45
29 Total Net COS Before Revenue Offsets Lines 26 + 27 + 28 3,268,097.72$ 1,416,351.63$ -$ 4,684,449.35$
30
31 Actual Revenue (4-10 to 3-11)
32 EE Revenue Per Books see W/P R-2 1,643,973.36$ 660,036.68$ -$ 2,304,010.04$
33 DSM Revenue Per Books see W/P R-2 492,101.87 76,716.07 - 568,817.94
34 DSDR Revenue Per Books see W/P R-2 1,497,257.65 827,158.43 - 2,324,416.08
35 Total Test Period Revenue (4-10 to 3-11) Lines 32 + 33 + 34 3,633,332.88$ 1,563,911.18$ -$ 5,197,244.06$
36
37 Adjustments
38 Vintage 2009 Res HEIP M&V PPI True-Up See W/P D-5 (7,469.84)$ -$ -$ (7,469.84)$
39 Uncollectible - Energy Efficiency See W/P B-6 1,006.11 (130.69) - 875.42
40 Uncollectible - Demand Side Management See W/P B-6 301.17 (15.19) - 285.98
41 Uncollectible - DSDR See W/P B-6 916.32 (163.78) - 752.54
42 Total Adjustments Lines 38 + 39 + 40 + 41 (5,246.24)$ (309.66)$ -$ (5,555.90)$
43
44 Revenue Requirement at March 31, 2010
45 EE Portion of Revenue Requirement Lines 26 - 32 + 38 + 39 62,686.10$ 57,357.06$ -$ 120,043.16$
46
47 DSM Portion of Revenue Requirement Lines 27 - 33 + 40 (25,498.80)$ (29,961.89)$ -$ (55,460.69)$
48 DSDR Portion of Revenue Requirement Lines 28 - 34 + 41 (407,668.70) (175,264.38) - (582,933.09)
49 Total DSM/DSDR Portion of Revenue Rqmt Lines 47 + 48 (433,167.50)$ (205,226.27)$ -$ (638,393.77)$
50
51 Total Net Test Period Revenue Requirement Line 45 + Line 49 (370,481.40)$ (147,869.21)$ -$ (518,350.61)$
52 Forecasted Rate Period Revenue Requirement Exhibit 2 (Page 2 of 2) 9,678,011.92
53 Referenced Rate Period Recovery Level Lines 51 + 52 9,159,661.30$
PROGRESS ENERGY CAROLINAS, INC.Determination of Net Revenue Requirement for Test Period

Evans Exhibit No. 3
Page 1 of 1
Rate Class Opt-Out KWHs (1)
Residential 0
General Service 2,283,226,881
Lighting 2,942,406
Total Estimated Opt-Out Sales 2,286,169,287
NOTES:
(1) Opt-Out kWh estimates are based on actual opt-out quantities occurring during the twelve-month
period ending March 31, 2011.
PROGRESS ENERGY CAROLINAS, INC.
Annual DSM/EE Opt-Out Sales Estimate for SC Customers
Annual Sales for the Year Ended June, 2012

Evans Exhibit No. 4
Page 1 of 1
PROGRESS ENERGY CAROLINAS, INC.
Energy Allocation Factors - Applicable to EE Program Costs
South Carolina Rate Class Energy Allocation Factors
Rate Class
Total SC Rate Class
Sales (MWhrs) (1)
Opt-Out Sales(2)
Adjusted SC Rate
Class MWHr Sales
Rate Class Energy
Allocation Factor(1) (2) (3) = (1) - (2) (4) = (3) / SC Total in Column 3
Residential 2,137,681 0 2,137,681 50.13%
General Service 4,319,688 2,283,227 2,036,461 47.76%
Lighting 92,921 2,942 89,978 2.11%
SC Retail 6,550,290 2,286,169 4,264,121 100.00%
NOTES:
(1) Total SC Rate Class Sales (MWHrs) are for the forecasted year ended June 2012.
(2) Opt-Out sales are provided in Evans Exhibit No. 3
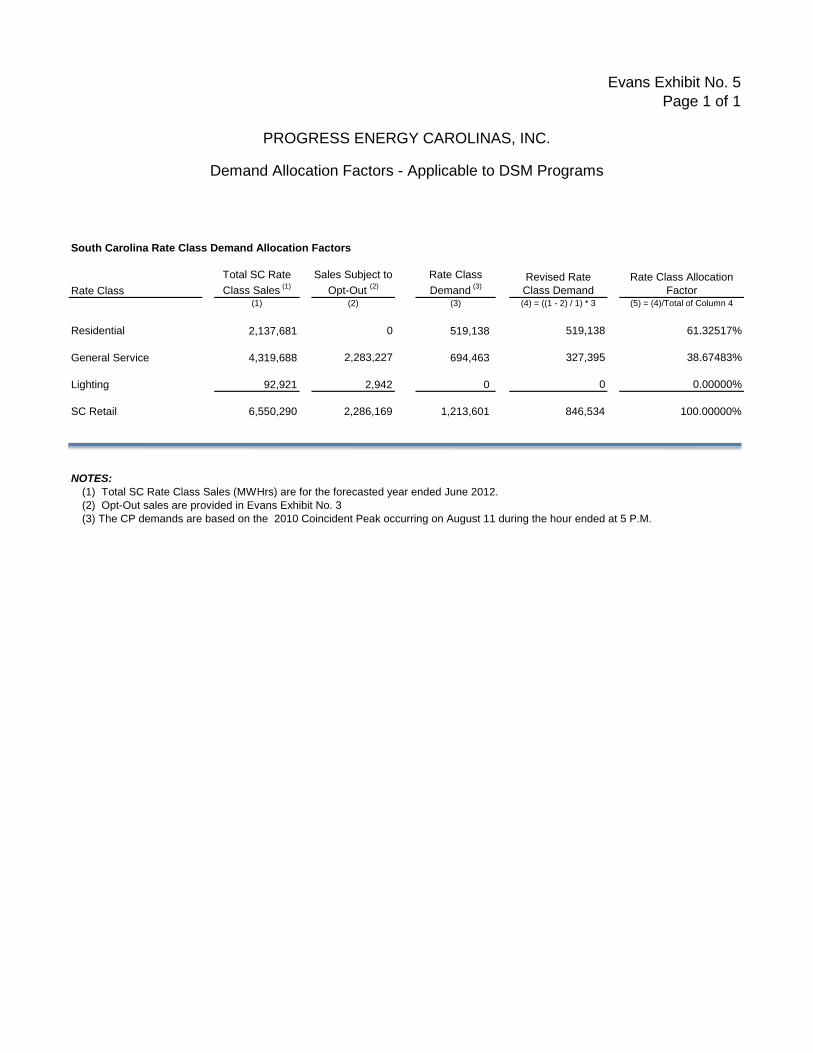
Evans Exhibit No. 5
Page 1 of 1
PROGRESS ENERGY CAROLINAS, INC.
Demand Allocation Factors - Applicable to DSM Programs
South Carolina Rate Class Demand Allocation Factors
Rate Class
Total SC Rate
Class Sales (1)
Sales Subject to
Opt-Out (2)
Rate Class
Demand (3)
Revised Rate
Class Demand
Rate Class Allocation
Factor(1) (2) (3) (4) = ((1 - 2) / 1) * 3 (5) = (4)/Total of Column 4
Residential 2,137,681 0 519,138 519,138 61.32517%
General Service 4,319,688 2,283,227 694,463 327,395 38.67483%
Lighting 92,921 2,942 0 0 0.00000%
SC Retail 6,550,290 2,286,169 1,213,601 846,534 100.00000%
NOTES:
(1) Total SC Rate Class Sales (MWHrs) are for the forecasted year ended June 2012.
(2) Opt-Out sales are provided in Evans Exhibit No. 3
(3) The CP demands are based on the 2010 Coincident Peak occurring on August 11 during the hour ended at 5 P.M.

SC Rate Class
Adjusted SC
Rate Class kWHr
Sales (1)
Rate Class
Energy
Allocation
Factor (2)
Residential
Programs(3)
CIG Programs(4)
Common
Programs
Allocated A&G
Costs(5)
Allocated Carrying
Costs(5)
Net Test Period
Revenue
Requirement(6)
Total of Allocated
Costs Total EE Rate(1) (2) (3) (4) (5) (6) (7) (8) (9) = Σ (3 thru 8) (10) = (9) / (1)
Residential 2,137,681,477 50.13% $3,003,315 $0 $0 $70,494 $518,737 $62,686 $3,655,232 $0.001710
General Service 2,036,460,918 47.76% $0 $1,256,908 $0 $21,043 $154,848 $57,357 $1,490,156 $0.000732
Lighting 89,978,436 2.11% $0 $0 $0 $0 $0 $0 $0 $0.000000
SC Retail 4,264,120,831 100% $3,003,315 $1,256,908 $0 $91,537 $673,585 $120,043 $5,145,388 $0.001207
NOTES:
(1) Rate Class Sales, excluding "Opt-Out" sales, are derived in Evans Exhibit No. 4, column (3).
(2) Rate Class Energy Allocation Factor is derived in Evans Exhibit No. 4, column (4).
(3) CFL Pilot, Solar Water Heating Pilot, EE Benchmarking, Res. HEIP, Res. Lighting, Appliance Recycling, Res. Home Advantage and Low Income Program costs are allocated solely to Residential Class.
(4) CIG Energy Efficiency costs are allocated solely to General Service Class.
(5) A&G and Carrying Costs are allocated on the basis of revenue requirements (excluding incentives).
(6) Net Energy Efficiency Revenue Requirements are derived on Evans Exhibit No. 2
PROGRESS ENERGY CAROLINAS, INC.
Energy Efficiency Rate Derivation
EE Revenue Requirements
Evans Exh
ibit N
o. 6
Page 1
of 1

SC Rate Class
Adjusted SC
Rate Class
kWHr Sales (1)
Rate Class
Demand
Allocation
Factor(2)
Residential
Programs(3)
CIG
Programs(4)
DSDR(5)
Non-DSDR
Assigned
A&G and
Carrying
Costs(6)
DSDR
Assigned
A&G and
Carrying
Costs(5)
Net Test Period
Revenue
Requirement(7)
Total of
Allocated
Costs
Total DSM
Rate(1) (2) (3) (4) (5) (6) (7) (8) (9) = Σ (3 thru 8) (10) = (9) / (1)
Residential 2,137,681,477 61.33% $559,600 $0 $2,070,303 $332,817 $151,861 -$433,168 $2,681,413 $0.001254
General Service 2,036,460,918 38.67% $0 $88,069 $1,305,641 $48,605 $95,771 -$205,226 $1,332,860 $0.000654
Lighting 89,978,436 0.00% $0 $0 $0 $0 $0 $0 $0 $0.000000
SC Retail 4,264,120,831 100.00% $559,600 $88,069 $3,375,944 $381,422 $247,632 -$638,394 $4,014,273 $0.000941
NOTES:
(1) Rate Class Sales, excluding "Opt-Out" sales, are derived in Evans Exhibit No. 4, column (3).
(2) Rate Class Demand Allocation Factor is derived in Evans Exhibit No. 5, column (5).
(3) EnergyWise costs are directly assigned solely to Residential Rate Class.
(4) CIG DR Program costs are directly assigned solely to General Service Class.
(5) DSDR Costs and assigned A&G and carrying costs are allocated using Rate Class Demand Allocation Factor from column (2).
(6) Non-DSDR A&G and Carrying Costs are allocated on the basis of revenue requirements (before adjustment for incentives) assigned in columns (3) and (4).
(7) Net DSM Revenue Requirements are derived on Evans Exhibit No. 2
PROGRESS ENERGY CAROLINAS, INC.
Demand Side Management Rate Derivation
DSM Revenue Requirement
Evans Exh
ibit N
o. 7
Page 1
of 1

Evans Exhibit No. 8
Page 1 of 1
Residential Adjustment Factor
1 Billed kWh (12ME 3/31/11) Per Books 2,361,711,406
2 Billed RECD kWh (12ME 3/31/11) Per Books 377,603,054 (a)
3 RECD kWh Percent of Total Billed Line 2 / Line 1 15.9885%
4 RECD Discount Percentage RECD Discount 5.0000% (b)
5 RECD Impact (Weighted Discount) Line 3 x Line 4 0.7994% (d)
6 Uncollectable Estimate for Forecast Period W/P B-6 0.7019% (c)
7 Residential Adjustment Factor for Rate Period Line 5 + Line 6 1.5013% (d)
General Service Adjustment Factor
8 Uncollectable Estimate for Forecast Period W/P B-6 0.0593% (c)
9 General Service Adjustment Factor for Rate Period Line 8 0.0593% (d)
Notes:
(a) Energy billed and discounted pursuant to Residential Energy Conservation Discount, Rider RECD-2B.
(b) Five-percent discount provided under Residential Energy Conservation Discount, Rider RECD-2B.
(c) Estimated incremental level of uncollectables associated with DSM/EE billings.
(d) Estimated impacts of uncollectable and RECD related discounts will be trued up to actual amounts.
PROGRESS ENERGY CAROLINAS, INC.
EE/DSM Billing Rate - July 2011 through June 2012
Revenue Adjustment Factors

Evans Exhibit No. 9
Page 1 of 1
SC Rate Class
Total EE
Rate
Total DSM
Rate
Total
DSM/EE
Rate
RECD &
Uncollectible
Adjustment
DSM/EE
Rate(1) (2) (3) (4) (5)
Residential 0.001710$ $0.001254 0.002964$ $0.000045 $0.00301
General Service 0.000732 0.000654 0.001386 0.000001 $0.00139
Lighting 0.000000 0.000000 0.000000 0.000000 $0.00000
SC Rate Class
DSM/EE
Billing Rate(8)
Residential $0.00301 $0.00001 $0.00302
General Service 0.00140
Lighting 0.00000
NOTES:
(1) Total EE Rate is derived in Evans Exhibit No. 6, column (10).
(2) Total DSM Rate is derived in Evans Exhibit No. 7, column (10).
(3) Total DSM/EE Rate is sum of columns (1) and (2 ).
(4) Adjustment factors derived in Evans Exhibit No. 8 applied to column (3)
(5) DSM/EE Rate is derived from the sum of columns (3) and (4) and rounded to 5 decimal points..
(6) DSM/EE Billing Rate from column (5)
(7) Calculated Gross Receipts Tax and Regulatory Fee at the combined rate of 0.45151% on column (6)
(8) DSM/EE Billing Rate is derived from the sum of columns (6) and (7) and rounded to 5 decimal points.
PROGRESS ENERGY CAROLINAS, INC.
EE/DSM Billing Rate - July 2011 through June 2012
All rates are shown in dollars per kWh
Rates Including SC Gross Receipts Taxes at 0.30% and Regulatory Fee at 0.15151%
0.00001
0.00000
DSM/EE Rate (net of GRT and Regulatory Fee)
Gross Receipts Tax and
Regulatory Fee Adjustment(6) (7)
Rates Net of South Carolina Gross Receipts Taxes (GRT) and Regulatory Fee
0.00139
0.00000

Workpapers Section B – Allocation Factor and Revenue
Adjustment Factor Development

W/P B
NC SC NC SC
A. Allocation Factors
1 May-08 to Apr-09 Calendar 2007 Analysis 1 86.73% 13.27% 84.81% 15.19%
2 May-09 to Apr-10 Calendar 2008 Analysis 1 86.16% 13.84% 85.06% 14.94%
3 May-10 to Apr-11 Calendar 2009 Analysis 2 85.89% 14.11% 85.41% 14.59%
4 May-11 to Apr-12 Calendar 2010 Analysis 3 86.49% 13.51% 85.53% 14.47%
B. Custom Period Factors
Calendar Year 20104
5 Jan-10 to Dec-10 Line 2 x + Line 3 x 85.98% 14.02% 85.29% 14.71%
Calendar Year 20114
6 Jan-11 to Dec-11 Line 3 x + Line 4 x 86.29% 13.71% 85.49% 14.51%
Notes:1 Allocation Factors values from Docket 2009-191-E
2 Allocation Factors values from Docket 2010-161-E
3 Allocation Factors values from W/P B-5A
4 Employed in the allocation of Utility Cost Test (UCT) results for PPI determination.
DSM EE
PROGRESS ENERGY CAROLINAS, INC.
Allocation Factor Summary

WP B-1
Residential General Service
General Service
Estimated
Opt-Out
Net General
Service Lighting
Lighting
Estimated Opt-
Out Net Lighting Total
Total
Net of Estimated
Opt-Out
(a) (b) (c) (d) = (b) - (c) (e) (f) (g) = (e) - (f) (h) = (a)+(b)+(e) (i) = (a)+(d)+(g)
Jul-11 219,653,540 382,748,053 213,670,517 169,077,536 7,565,141 243,152 7,321,989 609,966,734 396,053,065
Aug-11 220,302,368 416,280,453 204,332,767 211,947,686 7,885,737 236,935 7,648,802 644,468,558 439,898,856
Sep-11 180,379,487 398,658,271 202,641,307 196,016,964 7,774,710 245,218 7,529,492 586,812,468 383,925,943
Oct-11 129,397,957 379,343,314 198,233,382 181,109,932 7,720,081 240,283 7,479,798 516,461,352 317,987,687
Nov-11 129,752,190 333,561,501 217,144,706 116,416,795 7,902,697 243,006 7,659,691 471,216,388 253,828,676
Dec-11 203,718,630 314,704,762 142,665,444 172,039,318 7,922,278 238,352 7,683,926 526,345,670 383,441,874
Jan-12 260,278,935 329,286,518 213,158,431 116,128,087 8,037,313 257,652 7,779,661 597,602,766 384,186,683
Feb-12 192,266,917 333,161,259 177,236,643 155,924,616 7,072,456 255,390 6,817,066 532,500,632 355,008,599
Mar-12 164,566,564 335,173,136 137,772,130 197,401,006 7,241,812 252,962 6,988,850 506,981,512 368,956,420
Apr-12 125,176,588 358,927,555 197,081,842 161,845,713 7,712,667 243,152 7,469,515 491,816,810 294,491,816
May-12 126,092,214 365,286,870 175,320,452 189,966,418 8,127,663 224,462 7,903,201 499,506,747 323,961,833
Jun-12 186,096,087 372,556,107 203,969,260 168,586,847 7,958,287 261,842 7,696,445 566,610,481 362,379,379
2,137,681,477 4,319,687,799 2,283,226,881 2,036,460,918 92,920,842 2,942,406 89,978,436 6,550,290,118 4,264,120,831
Source: W/P R-3 Source: W/P R-3
Projected SC Sales Values
Progress Energy Carolinas, Inc.

WP B-5A
Production Production1
Energy Summer CPRate Schedule (kWh) (KW)
(1) (2) (3)
NC RES 17,696,889,372 3,873,788 NC SGS 2,071,983,378 437,690 NC SGT (SGS) 659,699,647 120,756 NC SGT (MGS) 8,259,791,641 1,525,068 NC MGS 2,830,557,745 522,642 NC SI 60,965,347 15,299 NC LGS 1,102,761,245 184,889 NC LGS-TOU 2,240,761,476 347,493 NC LGS-RTP 5,634,454,875 743,080 NC TSS 10,703,645 1,216 NC ALS 335,307,002 - NC SLS 132,940,684 - NC SFLS 1,601,513 -
Total NC 41,038,417,571 85.53% 7,771,920 86.49%
PROGRESS ENERGY CAROLINAS, INC.Energy & Summer Production Demand Allocation Factors
From Calendar 2010 Analysis
SC RES 2,563,563,194 519,138 SC SGS 327,157,701 66,933 SC SGT (SGS) 93,812,444 15,977 SC SGT (MGS) 1,112,428,878 191,899 SC MGS 575,697,316 99,141 SC SI 19,964,449 2,789 SC LGS 697,978,703 110,119 SC LGS-TOU 1,084,454,286 150,821 SC LGS-RTP 368,327,494 56,708 SC TSS 690,507 76 SC ALS 79,289,937 - SC SLS 18,381,951 - SC SFLS 221,547 -
Total SC 6,941,968,407 14.47% 1,213,601 13.51%
Total System 47,980,385,978 100.00% 8,985,521 100.00%
1 Based on Summer Coincident Peak event on August 11, 2010 during hour ending 1700 EDT.
To W/PB
To W/PB

W/P B-5BPROGRESS ENERGY CAROLINAS, INC.
Summer Coincident Peak Production Demand Allocation FactorsCalendar 2010 - South Carolina Retail
Summer CP Summer CP SCDemand Demand Rate Class
Rate Schedule (KW)1 Rate Class (KW) Ratio(1) (2) (3) (4) (5)
SC RES 519,138 Residential 519,138 42.78%SC SGS 66,933 Small General Service 67,009 5.52%SC SGT (SGS) 15,977 Medium General Service 309,805 25.53%SC SGT (MGS) 191,899 Large General Service 317,648 26.17%SC MGS 99,141 Lighting 0 0.00%SC SI 2,789SC LGS 110,119 SC Retail 1,213,601 100.00%SC LGS-TOU 150,821SC LGS-RTP 56 708SC LGS-RTP 56,708SC TSS 76 DSM/EE Rate ClassesSC ALS 0 Residential 519,138 42.78%SC SLS 0 General Service 694,463 57.22%SC SFLS 0 Lighting 0 0.00%
SC Retail 1,213,601 SC Retail 1,213,601 100.00%
1 Summer Conicident Peak values from W/P 5A

WP B-6
Residential
1 Sales (kWh) Per Books 2,429,333,251
2 Uncollectibles (kWh) WP B-7 17,052,420
3 Percentage Line 2 / Line 1 0.7019%
4 Estimated Residential Uncollectible Percentage Docket No. 2010-161-E, Exh 8 0.6407%
5 Variation from Estimate Line 3 - Line 4 0.0612%
6 SC Residential DSM/EE Billings WP R-2, Line 52 3,633,332.88$
7 SC Uncollectible DSM/EE Undercollection Line 5 x Line 6 2,223.60$
Revenue %s Rev %s x Line 7
8 Energy Efficiency (Evans Exhibit No. 2) 45.25% 1,006.11$
9 Demand Side Mgt (Evans Exhibit No. 2) 13.54% 301.17$
10 DSDR (Evans Exhibit No. 2) 41.21% 916.32
11 Check Total 100.00% 2,223.60$
General Service (net of Opt-Outs)
1 Sales (kWh) WP R-3, Line 13 1,806,894,041
2 Uncollectibles (kWh) WP B-7 1,071,056
3 Percentage Line 2 / Line 1 0.0593%
4 Estimated Gen Svc Uncollectible Percentage Docket No. 2010-161-E, Exh 8 0.0791%
5 Variation from Estimate Line 3 - Line 4 -0.0198%
6 SC Residential Gen Svc DSM/EE Billings WP R-2, Line 52 1,563,911.18$
7 SC DSM/EE Uncollectible Overcollection Line 5 x Line 6 (309.65)$
Revenue %s Rev %s x Line 7
8 Energy Efficiency (Evans Exhibit No. 2) 42.20% (130.69)$
9 Demand Side Mgt (Evans Exhibit No. 2) 4.91% (15.19)
10 DSDR (Evans Exhibit No. 2) 52.89% (163.78)
11 Check Total 100.00% (309.65)$
Progress Energy Carolinas, Inc.South Carolina Uncollectible Data and Adjustment

WP B‐7
Progress Energy Carolinas ‐ Uncollectible Revenue StatisticsShown by usage month ‐ not month of accounting event South Carolina Accounts
Charged Off 04/09 ‐ 03/10Billing Month (Three Month Lag)
Residential ServiceMonth Uncollectible Rev Uncollectible Usage Recovered Rev Recovered Usage Total Charge ‐ Offs ($) Total Charge‐Offs (KWH)January‐10 $240,622.14 2,621,036 $21,871.32 238,239 $218,750.82 2,382,797 February‐10 $244,969.37 2,635,528 $15,002.13 161,402 $229,967.24 2,474,126 March‐10 $250,627.42 2,739,511 $31,304.12 342,173 $219,323.30 2,397,338 April‐10 $135,646.36 1,381,536 $26,048.57 265,300 $109,597.79 1,116,236 May‐10 $85,286.06 853,226 $13,816.58 138,225 $71,469.48 715,001 June‐10 $112,283.37 1,172,423 $17,784.17 185,696 $94,499.20 986,727 July‐10 $169,138.03 1,740,115 $11,994.87 123,405 $157,143.16 1,616,710
August‐10 $208,772.13 2,139,487 $15,828.87 162,214 $192,943.26 1,977,273 September‐10 $175,997.99 1,788,443 $17,838.38 181,269 $158,159.61 1,607,174
October‐10 $106,381.52 1,064,061 $15,358.94 153,625 $91,022.58 910,436 November‐10 $50,937.59 519,982 $5,445.08 55,585 $45,492.51 464,397 December‐10 $41,389.57 445,683 $3,852.08 41,479 $37,537.49 404,204
$1,625,906.44 17,052,420
General Service (Does not Include Opt‐Out Customers)Month Uncollectible Rev Uncollectible Usage Recovered Rev Recovered Usage Total Charge ‐ Offs ($) Total Charge‐Offs (KWH)January‐10 $17,625.83 187,007 $4,295.78 45,577 $13,330.05 141,430 F b 10 $16 699 23 177 788 $851 32 9 064 $15 847 91 168 724February‐10 $16,699.23 177,788 $851.32 9,064 $15,847.91 168,724 March‐10 $18,633.99 201,706 $1,920.62 20,790 $16,713.37 180,916 April‐10 $9,906.74 99,729 $2,323.93 23,395 $7,582.81 76,334 May‐10 $7,936.69 87,133 $2,240.18 24,594 $5,696.51 62,539 June‐10 $5,345.43 53,842 $467.96 4,714 $4,877.47 49,128 July‐10 $9,283.12 93,035 $750.60 7,522 $8,532.52 85,513
August‐10 $8,745.62 87,555 $757.71 7,586 $7,987.91 79,969 September‐10 $15,713.23 171,084 $6,369.60 69,352 $9,343.63 101,732
October‐10 $7,929.53 71,844 $638.08 5,781 $7,291.45 66,063 November‐10 $6,296.71 74,870 $3,050.51 36,271 $3,246.20 38,599 December‐10 $2,687.72 27,608 $729.75 7,496 $1,957.97 20,112
$102,407.80 1,071,056

Workpapers
Section D – Determination of Utility Incentives
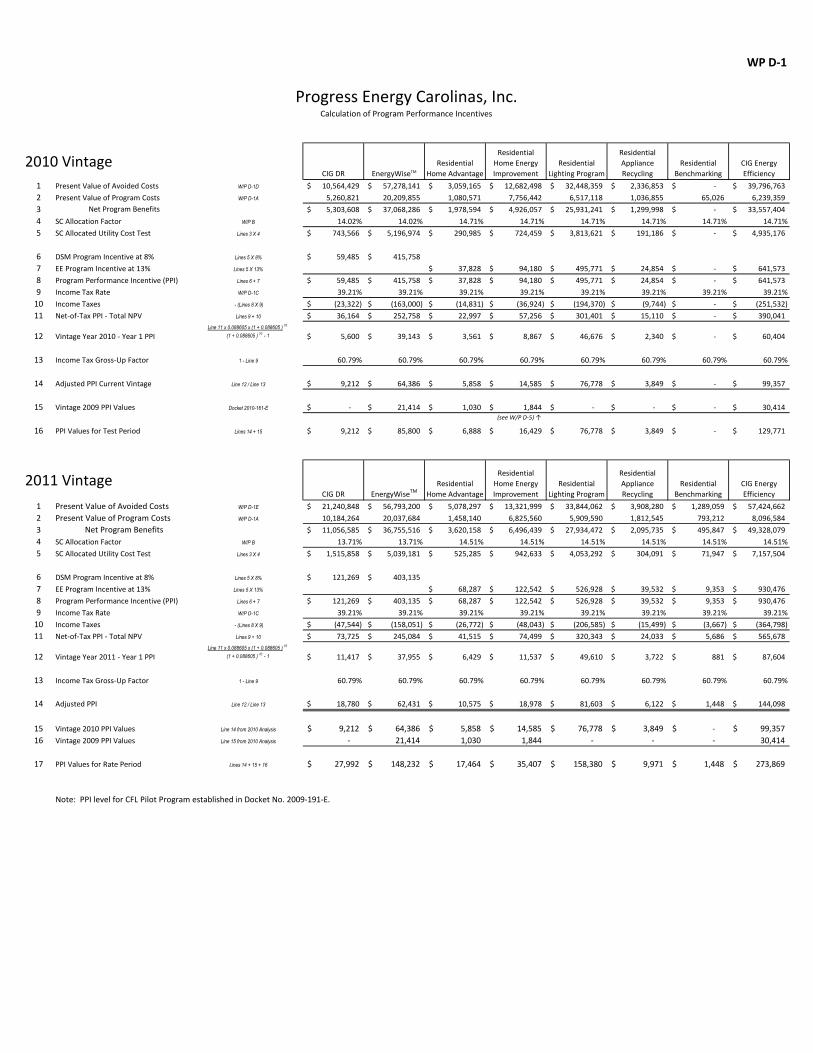
WP D-1
2010 VintageCIG DR EnergyWiseTM
Residential
Home Advantage
Residential
Home Energy
Improvement
Residential
Lighting Program
Residential
Appliance
Recycling
Residential
Benchmarking
CIG Energy
Efficiency
1 Present Value of Avoided Costs W/P D-1D 10,564,429$ 57,278,141$ 3,059,165$ 12,682,498$ 32,448,359$ 2,336,853$ -$ 39,796,763$
2 Present Value of Program Costs W/P D-1A 5,260,821 20,209,855 1,080,571 7,756,442 6,517,118 1,036,855 65,026 6,239,359
3 Net Program Benefits 5,303,608$ 37,068,286$ 1,978,594$ 4,926,057$ 25,931,241$ 1,299,998$ -$ 33,557,404$
4 SC Allocation Factor W/P B 14.02% 14.02% 14.71% 14.71% 14.71% 14.71% 14.71% 14.71%
5 SC Allocated Utility Cost Test Lines 3 X 4 743,566$ 5,196,974$ 290,985$ 724,459$ 3,813,621$ 191,186$ -$ 4,935,176$
6 DSM Program Incentive at 8% Lines 5 X 8% 59,485$ 415,758$
7 EE Program Incentive at 13% Lines 5 X 13% 37,828$ 94,180$ 495,771$ 24,854$ -$ 641,573$
8 Program Performance Incentive (PPI) Lines 6 + 7 59,485$ 415,758$ 37,828$ 94,180$ 495,771$ 24,854$ -$ 641,573$
9 Income Tax Rate W/P D-1C 39.21% 39.21% 39.21% 39.21% 39.21% 39.21% 39.21% 39.21%
10 Income Taxes - (Lines 8 X 9) (23,322)$ (163,000)$ (14,831)$ (36,924)$ (194,370)$ (9,744)$ -$ (251,532)$
11 Net-of-Tax PPI - Total NPV Lines 9 + 10 36,164$ 252,758$ 22,997$ 57,256$ 301,401$ 15,110$ -$ 390,041$
12 Vintage Year 2010 - Year 1 PPILine 11 x 0.088605 x (1 + 0.088605 )
10
(1 + 0.088605 )10
- 1 5,600$ 39,143$ 3,561$ 8,867$ 46,676$ 2,340$ -$ 60,404$
13 Income Tax Gross-Up Factor 1 - Line 9 60.79% 60.79% 60.79% 60.79% 60.79% 60.79% 60.79% 60.79%
14 Adjusted PPI Current Vintage Line 12 / Line 13 9,212$ 64,386$ 5,858$ 14,585$ 76,778$ 3,849$ -$ 99,357$
15 Vintage 2009 PPI Values Docket 2010-161-E -$ 21,414$ 1,030$ 1,844$ -$ -$ -$ 30,414$ (see W/P D-5) ↑
16 PPI Values for Test Period Lines 14 + 15 9,212$ 85,800$ 6,888$ 16,429$ 76,778$ 3,849$ -$ 129,771$
2011 VintageCIG DR EnergyWiseTM
Residential
Home Advantage
Residential
Home Energy
Improvement
Residential
Lighting Program
Residential
Appliance
Recycling
Residential
Benchmarking
CIG Energy
Efficiency
1 Present Value of Avoided Costs W/P D-1E 21,240,848$ 56,793,200$ 5,078,297$ 13,321,999$ 33,844,062$ 3,908,280$ 1,289,059$ 57,424,662$
2 Present Value of Program Costs W/P D-1A 10,184,264 20,037,684 1,458,140 6,825,560 5,909,590 1,812,545 793,212 8,096,584
3 Net Program Benefits 11,056,585$ 36,755,516$ 3,620,158$ 6,496,439$ 27,934,472$ 2,095,735$ 495,847$ 49,328,079$
4 SC Allocation Factor W/P B 13.71% 13.71% 14.51% 14.51% 14.51% 14.51% 14.51% 14.51%
5 SC Allocated Utility Cost Test Lines 3 X 4 1,515,858$ 5,039,181$ 525,285$ 942,633$ 4,053,292$ 304,091$ 71,947$ 7,157,504$
6 DSM Program Incentive at 8% Lines 5 X 8% 121,269$ 403,135$
7 EE Program Incentive at 13% Lines 5 X 13% 68,287$ 122,542$ 526,928$ 39,532$ 9,353$ 930,476$
8 Program Performance Incentive (PPI) Lines 6 + 7 121,269$ 403,135$ 68,287$ 122,542$ 526,928$ 39,532$ 9,353$ 930,476$
9 Income Tax Rate W/P D-1C 39.21% 39.21% 39.21% 39.21% 39.21% 39.21% 39.21% 39.21%
10 Income Taxes - (Lines 8 X 9) (47,544)$ (158,051)$ (26,772)$ (48,043)$ (206,585)$ (15,499)$ (3,667)$ (364,798)$
11 Net-of-Tax PPI - Total NPV Lines 9 + 10 73,725$ 245,084$ 41,515$ 74,499$ 320,343$ 24,033$ 5,686$ 565,678$
12 Vintage Year 2011 - Year 1 PPILine 11 x 0.088605 x (1 + 0.088605 )
10
(1 + 0.088605 )10
- 1 11,417$ 37,955$ 6,429$ 11,537$ 49,610$ 3,722$ 881$ 87,604$
13 Income Tax Gross-Up Factor 1 - Line 9 60.79% 60.79% 60.79% 60.79% 60.79% 60.79% 60.79% 60.79%
14 Adjusted PPI Line 12 / Line 13 18,780$ 62,431$ 10,575$ 18,978$ 81,603$ 6,122$ 1,448$ 144,098$
15 Vintage 2010 PPI Values Line 14 from 2010 Analysis 9,212$ 64,386$ 5,858$ 14,585$ 76,778$ 3,849$ -$ 99,357$
16 Vintage 2009 PPI Values Line 15 from 2010 Analysis - 21,414 1,030 1,844 - - - 30,414
17 PPI Values for Rate Period Lines 14 + 15 + 16 27,992$ 148,232$ 17,464$ 35,407$ 158,380$ 9,971$ 1,448$ 273,869$
Note: PPI level for CFL Pilot Program established in Docket No. 2009-191-E.
Progress Energy Carolinas, Inc.Calculation of Program Performance Incentives

WP D‐1A
AdjustedJan‐10 Feb‐10 Mar‐10 Apr‐10 May‐10 Jun‐10 Jul‐10 Aug‐10 Sep‐10 Oct‐10 Nov‐10 Dec‐10 Adjustments 2010 Totals
CIG DR 39,558 45,055 45,289 53,455 47,084 54,379 107,713 317,865 111,793 85,023 59,089 59,374 4,235,144 D‐1B 5,260,821 EnergyWiseTM 744,133 954,698 981,637 641,052 913,824 791,035 905,404 1,012,281 1,272,208 739,798 475,495 514,858 10,263,431 D‐1B 20,209,855 Residential Home Advantage 66,730 61,004 73,801 87,976 137,955 87,604 104,322 111,339 94,075 96,681 125,470 33,615 1,080,571 Residential Home Energy Improvement 612,613 526,020 522,743 481,717 518,415 684,120 863,812 814,135 771,387 559,710 704,433 697,336 7,756,442 Residential Lighting Program 89,861 293,269 523,984 580,810 725,464 660,748 561,647 557,353 552,179 662,180 452,001 857,621 6,517,118 Residential Appliance Recycling 10,398 8,254 13,778 36,770 104,622 75,978 62,776 113,600 159,335 193,102 120,549 137,693 1,036,855 Residential Benchmarking 0 0 1,150 11,572 8,592 9,404 6,261 6,052 11,738 3,365 1,825 5,068 65,026 CIG Energy Efficiency 431,407 506,009 331,975 770,343 449,493 369,245 444,461 584,975 384,317 748,363 748,623 470,148 6,239,359
AdjustedJan‐11 Feb‐11 Mar‐11 Apr‐11 May‐11 Jun‐11 Jul‐11 Aug‐11 Sep‐11 Oct‐11 Nov‐11 Dec‐11 Adjustments 2011 Totals
CIG DR 60,898 67,075 97,742 110,743 108,311 239,389 513,995 583,162 125,228 121,497 120,928 121,984 7,913,311 D‐1B 10,184,264 EnergyWiseTM 814,282 911,376 831,581 1,186,940 1,092,882 990,100 794,223 791,385 1,183,522 1,225,155 706,914 660,376 8,848,948 D‐1B 20,037,684 Residential Home Advantage 188,914 76,502 119,841 94,794 159,724 91,321 132,608 121,304 140,875 144,904 113,886 73,468 1,458,140 Residential Home Energy Improvement 883,389 758,080 630,288 394,842 453,962 912,408 493,627 592,391 531,109 473,809 427,193 274,462 6,825,560 Residential Lighting Program 134,445 476,955 440,320 597,173 569,903 539,042 474,961 474,961 587,673 582,097 539,042 493,019 5,909,590 Residential Appliance Recycling 46,333 89,902 245,855 193,544 196,720 116,184 134,908 193,804 189,628 152,304 141,184 112,179 1,812,545 Residential Benchmarking 1,721 80,842 3,675 81,501 77,710 77,710 77,710 77,710 81,501 77,710 77,710 77,711 793,212 CIG Energy Efficiency 404,382 1,028,980 945,062 652,301 626,758 626,758 626,758 632,008 657,551 632,008 632,008 632,008 8,096,584
Progress Energy Carolinas, Inc.Calculation of Program Performance Incentives (Costs)
Estimated ValuesActual Values
Actual Values

WP D‐1B
Year Vintage 2010 Vintage 2011 Vintage 2010 Vintage 2011
2011 536,359$ 3 949,121$ ‐$
2012 366,471 751,275 949,121 989,625
2013 366,471 751,275 949,121 989,625
2014 366,471 751,275 949,121 989,625
2015 366,471 751,275 949,121 989,625
2016 366,471 751,275 949,121 989,625
2017 366,471 751,275 949,121 989,625
2018 366,471 751,275 949,121 989,625
2019 366,471 751,275 949,121 989,625
2020 366,471 751,275 949,121 989,625
2021 366,471 751,275 949,121 989,625
2022 366,471 751,275 949,121 989,625
2023 366,471 751,275 949,121 989,625
2024 366,471 751,275 949,121 989,625
2025 366,471 751,275 949,121 989,625
2026 366,471 751,275 949,121 989,625
2027 366,471 751,275 949,121 989,625
2028 366,471 751,275 949,121 989,625
2029 366,471 751,275 949,121 989,625
2030 366,471 751,275 949,121 989,625
2031 366,471 751,275 949,121 989,625
2032 366,471 751,275 949,121 989,625
2033 366,471 751,275 949,121 989,625
2034 366,471 751,275 949,121 989,625
2035 366,471 751,275 949,121 989,625
2036 366,471 751,275 949,121 989,625
2037 366,471 751,275 949,121 989,625
2038 366,471 751,275 949,121 989,625
2039 366,471 751,275 949,121 989,625
Nominal Values 10,797,547$ 21,035,700$ 27,524,516$ 27,709,500$
Net Present Value 4,235,144$ 8,279,782$ 4 10,561,290$ 10,095,928$ 4
Less: V‐2009 Incentives ‐$ ‐$ 297,859$ 297,859$ 5
Less: V‐2010 Incentives ‐ 366,471 6 ‐ 949,121 6
Total Adjustments ‐$ 366,471$ 297,859$ 1,246,980$
Adjusted NPV 4,235,144$ 7,913,311$ 10,263,431$ 8,848,948$
1 Ongoing payments to participant at rate of $45 per kW per year plus 5% M&V Adder.2 Ongoing payments to participant at rate of $25 per year plus 5% M&V Adder.3 Third quarter 2009 program expenses and 2010 participant incentives paid in 2011.4 Discount Rate of 8.03% employed in the determination of net present values.5 Removal of 2009 participant Incentives (w/M&V Adder) associated with Vintage installations (Docket 2010‐161‐E).6 Removal of 2010 participant Incentives (w/M&V Adder) associated with 2010 Vintage installations.
EnergyWise2
Progress Energy Carolinas, Inc.Calculation of Program Performance Incentives (Adjustments)
CIG DR1

WP D‐1C
Progress Energy Carolinas, Inc.SC Calculation Tax and Return Related Input Factors
Net of Tax Pre Tax Component Percent Rate Wgt'd Rate Wgt'd Cost Wgt'd Cost
1 Debt 47.82% x 8.62% = 4.1221% 2.5060% (a) 4.1221%2 Preferred 7.46% x 8.75% = 0.6528% → 0.6528% 1.0737% (b)3 Common 44.72% x 12.75% = 5.7018% → 5.7018% 9.3788% (c)4 Total 100.00% 10.4766% 8.8605% 14.5746%56 After Tax Cost of Debt7 Wgt'd Debt Component 4.1221% ← 4.1221%8 PEC Composite Income Tax Rate x 39.2055% (d)9 Federal Income Tax Amount - 1.6161% ← 1.6161%1011 After Tax Debt Cost Component 2.5060% → 2.5060% (a)1213 Incremental Tax Rate14 Pretax Debt Component 4.1221%15 After-Tax Debt Component 2.5060%16 After Tax Percent of Pretax Amt 60.7945%17 Effective Incremental Tax Rate18 (1 - After Tax Percent of Pretax ) 39.2055% (d)
To W/P D‐1
( ) ( )1920 Pre Tax Cost of Equity21 Wgt'd Common Equity Component 5.7018%22 Wgt'd Preferred Component 0.6528%23 Total Equity 5.7018%24 After Tax Percent of Pretax Amt 60.7945% 60.7945%25 Pre Tax Cost of Equity26 (Pre Tax Cost of Equity / After Tax Percent of Pretax Amt ) 1.0737% (b) 9.3788% (c)272829 Composite Income Tax Rate3031 Jurisdiction32 Federal [35% x (1-Composite State)] 32.7355%33 North Carolina 5.8400%34 South Carolina + 0.6300%
35 PEC Composite Income Tax Rate 39.2055% (d)

W/P D-1D
Page 1 of 7
BENEFITS
(1) (2) (3) (4)
TOTAL AVOIDED AVOIDED
FUEL & O&M T&D CAP. GEN. CAP. TOTAL
SAVINGS COSTS COSTS BENEFITS
YEAR $(000) $(000) $(000) $(000)
2010 3,558 480 517 4,555
2011 3,467 493 527 4,487
2012 4,265 506 538 5,309
2013 3,901 519 549 4,969
2014 5,479 530 560 6,569
2015 7,552 540 571 8,663
2016 6,082 551 582 7,215
2017 0 0 0 0
2018 0 0 0 0
2019 0 0 0 0
2020 0 0 0 0
2021 0 0 0 0
2022 0 0 0 0
2023 0 0 0 0
2024 0 0 0 0
2025 0 0 0 0
2026 0 0 0 0
2027 0 0 0 0
2028 0 0 0 0
2029 0 0 0 0
2030 0 0 0 0
2031 0 0 0 0
2032 0 0 0 0
2033 0 0 0 0
2034 0 0 0 0
2035 0 0 0 0
2036 0 0 0 0
2037 0 0 0 0
2038 0 0 0 0
2039 0 0 0 0
NOMINAL 34,303 3,620 3,844 41,767
NPV 26,497 2,885 3,066 32,448
Present Value: i=8.03% 32,448,359
PEC Residential Lighting Program - Vintage Year-2010

W/P D-1D
Page 2 of 7
BENEFITS
(1) (2) (3) (4)
TOTAL AVOIDED AVOIDED
FUEL & O&M T&D CAP. GEN. CAP. TOTAL
SAVINGS COSTS COSTS BENEFITS
YEAR $(000) $(000) $(000) $(000)
2010 103 50 53 206
2011 105 51 54 211
2012 115 52 56 223
2013 119 54 57 229
2014 166 55 58 278
2015 169 56 59 284
2016 177 57 60 294
2017 186 58 61 305
2018 199 59 63 320
2019 209 60 64 333
2020 220 62 65 347
2021 229 63 66 358
2022 238 64 68 369
2023 247 65 69 382
2024 259 67 70 396
2025 217 48 51 316
2026 224 49 52 326
2027 232 50 53 335
2028 242 50 53 346
2029 254 51 54 360
2030 0 0 0 0
2031 0 0 0 0
2032 0 0 0 0
2033 0 0 0 0
2034 0 0 0 0
2035 0 0 0 0
2036 0 0 0 0
2037 0 0 0 0
2038 0 0 0 0
2039 0 0 0 0
NOMINAL 3,910 1,121 1,187 6,218
NPV 1,848 588 623 3,059
Present Value: i=8.03% 3,059,165
PEC Residential Home Advantage - Vintage Year-2010

W/P D-1D
Page 3 of 7
PEC Residential Home Energy Improvement - Vintage Year-2010
BENEFITS
(1) (2) (3) (4)
TOTAL AVOIDED AVOIDED
FUEL & O&M T&D CAP. GEN. CAP. TOTAL
SAVINGS COSTS COSTS BENEFITS
YEAR $(000) $(000) $(000) $(000)
2010 338 374 403 1,115
2011 303 342 366 1,011
2012 335 351 374 1,060
2013 350 361 381 1,092
2014 476 368 389 1,232
2015 452 375 397 1,224
2016 472 383 404 1,259
2017 495 390 413 1,298
2018 534 398 421 1,353
2019 561 406 429 1,397
2020 591 411 434 1,436
2021 614 419 443 1,476
2022 641 428 452 1,520
2023 661 436 461 1,558
2024 695 445 470 1,610
2025 448 249 263 960
2026 465 254 268 987
2027 477 259 274 1,010
2028 282 135 143 560
2029 296 138 146 580
2030 0 0 0 0
2031 0 0 0 0
2032 0 0 0 0
2033 0 0 0 0
2034 0 0 0 0
2035 0 0 0 0
2036 0 0 0 0
2037 0 0 0 0
2038 0 0 0 0
2039 0 0 0 0
NOMINAL 9,485 6,924 7,330 23,739
NPV 4,802 3,826 4,055 12,682
Present Value: i=8.03% 12,682,498

W/P D-1D
Page 4 of 7
BENEFITS
(1) (2) (3) (4)
TOTAL AVOIDED AVOIDED
FUEL & O&M T&D CAP. GEN. CAP. TOTAL
SAVINGS COSTS COSTS BENEFITS
YEAR $(000) $(000) $(000) $(000)
2010 176 30 33 239
2011 180 31 33 244
2012 196 32 34 262
2013 202 33 35 269
2014 283 33 35 352
2015 300 34 36 370
2016 312 35 37 384
2017 327 36 38 400
2018 349 36 38 424
2019 366 37 39 442
2020 0 0 0 0
2021 0 0 0 0
2022 0 0 0 0
2023 0 0 0 0
2024 0 0 0 0
2025 0 0 0 0
2026 0 0 0 0
2027 0 0 0 0
2028 0 0 0 0
2029 0 0 0 0
2030 0 0 0 0
2031 0 0 0 0
2032 0 0 0 0
2033 0 0 0 0
2034 0 0 0 0
2035 0 0 0 0
2036 0 0 0 0
2037 0 0 0 0
2038 0 0 0 0
2039 0 0 0 0
NOMINAL 2,692 337 358 3,387
NPV 1,840 241 256 2,337
Present Value: i=8.03% 2,336,853
PEC Residential Appliance Recycling - Vintage Year-2010

W/P D-1D
Page 5 of 7
BENEFITS
(1) (2) (3) (4)
TOTAL AVOIDED AVOIDED
FUEL & O&M T&D CAP. GEN. CAP. TOTAL
SAVINGS COSTS COSTS BENEFITS
YEAR $(000) $(000) $(000) $(000)
2010 1,794 462 497 2,753
2011 1,640 474 507 2,622
2012 2,145 487 518 3,150
2013 1,855 500 528 2,883
2014 2,597 510 539 3,646
2015 2,711 520 550 3,781
2016 2,824 531 561 3,916
2017 2,956 541 572 4,069
2018 3,148 552 583 4,284
2019 3,303 563 595 4,461
2020 3,471 575 607 4,653
2021 3,618 586 619 4,823
2022 3,689 581 613 4,882
2023 3,834 592 626 5,051
2024 3,783 581 614 4,978
2025 2,701 474 501 3,676
2026 2,819 484 511 3,814
2027 2,918 493 521 3,932
2028 3,087 503 532 4,121
2029 3,227 513 542 4,283
2030 0 0 0 0
2031 0 0 0 0
2032 0 0 0 0
2033 0 0 0 0
2034 0 0 0 0
2035 0 0 0 0
2036 0 0 0 0
2037 0 0 0 0
2038 0 0 0 0
2039 0 0 0 0
NOMINAL 58,118 10,524 11,136 79,778
NPV 28,475 5,497 5,825 39,797
Present Value: i=8.03% 39,796,763
PEC Energy Efficiency Business - Vintage Year-2010

W/P D-1D
Page 6 of 7
BENEFITS
(1) (2) (3) (4)
TOTAL AVOIDED AVOIDED
FUEL & O&M T&D CAP. GEN. CAP. TOTAL
SAVINGS COSTS COSTS BENEFITS
YEAR $(000) $(000) $(000) $(000)
2010 245 0 689 934
2011 61 0 702 763
2012 56 0 716 772
2013 67 0 731 798
2014 81 0 745 827
2015 -15 0 760 745
2016 -23 0 775 752
2017 -25 0 791 766
2018 -13 0 807 794
2019 -19 0 823 804
2020 -5 0 839 834
2021 -4 0 856 852
2022 -3 0 873 870
2023 -9 0 891 882
2024 -7 0 909 902
2025 -5 0 927 922
2026 16 0 945 961
2027 3 0 964 968
2028 1 0 983 985
2029 23 0 1,003 1,026
2030 16 0 1,023 1,039
2031 18 0 1,044 1,061
2032 14 0 1,065 1,079
2033 13 0 1,086 1,099
2034 19 0 1,108 1,126
2035 16 0 1,130 1,146
2036 13 0 1,152 1,165
2037 20 0 1,175 1,195
2038 20 0 1,199 1,219
2039 19 0 1,223 1,242
NOMINAL 593 0 27,935 28,528
NPV 430 0 10,134 10,564
Present Value: i=8.03% 10,564,429
PEC CIG DR - Vintage Year-2010

W/P D-1D
Page 7 of 7
BENEFITS
(1) (2) (3) (4)
TOTAL AVOIDED AVOIDED
FUEL & O&M T&D CAP. GEN. CAP. TOTAL
SAVINGS COSTS COSTS BENEFITS
YEAR $(000) $(000) $(000) $(000)
2010 529 0 3,823 4,352
2011 305 0 3,900 4,205
2012 325 0 3,978 4,303
2013 366 0 4,058 4,423
2014 394 0 4,139 4,533
2015 -121 0 4,221 4,100
2016 -166 0 4,306 4,139
2017 -187 0 4,392 4,205
2018 -117 0 4,480 4,363
2019 -151 0 4,569 4,419
2020 -80 0 4,661 4,581
2021 -71 0 4,754 4,683
2022 -73 0 4,849 4,776
2023 -110 0 4,946 4,837
2024 -101 0 5,045 4,944
2025 -89 0 5,146 5,057
2026 20 0 5,249 5,269
2027 -52 0 5,354 5,302
2028 -68 0 5,461 5,392
2029 45 0 5,570 5,615
2030 -5 0 5,682 5,676
2031 4 0 5,795 5,800
2032 -9 0 5,911 5,902
2033 -15 0 6,029 6,014
2034 2 0 6,150 6,152
2035 -11 0 6,273 6,262
2036 -34 0 6,398 6,364
2037 -8 0 6,526 6,518
2038 -5 0 6,657 6,652
2039 -20 0 6,790 6,769
NOMINAL 493 0 155,112 155,606
NPV 1,007 0 56,272 57,278
Present Value: i=8.03% 57,278,141
Residential EnergyWise - Vintage Year-2010

W/P D-1E
Page 1 of 8
BENEFITS
(1) (2) (3) (4)
TOTAL AVOIDED AVOIDED
FUEL & O&M T&D CAP. GEN. CAP. TOTAL
SAVINGS COSTS COSTS BENEFITS
YEAR $(000) $(000) $(000) $(000)
2011 3,360 478 511 4,349
2012 4,148 490 521 5,160
2013 3,780 503 532 4,815
2014 5,310 513 542 6,366
2015 7,372 524 553 8,449
2016 5,894 534 564 6,992
2017 6,173 545 576 7,293
2018 0 0 0 0
2019 0 0 0 0
2020 0 0 0 0
2021 0 0 0 0
2022 0 0 0 0
2023 0 0 0 0
2024 0 0 0 0
2025 0 0 0 0
2026 0 0 0 0
2027 0 0 0 0
2028 0 0 0 0
2029 0 0 0 0
2030 0 0 0 0
2031 0 0 0 0
2032 0 0 0 0
2033 0 0 0 0
2034 0 0 0 0
2035 0 0 0 0
2036 0 0 0 0
2037 0 0 0 0
2038 0 0 0 0
2039 0 0 0 0
NOMINAL 36,037 3,587 3,799 43,424
NPV 27,953 2,860 3,031 33,844
Present Value: i=8.03% 33,844,062
PEC Residential Lighting Program - Vintage Year-2011

W/P D-1E
Page 2 of 8
BENEFITS
(1) (2) (3) (4)
TOTAL AVOIDED AVOIDED
FUEL & O&M T&D CAP. GEN. CAP. TOTAL
SAVINGS COSTS COSTS BENEFITS
YEAR $(000) $(000) $(000) $(000)
2011 167 81 86 334
2012 182 83 88 354
2013 189 85 90 365
2014 263 87 92 442
2015 269 89 94 451
2016 281 90 95 467
2017 295 92 97 485
2018 315 94 99 508
2019 331 96 101 528
2020 349 98 103 550
2021 364 100 105 569
2022 377 102 108 587
2023 393 104 110 606
2024 412 106 112 629
2025 437 108 114 660
2026 352 78 82 512
2027 365 79 84 527
2028 387 81 85 553
2029 400 81 86 567
2030 413 83 87 583
2031 0 0 0 0
2032 0 0 0 0
2033 0 0 0 0
2034 0 0 0 0
2035 0 0 0 0
2036 0 0 0 0
2037 0 0 0 0
2038 0 0 0 0
2039 0 0 0 0
NOMINAL 6,540 1,815 1,920 10,276
NPV 3,115 954 1,009 5,078
Present Value: i=8.03% 5,078,297
PEC Residential Home Advantage - Vintage Year-2011

W/P D-1E
Page 3 of 8
PEC Residential Home Energy Improvement - Vintage Year-2011
BENEFITS
(1) (2) (3) (4)
TOTAL AVOIDED AVOIDED
FUEL & O&M T&D CAP. GEN. CAP. TOTAL
SAVINGS COSTS COSTS BENEFITS
YEAR $(000) $(000) $(000) $(000)
2011 336 354 379 1,069
2012 362 353 376 1,092
2013 378 363 383 1,124
2014 515 370 391 1,276
2015 495 378 399 1,272
2016 518 385 407 1,310
2017 543 393 415 1,351
2018 584 401 423 1,408
2019 614 409 432 1,454
2020 651 417 440 1,508
2021 640 403 426 1,468
2022 668 411 434 1,513
2023 690 419 443 1,552
2024 726 428 452 1,606
2025 771 436 461 1,667
2026 435 244 258 936
2027 445 249 263 957
2028 471 254 268 992
2029 319 151 160 630
2030 327 155 163 645
2031 0 0 0 0
2032 0 0 0 0
2033 0 0 0 0
2034 0 0 0 0
2035 0 0 0 0
2036 0 0 0 0
2037 0 0 0 0
2038 0 0 0 0
2039 0 0 0 0
NOMINAL 10,487 6,971 7,371 24,829
NPV 5,386 3,856 4,080 13,322
Present Value: i=8.03% 13,321,999

W/P D-1E
Page 4 of 8
BENEFITS
(1) (2) (3) (4)
TOTAL AVOIDED AVOIDED
FUEL & O&M T&D CAP. GEN. CAP. TOTAL
SAVINGS COSTS COSTS BENEFITS
YEAR $(000) $(000) $(000) $(000)
2011 281 49 52 382
2012 307 50 53 410
2013 316 51 54 422
2014 444 52 55 552
2015 469 53 57 579
2016 489 55 58 601
2017 513 56 59 628
2018 546 57 60 663
2019 573 58 61 692
2020 600 59 62 721
2021 0 0 0 0
2022 0 0 0 0
2023 0 0 0 0
2024 0 0 0 0
2025 0 0 0 0
2026 0 0 0 0
2027 0 0 0 0
2028 0 0 0 0
2029 0 0 0 0
2030 0 0 0 0
2031 0 0 0 0
2032 0 0 0 0
2033 0 0 0 0
2034 0 0 0 0
2035 0 0 0 0
2036 0 0 0 0
2037 0 0 0 0
2038 0 0 0 0
2039 0 0 0 0
NOMINAL 4,538 540 572 5,650
NPV 3,113 386 409 3,908
Present Value: i=8.03% 3,908,280
PEC Residential Appliance Recycling - Vintage Year-2011
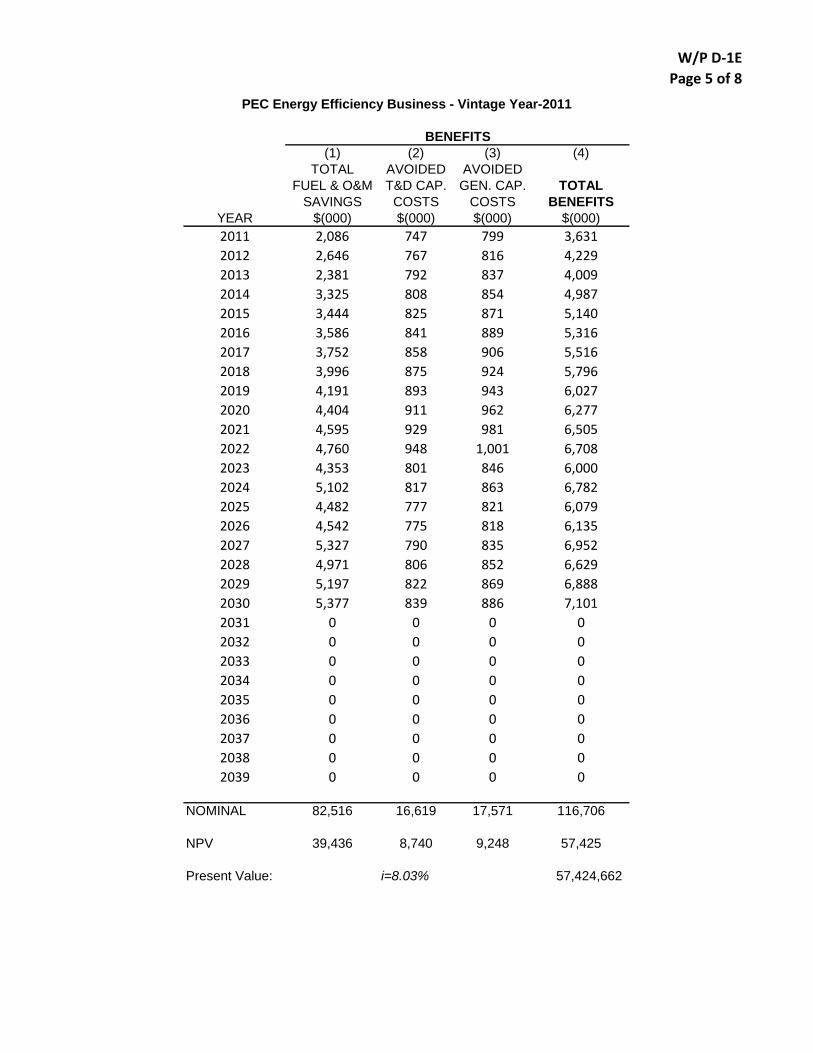
W/P D-1E
Page 5 of 8
BENEFITS
(1) (2) (3) (4)
TOTAL AVOIDED AVOIDED
FUEL & O&M T&D CAP. GEN. CAP. TOTAL
SAVINGS COSTS COSTS BENEFITS
YEAR $(000) $(000) $(000) $(000)
2011 2,086 747 799 3,631
2012 2,646 767 816 4,229
2013 2,381 792 837 4,009
2014 3,325 808 854 4,987
2015 3,444 825 871 5,140
2016 3,586 841 889 5,316
2017 3,752 858 906 5,516
2018 3,996 875 924 5,796
2019 4,191 893 943 6,027
2020 4,404 911 962 6,277
2021 4,595 929 981 6,505
2022 4,760 948 1,001 6,708
2023 4,353 801 846 6,000
2024 5,102 817 863 6,782
2025 4,482 777 821 6,079
2026 4,542 775 818 6,135
2027 5,327 790 835 6,952
2028 4,971 806 852 6,629
2029 5,197 822 869 6,888
2030 5,377 839 886 7,101
2031 0 0 0 0
2032 0 0 0 0
2033 0 0 0 0
2034 0 0 0 0
2035 0 0 0 0
2036 0 0 0 0
2037 0 0 0 0
2038 0 0 0 0
2039 0 0 0 0
NOMINAL 82,516 16,619 17,571 116,706
NPV 39,436 8,740 9,248 57,425
Present Value: i=8.03% 57,424,662
PEC Energy Efficiency Business - Vintage Year-2011

W/P D-1E
Page 6 of 8
BENEFITS
(1) (2) (3) (4)
TOTAL AVOIDED AVOIDED
FUEL & O&M T&D CAP. GEN. CAP. TOTAL
SAVINGS COSTS COSTS BENEFITS
YEAR $(000) $(000) $(000) $(000)
2011 118 0 1,435 1,553
2012 114 0 1,464 1,578
2013 138 0 1,493 1,631
2014 166 0 1,523 1,690
2015 -32 0 1,554 1,521
2016 -49 0 1,585 1,536
2017 -54 0 1,616 1,562
2018 -29 0 1,649 1,620
2019 -39 0 1,682 1,642
2020 -15 0 1,715 1,701
2021 -9 0 1,750 1,741
2022 -9 0 1,785 1,776
2023 -22 0 1,820 1,799
2024 -17 0 1,857 1,840
2025 -11 0 1,894 1,883
2026 31 0 1,932 1,963
2027 5 0 1,970 1,976
2028 1 0 2,010 2,010
2029 46 0 2,050 2,096
2030 28 0 2,091 2,119
2031 35 0 2,133 2,167
2032 30 0 2,176 2,206
2033 26 0 2,219 2,245
2034 36 0 2,263 2,300
2035 31 0 2,309 2,340
2036 27 0 2,355 2,382
2037 38 0 2,402 2,440
2038 43 0 2,450 2,493
2039 37 0 2,499 2,536
NOMINAL 665 0 55,679 56,345
NPV 388 0 20,853 21,241
Present Value: i=8.03% 21,240,848
PEC CIG DR - Vintage Year-2011

W/P D-1E
Page 7 of 8
BENEFITS
(1) (2) (3) (4)
TOTAL AVOIDED AVOIDED
FUEL & O&M T&D CAP. GEN. CAP. TOTAL
SAVINGS COSTS COSTS BENEFITS
YEAR $(000) $(000) $(000) $(000)
2011 304 0 3,876 4,180
2012 323 0 3,954 4,276
2013 364 0 4,033 4,397
2014 392 0 4,113 4,505
2015 -124 0 4,195 4,072
2016 -169 0 4,279 4,111
2017 -189 0 4,365 4,176
2018 -120 0 4,452 4,332
2019 -154 0 4,541 4,387
2020 -83 0 4,632 4,549
2021 -74 0 4,725 4,651
2022 -76 0 4,819 4,743
2023 -113 0 4,916 4,803
2024 -105 0 5,014 4,909
2025 -92 0 5,114 5,022
2026 17 0 5,217 5,233
2027 -56 0 5,321 5,265
2028 -72 0 5,427 5,355
2029 41 0 5,536 5,577
2030 -10 0 5,647 5,637
2031 0 0 5,760 5,759
2032 -14 0 5,875 5,861
2033 -20 0 5,992 5,972
2034 -3 0 6,112 6,109
2035 -16 0 6,234 6,218
2036 -39 0 6,359 6,320
2037 -13 0 6,486 6,473
2038 -8 0 6,616 6,608
2039 -27 0 6,748 6,722
NOMINAL -136 0 150,359 150,223
NPV 482 0 56,312 56,793
Present Value: i=8.03% 56,793,200
Residential EnergyWise - Vintage Year-2011

W/P D-1E
Page 8 of 8
BENEFITS
(1) (2) (3) (4)
TOTAL AVOIDED AVOIDED
FUEL & O&M T&D CAP. GEN. CAP. TOTAL
SAVINGS COSTS COSTS BENEFITS
YEAR $(000) $(000) $(000) $(000)
2011 913 159 217 1,289
2012 0 0 0 0
2013 0 0 0 0
2014 0 0 0 0
2015 0 0 0 0
2016 0 0 0 0
2017 0 0 0 0
2018 0 0 0 0
2019 0 0 0 0
2020 0 0 0 0
2021 0 0 0 0
2022 0 0 0 0
2023 0 0 0 0
2024 0 0 0 0
2025 0 0 0 0
2026 0 0 0 0
2027 0 0 0 0
2028 0 0 0 0
2029 0 0 0 0
2030 0 0 0 0
2031 0 0 0 0
2032 0 0 0 0
2033 0 0 0 0
2034 0 0 0 0
2035 0 0 0 0
2036 0 0 0 0
2037 0 0 0 0
2038 0 0 0 0
2039 0 0 0 0
NOMINAL 913 159 217 1,289
NPV 913 159 217 1,289
Present Value: i=8.03% 1,289,059
Residential EE Benchmarking Program -Vintage Year-2011

W/P D-2
Source MWH Net Lost Rev MWH Net Lost Rev
Residential Programs
Home Advantage W/P D-2a 356.75 20,832.39$ 922.51 53,371.11$
Home Energy Improvement W/P D-2b 778.92 45,484.64 2,076.40 120,129.26
Residential Lighting W/P D-2c 8,780.59 512,738.91 22,112.34 1,279,297.29
Neghborhood Energy Saver W/P D-2d 555.04 32,411.15 1,346.24 77,885.99
Residential Appliance Recycling W/P D-2e 374.70 21,880.74 1,533.04 88,692.94
Residential Benchmarking Program W/P D-2f - - 2,083.68 120,550.16
CFL Pilot Program W/P D-2g 410.61 23,977.40 - -
EnergyWise W/P DR 22.13 1,292.03 - -
Residential Total 11,278.74 658,617.27$ 30,074.21 1,739,926.76$
Commercial, Industrial and Governmental
Energy Efficiency For Business W/P D-2h 5,912.40 307,763.54$ 13,112.99 675,499.44$
CIG Demand Response Program W/P DR 13.15 684.55 - -
Commercial, Ind and Govt Total 5,925.55 308,448.09$ 13,112.99 675,499.44$
System Total 17,204.29 967,065.36$ 43,187.20 2,415,426.21$
Test Period Rate Period
Progress Energy Carolinas, Inc.Net Lost Revenue Summary
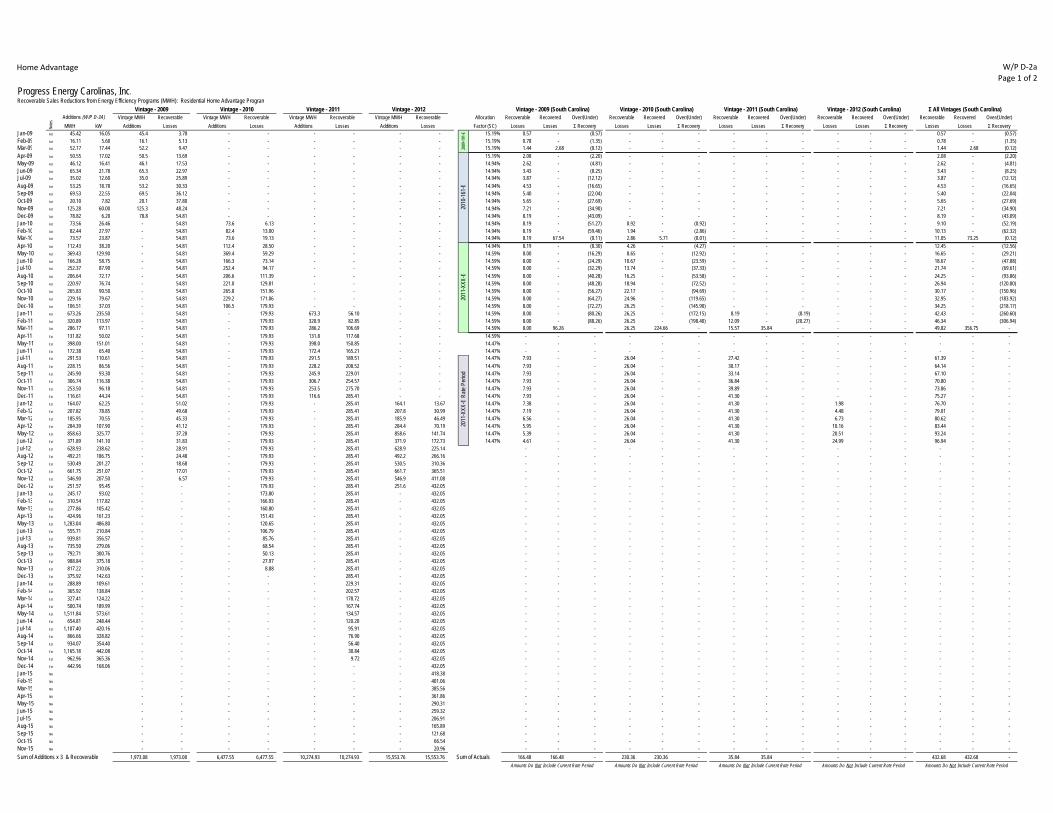
Home Advantage W/P D‐2aPage 1 of 2
Progress Energy Carolinas, Inc.Recoverable Sales Reductions from Energy Efficiency Programs (MWH): Residential Home Advantage Program
Σ All Vintages (South Carolina)Vintage MWH Recoverable Vintage MWH Recoverable Vintage MWH Recoverable Vintage MWH Recoverable Allocation Recoverable Recovered Over/(Under) Recoverable Recovered Over/(Under) Recoverable Recovered Over/(Under) Recoverable Recovered Over/(Under) Recoverable Recovered Over/(Under)
MWH kW Additions Losses Additions Losses Additions Losses Additions Losses Factor (SC) Losses Losses Σ Recovery Losses Losses Σ Recovery Losses Losses Σ Recovery Losses Losses Σ Recovery Losses Losses Σ RecoveryJan-09 Act 45.42 16.05 45.4 3.78 - - - - - - 15.19% 0.57 - (0.57) - - - - - - - - - 0.57 - (0.57) Feb-09 Act 16.11 5.60 16.1 5.13 - - - - - - 15.19% 0.78 - (1.35) - - - - - - - - - 0.78 - (1.35) Mar-09 Act 52.17 17.44 52.2 9.47 - - - - - - 15.19% 1.44 2.68 (0.12) - - - - - - - - - 1.44 2.68 (0.12) Apr-09 Act 50.55 17.02 50.5 13.69 - - - - - - 15.19% 2.08 - (2.20) - - - - - - - - - 2.08 - (2.20) May-09 Act 46.12 16.41 46.1 17.53 - - - - - - 14.94% 2.62 - (4.81) - - - - - - - - - 2.62 - (4.81) Jun-09 Act 65.34 21.78 65.3 22.97 - - - - - - 14.94% 3.43 - (8.25) - - - - - - - - - 3.43 - (8.25) Jul-09 Act 35.02 12.60 35.0 25.89 - - - - - - 14.94% 3.87 - (12.12) - - - - - - - - - 3.87 - (12.12) Aug-09 Act 53.25 18.78 53.2 30.33 - - - - - - 14.94% 4.53 - (16.65) - - - - - - - - - 4.53 - (16.65) Sep-09 Act 69.53 22.55 69.5 36.12 - - - - - - 14.94% 5.40 - (22.04) - - - - - - - - - 5.40 - (22.04) Oct-09 Act 20.10 7.82 20.1 37.80 - - - - - - 14.94% 5.65 - (27.69) - - - - - - - - - 5.65 - (27.69) Nov-09 Act 125.28 60.00 125.3 48.24 - - - - - - 14.94% 7.21 - (34.90) - - - - - - - - - 7.21 - (34.90) Dec-09 Act 78.82 6.20 78.8 54.81 - - - - - - 14.94% 8.19 - (43.09) - - - - - - - - - 8.19 - (43.09) Jan-10 Act 73.56 26.46 - 54.81 73.6 6.13 - - - - 14.94% 8.19 - (51.27) 0.92 - (0.92) - - - - - - 9.10 - (52.19) Feb-10 Act 82.44 27.97 - 54.81 82.4 13.00 - - - - 14.94% 8.19 - (59.46) 1.94 - (2.86) - - - - - - 10.13 - (62.32) Mar-10 Act 73.57 23.87 - 54.81 73.6 19.13 - - - - 14.94% 8.19 67.54 (0.11) 2.86 5.71 (0.01) - - - - - - 11.05 73.25 (0.12) Apr-10 Act 112.43 38.20 - 54.81 112.4 28.50 - - - - 14.94% 8.19 - (8.30) 4.26 - (4.27) - - - - - - 12.45 - (12.56) May-10 Act 369.43 129.90 - 54.81 369.4 59.29 - - - - 14.59% 8.00 - (16.29) 8.65 - (12.92) - - - - - - 16.65 - (29.21) Jun-10 Act 166.28 58.75 - 54.81 166.3 73.14 - - - - 14.59% 8.00 - (24.29) 10.67 - (23.59) - - - - - - 18.67 - (47.88) Jul-10 Act 252.37 87.90 - 54.81 252.4 94.17 - - - - 14.59% 8.00 - (32.29) 13.74 - (37.33) - - - - - - 21.74 - (69.61) Aug-10 Act 206.64 72.17 - 54.81 206.6 111.39 - - - - 14.59% 8.00 - (40.28) 16.25 - (53.58) - - - - - - 24.25 - (93.86) Sep-10 Act 220.97 76.74 - 54.81 221.0 129.81 - - - - 14.59% 8.00 - (48.28) 18.94 - (72.52) - - - - - - 26.94 - (120.80) Oct-10 Act 265.83 90.50 - 54.81 265.8 151.96 - - - - 14.59% 8.00 - (56.27) 22.17 - (94.69) - - - - - - 30.17 - (150.96) Nov-10 Act 229.16 79.67 - 54.81 229.2 171.06 - - - - 14.59% 8.00 - (64.27) 24.96 - (119.65) - - - - - - 32.95 - (183.92) Dec-10 Act 106.51 37.03 - 54.81 106.5 179.93 - - - - 14.59% 8.00 - (72.27) 26.25 - (145.90) - - - - - - 34.25 - (218.17) Jan-11 Act 673.26 235.50 - 54.81 - 179.93 673.3 56.10 - - 14.59% 8.00 - (80.26) 26.25 - (172.15) 8.19 - (8.19) - - - 42.43 - (260.60) Feb-11 Act 320.89 113.97 - 54.81 - 179.93 320.9 82.85 - - 14.59% 8.00 - (88.26) 26.25 - (198.40) 12.09 - (20.27) - - - 46.34 - (306.94) Mar-11 Act 286.17 97.11 - 54.81 - 179.93 286.2 106.69 - - 14.59% 8.00 96.26 - 26.25 224.66 - 15.57 35.84 - - - - 49.82 356.75 - Apr-11 Est 131.82 50.02 - 54.81 - 179.93 131.8 117.68 - - 14.59% - - - - - - - - - - - - - - - May-11 Est 398.00 151.01 - 54.81 - 179.93 398.0 150.85 - - 14.47% - - - - - - - - - - - - - - - Jun-11 Est 172.38 65.40 - 54.81 - 179.93 172.4 165.21 - - 14.47% - - - - - - - - - - - - - - - Jul-11 Est 291.53 110.61 - 54.81 - 179.93 291.5 189.51 - - 14.47% 7.93 - - 26.04 - - 27.42 - - - - - 61.39 - - Aug-11 Est 228.15 86.56 - 54.81 - 179.93 228.2 208.52 - - 14.47% 7.93 - - 26.04 - - 30.17 - - - - - 64.14 - - Sep-11 Est 245.90 93.30 - 54.81 - 179.93 245.9 229.01 - - 14.47% 7.93 - - 26.04 - - 33.14 - - - - - 67.10 - - Oct-11 Est 306.74 116.38 - 54.81 - 179.93 306.7 254.57 - - 14.47% 7.93 - - 26.04 - - 36.84 - - - - - 70.80 - - Nov-11 Est 253.50 96.18 - 54.81 - 179.93 253.5 275.70 - - 14.47% 7.93 - - 26.04 - - 39.89 - - - - - 73.86 - - Dec-11 Est 116.61 44.24 - 54.81 - 179.93 116.6 285.41 - - 14.47% 7.93 - - 26.04 - - 41.30 - - - - - 75.27 - - Jan-12 Est 164.07 62.25 - 51.02 - 179.93 - 285.41 164.1 13.67 14.47% 7.38 - - 26.04 - - 41.30 - - 1.98 - - 76.70 - - Feb-12 Est 207.82 78.85 - 49.68 - 179.93 - 285.41 207.8 30.99 14.47% 7.19 - - 26.04 - - 41.30 - - 4.48 - - 79.01 - - Mar-12 Est 185.95 70.55 - 45.33 - 179.93 - 285.41 185.9 46.49 14.47% 6.56 - - 26.04 - - 41.30 - - 6.73 - - 80.62 - - Apr-12 Est 284.39 107.90 - 41.12 - 179.93 - 285.41 284.4 70.19 14.47% 5.95 - - 26.04 - - 41.30 - - 10.16 - - 83.44 - - May-12 Est 858.63 325.77 - 37.28 - 179.93 - 285.41 858.6 141.74 14.47% 5.39 - - 26.04 - - 41.30 - - 20.51 - - 93.24 - - Jun-12 Est 371.89 141.10 - 31.83 - 179.93 - 285.41 371.9 172.73 14.47% 4.61 - - 26.04 - - 41.30 - - 24.99 - - 96.94 - - Jul-12 Est 628.93 238.62 - 28.91 - 179.93 - 285.41 628.9 225.14 - - - - - - - - - - - - - - - Aug-12 Est 492.21 186.75 - 24.48 - 179.93 - 285.41 492.2 266.16 - - - - - - - - - - - - - - - Sep-12 Est 530.49 201.27 - 18.68 - 179.93 - 285.41 530.5 310.36 - - - - - - - - - - - - - - - Oct-12 Est 661.75 251.07 - 17.01 - 179.93 - 285.41 661.7 365.51 - - - - - - - - - - - - - - - Nov-12 Est 546.90 207.50 - 6.57 - 179.93 - 285.41 546.9 411.08 - - - - - - - - - - - - - - - Dec-12 Est 251.57 95.45 - - - 179.93 - 285.41 251.6 432.05 - - - - - - - - - - - - - - - Jan-13 Est 245.17 93.02 - - - 173.80 - 285.41 - 432.05 - - - - - - - - - - - - - - - Feb-13 Est 310.54 117.82 - - - 166.93 - 285.41 - 432.05 - - - - - - - - - - - - - - - Mar-13 Est 277.86 105.42 - - - 160.80 - 285.41 - 432.05 - - - - - - - - - - - - - - - Apr-13 Est 424.96 161.23 - - - 151.43 - 285.41 - 432.05 - - - - - - - - - - - - - - - May-13 Est 1,283.04 486.80 - - - 120.65 - 285.41 - 432.05 - - - - - - - - - - - - - - - Jun-13 Est 555.71 210.84 - - - 106.79 - 285.41 - 432.05 - - - - - - - - - - - - - - - Jul-13 Est 939.81 356.57 - - - 85.76 - 285.41 - 432.05 - - - - - - - - - - - - - - - Aug-13 Est 735.50 279.06 - - - 68.54 - 285.41 - 432.05 - - - - - - - - - - - - - - - Sep-13 Est 792.71 300.76 - - - 50.13 - 285.41 - 432.05 - - - - - - - - - - - - - - - Oct-13 Est 988.84 375.18 - - - 27.97 - 285.41 - 432.05 - - - - - - - - - - - - - - - Nov-13 Est 817.22 310.06 - - - 8.88 - 285.41 - 432.05 - - - - - - - - - - - - - - - Dec-13 Est 375.92 142.63 - - - - - 285.41 - 432.05 - - - - - - - - - - - - - - - Jan-14 Est 288.89 109.61 - - - - - 229.31 - 432.05 - - - - - - - - - - - - - - - Feb-14 Est 365.92 138.84 - - - - - 202.57 - 432.05 - - - - - - - - - - - - - - - Mar-14 Est 327.41 124.22 - - - - - 178.72 - 432.05 - - - - - - - - - - - - - - - Apr-14 Est 500.74 189.99 - - - - - 167.74 - 432.05 - - - - - - - - - - - - - - - May-14 Est 1,511.84 573.61 - - - - - 134.57 - 432.05 - - - - - - - - - - - - - - - Jun-14 Est 654.81 248.44 - - - - - 120.20 - 432.05 - - - - - - - - - - - - - - - Jul-14 Est 1,107.40 420.16 - - - - - 95.91 - 432.05 - - - - - - - - - - - - - - - Aug-14 Est 866.66 328.82 - - - - - 76.90 - 432.05 - - - - - - - - - - - - - - - Sep-14 Est 934.07 354.40 - - - - - 56.40 - 432.05 - - - - - - - - - - - - - - - Oct-14 Est 1,165.18 442.08 - - - - - 30.84 - 432.05 - - - - - - - - - - - - - - - Nov-14 Est 962.96 365.36 - - - - - 9.72 - 432.05 - - - - - - - - - - - - - - - Dec-14 Est 442.96 168.06 - - - - - - - 432.05 - - - - - - - - - - - - - - - Jan-15 NA - - - - - - - 418.38 - - - - - - - - - - - - - - - Feb-15 NA - - - - - - - 401.06 - - - - - - - - - - - - - - - Mar-15 NA - - - - - - - 385.56 - - - - - - - - - - - - - - - Apr-15 NA - - - - - - - 361.86 - - - - - - - - - - - - - - - May-15 NA - - - - - - - 290.31 - - - - - - - - - - - - - - - Jun-15 NA - - - - - - - 259.32 - - - - - - - - - - - - - - - Jul-15 NA - - - - - - - 206.91 - - - - - - - - - - - - - - - Aug-15 NA - - - - - - - 165.89 - - - - - - - - - - - - - - - Sep-15 NA - - - - - - - 121.68 - - - - - - - - - - - - - - - Oct-15 NA - - - - - - - 66.54 - - - - - - - - - - - - - - - Nov-15 NA - - - - - - - 20.96 - - - - - - - - - - - - - - - Sum of Additions x 3 & Recoverable 1,973.08 1,973.08 6,477.55 6,477.55 10,274.93 10,274.93 15,553.76 15,553.76 Sum of Actuals 166.48 166.48 - 230.36 230.36 - 35.84 35.84 - - - - 432.68 432.68 -
2011
-XXX
-E R
ate P
eriod
Amounts Do Not Include Current Rate Period Amounts Do Not Include Current Rate Period Amounts Do Not Include Current Rate Period Amounts Do Not Include Current Rate Period
Vintage - 2012 Vintage - 2012 (South Carolina)Additions (W/P D-3A)
Vintage - 2009 Vintage - 2010 Vintage - 2011
Amounts Do Not Include Current Rate Period
Notes
2011
-XXX
-E
Vintage - 2011 (South Carolina)Vintage - 2009 (South Carolina) Vintage - 2010 (South Carolina)
2009
-191
-E
2010
-161
-E

Home Advantage W/P D‐2aPage 2 of 2
Σ Recovered Net Lost RevenueStart Date End Date Source Documents for Recovered Lost MWHs MWH Rate Recovery MWH Rate Recovery MWH Rate Recovery MWH Rate Recovery MWH Rate Recovery
2009-191-E Test Period Net Recoveries Sep-07 to Mar-09 Refer to Workpaper D-2 employed in Docket No. 2009-191-E 2.68 59.28$ 158.63$ - -$ -$ - -$ -$ - -$ -$ 2.68 59.28$ 158.63$
2010-161-E Test Period Net Recoveries Apr-09 to Mar-10 Refer to Workpaper D-3 employed in Docket No. 2010-161-E 67.54 58.67$ 3,962.98 5.71 58.67$ 334.85$ - - - - 73.25 58.67$ 4,297.83$
Vintage Amounts thru 2010-161-E Sum of Amounts from Prior Proceedings 70.22 4,121.61$ 5.71 334.85$ - -$ - -$ 75.93 4,456.46$ (W/P D-3) (W/P D-3) (W/P D-3) To W/P D-2
2011-XXX-E Test Period Net Recoverables Apr-10 to Mar-11 Amounts from Current Test Period (April 2010 thru March 2011) 96.26 58.39$ 5,620.90 224.66 58.39$ 13,118.65 35.84 58.39$ 2,092.84 - - 356.75 58.39$ 20,832.39$
Vintage Amounts thru 2011-XXX-E Sum of Amounts from Current and Prior Proceedings 166.48 58.39$ 9,742.51$ 230.36 58.39$ 13,453.50$ 35.84 58.39$ 2,092.84$ - -$ -$ 432.68 58.39$ 25,288.85$ (W/P D-3) (W/P D-3) (W/P D-3) (W/P D-3) To W/P D-2
2011-XXX-E Rate Period Forecast Jul-11 to Jun-12 Sum of Rate Period Values (Jul‐11 thru Jun‐12) 84.67 57.85$ 4,898.32$ 312.43 57.85$ 18,075.69$ 456.56 57.85$ 26,413.93$ 68.85 57.85$ 3,983.18$ 922.51 57.85$ 53,371.11$
Vintage 2012 RecoveriesVintage 2009 Recoveries Vintage 2010 Recoveries Vintage 2011 Recoveries
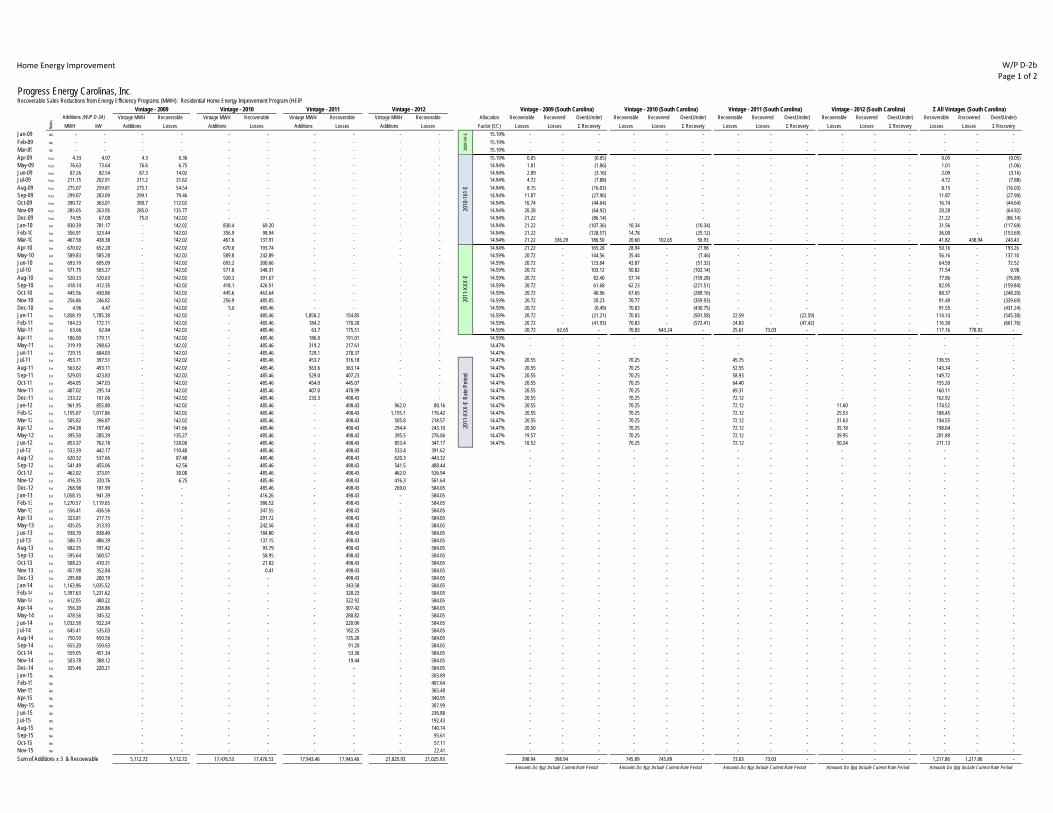
Home Energy Improvement W/P D‐2bPage 1 of 2
Progress Energy Carolinas, Inc.Recoverable Sales Reductions from Energy Efficiency Programs (MWH): Residential Home Energy Improvement Program (HEIP
Σ All Vintages (South Carolina)Vintage MWH Recoverable Vintage MWH Recoverable Vintage MWH Recoverable Vintage MWH Recoverable Allocation Recoverable Recovered Over/(Under) Recoverable Recovered Over/(Under) Recoverable Recovered Over/(Under) Recoverable Recovered Over/(Under) Recoverable Recovered Over/(Under)
MWH kW Additions Losses Additions Losses Additions Losses Additions Losses Factor (SC) Losses Losses Σ Recovery Losses Losses Σ Recovery Losses Losses Σ Recovery Losses Losses Σ Recovery Losses Losses Σ RecoveryJan-09 NA - - - - - - - - - - 15.19% - - - - - - - - - - - - - - - Feb-09 NA - - - - - - - - - - 15.19% - - - - - - - - - - - - - - - Mar-09 NA - - - - - - - - - - 15.19% - - - - - - - - - - - - - - - Apr-09 Vact 4.33 4.07 4.3 0.36 - - - - - - 15.19% 0.05 - (0.05) - - - - - - - - - 0.05 - (0.05) May-09 Vact 76.63 73.64 76.6 6.75 - - - - - - 14.94% 1.01 - (1.06) - - - - - - - - - 1.01 - (1.06) Jun-09 Vact 87.26 82.54 87.3 14.02 - - - - - - 14.94% 2.09 - (3.16) - - - - - - - - - 2.09 - (3.16) Jul-09 Vact 211.15 202.91 211.2 31.62 - - - - - - 14.94% 4.72 - (7.88) - - - - - - - - - 4.72 - (7.88) Aug-09 Vact 275.07 259.81 275.1 54.54 - - - - - - 14.94% 8.15 - (16.03) - - - - - - - - - 8.15 - (16.03) Sep-09 Vact 299.07 283.09 299.1 79.46 - - - - - - 14.94% 11.87 - (27.90) - - - - - - - - - 11.87 - (27.90) Oct-09 Vact 390.72 363.01 390.7 112.02 - - - - - - 14.94% 16.74 - (44.64) - - - - - - - - - 16.74 - (44.64) Nov-09 Vact 285.05 263.95 285.0 135.77 - - - - - - 14.94% 20.28 - (64.92) - - - - - - - - - 20.28 - (64.92) Dec-09 Vact 74.95 67.00 75.0 142.02 - - - - - - 14.94% 21.22 - (86.14) - - - - - - - - - 21.22 - (86.14) Jan-10 Act 830.39 781.17 - 142.02 830.4 69.20 - - - - 14.94% 21.22 - (107.36) 10.34 - (10.34) - - - - - - 31.56 - (117.69) Feb-10 Act 356.91 323.44 - 142.02 356.9 98.94 - - - - 14.94% 21.22 - (128.57) 14.78 - (25.12) - - - - - - 36.00 - (153.69) Mar-10 Act 467.58 438.38 - 142.02 467.6 137.91 - - - - 14.94% 21.22 336.29 186.50 20.60 102.65 56.93 - - - - - - 41.82 438.94 243.43 Apr-10 Act 670.02 652.28 - 142.02 670.0 193.74 - - - - 14.94% 21.22 - 165.28 28.94 - 27.98 - - - - - - 50.16 - 193.26 May-10 Act 589.83 585.28 - 142.02 589.8 242.89 - - - - 14.59% 20.72 - 144.56 35.44 - (7.46) - - - - - - 56.16 - 137.10 Jun-10 Act 693.19 695.09 - 142.02 693.2 300.66 - - - - 14.59% 20.72 - 123.84 43.87 - (51.32) - - - - - - 64.59 - 72.52 Jul-10 Act 571.75 565.27 - 142.02 571.8 348.31 - - - - 14.59% 20.72 - 103.12 50.82 - (102.14) - - - - - - 71.54 - 0.98 Aug-10 Act 520.33 520.63 - 142.02 520.3 391.67 - - - - 14.59% 20.72 - 82.40 57.14 - (159.28) - - - - - - 77.86 - (76.89) Sep-10 Act 418.14 412.35 - 142.02 418.1 426.51 - - - - 14.59% 20.72 - 61.68 62.23 - (221.51) - - - - - - 82.95 - (159.84) Oct-10 Act 445.56 430.86 - 142.02 445.6 463.64 - - - - 14.59% 20.72 - 40.96 67.65 - (289.16) - - - - - - 88.37 - (248.20) Nov-10 Act 256.86 246.82 - 142.02 256.9 485.05 - - - - 14.59% 20.72 - 20.23 70.77 - (359.93) - - - - - - 91.49 - (339.69) Dec-10 Act 4.96 4.47 - 142.02 5.0 485.46 - - - - 14.59% 20.72 - (0.49) 70.83 - (430.75) - - - - - - 91.55 - (431.24) Jan-11 Act 1,858.19 1,785.38 - 142.02 - 485.46 1,858.2 154.85 - - 14.59% 20.72 - (21.21) 70.83 - (501.58) 22.59 - (22.59) - - - 114.14 - (545.38) Feb-11 Act 184.23 172.11 - 142.02 - 485.46 184.2 170.20 - - 14.59% 20.72 - (41.93) 70.83 - (572.41) 24.83 - (47.42) - - - 116.38 - (661.76) Mar-11 Act 63.66 62.84 - 142.02 - 485.46 63.7 175.51 - - 14.59% 20.72 62.65 - 70.83 643.24 - 25.61 73.03 - - - - 117.16 778.92 - Apr-11 Est 186.00 179.11 - 142.02 - 485.46 186.0 191.01 - - 14.59% - - - - - - - - - - - - - - - May-11 Est 319.19 298.63 - 142.02 - 485.46 319.2 217.61 - - 14.47% - - - - - - - - - - - - - - - Jun-11 Est 729.15 684.03 - 142.02 - 485.46 729.1 278.37 - - 14.47% - - - - - - - - - - - - - - - Jul-11 Est 453.71 397.51 - 142.02 - 485.46 453.7 316.18 - - 14.47% 20.55 - - 70.25 - - 45.75 - - - - - 136.55 - - Aug-11 Est 563.62 493.11 - 142.02 - 485.46 563.6 363.14 - - 14.47% 20.55 - - 70.25 - - 52.55 - - - - - 143.34 - - Sep-11 Est 529.03 423.83 - 142.02 - 485.46 529.0 407.23 - - 14.47% 20.55 - - 70.25 - - 58.93 - - - - - 149.72 - - Oct-11 Est 454.05 347.03 - 142.02 - 485.46 454.0 445.07 - - 14.47% 20.55 - - 70.25 - - 64.40 - - - - - 155.20 - - Nov-11 Est 407.02 295.14 - 142.02 - 485.46 407.0 478.99 - - 14.47% 20.55 - - 70.25 - - 69.31 - - - - - 160.11 - - Dec-11 Est 233.32 161.06 - 142.02 - 485.46 233.3 498.43 - - 14.47% 20.55 - - 70.25 - - 72.12 - - - - - 162.92 - - Jan-12 Est 961.95 855.80 - 142.02 - 485.46 - 498.43 962.0 80.16 14.47% 20.55 - - 70.25 - - 72.12 - - 11.60 - - 174.52 - - Feb-12 Est 1,155.07 1,017.86 - 142.02 - 485.46 - 498.43 1,155.1 176.42 14.47% 20.55 - - 70.25 - - 72.12 - - 25.53 - - 188.45 - - Mar-12 Est 505.82 396.87 - 142.02 - 485.46 - 498.43 505.8 218.57 14.47% 20.55 - - 70.25 - - 72.12 - - 31.63 - - 194.55 - - Apr-12 Est 294.38 197.40 - 141.66 - 485.46 - 498.43 294.4 243.10 14.47% 20.50 - - 70.25 - - 72.12 - - 35.18 - - 198.04 - - May-12 Est 395.50 285.39 - 135.27 - 485.46 - 498.43 395.5 276.06 14.47% 19.57 - - 70.25 - - 72.12 - - 39.95 - - 201.89 - - Jun-12 Est 853.37 762.18 - 128.00 - 485.46 - 498.43 853.4 347.17 14.47% 18.52 - - 70.25 - - 72.12 - - 50.24 - - 211.13 - - Jul-12 Est 533.39 442.17 - 110.40 - 485.46 - 498.43 533.4 391.62 - - - - - - - - - - - - - - - Aug-12 Est 620.32 537.66 - 87.48 - 485.46 - 498.43 620.3 443.32 - - - - - - - - - - - - - - - Sep-12 Est 541.49 455.06 - 62.56 - 485.46 - 498.43 541.5 488.44 - - - - - - - - - - - - - - - Oct-12 Est 462.02 373.01 - 30.00 - 485.46 - 498.43 462.0 526.94 - - - - - - - - - - - - - - - Nov-12 Est 416.35 320.76 - 6.25 - 485.46 - 498.43 416.3 561.64 - - - - - - - - - - - - - - - Dec-12 Est 268.98 181.99 - - - 485.46 - 498.43 269.0 584.05 - - - - - - - - - - - - - - - Jan-13 Est 1,058.15 941.39 - - - 416.26 - 498.43 - 584.05 - - - - - - - - - - - - - - - Feb-13 Est 1,270.57 1,119.65 - - - 386.52 - 498.43 - 584.05 - - - - - - - - - - - - - - - Mar-13 Est 556.41 436.56 - - - 347.55 - 498.43 - 584.05 - - - - - - - - - - - - - - - Apr-13 Est 323.81 217.15 - - - 291.72 - 498.43 - 584.05 - - - - - - - - - - - - - - - May-13 Est 435.05 313.93 - - - 242.56 - 498.43 - 584.05 - - - - - - - - - - - - - - - Jun-13 Est 938.70 838.40 - - - 184.80 - 498.43 - 584.05 - - - - - - - - - - - - - - - Jul-13 Est 586.73 486.39 - - - 137.15 - 498.43 - 584.05 - - - - - - - - - - - - - - - Aug-13 Est 682.35 591.42 - - - 93.79 - 498.43 - 584.05 - - - - - - - - - - - - - - - Sep-13 Est 595.64 500.57 - - - 58.95 - 498.43 - 584.05 - - - - - - - - - - - - - - - Oct-13 Est 508.23 410.31 - - - 21.82 - 498.43 - 584.05 - - - - - - - - - - - - - - - Nov-13 Est 457.98 352.84 - - - 0.41 - 498.43 - 584.05 - - - - - - - - - - - - - - - Dec-13 Est 295.88 200.19 - - - - - 498.43 - 584.05 - - - - - - - - - - - - - - - Jan-14 Est 1,163.96 1,035.52 - - - - - 343.58 - 584.05 - - - - - - - - - - - - - - - Feb-14 Est 1,397.63 1,231.62 - - - - - 328.23 - 584.05 - - - - - - - - - - - - - - - Mar-14 Est 612.05 480.22 - - - - - 322.92 - 584.05 - - - - - - - - - - - - - - - Apr-14 Est 356.20 238.86 - - - - - 307.42 - 584.05 - - - - - - - - - - - - - - - May-14 Est 478.56 345.32 - - - - - 280.82 - 584.05 - - - - - - - - - - - - - - - Jun-14 Est 1,032.58 922.24 - - - - - 220.06 - 584.05 - - - - - - - - - - - - - - - Jul-14 Est 645.41 535.03 - - - - - 182.25 - 584.05 - - - - - - - - - - - - - - - Aug-14 Est 750.59 650.56 - - - - - 135.28 - 584.05 - - - - - - - - - - - - - - - Sep-14 Est 655.20 550.63 - - - - - 91.20 - 584.05 - - - - - - - - - - - - - - - Oct-14 Est 559.05 451.34 - - - - - 53.36 - 584.05 - - - - - - - - - - - - - - - Nov-14 Est 503.78 388.12 - - - - - 19.44 - 584.05 - - - - - - - - - - - - - - - Dec-14 Est 325.46 220.21 - - - - - - - 584.05 - - - - - - - - - - - - - - - Jan-15 NA - - - - - - - 503.89 - - - - - - - - - - - - - - - Feb-15 NA - - - - - - - 407.64 - - - - - - - - - - - - - - - Mar-15 NA - - - - - - - 365.48 - - - - - - - - - - - - - - - Apr-15 NA - - - - - - - 340.95 - - - - - - - - - - - - - - - May-15 NA - - - - - - - 307.99 - - - - - - - - - - - - - - - Jun-15 NA - - - - - - - 236.88 - - - - - - - - - - - - - - - Jul-15 NA - - - - - - - 192.43 - - - - - - - - - - - - - - - Aug-15 NA - - - - - - - 140.74 - - - - - - - - - - - - - - - Sep-15 NA - - - - - - - 95.61 - - - - - - - - - - - - - - - Oct-15 NA - - - - - - - 57.11 - - - - - - - - - - - - - - - Nov-15 NA - - - - - - - 22.41 - - - - - - - - - - - - - - - Sum of Additions x 3 & Recoverable 5,112.72 5,112.72 17,476.53 17,476.53 17,943.46 17,943.46 21,025.93 21,025.93 398.94 398.94 - 745.89 745.89 - 73.03 73.03 - - - - 1,217.86 1,217.86 -
Vintage - 2009 (South Carolina) Vintage - 2010 (South Carolina) Vintage - 2011 (South Carolina) Vintage - 2012 (South Carolina)
Notes
Additions (W/P D-3A)Vintage - 2009 Vintage - 2010 Vintage - 2011 Vintage - 2012
2009
-191
-E
2010
-161
-E
2011
-XXX
-E
2011
-XXX
-E R
ate P
eriod
Amounts Do Not Include Current Rate Period Amounts Do Not Include Current Rate Period Amounts Do Not Include Current Rate Period Amounts Do Not Include Current Rate Period Amounts Do Not Include Current Rate Period

Home Energy Improvement W/P D‐2bPage 2 of 2
Σ Recovered Net Lost RevenueStart Date End Date Source Documents for Recovered Lost MWHs MWH Rate Recovery MWH Rate Recovery MWH Rate Recovery MWH Rate Recovery MWH Rate Recovery
2009-191-E Test Period Net Recoveries Sep-07 to Mar-09 Refer to Workpaper D-2 employed in Docket No. 2009-191-E - -$ -$ - -$ -$ - -$ -$ - -$ -$ - -$ -$
2010-161-E Test Period Net Recoveries Apr-09 to Mar-10 Refer to Workpaper D-3 employed in Docket No. 2010-161-E 336.29 58.67$ 19,731.10 102.65 58.67$ 6,022.86$ - - - - 438.94 58.67$ 25,753.96$
Vintage Amounts thru 2010-161-E Sum of Amounts from Prior Proceedings 336.29 19,731.10$ 102.65 6,022.86$ - -$ - -$ 438.94 25,753.96$ (W/P D-3) (W/P D-3) (W/P D-3) To W/P D-2
2011-XXX-E Test Period Net Recoveries Apr-10 to Mar-11 Amounts from Current Test Period (April 2010 thru March 2011) 62.65 58.39$ 3,658.33 643.24 58.39$ 37,561.67 73.03 58.39$ 4,264.64 - - 778.92 58.39$ 45,484.64$
Vintage Amounts thru 2011-XXX-E Sum of Amounts from Current and Prior Proceedings 398.94 58.39$ 23,389.43$ 745.89 58.39$ 43,584.53$ 73.03 58.39$ 4,264.64$ - -$ -$ 1,217.86 58.39$ 71,238.60$ (W/P D-3) (W/P D-3) (W/P D-3) (W/P D-3) To W/P D-2
2011-XXX-E Rate Period Forecast Jul-11 to Jun-12 Sum of Rate Period Values (Jul‐11 thru Jun‐12) 243.55 57.85$ 14,090.25$ 842.95 57.85$ 48,768.48$ 795.79 57.85$ 46,040.22$ 194.11 57.85$ 11,230.31$ 2,076.40 57.85$ 120,129.26$
Vintage 2010 Recoveries Vintage 2011 Recoveries Vintage 2012 RecoveriesVintage 2009 Recoveries

Residential Lighting W/P D‐2cPage 1 of 2
Progress Energy Carolinas, Inc.Recoverable Sales Reductions from Energy Efficiency Programs (MWH): Residential Lighting Program
Σ All Vintages (South Carolina)Vintage MWH Recoverable Vintage MWH Recoverable Vintage MWH Recoverable Vintage MWH Recoverable Allocation Recoverable Recovered Over/(Under) Recoverable Recovered Over/(Under) Recoverable Recovered Over/(Under) Recoverable Recovered Over/(Under) Recoverable Recovered Over/(Under)
MWH kW Additions Losses Additions Losses Additions Losses Additions Losses Factor (SC) Losses Losses Σ Recovery Losses Losses Σ Recovery Losses Losses Σ Recovery Losses Losses Σ Recovery Losses Losses Σ RecoveryJan-09 NA - - - - - - - - - - 15.19% - - - - - - - - - - - - - - - Feb-09 NA - - - - - - - - - - 15.19% - - - - - - - - - - - - - - - Mar-09 NA - - - - - - - - - - 15.19% - - - - - - - - - - - - - - - Apr-09 NA - - - - - - - - - - 15.19% - - - - - - - - - - - - - - - May-09 NA - - - - - - - - - - 14.94% - - - - - - - - - - - - - - - Jun-09 NA - - - - - - - - - - 14.94% - - - - - - - - - - - - - - - Jul-09 NA - - - - - - - - - - 14.94% - - - - - - - - - - - - - - - Aug-09 NA - - - - - - - - - - 14.94% - - - - - - - - - - - - - - - Sep-09 NA - - - - - - - - - - 14.94% - - - - - - - - - - - - - - - Oct-09 NA - - - - - - - - - - 14.94% - - - - - - - - - - - - - - - Nov-09 NA - - - - - - - - - - 14.94% - - - - - - - - - - - - - - - Dec-09 NA - - - - - - - - - - 14.94% - - - - - - - - - - - - - - - Jan-10 Act 363.0 18.6 - - 363.0 30.25 - - - - 14.94% - - - 4.52 - (4.52) - - - - - - 4.52 - (4.52) Feb-10 Act 4,364.4 429.3 - - 4,364.4 393.95 - - - - 14.94% - - - 58.86 - (63.38) - - - - - - 58.86 - (63.38) Mar-10 Act 8,284.0 784.9 - - 8,284.0 1,084.28 - - - - 14.94% - - - 161.99 216.92 (8.45) - - - - - - 161.99 216.92 (8.45) Apr-10 Act 10,485.9 995.9 - - 10,485.9 1,958.11 - - - - 14.94% - - - 292.54 - (300.99) - - - - - - 292.54 - (300.99) May-10 Act 1,116.6 113.9 - - 1,116.6 2,051.16 - - - - 14.59% - - - 299.26 - (600.25) - - - - - - 299.26 - (600.25) Jun-10 Act 8,324.5 787.3 - - 8,324.5 2,744.87 - - - - 14.59% - - - 400.48 - (1,000.73) - - - - - - 400.48 - (1,000.73) Jul-10 Act 5,666.7 535.9 - - 5,666.7 3,217.10 - - - - 14.59% - - - 469.37 - (1,470.11) - - - - - - 469.37 - (1,470.11) Aug-10 Act 15,399.9 1,451.7 - - 15,399.9 4,500.42 - - - - 14.59% - - - 656.61 - (2,126.72) - - - - - - 656.61 - (2,126.72) Sep-10 Act 6,557.3 617.0 - - 6,557.3 5,046.87 - - - - 14.59% - - - 736.34 - (2,863.05) - - - - - - 736.34 - (2,863.05) Oct-10 Act 8,394.1 794.2 - - 8,394.1 5,746.38 - - - - 14.59% - - - 838.40 - (3,701.45) - - - - - - 838.40 - (3,701.45) Nov-10 Act 6,033.4 571.5 - - 6,033.4 6,249.16 - - - - 14.59% - - - 911.75 - (4,613.20) - - - - - - 911.75 - (4,613.20) Dec-10 Act 1,562.1 152.5 - - 1,562.1 6,379.33 - - - - 14.59% - - - 930.74 - (5,543.95) - - - - - - 930.74 - (5,543.95) Jan-11 Act 7,294.2 686.0 - - - 6,379.33 7,294.2 607.85 - - 14.59% - - - 930.74 - (6,474.69) 88.69 - (88.69) - - - 1,019.43 - (6,563.38) Feb-11 Act 4,172.2 395.0 - - - 6,379.33 4,172.2 955.53 - - 14.59% - - - 930.74 - (7,405.44) 139.41 - (228.10) - - - 1,070.16 - (7,633.53) Mar-11 Act 6,324.8 596.8 - - - 6,379.33 6,324.8 1,482.60 - - 14.59% - - - 930.74 8,336.18 - 216.31 444.41 - - - - 1,147.06 8,780.59 - Apr-11 Est 6,937.3 657.2 - - - 6,379.33 6,937.3 2,060.70 - - 14.59% - - - - - - - - - - - - - - - May-11 Est 6,622.0 627.3 - - - 6,379.33 6,622.0 2,612.53 - - 14.47% - - - - - - - - - - - - - - - Jun-11 Est 6,306.6 597.5 - - - 6,379.33 6,306.6 3,138.09 - - 14.47% - - - - - - - - - - - - - - - Jul-11 Est 5,360.6 507.8 - - - 6,379.33 5,360.6 3,584.81 - - 14.47% - - - 923.09 - - 518.72 - - - - - 1,441.81 - - Aug-11 Est 5,360.6 507.8 - - - 6,379.33 5,360.6 4,031.52 - - 14.47% - - - 923.09 - - 583.36 - - - - - 1,506.45 - - Sep-11 Est 6,937.3 657.2 - - - 6,379.33 6,937.3 4,609.63 - - 14.47% - - - 923.09 - - 667.01 - - - - - 1,590.10 - - Oct-11 Est 6,937.3 657.2 - - - 6,379.33 6,937.3 5,187.74 - - 14.47% - - - 923.09 - - 750.67 - - - - - 1,673.76 - - Nov-11 Est 6,306.6 597.5 - - - 6,379.33 6,306.6 5,713.29 - - 14.47% - - - 923.09 - - 826.71 - - - - - 1,749.80 - - Dec-11 Est 5,627.1 533.1 - - - 6,379.33 5,627.1 6,182.22 - - 14.47% - - - 923.09 - - 894.57 - - - - - 1,817.66 - - Jan-12 Est 6,564.6 621.9 - - - 6,379.33 - 6,182.22 6,564.6 547.05 14.47% - - - 923.09 - - 894.57 - - 79.16 - - 1,896.81 - - Feb-12 Est 3,754.8 355.7 - - - 6,379.33 - 6,182.22 3,754.8 859.95 14.47% - - - 923.09 - - 894.57 - - 124.43 - - 1,942.09 - - Mar-12 Est 5,959.8 564.6 - - - 6,379.33 - 6,182.22 5,959.8 1,356.60 14.47% - - - 923.09 - - 894.57 - - 196.30 - - 2,013.96 - - Apr-12 Est 6,243.6 591.5 - - - 6,379.33 - 6,182.22 6,243.6 1,876.89 14.47% - - - 923.09 - - 894.57 - - 271.59 - - 2,089.24 - - May-12 Est 5,959.8 564.6 - - - 6,379.33 - 6,182.22 5,959.8 2,373.54 14.47% - - - 923.09 - - 894.57 - - 343.45 - - 2,161.11 - - Jun-12 Est 5,676.0 537.7 - - - 6,379.33 - 6,182.22 5,676.0 2,846.54 14.47% - - - 923.09 - - 894.57 - - 411.89 - - 2,229.55 - - Jul-12 Est 4,824.6 457.1 - - - 6,379.33 - 6,182.22 4,824.6 3,248.58 - - - - - - - - - - - - - - - Aug-12 Est 4,824.6 457.1 - - - 6,379.33 - 6,182.22 4,824.6 3,650.63 - - - - - - - - - - - - - - - Sep-12 Est 6,243.6 591.5 - - - 6,379.33 - 6,182.22 6,243.6 4,170.93 - - - - - - - - - - - - - - - Oct-12 Est 6,243.6 591.5 - - - 6,379.33 - 6,182.22 6,243.6 4,691.22 - - - - - - - - - - - - - - - Nov-12 Est 5,676.0 537.7 - - - 6,379.33 - 6,182.22 5,676.0 5,164.22 - - - - - - - - - - - - - - - Dec-12 Est 5,064.4 479.8 - - - 6,379.33 - 6,182.22 5,064.4 5,586.26 - - - - - - - - - - - - - - - Jan-13 Est 5,251.7 497.5 - - - 6,349.08 - 6,182.22 - 5,586.26 - - - - - - - - - - - - - - - Feb-13 Est 3,003.8 284.6 - - - 5,985.38 - 6,182.22 - 5,586.26 - - - - - - - - - - - - - - - Mar-13 Est 4,767.8 451.7 - - - 5,295.05 - 6,182.22 - 5,586.26 - - - - - - - - - - - - - - - Apr-13 Est 4,994.8 473.2 - - - 4,421.22 - 6,182.22 - 5,586.26 - - - - - - - - - - - - - - - May-13 Est 4,767.8 451.7 - - - 4,328.17 - 6,182.22 - 5,586.26 - - - - - - - - - - - - - - - Jun-13 Est 4,540.8 430.2 - - - 3,634.46 - 6,182.22 - 5,586.26 - - - - - - - - - - - - - - - Jul-13 Est 3,859.7 365.6 - - - 3,162.23 - 6,182.22 - 5,586.26 - - - - - - - - - - - - - - - Aug-13 Est 3,859.7 365.6 - - - 1,878.91 - 6,182.22 - 5,586.26 - - - - - - - - - - - - - - - Sep-13 Est 4,994.8 473.2 - - - 1,332.46 - 6,182.22 - 5,586.26 - - - - - - - - - - - - - - - Oct-13 Est 4,994.8 473.2 - - - 632.95 - 6,182.22 - 5,586.26 - - - - - - - - - - - - - - - Nov-13 Est 4,540.8 430.2 - - - 130.17 - 6,182.22 - 5,586.26 - - - - - - - - - - - - - - - Dec-13 Est 4,051.5 383.8 - - - - - 6,182.22 - 5,586.26 - - - - - - - - - - - - - - - Jan-14 Est 4,201.3 398.0 - - - - - 5,574.37 - 5,586.26 - - - - - - - - - - - - - - - Feb-14 Est 2,403.1 227.7 - - - - - 5,226.69 - 5,586.26 - - - - - - - - - - - - - - - Mar-14 Est 3,814.2 361.3 - - - - - 4,699.62 - 5,586.26 - - - - - - - - - - - - - - - Apr-14 Est 3,995.9 378.5 - - - - - 4,121.52 - 5,586.26 - - - - - - - - - - - - - - - May-14 Est 3,814.2 361.3 - - - - - 3,569.69 - 5,586.26 - - - - - - - - - - - - - - - Jun-14 Est 3,632.6 344.1 - - - - - 3,044.13 - 5,586.26 - - - - - - - - - - - - - - - Jul-14 Est 3,087.7 292.5 - - - - - 2,597.42 - 5,586.26 - - - - - - - - - - - - - - - Aug-14 Est 3,087.7 292.5 - - - - - 2,150.70 - 5,586.26 - - - - - - - - - - - - - - - Sep-14 Est 3,995.9 378.5 - - - - - 1,572.59 - 5,586.26 - - - - - - - - - - - - - - - Oct-14 Est 3,995.9 378.5 - - - - - 994.48 - 5,586.26 - - - - - - - - - - - - - - - Nov-14 Est 3,632.6 344.1 - - - - - 468.93 - 5,586.26 - - - - - - - - - - - - - - - Dec-14 Est 3,241.2 307.1 - - - - - - - 5,586.26 - - - - - - - - - - - - - - - Jan-15 NA - - - - - - - 5,039.21 - - - - - - - - - - - - - - - Feb-15 NA - - - - - - - 4,726.31 - - - - - - - - - - - - - - - Mar-15 NA - - - - - - - 4,229.66 - - - - - - - - - - - - - - - Apr-15 NA - - - - - - - 3,709.36 - - - - - - - - - - - - - - - May-15 NA - - - - - - - 3,212.72 - - - - - - - - - - - - - - - Jun-15 NA - - - - - - - 2,739.72 - - - - - - - - - - - - - - - Jul-15 NA - - - - - - - 2,337.67 - - - - - - - - - - - - - - - Aug-15 NA - - - - - - - 1,935.63 - - - - - - - - - - - - - - - Sep-15 NA - - - - - - - 1,415.33 - - - - - - - - - - - - - - - Oct-15 NA - - - - - - - 895.03 - - - - - - - - - - - - - - - Nov-15 NA - - - - - - - 422.04 - - - - - - - - - - - - - - - Sum of Additions x 3 & Recoverable - - 229,655.91 229,655.91 222,559.93 222,559.93 201,105.22 201,105.22 Sum of Actuals - - - 8,553.10 8,553.10 - 444.41 444.41 - - - - 8,997.51 8,997.51 -
2009
-191
-E
2010
-161
-E
2011
-XXX
-E
2011
-XXX
-E R
ate P
eriod
Vintage - 2009 (South Carolina) Vintage - 2010 (South Carolina) Vintage - 2011 (South Carolina) Vintage - 2012 (South Carolina)
Notes
Additions (W/P D-3A)Vintage - 2009 Vintage - 2010 Vintage - 2011 Vintage - 2012
Amounts Do Not Include Current Rate Period Amounts Do Not Include Current Rate Period Amounts Do Not Include Current Rate Period Amounts Do Not Include Current Rate Period Amounts Do Not Include Current Rate Period

Residential Lighting W/P D‐2cPage 2 of 2
Σ Recovered Net Lost RevenueStart Date End Date Source Documents for Recovered Lost MWHs MWH Rate Recovery MWH Rate Recovery MWH Rate Recovery MWH Rate Recovery MWH Rate Recovery
2009-191-E Test Period Net Recoveries Sep-07 to Mar-09 Refer to Workpaper D-2 employed in Docket No. 2009-191-E - -$ -$ - -$ -$ - -$ -$ - -$ -$ - -$ -$
2010-161-E Test Period Net Recoveries Apr-09 to Mar-10 Refer to Workpaper D-3 employed in Docket No. 2010-161-E - - - 216.92 58.67 12,727.36$ - - - - 216.92 58.67$ 12,727.36$
Vintage Amounts thru 2010-161-E Sum of Amounts from Prior Proceedings - -$ 216.92 12,727.36$ - -$ - -$ 216.92 12,727.36$ (W/P D-3) (W/P D-3) To W/P D-2
2011-XXX-E Test Period Net Recoveries Apr-10 to Mar-11 Amounts from Current Test Period (April 2010 thru March 2011) - -$ - 8,336.18 58.39$ 486,787.86 444.41 58.39$ 25,951.05 - - 8,780.59 -$ 512,738.91$
Vintage Amounts thru 2011-XXX-E Sum of Amounts from Current and Prior Proceedings - -$ -$ 8,553.10 58.39$ 499,515.22$ 444.41 58.39$ 25,951.05$ - -$ -$ 8,997.51 -$ 525,466.27$ (W/P D-3) (W/P D-3) (W/P D-3) To W/P D-2
2011-XXX-E Rate Period Forecast Jul-11 to Jun-12 Sum of Rate Period Values (Jul‐11 thru Jun‐12) - - -$ 11,077.07 57.85$ 640,857.81$ 9,608.45 57.85$ 555,891.43$ 1,426.82 57.85$ 82,548.05$ 22,112.34 57.85$ 1,279,297.29$
Vintage 2010 Recoveries Vintage 2011 Recoveries Vintage 2012 RecoveriesVintage 2009 Recoveries

Neighborhood Energy Saver W/P D‐2dPage 1 of 2
Progress Energy Carolinas, Inc.Recoverable Sales Reductions from Energy Efficiency Programs (MWH): Residential Neighborhood Energy Saver Program (Low Income
Σ All Vintages (South Carolina)Vintage MWH Recoverable Vintage MWH Recoverable Vintage MWH Recoverable Vintage MWH Recoverable Allocation Recoverable Recovered Over/(Under) Recoverable Recovered Over/(Under) Recoverable Recovered Over/(Under) Recoverable Recovered Over/(Under) Recoverable Recovered Over/(Under)
MWH kW Additions Losses Additions Losses Additions Losses Additions Losses Factor (SC) Losses Losses Σ Recovery Losses Losses Σ Recovery Losses Losses Σ Recovery Losses Losses Σ Recovery Losses Losses Σ RecoveryJan-09 NA - - - - - - - - - - 15.19% - - - - - - - - - - - - - - - Feb-09 NA - - - - - - - - - - 15.19% - - - - - - - - - - - - - - - Mar-09 NA - - - - - - - - - - 15.19% - - - - - - - - - - - - - - - Apr-09 NA - - - - - - - - - - 15.19% - - - - - - - - - - - - - - - May-09 NA - - - - - - - - - - 14.94% - - - - - - - - - - - - - - - Jun-09 NA - - - - - - - - - - 14.94% - - - - - - - - - - - - - - - Jul-09 NA - - - - - - - - - - 14.94% - - - - - - - - - - - - - - - Aug-09 NA - - - - - - - - - - 14.94% - - - - - - - - - - - - - - - Sep-09 NA - - - - - - - - - - 14.94% - - - - - - - - - - - - - - - Oct-09 Act 125.28 19.31 125.3 10.44 - - - - - - 14.94% 1.56 - (1.56) - - - - - - - - - 1.56 - (1.56) Nov-09 Act 422.24 65.07 422.2 45.63 - - - - - - 14.94% 6.82 - (8.38) - - - - - - - - - 6.82 - (8.38) Dec-09 Act 30.62 4.63 30.6 48.18 - - - - - - 14.94% 7.20 - (15.57) - - - - - - - - - 7.20 - (15.57) Jan-10 Act 259.84 40.10 - 48.18 259.8 21.65 - - - - 14.94% 7.20 - (22.77) 3.24 - (3.24) - - - - - - 10.43 - (26.01) Feb-10 Act 292.32 45.11 - 48.18 292.3 46.01 - - - - 14.94% 7.20 - (29.97) 6.87 - (10.11) - - - - - - 14.07 - (40.08) Mar-10 Act 271.90 41.96 - 48.18 271.9 68.67 - - - - 14.94% 7.20 36.46 (0.71) 10.26 19.98 (0.39) - - - - - - 17.46 56.44 (1.10) Apr-10 Act 314.59 47.84 - 48.18 314.6 94.89 - - - - 14.94% 7.20 - (7.91) 14.18 - (14.56) - - - - - - 21.37 - (22.47) May-10 Act 242.21 37.38 - 48.18 242.2 115.07 - - - - 14.59% 7.03 - (14.94) 16.79 - (31.35) - - - - - - 23.82 - (46.29) Jun-10 Act 362.85 55.99 - 48.18 362.8 145.31 - - - - 14.59% 7.03 - (21.97) 21.20 - (52.55) - - - - - - 28.23 - (74.52) Jul-10 Act 405.54 62.58 - 48.18 405.5 179.10 - - - - 14.59% 7.03 - (28.99) 26.13 - (78.69) - - - - - - 33.16 - (107.68) Aug-10 Act 405.54 62.73 - 48.18 405.5 212.90 - - - - 14.59% 7.03 - (36.02) 31.06 - (109.75) - - - - - - 38.09 - (145.77) Sep-10 Act 455.65 70.60 - 48.18 455.6 250.87 - - - - 14.59% 7.03 - (43.05) 36.60 - (146.35) - - - - - - 43.63 - (189.40) Oct-10 Act 427.81 66.02 - 48.18 427.8 286.52 - - - - 14.59% 7.03 - (50.08) 41.80 - (188.15) - - - - - - 48.83 - (238.23) Nov-10 Act 461.22 71.17 - 48.18 461.2 324.95 - - - - 14.59% 7.03 - (57.11) 47.41 - (235.56) - - - - - - 54.44 - (292.67) Dec-10 Act 383.26 59.14 - 48.18 383.3 356.89 - - - - 14.59% 7.03 - (64.14) 52.07 - (287.63) - - - - - - 59.10 - (351.77) Jan-11 Act 299.74 46.25 - 48.18 - 356.89 299.7 24.98 - - 14.59% 7.03 - (71.17) 52.07 - (339.70) 3.64 - (3.64) - - - 62.74 - (414.52) Feb-11 Act 401.82 62.01 - 48.18 - 356.89 401.8 58.46 - - 14.59% 7.03 - (78.20) 52.07 - (391.78) 8.53 - (12.17) - - - 67.63 - (482.15) Mar-11 Act 432.45 66.73 - 48.18 - 356.89 432.4 94.50 - - 14.59% 7.03 85.23 - 52.07 443.85 - 13.79 25.96 - - - - 72.89 555.04 - Apr-11 Est 334.08 50.40 - 48.18 - 356.89 334.1 122.34 - - 14.59% - - - - - - - - - - - - - - - May-11 Est 350.78 52.92 - 48.18 - 356.89 350.8 151.57 - - 14.47% - - - - - - - - - - - - - - - Jun-11 Est 367.49 55.44 - 48.18 - 356.89 367.5 182.20 - - 14.47% - - - - - - - - - - - - - - - Jul-11 Est 334.08 50.40 - 48.18 - 356.89 334.1 210.04 - - 14.47% 6.97 - - 51.64 - - 30.39 - - - - - 89.01 - - Aug-11 Est 384.19 57.96 - 48.18 - 356.89 384.2 242.05 - - 14.47% 6.97 - - 51.64 - - 35.03 - - - - - 93.64 - - Sep-11 Est 350.78 52.92 - 48.18 - 356.89 350.8 271.29 - - 14.47% 6.97 - - 51.64 - - 39.25 - - - - - 97.87 - - Oct-11 Est 350.78 52.92 - 48.18 - 356.89 350.8 300.52 - - 14.47% 6.97 - - 51.64 - - 43.48 - - - - - 102.10 - - Nov-11 Est 334.08 50.40 - 48.18 - 356.89 334.1 328.36 - - 14.47% 6.97 - - 51.64 - - 47.51 - - - - - 106.13 - - Dec-11 Est 317.38 47.88 - 48.18 - 356.89 317.4 354.81 - - 14.47% 6.97 - - 51.64 - - 51.34 - - - - - 109.95 - - Jan-12 Est 334.08 50.40 - 48.18 - 356.89 - 354.81 334.1 27.84 14.47% 6.97 - - 51.64 - - 51.34 - - 4.03 - - 113.98 - - Feb-12 Est 334.08 50.40 - 48.18 - 356.89 - 354.81 334.1 55.68 14.47% 6.97 - - 51.64 - - 51.34 - - 8.06 - - 118.01 - - Mar-12 Est 384.19 57.96 - 48.18 - 356.89 - 354.81 384.2 87.70 14.47% 6.97 - - 51.64 - - 51.34 - - 12.69 - - 122.64 - - Apr-12 Est 334.08 50.40 - 48.18 - 356.89 - 354.81 334.1 115.54 14.47% 6.97 - - 51.64 - - 51.34 - - 16.72 - - 126.67 - - May-12 Est 350.78 52.92 - 48.18 - 356.89 - 354.81 350.8 144.77 14.47% 6.97 - - 51.64 - - 51.34 - - 20.95 - - 130.90 - - Jun-12 Est 367.49 55.44 - 48.18 - 356.89 - 354.81 367.5 175.39 14.47% 6.97 - - 51.64 - - 51.34 - - 25.38 - - 135.33 - - Jul-12 Est 334.08 50.40 - 48.18 - 356.89 - 354.81 334.1 203.23 - - - - - - - - - - - - - - - Aug-12 Est 384.19 57.96 - 48.18 - 356.89 - 354.81 384.2 235.25 - - - - - - - - - - - - - - - Sep-12 Est 350.78 52.92 - 48.18 - 356.89 - 354.81 350.8 264.48 - - - - - - - - - - - - - - - Oct-12 Est 350.78 52.92 - 37.74 - 356.89 - 354.81 350.8 293.71 - - - - - - - - - - - - - - - Nov-12 Est 334.08 50.40 - 2.55 - 356.89 - 354.81 334.1 321.55 - - - - - - - - - - - - - - - Dec-12 Est 317.38 47.88 - - - 356.89 - 354.81 317.4 348.00 - - - - - - - - - - - - - - - Jan-13 Est 334.08 50.40 - - - 335.24 - 354.81 - 348.00 - - - - - - - - - - - - - - - Feb-13 Est 334.08 50.40 - - - 310.88 - 354.81 - 348.00 - - - - - - - - - - - - - - - Mar-13 Est 384.19 57.96 - - - 288.22 - 354.81 - 348.00 - - - - - - - - - - - - - - - Apr-13 Est 334.08 50.40 - - - 262.01 - 354.81 - 348.00 - - - - - - - - - - - - - - - May-13 Est 350.78 52.92 - - - 241.82 - 354.81 - 348.00 - - - - - - - - - - - - - - - Jun-13 Est 367.49 55.44 - - - 211.58 - 354.81 - 348.00 - - - - - - - - - - - - - - - Jul-13 Est 334.08 50.40 - - - 177.79 - 354.81 - 348.00 - - - - - - - - - - - - - - - Aug-13 Est 384.19 57.96 - - - 143.99 - 354.81 - 348.00 - - - - - - - - - - - - - - - Sep-13 Est 350.78 52.92 - - - 106.02 - 354.81 - 348.00 - - - - - - - - - - - - - - - Oct-13 Est 350.78 52.92 - - - 70.37 - 354.81 - 348.00 - - - - - - - - - - - - - - - Nov-13 Est 334.08 50.40 - - - 31.94 - 354.81 - 348.00 - - - - - - - - - - - - - - - Dec-13 Est 317.38 47.88 - - - - - 354.81 - 348.00 - - - - - - - - - - - - - - - Jan-14 Est 334.08 50.40 - - - - - 329.83 - 348.00 - - - - - - - - - - - - - - - Feb-14 Est 334.08 50.40 - - - - - 296.34 - 348.00 - - - - - - - - - - - - - - - Mar-14 Est 384.19 57.96 - - - - - 260.30 - 348.00 - - - - - - - - - - - - - - - Apr-14 Est 334.08 50.40 - - - - - 232.46 - 348.00 - - - - - - - - - - - - - - - May-14 Est 350.78 52.92 - - - - - 203.23 - 348.00 - - - - - - - - - - - - - - - Jun-14 Est 367.49 55.44 - - - - - 172.61 - 348.00 - - - - - - - - - - - - - - - Jul-14 Est 334.08 50.40 - - - - - 144.77 - 348.00 - - - - - - - - - - - - - - - Aug-14 Est 384.19 57.96 - - - - - 112.75 - 348.00 - - - - - - - - - - - - - - - Sep-14 Est 350.78 52.92 - - - - - 83.52 - 348.00 - - - - - - - - - - - - - - - Oct-14 Est 350.78 52.92 - - - - - 54.29 - 348.00 - - - - - - - - - - - - - - - Nov-14 Est 334.08 50.40 - - - - - 26.45 - 348.00 - - - - - - - - - - - - - - - Dec-14 Est 317.38 47.88 - - - - - - - 348.00 - - - - - - - - - - - - - - - Jan-15 NA - - - - - - - 320.16 - - - - - - - - - - - - - - - Feb-15 NA - - - - - - - 292.32 - - - - - - - - - - - - - - - Mar-15 NA - - - - - - - 260.30 - - - - - - - - - - - - - - - Apr-15 NA - - - - - - - 232.46 - - - - - - - - - - - - - - - May-15 NA - - - - - - - 203.23 - - - - - - - - - - - - - - - Jun-15 NA - - - - - - - 172.61 - - - - - - - - - - - - - - - Jul-15 NA - - - - - - - 144.77 - - - - - - - - - - - - - - - Aug-15 NA - - - - - - - 112.75 - - - - - - - - - - - - - - - Sep-15 NA - - - - - - - 83.52 - - - - - - - - - - - - - - - Oct-15 NA - - - - - - - 54.29 - - - - - - - - - - - - - - - Nov-15 NA - - - - - - - 26.45 - - - - - - - - - - - - - - - Sum of Additions x 3 & Recoverable 1,734.43 1,734.43 12,848.16 12,848.16 12,772.99 12,772.99 12,528.00 12,528.00 Sum of Actuals 121.69 121.69 - 463.83 463.83 - 25.96 25.96 - - - - 611.48 611.48 -
2009
-191
-E
2010
-161
-E
2011
-XXX
-E
2011
-XXX
-E R
ate P
eriod
Vintage - 2009 (South Carolina) Vintage - 2010 (South Carolina) Vintage - 2011 (South Carolina) Vintage - 2012 (South Carolina)
Notes
Additions (W/P D-3A)Vintage - 2009 Vintage - 2010 Vintage - 2011 Vintage - 2012
Amounts Do Not Include Current Rate Period Amounts Do Not Include Current Rate Period Amounts Do Not Include Current Rate Period Amounts Do Not Include Current Rate Period Amounts Do Not Include Current Rate Period
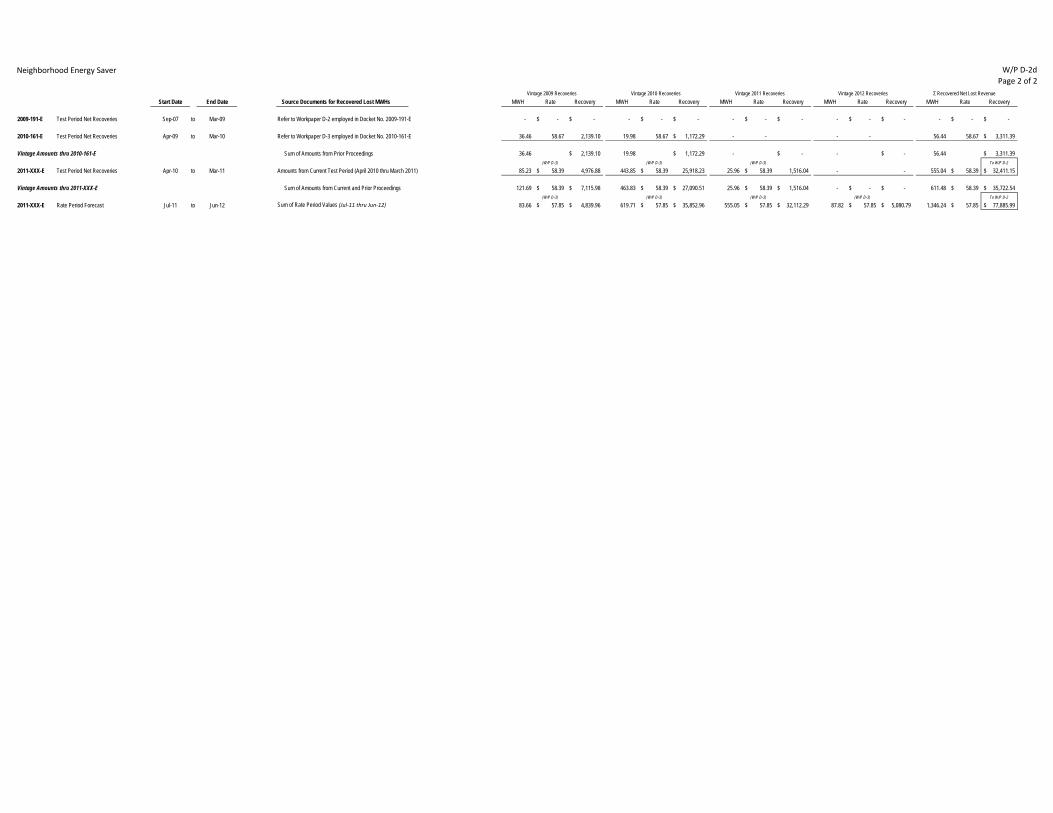
Neighborhood Energy Saver W/P D‐2dPage 2 of 2
Σ Recovered Net Lost RevenueStart Date End Date Source Documents for Recovered Lost MWHs MWH Rate Recovery MWH Rate Recovery MWH Rate Recovery MWH Rate Recovery MWH Rate Recovery
2009-191-E Test Period Net Recoveries Sep-07 to Mar-09 Refer to Workpaper D-2 employed in Docket No. 2009-191-E - -$ -$ - -$ -$ - -$ -$ - -$ -$ - -$ -$
2010-161-E Test Period Net Recoveries Apr-09 to Mar-10 Refer to Workpaper D-3 employed in Docket No. 2010-161-E 36.46 58.67 2,139.10 19.98 58.67 1,172.29$ - - - - 56.44 58.67 3,311.39$
Vintage Amounts thru 2010-161-E Sum of Amounts from Prior Proceedings 36.46 2,139.10$ 19.98 1,172.29$ - -$ - -$ 56.44 3,311.39$ (W/P D-3) (W/P D-3) (W/P D-3) To W/P D-2
2011-XXX-E Test Period Net Recoveries Apr-10 to Mar-11 Amounts from Current Test Period (April 2010 thru March 2011) 85.23 58.39$ 4,976.88 443.85 58.39$ 25,918.23 25.96 58.39$ 1,516.04 - - 555.04 58.39$ 32,411.15$
Vintage Amounts thru 2011-XXX-E Sum of Amounts from Current and Prior Proceedings 121.69 58.39$ 7,115.98$ 463.83 58.39$ 27,090.51$ 25.96 58.39$ 1,516.04$ - -$ -$ 611.48 58.39$ 35,722.54$ (W/P D-3) (W/P D-3) (W/P D-3) (W/P D-3) To W/P D-2
2011-XXX-E Rate Period Forecast Jul-11 to Jun-12 Sum of Rate Period Values (Jul‐11 thru Jun‐12) 83.66 57.85$ 4,839.96$ 619.71 57.85$ 35,852.96$ 555.05 57.85$ 32,112.29$ 87.82 57.85$ 5,080.79$ 1,346.24 57.85$ 77,885.99$
Vintage 2010 Recoveries Vintage 2011 Recoveries Vintage 2012 RecoveriesVintage 2009 Recoveries

Residential Appliance Recycling W/P D‐2ePage 1 of 2
Progress Energy Carolinas, Inc.Recoverable Sales Reductions from Energy Efficiency Programs (MWH): Residential Appliance Recycling Program
Σ All Vintages (South Carolina)Vintage MWH Recoverable Vintage MWH Recoverable Vintage MWH Recoverable Vintage MWH Recoverable Allocation Recoverable Recovered Over/(Under) Recoverable Recovered Over/(Under) Recoverable Recovered Over/(Under) Recoverable Recovered Over/(Under) Recoverable Recovered Over/(Under)
MWH kW Additions Losses Additions Losses Additions Losses Additions Losses Factor (SC) Losses Losses Σ Recovery Losses Losses Σ Recovery Losses Losses Σ Recovery Losses Losses Σ Recovery Losses Losses Σ RecoveryJan-09 NA - - - - - - - - - - 15.19% - - - - - - - - - - - - - - - Feb-09 NA - - - - - - - - - - 15.19% - - - - - - - - - - - - - - - Mar-09 NA - - - - - - - - - - 15.19% - - - - - - - - - - - - - - - Apr-09 NA - - - - - - - - - - 15.19% - - - - - - - - - - - - - - - May-09 NA - - - - - - - - - - 14.94% - - - - - - - - - - - - - - - Jun-09 NA - - - - - - - - - - 14.94% - - - - - - - - - - - - - - - Jul-09 NA - - - - - - - - - - 14.94% - - - - - - - - - - - - - - - Aug-09 NA - - - - - - - - - - 14.94% - - - - - - - - - - - - - - - Sep-09 NA - - - - - - - - - - 14.94% - - - - - - - - - - - - - - - Oct-09 NA - - - - - - - - - - 14.94% - - - - - - - - - - - - - - - Nov-09 NA - - - - - - - - - - 14.94% - - - - - - - - - - - - - - - Dec-09 NA - - - - - - - - - - 14.94% - - - - - - - - - - - - - - - Jan-10 NA - - - - - - - - - - 14.94% - - - - - - - - - - - - - - - Feb-10 NA - - - - - - - - - - 14.94% - - - - - - - - - - - - - - - Mar-10 NA - - - - - - - - - - 14.94% - - - - - - - - - - - - - - - Apr-10 Act 80.30 9.35 - - 80.3 6.69 - - - - 14.94% - - - 1.00 - (1.00) - - - - - - 1.00 - (1.00) May-10 Act 400.60 46.60 - - 400.6 40.07 - - - - 14.59% - - - 5.85 - (6.85) - - - - - - 5.85 - (6.85) Jun-10 Act 345.10 40.20 - - 345.1 68.83 - - - - 14.59% - - - 10.04 - (16.89) - - - - - - 10.04 - (16.89) Jul-10 Act 251.90 24.65 - - 251.9 89.82 - - - - 14.59% - - - 13.11 - (29.99) - - - - - - 13.11 - (29.99) Aug-10 Act 438.20 55.40 - - 438.2 126.34 - - - - 14.59% - - - 18.43 - (48.43) - - - - - - 18.43 - (48.43) Sep-10 Act 869.00 101.10 - - 869.0 198.76 - - - - 14.59% - - - 29.00 - (77.43) - - - - - - 29.00 - (77.43) Oct-10 Act 668.00 77.80 - - 668.0 254.42 - - - - 14.59% - - - 37.12 - (114.55) - - - - - - 37.12 - (114.55) Nov-10 Act 513.30 59.70 - - 513.3 297.20 - - - - 14.59% - - - 43.36 - (157.91) - - - - - - 43.36 - (157.91) Dec-10 Act 459.30 53.50 - - 459.3 335.47 - - - - 14.59% - - - 48.95 - (206.85) - - - - - - 48.95 - (206.85) Jan-11 Act 225.29 25.85 - - - 335.47 225.3 18.77 - - 14.59% - - - 48.95 - (255.80) 2.74 - (2.74) - - - 51.68 - (258.54) Feb-11 Act 268.00 31.10 - - - 335.47 268.0 41.11 - - 14.59% - - - 48.95 - (304.75) 6.00 - (8.74) - - - 54.94 - (313.48) Mar-11 Act 516.40 60.10 - - - 335.47 516.4 84.14 - - 14.59% - - - 48.95 353.69 - 12.28 21.01 - - - - 61.22 374.70 - Apr-11 Est 773.94 168.82 - - - 335.47 773.9 148.64 - - 14.59% - - - - - - - - - - - - - - - May-11 Est 619.17 135.06 - - - 335.47 619.2 200.23 - - 14.47% - - - - - - - - - - - - - - - Jun-11 Est 464.40 101.30 - - - 335.47 464.4 238.93 - - 14.47% - - - - - - - - - - - - - - - Jul-11 Est 495.30 108.04 - - - 335.47 495.3 280.21 - - 14.47% - - - 48.54 - - 40.55 - - - - - 89.09 - - Aug-11 Est 619.17 135.06 - - - 335.47 619.2 331.81 - - 14.47% - - - 48.54 - - 48.01 - - - - - 96.56 - - Sep-11 Est 773.94 168.82 - - - 335.47 773.9 396.30 - - 14.47% - - - 48.54 - - 57.34 - - - - - 105.89 - - Oct-11 Est 619.17 135.06 - - - 335.47 619.2 447.90 - - 14.47% - - - 48.54 - - 64.81 - - - - - 113.35 - - Nov-11 Est 464.40 101.30 - - - 335.47 464.4 486.60 - - 14.47% - - - 48.54 - - 70.41 - - - - - 118.95 - - Dec-11 Est 469.26 102.36 - - - 335.47 469.3 525.70 - - 14.47% - - - 48.54 - - 76.07 - - - - - 124.61 - - Jan-12 Est 281.32 61.37 - - - 335.47 - 525.70 281.3 23.44 14.47% - - - 48.54 - - 76.07 - - 3.39 - - 128.00 - - Feb-12 Est 338.80 73.90 - - - 335.47 - 525.70 338.8 51.68 14.47% - - - 48.54 - - 76.07 - - 7.48 - - 132.09 - - Mar-12 Est 759.27 165.62 - - - 335.47 - 525.70 759.3 114.95 14.47% - - - 48.54 - - 76.07 - - 16.63 - - 141.25 - - Apr-12 Est 948.84 206.97 - - - 335.47 - 525.70 948.8 194.02 14.47% - - - 48.54 - - 76.07 - - 28.07 - - 152.69 - - May-12 Est 759.27 165.62 - - - 335.47 - 525.70 759.3 257.29 14.47% - - - 48.54 - - 76.07 - - 37.23 - - 161.84 - - Jun-12 Est 569.71 124.27 - - - 335.47 - 525.70 569.7 304.77 14.47% - - - 48.54 - - 76.07 - - 44.10 - - 168.71 - - Jul-12 Est 607.02 132.41 - - - 335.47 - 525.70 607.0 355.35 - - - - - - - - - - - - - - - Aug-12 Est 759.27 165.62 - - - 335.47 - 525.70 759.3 418.63 - - - - - - - - - - - - - - - Sep-12 Est 948.84 206.97 - - - 335.47 - 525.70 948.8 497.70 - - - - - - - - - - - - - - - Oct-12 Est 759.27 165.62 - - - 335.47 - 525.70 759.3 560.97 - - - - - - - - - - - - - - - Nov-12 Est 569.71 124.27 - - - 335.47 - 525.70 569.7 608.44 - - - - - - - - - - - - - - - Dec-12 Est 574.75 125.37 - - - 335.47 - 525.70 574.7 656.34 - - - - - - - - - - - - - - - Jan-13 Est 334.74 73.02 - - - 335.47 - 525.70 - 656.34 - - - - - - - - - - - - - - - Feb-13 Est 403.12 87.93 - - - 335.47 - 525.70 - 656.34 - - - - - - - - - - - - - - - Mar-13 Est 903.43 197.06 - - - 335.47 - 525.70 - 656.34 - - - - - - - - - - - - - - - Apr-13 Est 1,128.98 246.27 - - - 328.78 - 525.70 - 656.34 - - - - - - - - - - - - - - - May-13 Est 903.43 197.06 - - - 295.40 - 525.70 - 656.34 - - - - - - - - - - - - - - - Jun-13 Est 677.87 147.86 - - - 266.64 - 525.70 - 656.34 - - - - - - - - - - - - - - - Jul-13 Est 722.26 157.55 - - - 245.65 - 525.70 - 656.34 - - - - - - - - - - - - - - - Aug-13 Est 903.43 197.06 - - - 209.13 - 525.70 - 656.34 - - - - - - - - - - - - - - - Sep-13 Est 1,128.98 246.27 - - - 136.72 - 525.70 - 656.34 - - - - - - - - - - - - - - - Oct-13 Est 903.43 197.06 - - - 81.05 - 525.70 - 656.34 - - - - - - - - - - - - - - - Nov-13 Est 677.87 147.86 - - - 38.28 - 525.70 - 656.34 - - - - - - - - - - - - - - - Dec-13 Est 683.87 149.17 - - - - - 525.70 - 656.34 - - - - - - - - - - - - - - - Jan-14 Est 390.98 85.29 - - - - - 506.93 - 656.34 - - - - - - - - - - - - - - - Feb-14 Est 470.86 102.71 - - - - - 484.60 - 656.34 - - - - - - - - - - - - - - - Mar-14 Est 1,055.23 230.18 - - - - - 441.56 - 656.34 - - - - - - - - - - - - - - - Apr-14 Est 1,318.69 287.65 - - - - - 377.07 - 656.34 - - - - - - - - - - - - - - - May-14 Est 1,055.23 230.18 - - - - - 325.47 - 656.34 - - - - - - - - - - - - - - - Jun-14 Est 791.77 172.71 - - - - - 286.77 - 656.34 - - - - - - - - - - - - - - - Jul-14 Est 843.62 184.02 - - - - - 245.49 - 656.34 - - - - - - - - - - - - - - - Aug-14 Est 1,055.23 230.18 - - - - - 193.90 - 656.34 - - - - - - - - - - - - - - - Sep-14 Est 1,318.69 287.65 - - - - - 129.40 - 656.34 - - - - - - - - - - - - - - - Oct-14 Est 1,055.23 230.18 - - - - - 77.80 - 656.34 - - - - - - - - - - - - - - - Nov-14 Est 791.77 172.71 - - - - - 39.10 - 656.34 - - - - - - - - - - - - - - - Dec-14 Est 798.78 174.24 - - - - - - - 656.34 - - - - - - - - - - - - - - - Jan-15 NA - - - - - - - 632.90 - - - - - - - - - - - - - - - Feb-15 NA - - - - - - - 604.66 - - - - - - - - - - - - - - - Mar-15 NA - - - - - - - 541.39 - - - - - - - - - - - - - - - Apr-15 NA - - - - - - - 462.32 - - - - - - - - - - - - - - - May-15 NA - - - - - - - 399.05 - - - - - - - - - - - - - - - Jun-15 NA - - - - - - - 351.57 - - - - - - - - - - - - - - - Jul-15 NA - - - - - - - 300.99 - - - - - - - - - - - - - - - Aug-15 NA - - - - - - - 237.71 - - - - - - - - - - - - - - - Sep-15 NA - - - - - - - 158.64 - - - - - - - - - - - - - - - Oct-15 NA - - - - - - - 95.37 - - - - - - - - - - - - - - - Nov-15 NA - - - - - - - 47.90 - - - - - - - - - - - - - - - Sum of Additions x 3 & Recoverable - - 12,077.10 12,077.10 18,925.30 18,925.30 23,628.24 23,628.24 Sum of Actuals - - - 353.69 353.69 - 21.01 21.01 - - - - 374.70 374.70 -
2009
-191
-E
2010
-161
-E
2011
-XXX
-E
2011
-XXX
-E R
ate P
eriod
Vintage - 2009 (South Carolina) Vintage - 2010 (South Carolina) Vintage - 2011 (South Carolina) Vintage - 2012 (South Carolina)
Notes
Additions (W/P D-3A)Vintage - 2009 Vintage - 2010 Vintage - 2011 Vintage - 2012
Amounts Do Not Include Current Rate Period Amounts Do Not Include Current Rate Period Amounts Do Not Include Current Rate Period Amounts Do Not Include Current Rate Period Amounts Do Not Include Current Rate Period

Residential Appliance Recycling W/P D‐2ePage 2 of 2
Σ Recovered Net Lost RevenueStart Date End Date Source Documents for Recovered Lost MWHs MWH Rate Recovery MWH Rate Recovery MWH Rate Recovery MWH Rate Recovery MWH Rate Recovery
2009-191-E Test Period Net Recoveries Sep-07 to Mar-09 Refer to Workpaper D-2 employed in Docket No. 2009-191-E - -$ -$ - -$ -$ - -$ -$ - -$ -$ - -$ -$
2010-161-E Test Period Net Recoveries Apr-09 to Mar-10 Refer to Workpaper D-3 employed in Docket No. 2010-161-E - -$ - - -$ -$ - - - - - -$ -$
Vintage Amounts thru 2010-161-E Sum of Amounts from Prior Proceedings - -$ - -$ - -$ - -$ - -$ (W/P D-3) (W/P D-3) To W/P D-2
2011-XXX-E Test Period Net Recoveries Apr-10 to Mar-11 Amounts from Current Test Period (April 2010 thru March 2011) - -$ - 353.69 58.39$ 20,653.70 21.01 58.39$ 1,227.04 - - 374.70 -$ 21,880.74$
Vintage Amounts thru 2011-XXX-E Sum of Amounts from Current and Prior Proceedings - -$ -$ 353.69 58.39$ 20,653.70$ 21.01 58.39$ 1,227.04$ - -$ -$ 374.70 -$ 21,880.74$ (W/P D-3) (W/P D-3) (W/P D-3) To W/P D-2
2011-XXX-E Rate Period Forecast Jul-11 to Jun-12 Sum of Rate Period Values (Jul‐11 thru Jun‐12) - -$ -$ 582.52 57.85$ 33,701.29$ 813.61 57.85$ 47,070.91$ 136.91 57.85$ 7,920.74$ 1,533.04 57.85$ 88,692.94$
Vintage 2010 Recoveries Vintage 2011 Recoveries Vintage 2012 RecoveriesVintage 2009 Recoveries

Residential Benchmarking W/P D‐2fPage 1 of 2
Progress Energy Carolinas, Inc.Recoverable Sales Reductions from Energy Efficiency Programs (MWH): Residential Benchmarking Program
Σ All Vintages (South Carolina)Vintage MWH Recoverable Vintage MWH Recoverable Vintage MWH Recoverable Vintage MWH Recoverable Allocation Recoverable Recovered Over/(Under) Recoverable Recovered Over/(Under) Recoverable Recovered Over/(Under) Recoverable Recovered Over/(Under) Recoverable Recovered Over/(Under)
MWH kW Additions Losses Additions Losses Additions Losses Additions Losses Factor (SC) Losses Losses Σ Recovery Losses Losses Σ Recovery Losses Losses Σ Recovery Losses Losses Σ Recovery Losses Losses Σ RecoveryJan-09 NA - - - - - - - - - - 15.19% - - - - - - - - - - - - - - - Feb-09 NA - - - - - - - - - - 15.19% - - - - - - - - - - - - - - - Mar-09 NA - - - - - - - - - - 15.19% - - - - - - - - - - - - - - - Apr-09 NA - - - - - - - - - - 15.19% - - - - - - - - - - - - - - - May-09 NA - - - - - - - - - - 14.94% - - - - - - - - - - - - - - - Jun-09 NA - - - - - - - - - - 14.94% - - - - - - - - - - - - - - - Jul-09 NA - - - - - - - - - - 14.94% - - - - - - - - - - - - - - - Aug-09 NA - - - - - - - - - - 14.94% - - - - - - - - - - - - - - - Sep-09 NA - - - - - - - - - - 14.94% - - - - - - - - - - - - - - - Oct-09 NA - - - - - - - - - - 14.94% - - - - - - - - - - - - - - - Nov-09 NA - - - - - - - - - - 14.94% - - - - - - - - - - - - - - - Dec-09 NA - - - - - - - - - - 14.94% - - - - - - - - - - - - - - - Jan-10 NA - - - - - - - - - - 14.94% - - - - - - - - - - - - - - - Feb-10 NA - - - - - - - - - - 14.94% - - - - - - - - - - - - - - - Mar-10 NA - - - - - - - - - - 14.94% - - - - - - - - - - - - - - - Apr-10 NA - - - - - - - - - - 14.94% - - - - - - - - - - - - - - - May-10 NA - - - - - - - - - - 14.59% - - - - - - - - - - - - - - - Jun-10 NA - - - - - - - - - - 14.59% - - - - - - - - - - - - - - - Jul-10 NA - - - - - - - - - - 14.59% - - - - - - - - - - - - - - - Aug-10 NA - - - - - - - - - - 14.59% - - - - - - - - - - - - - - - Sep-10 NA - - - - - - - - - - 14.59% - - - - - - - - - - - - - - - Oct-10 NA - - - - - - - - - - 14.59% - - - - - - - - - - - - - - - Nov-10 NA - - - - - - - - - - 14.59% - - - - - - - - - - - - - - - Dec-10 NA - - - - - - - - - - 14.59% - - - - - - - - - - - - - - - Jan-11 NA - - - - - - - - - - 14.59% - - - - - - - - - - - - - - - Feb-11 NA - - - - - - - - - - 14.59% - - - - - - - - - - - - - - - Mar-11 NA - - - - - - - - - - 14.59% - - - - - - - - - - - - - - - Apr-11 NA - - - - - - - - - - 14.59% - - - - - - - - - - - - - - - May-11 NA - - - - - - - - - - 14.47% - - - - - - - - - - - - - - - Jun-11 Est 14,400.00 2,585.00 - - - - 14,400.0 1,200.00 - - 14.47% - - - - - - - - - - - - - - - Jul-11 Est - - - - - - - 1,200.00 - - 14.47% - - - - - - 173.64 - - - - - 173.64 - - Aug-11 Est - - - - - - - 1,200.00 - - 14.47% - - - - - - 173.64 - - - - - 173.64 - - Sep-11 Est - - - - - - - 1,200.00 - - 14.47% - - - - - - 173.64 - - - - - 173.64 - - Oct-11 Est - - - - - - - 1,200.00 - - 14.47% - - - - - - 173.64 - - - - - 173.64 - - Nov-11 Est - - - - - - - 1,200.00 - - 14.47% - - - - - - 173.64 - - - - - 173.64 - - Dec-11 Est - - - - - - - 1,200.00 - - 14.47% - - - - - - 173.64 - - - - - 173.64 - - Jan-12 Est - - - - - - - 1,200.00 - - 14.47% - - - - - - 173.64 - - - - - 173.64 - - Feb-12 Est - - - - - - - 1,200.00 - - 14.47% - - - - - - 173.64 - - - - - 173.64 - - Mar-12 Est - - - - - - - 1,200.00 - - 14.47% - - - - - - 173.64 - - - - - 173.64 - - Apr-12 Est - - - - - - - 1,200.00 - - 14.47% - - - - - - 173.64 - - - - - 173.64 - - May-12 Est - - - - - - - 1,200.00 - - 14.47% - - - - - - 173.64 - - - - - 173.64 - - Jun-12 Est 14,400.00 2,585.00 - - - - - - 14,400.0 1,200.00 14.47% - - - - - - - - - 173.64 - - 173.64 - - Jul-12 Est - - - - - - - - - 1,200.00 - - - - - - - - - - - - - - - Aug-12 Est - - - - - - - - - 1,200.00 - - - - - - - - - - - - - - - Sep-12 Est - - - - - - - - - 1,200.00 - - - - - - - - - - - - - - - Oct-12 Est - - - - - - - - - 1,200.00 - - - - - - - - - - - - - - - Nov-12 Est - - - - - - - - - 1,200.00 - - - - - - - - - - - - - - - Dec-12 Est - - - - - - - - - 1,200.00 - - - - - - - - - - - - - - - Jan-13 Est - - - - - - - - - 1,200.00 - - - - - - - - - - - - - - - Feb-13 Est - - - - - - - - - 1,200.00 - - - - - - - - - - - - - - - Mar-13 Est - - - - - - - - - 1,200.00 - - - - - - - - - - - - - - - Apr-13 Est - - - - - - - - - 1,200.00 - - - - - - - - - - - - - - - May-13 Est - - - - - - - - - 1,200.00 - - - - - - - - - - - - - - - Jun-13 Est 11,520.00 2,068.00 - - - - - - - - - - - - - - - - - - - - - - - Jul-13 Est - - - - - - - - - - - - - - - - - - - - - - - - - Aug-13 Est - - - - - - - - - - - - - - - - - - - - - - - - - Sep-13 Est - - - - - - - - - - - - - - - - - - - - - - - - - Oct-13 Est - - - - - - - - - - - - - - - - - - - - - - - - - Nov-13 Est - - - - - - - - - - - - - - - - - - - - - - - - - Dec-13 Est - - - - - - - - - - - - - - - - - - - - - - - - - Jan-14 Est - - - - - - - - - - - - - - - - - - - - - - - - - Feb-14 Est - - - - - - - - - - - - - - - - - - - - - - - - - Mar-14 Est - - - - - - - - - - - - - - - - - - - - - - - - - Apr-14 Est - - - - - - - - - - - - - - - - - - - - - - - - - May-14 Est - - - - - - - - - - - - - - - - - - - - - - - - - Jun-14 Est 14,400.00 2,585.00 - - - - - - - - - - - - - - - - - - - - - - - Jul-14 Est - - - - - - - - - - - - - - - - - - - - - - - - - Aug-14 Est - - - - - - - - - - - - - - - - - - - - - - - - - Sep-14 Est - - - - - - - - - - - - - - - - - - - - - - - - - Oct-14 Est - - - - - - - - - - - - - - - - - - - - - - - - - Nov-14 Est - - - - - - - - - - - - - - - - - - - - - - - - - Dec-14 Est - - - - - - - - - - - - - - - - - - - - - - - - - Jan-15 NA - - - - - - - - - - - - - - - - - - - - - - - Feb-15 NA - - - - - - - - - - - - - - - - - - - - - - - Mar-15 NA - - - - - - - - - - - - - - - - - - - - - - - Apr-15 NA - - - - - - - - - - - - - - - - - - - - - - - May-15 NA - - - - - - - - - - - - - - - - - - - - - - - Jun-15 NA - - - - - - - - - - - - - - - - - - - - - - - Jul-15 NA - - - - - - - - - - - - - - - - - - - - - - - Aug-15 NA - - - - - - - - - - - - - - - - - - - - - - - Sep-15 NA - - - - - - - - - - - - - - - - - - - - - - - Oct-15 NA - - - - - - - - - - - - - - - - - - - - - - - Nov-15 NA - - - - - - - - - - - - - - - - - - - - - - - Sum of Additions & Recoverable - - - - 14,400.00 14,400.00 14,400.00 14,400.00 Sum of Actuals - - - - - - - - - - - - - - -
Amounts Do Not Include Current Rate Period Amounts Do Not Include Current Rate Period Amounts Do Not Include Current Rate Period Amounts Do Not Include Current Rate Period Amounts Do Not Include Current Rate Period
2009
-191
-E
2010
-161
-E
2011
-XXX
-E
2011
-XXX
-E R
ate P
eriod
Vintage - 2009 (South Carolina) Vintage - 2010 (South Carolina) Vintage - 2011 (South Carolina) Vintage - 2012 (South Carolina)
Notes
Additions (W/P D-3A)Vintage - 2009 Vintage - 2010 Vintage - 2011 Vintage - 2012
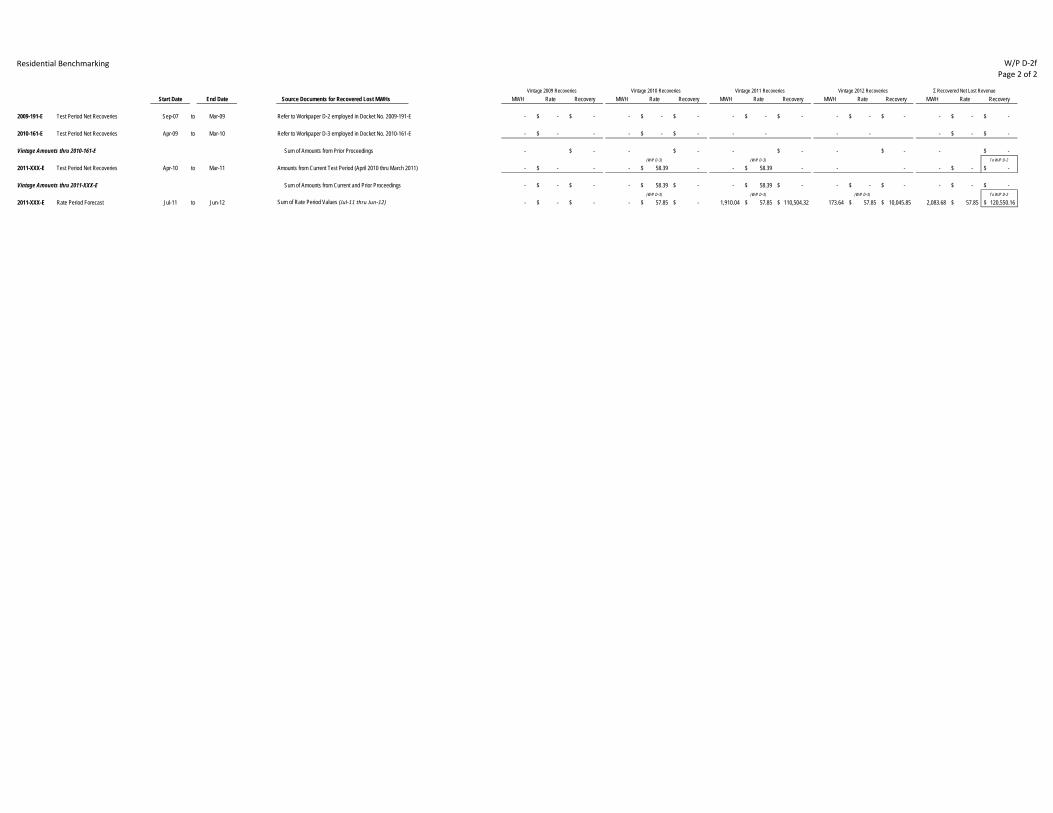
Residential Benchmarking W/P D‐2fPage 2 of 2
Σ Recovered Net Lost RevenueStart Date End Date Source Documents for Recovered Lost MWHs MWH Rate Recovery MWH Rate Recovery MWH Rate Recovery MWH Rate Recovery MWH Rate Recovery
2009-191-E Test Period Net Recoveries Sep-07 to Mar-09 Refer to Workpaper D-2 employed in Docket No. 2009-191-E - -$ -$ - -$ -$ - -$ -$ - -$ -$ - -$ -$
2010-161-E Test Period Net Recoveries Apr-09 to Mar-10 Refer to Workpaper D-3 employed in Docket No. 2010-161-E - -$ - - -$ -$ - - - - - -$ -$
Vintage Amounts thru 2010-161-E Sum of Amounts from Prior Proceedings - -$ - -$ - -$ - -$ - -$ (W/P D-3) (W/P D-3) To W/P D-2
2011-XXX-E Test Period Net Recoveries Apr-10 to Mar-11 Amounts from Current Test Period (April 2010 thru March 2011) - -$ - - 58.39$ - - 58.39$ - - - - -$ -$
Vintage Amounts thru 2011-XXX-E Sum of Amounts from Current and Prior Proceedings - -$ -$ - 58.39$ -$ - 58.39$ -$ - -$ -$ - -$ -$ (W/P D-3) (W/P D-3) (W/P D-3) To W/P D-2
2011-XXX-E Rate Period Forecast Jul-11 to Jun-12 Sum of Rate Period Values (Jul‐11 thru Jun‐12) - -$ -$ - 57.85$ -$ 1,910.04 57.85$ 110,504.32$ 173.64 57.85$ 10,045.85$ 2,083.68 57.85$ 120,550.16$
Vintage 2009 Recoveries Vintage 2010 Recoveries Vintage 2011 Recoveries Vintage 2012 Recoveries
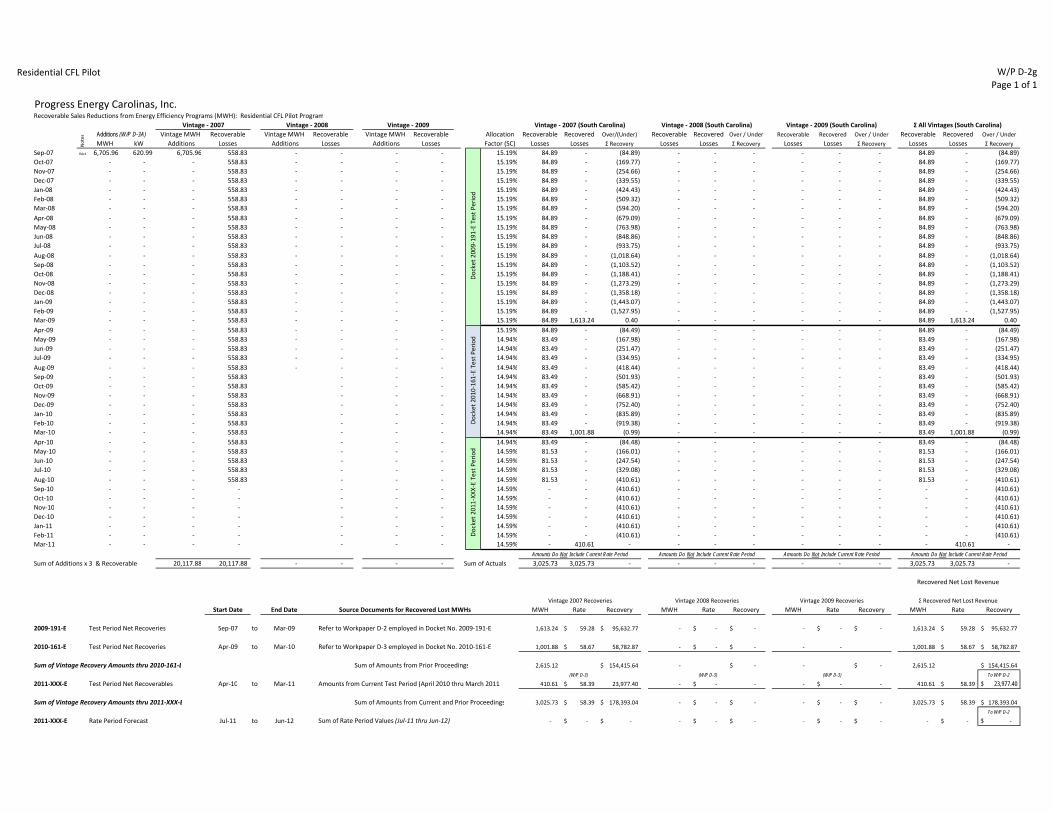
Residential CFL Pilot W/P D‐2gPage 1 of 1
Progress Energy Carolinas, Inc.Recoverable Sales Reductions from Energy Efficiency Programs (MWH): Residential CFL Pilot Program
Σ All Vintages (South Carolina)Vintage MWH Recoverable Vintage MWH Recoverable Vintage MWH Recoverable Allocation Recoverable Recovered Over/(Under) Recoverable Recovered Over / Under Recoverable Recovered Over / Under Recoverable Recovered Over / Under
MWH kW Additions Losses Additions Losses Additions Losses Factor (SC) Losses Losses Σ Recovery Losses Losses Σ Recovery Losses Losses Σ Recovery Losses Losses Σ Recovery
Sep‐07 VAct 6,705.96 620.99 6,705.96 558.83 ‐ ‐ ‐ ‐ 15.19% 84.89 ‐ (84.89) ‐ ‐ ‐ ‐ ‐ ‐ 84.89 ‐ (84.89) Oct‐07 ‐ ‐ ‐ 558.83 ‐ ‐ ‐ ‐ 15.19% 84.89 ‐ (169.77) ‐ ‐ ‐ ‐ ‐ ‐ 84.89 ‐ (169.77) Nov‐07 ‐ ‐ ‐ 558.83 ‐ ‐ ‐ ‐ 15.19% 84.89 ‐ (254.66) ‐ ‐ ‐ ‐ ‐ ‐ 84.89 ‐ (254.66) Dec‐07 ‐ ‐ ‐ 558.83 ‐ ‐ ‐ ‐ 15.19% 84.89 ‐ (339.55) ‐ ‐ ‐ ‐ ‐ ‐ 84.89 ‐ (339.55) Jan‐08 ‐ ‐ ‐ 558.83 ‐ ‐ ‐ ‐ 15.19% 84.89 ‐ (424.43) ‐ ‐ ‐ ‐ ‐ ‐ 84.89 ‐ (424.43) Feb‐08 ‐ ‐ ‐ 558.83 ‐ ‐ ‐ ‐ 15.19% 84.89 ‐ (509.32) ‐ ‐ ‐ ‐ ‐ ‐ 84.89 ‐ (509.32) Mar‐08 ‐ ‐ ‐ 558.83 ‐ ‐ ‐ ‐ 15.19% 84.89 ‐ (594.20) ‐ ‐ ‐ ‐ ‐ ‐ 84.89 ‐ (594.20) Apr‐08 ‐ ‐ ‐ 558.83 ‐ ‐ ‐ ‐ 15.19% 84.89 ‐ (679.09) ‐ ‐ ‐ ‐ ‐ ‐ 84.89 ‐ (679.09) May‐08 ‐ ‐ ‐ 558.83 ‐ ‐ ‐ ‐ 15.19% 84.89 ‐ (763.98) ‐ ‐ ‐ ‐ ‐ ‐ 84.89 ‐ (763.98) Jun‐08 ‐ ‐ ‐ 558.83 ‐ ‐ ‐ ‐ 15.19% 84.89 ‐ (848.86) ‐ ‐ ‐ ‐ ‐ ‐ 84.89 ‐ (848.86) Jul‐08 ‐ ‐ ‐ 558.83 ‐ ‐ ‐ ‐ 15.19% 84.89 ‐ (933.75) ‐ ‐ ‐ ‐ ‐ ‐ 84.89 ‐ (933.75) Aug‐08 ‐ ‐ ‐ 558.83 ‐ ‐ ‐ ‐ 15.19% 84.89 ‐ (1,018.64) ‐ ‐ ‐ ‐ ‐ ‐ 84.89 ‐ (1,018.64) Sep‐08 ‐ ‐ ‐ 558.83 ‐ ‐ ‐ ‐ 15.19% 84.89 ‐ (1,103.52) ‐ ‐ ‐ ‐ ‐ ‐ 84.89 ‐ (1,103.52) Oct‐08 ‐ ‐ ‐ 558.83 ‐ ‐ ‐ ‐ 15.19% 84.89 ‐ (1,188.41) ‐ ‐ ‐ ‐ ‐ ‐ 84.89 ‐ (1,188.41) Nov‐08 ‐ ‐ ‐ 558.83 ‐ ‐ ‐ ‐ 15.19% 84.89 ‐ (1,273.29) ‐ ‐ ‐ ‐ ‐ ‐ 84.89 ‐ (1,273.29) Dec‐08 ‐ ‐ ‐ 558.83 ‐ ‐ ‐ ‐ 15.19% 84.89 ‐ (1,358.18) ‐ ‐ ‐ ‐ ‐ ‐ 84.89 ‐ (1,358.18) Jan‐09 ‐ ‐ ‐ 558.83 ‐ ‐ ‐ ‐ 15.19% 84.89 ‐ (1,443.07) ‐ ‐ ‐ ‐ ‐ ‐ 84.89 ‐ (1,443.07) Feb‐09 ‐ ‐ ‐ 558.83 ‐ ‐ ‐ ‐ 15.19% 84.89 ‐ (1,527.95) ‐ ‐ ‐ ‐ ‐ ‐ 84.89 ‐ (1,527.95) Mar‐09 ‐ ‐ ‐ 558.83 ‐ ‐ ‐ ‐ 15.19% 84.89 1,613.24 0.40 ‐ ‐ ‐ ‐ ‐ ‐ 84.89 1,613.24 0.40 Apr‐09 ‐ ‐ ‐ 558.83 ‐ ‐ ‐ ‐ 15.19% 84.89 ‐ (84.49) ‐ ‐ ‐ ‐ ‐ ‐ 84.89 ‐ (84.49) May‐09 ‐ ‐ ‐ 558.83 ‐ ‐ ‐ ‐ 14.94% 83.49 ‐ (167.98) ‐ ‐ ‐ ‐ ‐ ‐ 83.49 ‐ (167.98) Jun‐09 ‐ ‐ ‐ 558.83 ‐ ‐ ‐ ‐ 14.94% 83.49 ‐ (251.47) ‐ ‐ ‐ ‐ ‐ ‐ 83.49 ‐ (251.47) Jul‐09 ‐ ‐ ‐ 558.83 ‐ ‐ ‐ ‐ 14.94% 83.49 ‐ (334.95) ‐ ‐ ‐ ‐ ‐ ‐ 83.49 ‐ (334.95) Aug‐09 ‐ ‐ ‐ 558.83 ‐ ‐ ‐ ‐ 14.94% 83.49 ‐ (418.44) ‐ ‐ ‐ ‐ ‐ ‐ 83.49 ‐ (418.44) Sep‐09 ‐ ‐ ‐ 558.83 ‐ ‐ ‐ 14.94% 83.49 ‐ (501.93) ‐ ‐ ‐ ‐ ‐ ‐ 83.49 ‐ (501.93) Oct‐09 ‐ ‐ ‐ 558.83 ‐ ‐ ‐ 14.94% 83.49 ‐ (585.42) ‐ ‐ ‐ ‐ ‐ ‐ 83.49 ‐ (585.42) Nov‐09 ‐ ‐ ‐ 558.83 ‐ ‐ ‐ 14.94% 83.49 ‐ (668.91) ‐ ‐ ‐ ‐ ‐ ‐ 83.49 ‐ (668.91) Dec‐09 ‐ ‐ ‐ 558.83 ‐ ‐ ‐ 14.94% 83.49 ‐ (752.40) ‐ ‐ ‐ ‐ ‐ ‐ 83.49 ‐ (752.40) Jan‐10 ‐ ‐ ‐ 558.83 ‐ ‐ ‐ 14.94% 83.49 ‐ (835.89) ‐ ‐ ‐ ‐ ‐ ‐ 83.49 ‐ (835.89) Feb‐10 ‐ ‐ ‐ 558.83 ‐ ‐ ‐ 14.94% 83.49 ‐ (919.38) ‐ ‐ ‐ ‐ ‐ ‐ 83.49 ‐ (919.38) Mar‐10 ‐ ‐ ‐ 558.83 ‐ ‐ ‐ 14.94% 83.49 1,001.88 (0.99) ‐ ‐ ‐ ‐ ‐ ‐ 83.49 1,001.88 (0.99) Apr‐10 ‐ ‐ ‐ 558.83 ‐ ‐ ‐ 14.94% 83.49 ‐ (84.48) ‐ ‐ ‐ ‐ ‐ ‐ 83.49 ‐ (84.48) May‐10 ‐ ‐ ‐ 558.83 ‐ ‐ ‐ 14.59% 81.53 ‐ (166.01) ‐ ‐ ‐ ‐ ‐ ‐ 81.53 ‐ (166.01) Jun‐10 ‐ ‐ ‐ 558.83 ‐ ‐ ‐ 14.59% 81.53 ‐ (247.54) ‐ ‐ ‐ ‐ ‐ ‐ 81.53 ‐ (247.54) Jul‐10 ‐ ‐ ‐ 558.83 ‐ ‐ ‐ 14.59% 81.53 ‐ (329.08) ‐ ‐ ‐ ‐ ‐ ‐ 81.53 ‐ (329.08) Aug‐10 ‐ ‐ ‐ 558.83 ‐ ‐ ‐ 14.59% 81.53 ‐ (410.61) ‐ ‐ ‐ ‐ ‐ ‐ 81.53 ‐ (410.61) Sep‐10 ‐ ‐ ‐ ‐ ‐ ‐ ‐ 14.59% ‐ ‐ (410.61) ‐ ‐ ‐ ‐ ‐ ‐ ‐ ‐ (410.61) Oct‐10 ‐ ‐ ‐ ‐ ‐ ‐ ‐ 14.59% ‐ ‐ (410.61) ‐ ‐ ‐ ‐ ‐ ‐ ‐ ‐ (410.61) Nov‐10 ‐ ‐ ‐ ‐ ‐ ‐ ‐ 14.59% ‐ ‐ (410.61) ‐ ‐ ‐ ‐ ‐ ‐ ‐ ‐ (410.61) Dec‐10 ‐ ‐ ‐ ‐ ‐ ‐ ‐ 14.59% ‐ ‐ (410.61) ‐ ‐ ‐ ‐ ‐ ‐ ‐ ‐ (410.61) Jan‐11 ‐ ‐ ‐ ‐ ‐ ‐ ‐ 14.59% ‐ ‐ (410.61) ‐ ‐ ‐ ‐ ‐ ‐ ‐ ‐ (410.61) Feb‐11 ‐ ‐ ‐ ‐ ‐ ‐ ‐ 14.59% ‐ ‐ (410.61) ‐ ‐ ‐ ‐ ‐ ‐ ‐ ‐ (410.61) Mar‐11 ‐ ‐ ‐ ‐ ‐ ‐ ‐ 14.59% ‐ 410.61 ‐ ‐ ‐ ‐ ‐ ‐ ‐ ‐ 410.61 ‐
Sum of Additions x 3 & Recoverable 20,117.88 20,117.88 ‐ ‐ ‐ ‐ Sum of Actuals 3,025.73 3,025.73 ‐ ‐ ‐ ‐ ‐ ‐ ‐ 3,025.73 3,025.73 ‐
Recovered Net Lost Revenue
Σ Recovered Net Lost Revenue
Start Date End Date Source Documents for Recovered Lost MWHs MWH Rate Recovery MWH Rate Recovery MWH Rate Recovery MWH Rate Recovery
2009‐191‐E Test Period Net Recoveries Sep‐07 to Mar‐09 Refer to Workpaper D‐2 employed in Docket No. 2009‐191‐E 1,613.24 59.28$ 95,632.77$ ‐ ‐$ ‐$ ‐ ‐$ ‐$ 1,613.24 59.28$ 95,632.77$
2010‐161‐E Test Period Net Recoveries Apr‐09 to Mar‐10 Refer to Workpaper D‐3 employed in Docket No. 2010‐161‐E 1,001.88 58.67$ 58,782.87 ‐ ‐$ ‐$ ‐ ‐ 1,001.88 58.67$ 58,782.87$
Sum of Vintage Recovery Amounts thru 2010‐161‐E Sum of Amounts from Prior Proceedings 2,615.12 154,415.64$ ‐ ‐$ ‐ ‐$ 2,615.12 154,415.64$
(W/P D-3) (W/P D-3) (W/P D-3) To W/P D-2
2011‐XXX‐E Test Period Net Recoverables Apr‐10 to Mar‐11 Amounts from Current Test Period (April 2010 thru March 2011) 410.61 58.39$ 23,977.40 ‐ ‐$ ‐ ‐ ‐$ ‐ 410.61 58.39$ 23,977.40$
Sum of Vintage Recovery Amounts thru 2011‐XXX‐E Sum of Amounts from Current and Prior Proceedings 3,025.73 58.39$ 178,393.04$ ‐ ‐$ ‐$ ‐ ‐$ ‐$ 3,025.73 58.39$ 178,393.04$
To W/P D-2
2011‐XXX‐E Rate Period Forecast Jul‐11 to Jun‐12 Sum of Rate Period Values (Jul‐11 thru Jun‐12) ‐ ‐$ ‐$ ‐ ‐$ ‐$ ‐ ‐$ ‐$ ‐ ‐$ -$
Notes
Docket 2
011‐XX
X‐E Test Period
Docket 2
009‐191‐E Test Period
Docket 2
010‐161‐E Test Period
Additions (W/P D-3A)Vintage ‐ 2007 Vintage ‐ 2008 Vintage ‐ 2009
Amounts Do Not Include Current Rate Period
Vintage 2007 Recoveries Vintage 2008 Recoveries Vintage 2009 Recoveries
Amounts Do Not Include Current Rate Period Amounts Do Not Include Current Rate Period Amounts Do Not Include Current Rate Period
Vintage ‐ 2007 (South Carolina) Vintage ‐ 2008 (South Carolina) Vintage ‐ 2009 (South Carolina)

CIG Energy Efficiency Program W/P D-2h
Page 1 of 2
Progress Energy Carolinas, Inc.Recoverable Sales Reductions from Energy Efficiency Programs (MWH): CIG Energy Efficiency Program
Σ All Vintages (South Carolina)
Vintage MWH Recoverable Vintage MWH Recoverable Vintage MWH Recoverable Vintage MWH Recoverable Allocation Recoverable Recovered Over/(Under) Recoverable Recovered Over/(Under) Recoverable Recovered Over/(Under) Recoverable Recovered Over/(Under) Recoverable Recovered Over/(Under)
MWH kW Additions Losses Additions Losses Additions Losses Additions Losses Factor (SC) Losses Losses Σ Recovery Losses Losses Σ Recovery Losses Losses Σ Recovery Losses Losses Σ Recovery Losses Losses Σ Recovery
Jan-09 Act - - - - - - - - - - 15.19% - - - - - - - - - - - - - - -
Feb-09 Act - - - - - - - - - - 15.19% - - - - - - - - - - - - - - -
Mar-09 Act - - - - - - - - - - 15.19% - - - - - - - - - - - - - - -
Apr-09 Act 765.41 176.75 765.4 63.78 - - - - - - 15.19% 9.69 - (9.69) - - - - - - - - - 9.69 - (9.69)
May-09 Act 930.85 215.93 930.9 141.36 - - - - - - 14.94% 21.12 - (30.81) - - - - - - - - - 21.12 - (30.81)
Jun-09 Act 765.24 244.29 765.2 205.13 - - - - - - 14.94% 30.65 - (61.45) - - - - - - - - - 30.65 - (61.45)
Jul-09 Act 2,335.85 487.46 2,335.8 399.78 - - - - - - 14.94% 59.73 - (121.18) - - - - - - - - - 59.73 - (121.18)
Aug-09 Act 1,384.46 392.71 1,384.5 515.15 - - - - - - 14.94% 76.96 - (198.14) - - - - - - - - - 76.96 - (198.14)
Sep-09 Act 2,518.43 437.41 2,518.4 725.02 - - - - - - 14.94% 108.32 - (306.46) - - - - - - - - - 108.32 - (306.46)
Oct-09 Act 2,885.65 514.72 2,885.6 965.49 - - - - - - 14.94% 144.24 - (450.71) - - - - - - - - - 144.24 - (450.71)
Nov-09 Act 1,762.22 397.79 1,762.2 1,112.34 - - - - - - 14.94% 166.18 - (616.89) - - - - - - - - - 166.18 - (616.89)
Dec-09 Act 214.02 49.20 214.0 1,130.18 - - - - - - 14.94% 168.85 - (785.74) - - - - - - - - - 168.85 - (785.74)
Jan-10 Act 3,748.99 739.20 - 1,130.18 3,749.0 312.42 - - - - 14.94% 168.85 - (954.59) 46.67 - (46.67) - - - - - - 215.52 - (1,001.26)
Feb-10 Act 2,338.15 473.65 - 1,130.18 2,338.2 507.26 - - - - 14.94% 168.85 - (1,123.44) 75.78 - (122.46) - - - - - - 244.63 - (1,245.89)
Mar-10 Act 3,635.66 831.98 - 1,130.18 3,635.7 810.23 - - - - 14.94% 168.85 1,272.41 (19.88) 121.05 239.76 (3.75) - - - - - - 289.90 1,512.17 (23.62)
Apr-10 Act 2,768.84 489.17 - 1,130.18 2,768.8 1,040.97 - - - - 14.94% 168.85 - (188.73) 155.52 - (159.27) - - - - - - 324.37 - (347.99)
May-10 Act 2,715.74 697.69 - 1,130.18 2,715.7 1,267.28 - - - - 14.59% 164.89 - (353.62) 184.90 - (344.16) - - - - - - 349.79 - (697.78)
Jun-10 Act 1,448.30 372.82 - 1,130.18 1,448.3 1,387.97 - - - - 14.59% 164.89 - (518.51) 202.51 - (546.67) - - - - - - 367.40 - (1,065.18)
Jul-10 Act 1,984.80 492.79 - 1,130.18 1,984.8 1,553.37 - - - - 14.59% 164.89 - (683.40) 226.64 - (773.31) - - - - - - 391.53 - (1,456.71)
Aug-10 Act 3,403.55 670.44 - 1,130.18 3,403.6 1,837.00 - - - - 14.59% 164.89 - (848.30) 268.02 - (1,041.32) - - - - - - 432.91 - (1,889.62)
Sep-10 Act 1,418.18 234.79 - 1,130.18 1,418.2 1,955.18 - - - - 14.59% 164.89 - (1,013.19) 285.26 - (1,326.59) - - - - - - 450.15 - (2,339.77)
Oct-10 Act 4,072.63 713.23 - 1,130.18 4,072.6 2,294.57 - - - - 14.59% 164.89 - (1,178.08) 334.78 - (1,661.36) - - - - - - 499.67 - (2,839.45)
Nov-10 Act 3,346.24 780.19 - 1,130.18 3,346.2 2,573.42 - - - - 14.59% 164.89 - (1,342.98) 375.46 - (2,036.83) - - - - - - 540.36 - (3,379.80)
Dec-10 Act 1,877.12 255.44 - 1,130.18 1,877.1 2,729.85 - - - - 14.59% 164.89 - (1,507.87) 398.29 - (2,435.11) - - - - - - 563.18 - (3,942.98)
Jan-11 Act 3,069.00 749.00 - 1,130.18 - 2,729.85 3,069.0 255.75 - - 14.59% 164.89 - (1,672.76) 398.29 - (2,833.40) 37.31 - (37.31) - - - 600.49 - (4,543.47)
Feb-11 Act 4,689.48 1,108.83 - 1,130.18 - 2,729.85 4,689.5 646.54 - - 14.59% 164.89 - (1,837.65) 398.29 - (3,231.68) 94.33 - (131.64) - - - 657.51 - (5,200.98)
Mar-11 Act 4,434.36 1,045.80 - 1,130.18 - 2,729.85 4,434.4 1,016.07 - - 14.59% 164.89 2,002.55 - 398.29 3,629.97 - 148.24 279.89 - - - - 711.42 5,912.40 -
Apr-11 Est 3,035.00 738.00 - 1,130.18 - 2,729.85 3,035.0 1,268.99 - - 14.59% - - - - - - - - - - - - - - -
May-11 Est 3,219.00 782.00 - 1,130.18 - 2,729.85 3,219.0 1,537.24 - - 14.47% - - - - - - - - - - - - - - -
Jun-11 Est 3,314.00 806.00 - 1,130.18 - 2,729.85 3,314.0 1,813.40 - - 14.47% - - - - - - - - - - - - - - -
Jul-11 Est 3,412.00 829.00 - 1,130.18 - 2,729.85 3,412.0 2,097.74 - - 14.47% 163.54 - - 395.01 - - 303.54 - - - - - 862.09 - -
Aug-11 Est 3,513.00 854.00 - 1,130.18 - 2,729.85 3,513.0 2,390.49 - - 14.47% 163.54 - - 395.01 - - 345.90 - - - - - 904.45 - -
Sep-11 Est 3,617.00 879.00 - 1,130.18 - 2,729.85 3,617.0 2,691.90 - - 14.47% 163.54 - - 395.01 - - 389.52 - - - - - 948.06 - -
Oct-11 Est 3,724.00 905.00 - 1,130.18 - 2,729.85 3,724.0 3,002.24 - - 14.47% 163.54 - - 395.01 - - 434.42 - - - - - 992.97 - -
Nov-11 Est 3,834.00 932.00 - 1,130.18 - 2,729.85 3,834.0 3,321.74 - - 14.47% 163.54 - - 395.01 - - 480.66 - - - - - 1,039.20 - -
Dec-11 Est 3,625.00 879.00 - 1,130.18 - 2,729.85 3,625.0 3,623.82 - - 14.47% 163.54 - - 395.01 - - 524.37 - - - - - 1,082.91 - -
Jan-12 Est 3,166.00 770.00 - 1,130.18 - 2,729.85 - 3,623.82 3,166.0 263.83 14.47% 163.54 - - 395.01 - - 524.37 - - 38.18 - - 1,121.09 - -
Feb-12 Est 3,259.00 793.00 - 1,130.18 - 2,729.85 - 3,623.82 3,259.0 535.42 14.47% 163.54 - - 395.01 - - 524.37 - - 77.47 - - 1,160.39 - -
Mar-12 Est 3,356.00 816.00 - 1,130.18 - 2,729.85 - 3,623.82 3,356.0 815.08 14.47% 163.54 - - 395.01 - - 524.37 - - 117.94 - - 1,200.86 - -
Apr-12 Est 3,455.00 840.00 - 1,066.39 - 2,729.85 - 3,623.82 3,455.0 1,103.00 14.47% 154.31 - - 395.01 - - 524.37 - - 159.60 - - 1,233.29 - -
May-12 Est 3,639.00 885.00 - 988.82 - 2,729.85 - 3,623.82 3,639.0 1,406.25 14.47% 143.08 - - 395.01 - - 524.37 - - 203.48 - - 1,265.94 - -
Jun-12 Est 3,734.00 908.00 - 925.05 - 2,729.85 - 3,623.82 3,734.0 1,717.42 14.47% 133.86 - - 395.01 - - 524.37 - - 248.51 - - 1,301.74 - -
Jul-12 Est 3,832.00 932.00 - 730.40 - 2,729.85 - 3,623.82 3,832.0 2,036.75 - - - - - - - - - - - - - - -
Aug-12 Est 3,933.00 957.00 - 615.03 - 2,729.85 - 3,623.82 3,933.0 2,364.50 - - - - - - - - - - - - - - -
Sep-12 Est 4,037.00 982.00 - 405.16 - 2,729.85 - 3,623.82 4,037.0 2,700.92 - - - - - - - - - - - - - - -
Oct-12 Est 4,144.00 1,008.00 - 164.69 - 2,729.85 - 3,623.82 4,144.0 3,046.25 - - - - - - - - - - - - - - -
Nov-12 Est 4,254.00 1,035.00 - 17.83 - 2,729.85 - 3,623.82 4,254.0 3,400.75 - - - - - - - - - - - - - - -
Dec-12 Est 4,368.00 1,063.00 - - - 2,729.85 - 3,623.82 4,368.0 3,764.75 - - - - - - - - - - - - - - -
Jan-13 NA 3,586.00 872.00 - - - 2,417.44 - 3,623.82 - 3,764.75 - - - - - - - - - - - - - - -
Feb-13 NA 3,679.00 895.00 - - - 2,222.59 - 3,623.82 - 3,764.75 - - - - - - - - - - - - - - -
Mar-13 NA 3,776.00 919.00 - - - 1,919.62 - 3,623.82 - 3,764.75 - - - - - - - - - - - - - - -
Apr-13 NA 3,875.00 943.00 - - - 1,688.88 - 3,623.82 - 3,764.75 - - - - - - - - - - - - - - -
May-13 NA 4,059.00 987.00 - - - 1,462.57 - 3,623.82 - 3,764.75 - - - - - - - - - - - - - - -
Jun-13 NA 4,154.00 1,011.00 - - - 1,341.88 - 3,623.82 - 3,764.75 - - - - - - - - - - - - - - -
Jul-13 NA 4,252.00 1,034.00 - - - 1,176.48 - 3,623.82 - 3,764.75 - - - - - - - - - - - - - - -
Aug-13 NA 4,353.00 1,059.00 - - - 892.85 - 3,623.82 - 3,764.75 - - - - - - - - - - - - - - -
Sep-13 NA 4,457.00 1,084.00 - - - 774.67 - 3,623.82 - 3,764.75 - - - - - - - - - - - - - - -
Oct-13 NA 4,564.00 1,110.00 - - - 435.28 - 3,623.82 - 3,764.75 - - - - - - - - - - - - - - -
Nov-13 NA 4,674.00 1,137.00 - - - 156.43 - 3,623.82 - 3,764.75 - - - - - - - - - - - - - - -
Dec-13 NA 4,788.00 1,165.00 - - - - - 3,623.82 - 3,764.75 - - - - - - - - - - - - - - -
Jan-14 NA 3,700.00 900.27 - - - - - 3,368.07 - 3,764.75 - - - - - - - - - - - - - - -
Feb-14 NA 3,900.00 948.93 - - - - - 2,977.28 - 3,764.75 - - - - - - - - - - - - - - -
Mar-14 NA 4,000.00 973.27 - - - - - 2,607.75 - 3,764.75 - - - - - - - - - - - - - - -
Apr-14 NA 4,100.00 997.60 - - - - - 2,354.83 - 3,764.75 - - - - - - - - - - - - - - -
May-14 NA 4,300.00 1,046.26 - - - - - 2,086.58 - 3,764.75 - - - - - - - - - - - - - - -
Jun-14 NA 4,400.00 1,070.59 - - - - - 1,810.42 - 3,764.75 - - - - - - - - - - - - - - -
Jul-14 NA 4,500.00 1,094.92 - - - - - 1,526.08 - 3,764.75 - - - - - - - - - - - - - - -
Aug-14 NA 4,600.00 1,119.26 - - - - - 1,233.33 - 3,764.75 - - - - - - - - - - - - - - -
Sep-14 NA 4,700.00 1,143.59 - - - - - 931.92 - 3,764.75 - - - - - - - - - - - - - - -
Oct-14 NA 4,900.00 1,192.25 - - - - - 621.58 - 3,764.75 - - - - - - - - - - - - - - -
Nov-14 NA 4,900.00 1,192.25 - - - - - 302.08 - 3,764.75 - - - - - - - - - - - - - - -
Sum of Additions x 3 & Recoverable 40,686.38 40,686.38 98,274.64 98,274.64 130,457.54 130,457.54 135,531.00 135,531.00 Sum of Actuals 3,274.95 3,274.95 - 3,869.73 3,869.73 - 279.89 279.89 - - - - 7,424.57 7,424.57 -
- - Amounts Do Not Include Current Rate Period Amounts Do Not Include Current Rate Period Amounts Do Not Include Current Rate Period Amounts Do Not Include Current Rate Period Amounts Do Not Include Current Rate Period
Vintage - 2009 (South Carolina) Vintage - 2010 (South Carolina) Vintage - 2011 (South Carolina) Vintage - 2012 (South Carolina)
Not
es
Additions (W/P D-3A)
Vintage - 2009 Vintage - 2010 Vintage - 2011 Vintage - 2012
200
9-19
1-
E
Doc
ket
2010
-161
-E T
est
Per
iod
D
ocke
t 20
11-X
XX
-E T
est
Per
iod
Doc
ket
2011
-XX
X-E
Rat
e P
erio
d

CIG Energy Efficiency Program W/P D-2h
Page 2 of 2
Σ Recovered Net Lost Revenue
Start Date End Date Source Documents for Recovered Lost MWHs MWH Rate Recovery MWH Rate Recovery MWH Rate Recovery MWH Rate Recovery MWH Rate Recovery
2009-191-E Test Period Net Recoveries Sep-07 to Mar-09 Refer to Workpaper D-2 employed in Docket No. 2009-191-E - -$ -$ - -$ -$ - -$ -$ - -$ -$ - -$ -$
2010-161-E Test Period Net Recoveries Apr-09 to Mar-10 Refer to Workpaper D-3 employed in Docket No. 2010-161-E 1,272.41 52.26$ 66,499.80 239.76 52.26$ 12,530.74$ - - - - 1,512.17 52.26$ 79,030.54$
Sum of Vintage Recovery Amounts thru 2010-161-E Sum of Amounts from Prior Proceedings 1,272.41 66,499.80$ 239.76 12,530.74$ - -$ - -$ 1,512.17 79,030.54$
(W/P D-3) (W/P D-3) (W/P D-3) To W/P D-2
2011-XXX-E Test Period Net Recoveries Apr-10 to Mar-11 Amounts from Current Test Period (April 2010 thru March 2011) 2,002.55 52.05$ 104,240.34 3,629.97 52.05$ 188,953.90 279.89 52.05$ 14,569.30 - -$ - 5,912.40 52.05$ 307,763.54$
Sum of Vintage Recovery Amounts thru 2011-XXX-E Sum of Amounts from Current and Prior Proceedings 3,274.95 52.05$ 170,740.14$ 3,869.73 52.05$ 201,484.64$ 279.89 52.05$ 14,569.30$ - -$ -$ 7,424.57 52.05$ 386,794.08$
(W/P D-3) (W/P D-3) (W/P D-3) (W/P D-3) To W/P D-2
2011-XXX-E Rate Period Forecast Jul-11 to Jun-12 Sum of Rate Period Values (Jul-11 thru Jun-12) 1,903.07 51.51$ 98,034.50$ 4,740.11 51.51$ 244,181.04$ 5,624.61 51.51$ 289,744.85$ 845.19 51.51$ 43,539.05$ 13,112.99 51.51$ 675,499.44$
Vintage 2010 Recoveries Vintage 2011 Recoveries Vintage 2012 RecoveriesVintage 2009 Recoveries

W/P DRPage 1 of 3
EnergyWise Summer
Vintage kW
2009
Vintage ΣkW
2009
Vintage kW
2010
Vintage ΣkW
2010
Vintage kW
2011
Vintage ΣkW
2011
Vintage kW
2009
Vintage kW
2010
Vintage kW
2011
MWH
Savings
Vintage
MWh
2009
Vintage
MWh
2010
Vintage
MWh
2011
(a) (b) = Σ(a) (c) (d) = Σ(c) (e) (f) = Σ(e) (g)=(b)/[(b)+(e)+(g)] (h)=(e)/[(b)+(e)+(g)] (h)=(g)/[(b)+(e)+(g)] (j) W/P D-3B (k) = (h) x (j) (l) = (i) x (j) (m) = (j) x (j)
Jan-09 - - - - - - - - - - - - -
Feb-09 - - - - - - - - - - - - -
Mar-09 - - - - - - - - - - - - -
Apr-09 211.8 211.8 - - - - 100.0% 0.0% 0.0% - - - -
May-09 579.6 791.4 - - - - 100.0% 0.0% 0.0% - - - -
Jun-09 1,395.0 2,186.4 - - - - 100.0% 0.0% 0.0% - - - -
Jul-09 1,639.0 3,825.4 - - - - 100.0% 0.0% 0.0% - - - -
Aug-09 1,766.0 5,591.4 - - - - 100.0% 0.0% 0.0% - - - -
Sep-09 2,019.0 7,610.4 - - - - 100.0% 0.0% 0.0% - - - -
Oct-09 2,175.0 9,785.4 - - - - 100.0% 0.0% 0.0% - - - -
Nov-09 1,639.0 11,424.4 - - - - 100.0% 0.0% 0.0% - - - -
Dec-09 1,793.0 13,217.4 - - - - 100.0% 0.0% 0.0% - - - -
Jan-10 - 13,217.4 2,464.0 2,464.0 - - 84.3% 15.7% 0.0% - - - -
Feb-10 - 13,217.4 2,554.0 5,018.0 - - 72.5% 27.5% 0.0% - - - -
Mar-10 - 13,217.4 3,725.0 8,743.0 - - 60.2% 39.8% 0.0% - - - -
Apr-10 - 13,217.4 3,865.0 12,608.0 - - 51.2% 48.8% 0.0% - - - -
May-10 - 13,217.4 3,748.0 16,356.0 - - 44.7% 55.3% 0.0% 30.76 13.75 17.01 -
Jun-10 - 13,217.4 3,558.0 19,914.0 - - 39.9% 60.1% 0.0% 34.46 13.75 20.71 -
Jul-10 - 13,217.4 3,900.0 23,814.0 - - 35.7% 64.3% 0.0% 38.51 13.75 24.77 -
Aug-10 - 13,217.4 3,930.0 27,744.0 - - 32.3% 67.7% 0.0% 42.60 13.75 28.85 -
Sep-10 - 13,217.4 3,602.0 31,346.0 - - 29.7% 70.3% 0.0% - - - -
Oct-10 - 13,217.4 3,555.0 34,901.0 - - 27.5% 72.5% 0.0% - - - -
Nov-10 - 13,217.4 2,690.0 37,591.0 - - 26.0% 74.0% 0.0% - - - -
Dec-10 - 13,217.4 2,592.0 40,183.0 - - 24.8% 75.2% 0.0% 2.54 0.63 1.91 -
Jan-11 - 13,217.4 - 40,183.0 2,620.0 2,620.0 23.6% 71.7% 4.7% 2.70 0.64 1.94 0.13
Feb-11 - 13,217.4 - 40,183.0 3,030.0 5,650.0 22.4% 68.0% 9.6% - - - -
Mar-11 - 13,217.4 - 40,183.0 3,474.0 9,124.0 21.1% 64.3% 14.6% - - - -
Recoverable Lost Sales (MWHs) 151.57 56.25 95.19 0.13
SC DSM Jurisdictional Allocation Factor (W/P B, Line 3) 14.11% 14.11% 14.11%
Recoverable Jurisdictional Net Lost Sales (MWHs) 21.39 7.94 13.43 0.02
Net Lost Revenue Rate per MWH (W/P D-3, Line 21) 58.39$ 58.39$ 58.39$
Recoverable Net Lost Revenues (By Vintage) 463.48$ 784.32$ 1.04$
Recoverable Net Lost Revenues (Total) 1,248.84$
Progress Energy Carolinas, Inc.Determination of Net Lost Revenues Associated With DSM Programs
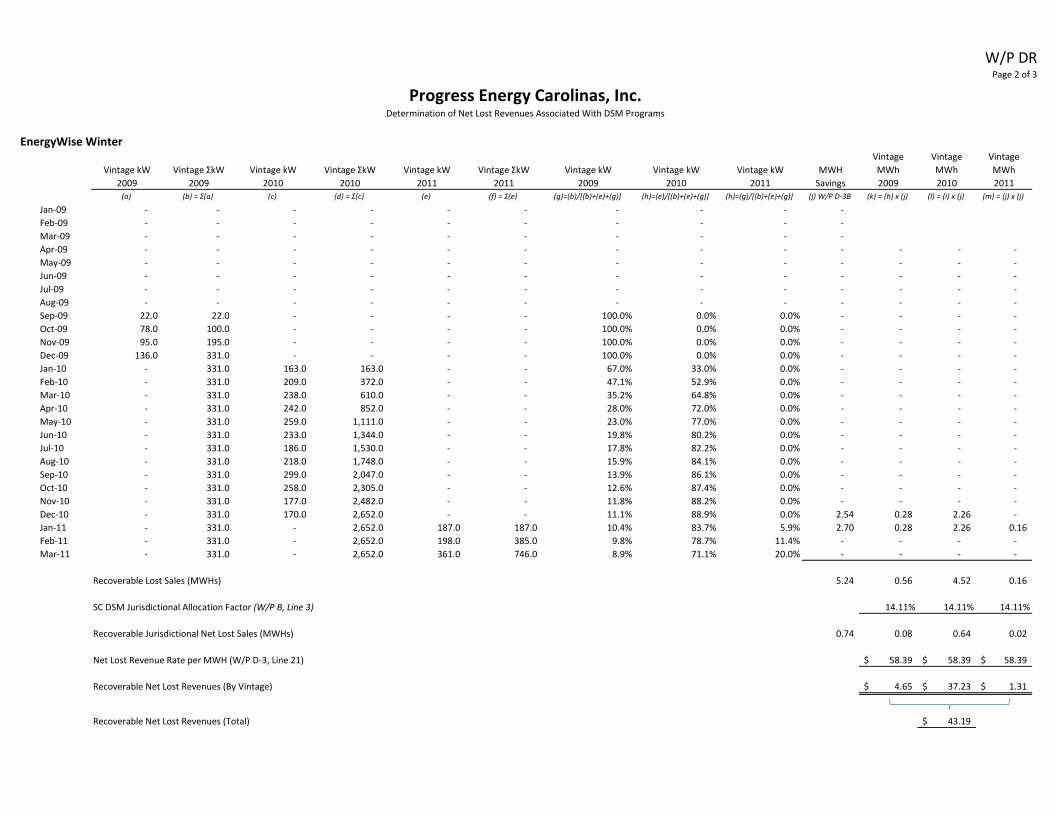
W/P DRPage 2 of 3
Progress Energy Carolinas, Inc.Determination of Net Lost Revenues Associated With DSM Programs
EnergyWise Winter
Vintage kW
2009
Vintage ΣkW
2009
Vintage kW
2010
Vintage ΣkW
2010
Vintage kW
2011
Vintage ΣkW
2011
Vintage kW
2009
Vintage kW
2010
Vintage kW
2011
MWH
Savings
Vintage
MWh
2009
Vintage
MWh
2010
Vintage
MWh
2011
(a) (b) = Σ(a) (c) (d) = Σ(c) (e) (f) = Σ(e) (g)=(b)/[(b)+(e)+(g)] (h)=(e)/[(b)+(e)+(g)] (h)=(g)/[(b)+(e)+(g)] (j) W/P D-3B (k) = (h) x (j) (l) = (i) x (j) (m) = (j) x (j)
Jan-09 - - - - - - - - - -
Feb-09 - - - - - - - - - -
Mar-09 - - - - - - - - - -
Apr-09 - - - - - - - - - - - - -
May-09 - - - - - - - - - - - - -
Jun-09 - - - - - - - - - - - - -
Jul-09 - - - - - - - - - - - - -
Aug-09 - - - - - - - - - - - - -
Sep-09 22.0 22.0 - - - - 100.0% 0.0% 0.0% - - - -
Oct-09 78.0 100.0 - - - - 100.0% 0.0% 0.0% - - - -
Nov-09 95.0 195.0 - - - - 100.0% 0.0% 0.0% - - - -
Dec-09 136.0 331.0 - - - - 100.0% 0.0% 0.0% - - - -
Jan-10 - 331.0 163.0 163.0 - - 67.0% 33.0% 0.0% - - - -
Feb-10 - 331.0 209.0 372.0 - - 47.1% 52.9% 0.0% - - - -
Mar-10 - 331.0 238.0 610.0 - - 35.2% 64.8% 0.0% - - - -
Apr-10 - 331.0 242.0 852.0 - - 28.0% 72.0% 0.0% - - - -
May-10 - 331.0 259.0 1,111.0 - - 23.0% 77.0% 0.0% - - - -
Jun-10 - 331.0 233.0 1,344.0 - - 19.8% 80.2% 0.0% - - - -
Jul-10 - 331.0 186.0 1,530.0 - - 17.8% 82.2% 0.0% - - - -
Aug-10 - 331.0 218.0 1,748.0 - - 15.9% 84.1% 0.0% - - - -
Sep-10 - 331.0 299.0 2,047.0 - - 13.9% 86.1% 0.0% - - - -
Oct-10 - 331.0 258.0 2,305.0 - - 12.6% 87.4% 0.0% - - - -
Nov-10 - 331.0 177.0 2,482.0 - - 11.8% 88.2% 0.0% - - - -
Dec-10 - 331.0 170.0 2,652.0 - - 11.1% 88.9% 0.0% 2.54 0.28 2.26 -
Jan-11 - 331.0 - 2,652.0 187.0 187.0 10.4% 83.7% 5.9% 2.70 0.28 2.26 0.16
Feb-11 - 331.0 - 2,652.0 198.0 385.0 9.8% 78.7% 11.4% - - - -
Mar-11 - 331.0 - 2,652.0 361.0 746.0 8.9% 71.1% 20.0% - - - -
Recoverable Lost Sales (MWHs) 5.24 0.56 4.52 0.16
SC DSM Jurisdictional Allocation Factor (W/P B, Line 3) 14.11% 14.11% 14.11%
Recoverable Jurisdictional Net Lost Sales (MWHs) 0.74 0.08 0.64 0.02
Net Lost Revenue Rate per MWH (W/P D-3, Line 21) 58.39$ 58.39$ 58.39$
Recoverable Net Lost Revenues (By Vintage) 4.65$ 37.23$ 1.31$
Recoverable Net Lost Revenues (Total) 43.19$

W/P DRPage 3 of 3
Progress Energy Carolinas, Inc.Determination of Net Lost Revenues Associated With DSM Programs
CIG DR
Vintage kW
2009
Vintage ΣkW
2009
Vintage kW
2010
Vintage ΣkW
2010
Vintage kW
2011
Vintage ΣkW
2011
Vintage kW
2009
Vintage kW
2010
Vintage kW
2011
MWH
Savings
Vintage
MWh
2009
Vintage
MWh
2010
Vintage
MWh
2011
(a) (b) = Σ(a) (c) (d) = Σ(c) (e) (f) = Σ(e) (g)=(b)/[(b)+(e)+(g)] (h)=(e)/[(b)+(e)+(g)] (h)=(g)/[(b)+(e)+(g)] (j) W/P D-3B (k) = (h) x (j) (l) = (i) x (j) (m) = (j) x (j)
Jan-09 - -
Feb-09 - -
Mar-09 - -
Apr-09 - - - - - -
May-09 - - - - - -
Jun-09 - - - - - -
Jul-09 - - - - - -
Aug-09 - - - - - -
Sep-09 - - - - - -
Oct-09 - - - - - -
Nov-09 - - - - - -
Dec-09 816.0 816.0 100.0% 0.0% 0.0% - - - -
Jan-10 816.0 - - - 100.0% 0.0% 0.0% - - - -
Feb-10 816.0 100.0 100.0 - 89.1% 10.9% 0.0% - - - -
Mar-10 816.0 660.0 760.0 - 51.8% 48.2% 0.0% - - - -
Apr-10 816.0 - 760.0 - 51.8% 48.2% 0.0% - - - -
May-10 816.0 905.0 1,665.0 - 32.9% 67.1% 0.0% - - - -
Jun-10 816.0 2,430.0 4,095.0 - 16.6% 83.4% 0.0% 29.47 4.90 24.57 -
Jul-10 816.0 400.0 4,495.0 - 15.4% 84.6% 0.0% 31.87 4.90 26.97 -
Aug-10 816.0 - 4,495.0 - 15.4% 84.6% 0.0% 31.87 4.90 26.97 -
Sep-10 816.0 585.0 5,080.0 - 13.8% 86.2% 0.0% - - - -
Oct-10 816.0 570.0 5,650.0 - 12.6% 87.4% 0.0% - - - -
Nov-10 816.0 900.0 6,550.0 - 11.1% 88.9% 0.0% - - - -
Dec-10 816.0 390.0 6,940.0 - 10.5% 89.5% 0.0% - - - -
Jan-11 816.0 6,940.0 285.0 285.0 10.5% 89.5% 3.5% - - - -
Feb-11 816.0 6,940.0 1,065.0 1,350.0 10.5% 89.5% 14.8% - - - -
Mar-11 816.0 6,940.0 2,500.0 3,850.0 10.5% 89.5% 33.2% - - - -
Recoverable Lost Sales (MWHs) 93.20 14.69 78.51 -
SC DSM Jurisdictional Allocation Factor (W/P B, Line 3) 14.11% 14.11% 14.11%
Recoverable Jurisdictional Net Lost Sales (MWHs) 13.15 2.07 11.08 -
Net Lost Revenue Rate per MWH (W/P D-3, Line 21) 52.06$ 52.06$ 52.06$
Recoverable Net Lost Revenues (By Vintage) 107.88$ 576.66$ -$
Recoverable Net Lost Revenues (Total) 684.55$

Docket 2009‐191‐E W/P D‐2
ResidentialGeneralService System Residential
GeneralService System
1 Gross Margin (Net of GRT) WP Input 61.35$ 54.45$ 47.65$ 61.35$ 54.45$ 47.65$ 2 Less: Incremental Variable O&M From CSP 2.07 2.07 2.07 2.13 2.13 2.13 3 Net Rate for Lost Revenue Determination / MWh Lines 1 - 2 59.28$ 52.38$ 45.58$ 59.22$ 52.32$ 45.52$
DSM Programs (Total Lost MWH)4 Residential EnergyWise W/P D-2a ‐ ‐ ‐ 18.23 ‐ ‐ 5 DSDR Prior Forecast ‐ ‐ ‐ 1,581.16 6 CIG DR W/P D-2b ‐ ‐ ‐ 2.61 7 Total DSM ‐ ‐ ‐ 18.23 2.61 1,581.16
8 SC Allocation Factors (DSM) W/P B 13.27% 13.27% 13.27% 13.84% 13.84% 13.84%
DSM Programs (SC Lost MWH)9 Residential EnergyWise Lines 4 X 8 ‐ ‐ ‐ 2.52 ‐ ‐ 10 DSDR Lines 5 X 8 ‐ ‐ ‐ ‐ ‐ 218.79 11 CIG DR Lines 6 X 8 ‐ ‐ ‐ ‐ 0.36 ‐ 12 Total DSM Σ Lines 9 thru 11 ‐ ‐ ‐ 2.52 0.36 218.79
DSM Programs (SC Net Lost Revenues)13 Residential EnergyWise Lines 3 X 9 ‐$ ‐$ ‐$ 149.35$ ‐$ ‐$ 14 DSDR Lines 3 X 10 ‐ ‐ ‐ ‐ ‐ 9,959.16 15 CIG DR Lines 3 X 11 ‐ ‐ ‐ ‐ 18.93 ‐ 16 Total DSM Σ Lines 13 thru 15 ‐$ ‐$ ‐$ 149.35$ 18.93$ 9,959.16$
EE Programs (Total Lost MWH)17 Residential Home Advantage W/P D-2a 17.61 ‐ ‐ 2,707.86 18 Residential Home Energy Improvement W/P D-2a ‐ ‐ ‐ 1,560.23 19 Residential Low Income Program W/P D-2a 2,824.05 20 CIG Energy Efficiency W/P D-2b ‐ ‐ ‐ 9,292.72 ‐ 21 Pilot CFL Program W/P D-2a 10,617.77 6,705.96 ‐ ‐ 22 Total EE Σ Lines 17 thru 21 10,635.38 ‐ ‐ 13,798.10 9,292.72 ‐
23 SC Allocation Factors (EE) W/P B 15.19% 15.19% 15.19% 14.94% 14.94% 15.19%
EE Programs (SC Lost MWH)24 Residential Home Advantage Lines 17 X 23 2.68 ‐ ‐ 404.64 ‐ ‐ 25 Residential Home Energy Improvement Lines 18 X 23 ‐ ‐ ‐ 233.15 ‐ ‐ 26 Residential Low Income Program Lines 19 X 23 ‐ ‐ ‐ 422.00 ‐ ‐ 27 CIG Energy Efficiency Lines 20 X 23 ‐ ‐ ‐ ‐ 1,388.62 ‐ 28 Pilot CFL Program Lines 21 X 23 1,613.24 ‐ ‐ 1,002.08 ‐ ‐ 29 Total EE Σ Lines 24 thru 28 1,615.91 ‐ ‐ 2,061.86 1,388.62 ‐
EE Programs (SC Net Lost Revenues)30 Residential Home Advantage Lines 3 X 24 158.63$ ‐$ ‐$ 23,962.65$ ‐$ ‐$ 31 Residential Home Energy Improvement Lines 3 X 25 ‐ ‐ ‐ 13,806.98 ‐ ‐ 32 Residential Low Income Program Lines 3 X 26 24,990.89 33 CIG Energy Efficiency Lines 3 X 27 ‐ ‐ ‐ ‐ 72,652.61 ‐ 34 Pilot CFL Program Lines 3 X 28 95,632.77 ‐ ‐ 59,343.09 ‐ ‐ 35 Total EE Σ Lines 30 thru 34 95,791.40$ ‐$ ‐$ 122,103.61$ 72,652.61$ ‐$
TEST PERIOD(S) RATE PERIOD
Calculation of Net Lost RevenuesPROGRESS ENERGY CAROLINAS, INC.

Docket 2010‐161‐E W/P D‐3
ResidentialGeneralService System Residential
GeneralService System
1 Adjusted Gross Margin (Net of GRT) WP D-4 1 60.79$ 54.38$ 47.45$ 60.79$ 54.38$ 47.45$ 2 Less: Incremental Variable O&M From CSP 2.12 2.12 2.12 2.17 2.17 2.17 3 Net Rate for Lost Revenue Determination / MWh Lines 1 - 2 58.67$ 52.26$ 45.33$ 58.62$ 52.21$ 45.28$
DSM Programs (Total Lost MWH)4 Residential EnergyWise TBD 2 ‐ ‐ ‐ ‐ ‐ ‐ 5 DSDR TBD 2 ‐ ‐ ‐ ‐ ‐ ‐ 6 CIG DR TBD 2 ‐ ‐ ‐ ‐ ‐ ‐ 7 Total DSM Σ Lines 4 thru 6 ‐ ‐ ‐ ‐ ‐ ‐
8 SC Allocation Factors (DSM) W/P B 13.84% 13.84% 13.84% 14.11% 14.11% 14.11%
DSM Programs (SC Lost MWH)9 Residential EnergyWise Lines 4 X 8 ‐ ‐ ‐ ‐ ‐ ‐ 10 DSDR Lines 5 X 8 ‐ ‐ ‐ ‐ ‐ ‐ 11 CIG DR Lines 6 X 8 ‐ ‐ ‐ ‐ ‐ ‐ 12 Total DSM Σ Lines 9 thru 11 ‐ ‐ ‐ ‐ ‐ ‐
DSM Programs (SC Net Lost Revenues)13 Residential EnergyWise Lines 3 X 9 ‐$ ‐$ ‐$ ‐$ ‐$ ‐$ 14 DSDR Lines 3 X 10 ‐ ‐ ‐ ‐ ‐ ‐ 15 CIG DR Lines 3 X 11 ‐ ‐ ‐ ‐ ‐ ‐ 16 Total DSM Σ Lines 13 thru 15 ‐$ ‐$ ‐$ ‐$ ‐$ ‐$
EE Programs (Total Lost MWH)1
17 Residential Home Advantage W/P D-3a 1 490.30 ‐ ‐ 2,186.10 ‐ ‐ 18 Residential Home Energy Improvement W/P D-3a 1 2,938.03 ‐ ‐ 10,383.93 ‐ ‐ 19 Residential Low Income Program W/P D-3a 1 377.77 ‐ ‐ 4,862.95 ‐ ‐ 20 Residential Lighting W/P D-3a 1 1,451.95 ‐ ‐ 60,406.29 ‐ ‐ 21 Residential Appliance Recycling W/P D-3a 1 ‐ ‐ ‐ 3,838.35 ‐ ‐ 22 CIG Energy Efficiency W/P D-3a 1 ‐ 10,121.65 ‐ ‐ 44,196.89 ‐
23 Pilot CFL Program3 W/P D-3a 1 6,706.00 ‐ ‐ 2,794.17 ‐ ‐ 24 Total EE Σ Lines 17 thru 21 11,964.05 10,121.65 ‐ 84,471.79 44,196.89 ‐
25 SC Allocation Factors (EE) W/P B 14.94% 14.94% 14.94% 14.59% 14.59% 14.59%
EE Programs (SC Lost MWH)26 Residential Home Advantage Lines 17 X 25 73.25 ‐ ‐ 318.95 ‐ ‐ 27 Residential Home Energy Improvement Lines 18 X 25 438.94 ‐ ‐ 1,515.02 ‐ ‐ 28 Residential Low Income Program Lines 19 X 25 56.44 ‐ ‐ 709.50 ‐ ‐ 29 Residential Lighting Lines 20 X 25 216.92 ‐ ‐ 8,813.28 ‐ ‐ 30 Residential Appliance Recycling Lines 21 X 25 ‐ ‐ ‐ 560.02 ‐ ‐ 31 CIG Energy Efficiency Lines 22 X 25 ‐ 1,512.17 ‐ ‐ 6,448.33 ‐ 32 Pilot CFL Program Lines 23 X 25 1,001.88 ‐ ‐ 407.67 ‐ ‐ 33 Total EE Σ Lines 26 thru 32 1,787.43 1,512.17 ‐ 12,324.43 6,448.33 ‐
EE Programs (SC Net Lost Revenues)34 Residential Home Advantage Lines 3 X 26 4,297.83$ ‐$ ‐$ 18,697.85$ ‐$ ‐$ 34 Residential Home Energy Improvement Lines 3 X 27 25,753.96 ‐ ‐ 88,814.43 ‐ ‐ 35 Residential Low Income Program Lines 3 X 28 3,311.39 ‐ ‐ 41,593.12 ‐ ‐ 35 Residential Lighting Lines 3 X 29 12,727.36 ‐ ‐ 516,658.82 ‐ ‐ 36 Residential Appliance Recycling Lines 3 X 30 ‐ ‐ ‐ 32,829.65 ‐ ‐ 36 CIG Energy Efficiency Lines 3 X 31 ‐ 79,030.54 ‐ ‐ 336,685.62 ‐ 37 Pilot CFL Program Lines 3 X 32 58,782.87 ‐ ‐ 23,898.69 ‐ ‐ 38 Total EE Σ Lines 34 thru 37 104,873.41$ 79,030.54$ ‐$ 722,492.55$ 336,685.62$ ‐$
1 Referenced workpapers filed with Direct Testimony and Exhibits in this proceeding on April 30, 2010.2 Net Lost Revenues for Event Driven Measures will be based on actual as opposed to estimated events.3 CFL Net Lost Revenue Recovery through End of Test Period 2 yrs 7 months. Remaining 5 months reflected in Rate Period.
PROGRESS ENERGY CAROLINAS, INC.Calculation of Net Lost Revenues
TEST PERIOD RATE PERIOD
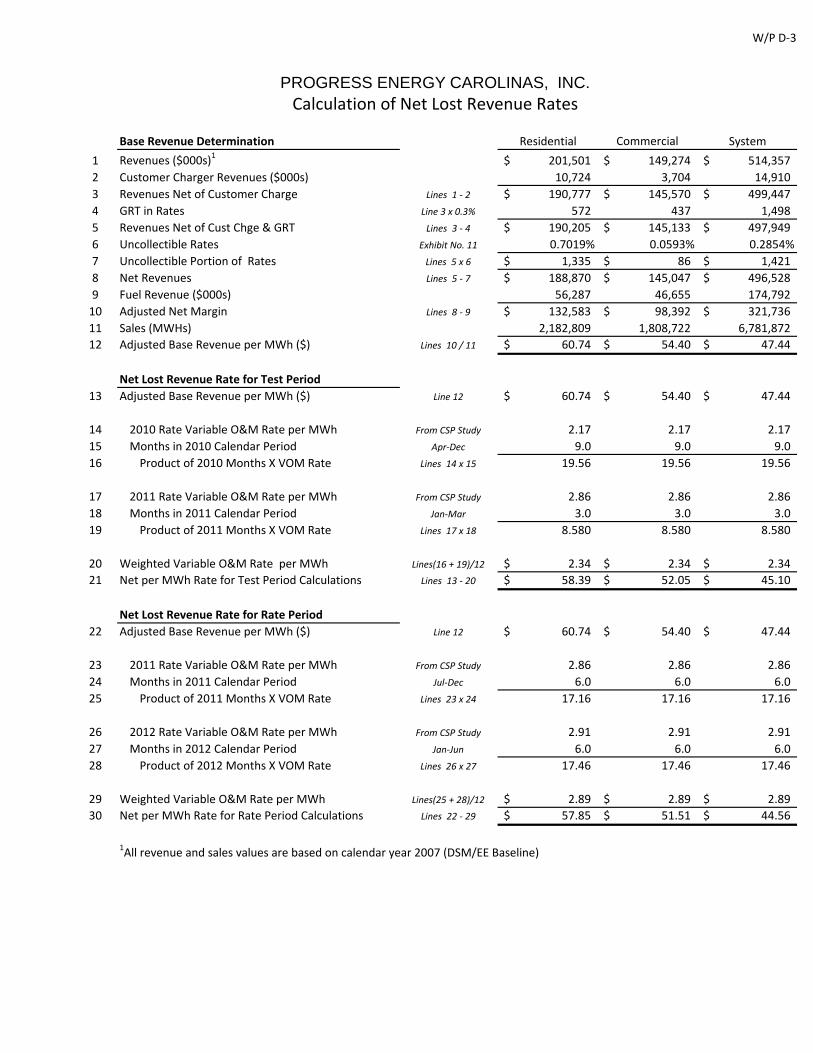
W/P D-3
Base Revenue Determination Residential Commercial System
1 Revenues ($000s)1201,501$ 149,274$ 514,357$
2 Customer Charger Revenues ($000s) 10,724 3,704 14,910
3 Revenues Net of Customer Charge Lines 1 - 2 190,777$ 145,570$ 499,447$
4 GRT in Rates Line 3 x 0.3% 572 437 1,498
5 Revenues Net of Cust Chge & GRT Lines 3 - 4 190,205$ 145,133$ 497,949$
6 Uncollectible Rates Exhibit No. 11 0.7019% 0.0593% 0.2854%
7 Uncollectible Portion of Rates Lines 5 x 6 1,335$ 86$ 1,421$
8 Net Revenues Lines 5 - 7 188,870$ 145,047$ 496,528$
9 Fuel Revenue ($000s) 56,287 46,655 174,792
10 Adjusted Net Margin Lines 8 - 9 132,583$ 98,392$ 321,736$
11 Sales (MWHs) 2,182,809 1,808,722 6,781,872
12 Adjusted Base Revenue per MWh ($) Lines 10 / 11 60.74$ 54.40$ 47.44$
Net Lost Revenue Rate for Test Period
13 Adjusted Base Revenue per MWh ($) Line 12 60.74$ 54.40$ 47.44$
14 2010 Rate Variable O&M Rate per MWh From CSP Study 2.17 2.17 2.17
15 Months in 2010 Calendar Period Apr-Dec 9.0 9.0 9.0
16 Product of 2010 Months X VOM Rate Lines 14 x 15 19.56 19.56 19.56
17 2011 Rate Variable O&M Rate per MWh From CSP Study 2.86 2.86 2.86
18 Months in 2011 Calendar Period Jan-Mar 3.0 3.0 3.0
19 Product of 2011 Months X VOM Rate Lines 17 x 18 8.580 8.580 8.580
20 Weighted Variable O&M Rate per MWh Lines(16 + 19)/12 2.34$ 2.34$ 2.34$
21 Net per MWh Rate for Test Period Calculations Lines 13 - 20 58.39$ 52.05$ 45.10$
Net Lost Revenue Rate for Rate Period
22 Adjusted Base Revenue per MWh ($) Line 12 60.74$ 54.40$ 47.44$
23 2011 Rate Variable O&M Rate per MWh From CSP Study 2.86 2.86 2.86
24 Months in 2011 Calendar Period Jul-Dec 6.0 6.0 6.0
25 Product of 2011 Months X VOM Rate Lines 23 x 24 17.16 17.16 17.16
26 2012 Rate Variable O&M Rate per MWh From CSP Study 2.91 2.91 2.91
27 Months in 2012 Calendar Period Jan-Jun 6.0 6.0 6.0
28 Product of 2012 Months X VOM Rate Lines 26 x 27 17.46 17.46 17.46
29 Weighted Variable O&M Rate per MWh Lines(25 + 28)/12 2.89$ 2.89$ 2.89$
30 Net per MWh Rate for Rate Period Calculations Lines 22 - 29 57.85$ 51.51$ 44.56$
1All revenue and sales values are based on calendar year 2007 (DSM/EE Baseline)
PROGRESS ENERGY CAROLINAS, INC.
Calculation of Net Lost Revenue Rates
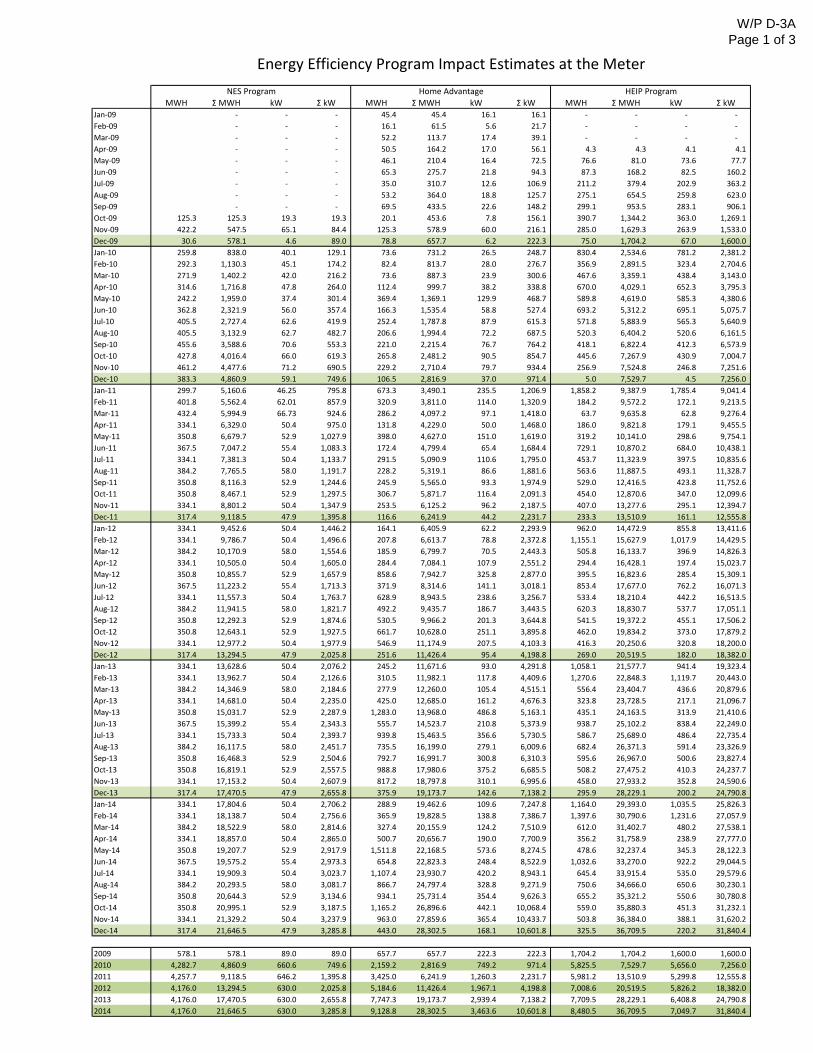
W/P D-3A
Page 1 of 3
MWH Σ MWH kW Σ kW MWH Σ MWH kW Σ kW MWH Σ MWH kW Σ kWJan-09 - - - 45.4 45.4 16.1 16.1 - - - -
Feb-09 - - - 16.1 61.5 5.6 21.7 - - - -
Mar-09 - - - 52.2 113.7 17.4 39.1 - - - -
Apr-09 - - - 50.5 164.2 17.0 56.1 4.3 4.3 4.1 4.1
May-09 - - - 46.1 210.4 16.4 72.5 76.6 81.0 73.6 77.7
Jun-09 - - - 65.3 275.7 21.8 94.3 87.3 168.2 82.5 160.2
Jul-09 - - - 35.0 310.7 12.6 106.9 211.2 379.4 202.9 363.2
Aug-09 - - - 53.2 364.0 18.8 125.7 275.1 654.5 259.8 623.0
Sep-09 - - - 69.5 433.5 22.6 148.2 299.1 953.5 283.1 906.1
Oct-09 125.3 125.3 19.3 19.3 20.1 453.6 7.8 156.1 390.7 1,344.2 363.0 1,269.1
Nov-09 422.2 547.5 65.1 84.4 125.3 578.9 60.0 216.1 285.0 1,629.3 263.9 1,533.0
Dec-09 30.6 578.1 4.6 89.0 78.8 657.7 6.2 222.3 75.0 1,704.2 67.0 1,600.0
Jan-10 259.8 838.0 40.1 129.1 73.6 731.2 26.5 248.7 830.4 2,534.6 781.2 2,381.2
Feb-10 292.3 1,130.3 45.1 174.2 82.4 813.7 28.0 276.7 356.9 2,891.5 323.4 2,704.6
Mar-10 271.9 1,402.2 42.0 216.2 73.6 887.3 23.9 300.6 467.6 3,359.1 438.4 3,143.0
Apr-10 314.6 1,716.8 47.8 264.0 112.4 999.7 38.2 338.8 670.0 4,029.1 652.3 3,795.3
May-10 242.2 1,959.0 37.4 301.4 369.4 1,369.1 129.9 468.7 589.8 4,619.0 585.3 4,380.6
Jun-10 362.8 2,321.9 56.0 357.4 166.3 1,535.4 58.8 527.4 693.2 5,312.2 695.1 5,075.7
Jul-10 405.5 2,727.4 62.6 419.9 252.4 1,787.8 87.9 615.3 571.8 5,883.9 565.3 5,640.9
Aug-10 405.5 3,132.9 62.7 482.7 206.6 1,994.4 72.2 687.5 520.3 6,404.2 520.6 6,161.5
Sep-10 455.6 3,588.6 70.6 553.3 221.0 2,215.4 76.7 764.2 418.1 6,822.4 412.3 6,573.9
Oct-10 427.8 4,016.4 66.0 619.3 265.8 2,481.2 90.5 854.7 445.6 7,267.9 430.9 7,004.7
Nov-10 461.2 4,477.6 71.2 690.5 229.2 2,710.4 79.7 934.4 256.9 7,524.8 246.8 7,251.6
Dec-10 383.3 4,860.9 59.1 749.6 106.5 2,816.9 37.0 971.4 5.0 7,529.7 4.5 7,256.0
Jan-11 299.7 5,160.6 46.25 795.8 673.3 3,490.1 235.5 1,206.9 1,858.2 9,387.9 1,785.4 9,041.4
Feb-11 401.8 5,562.4 62.01 857.9 320.9 3,811.0 114.0 1,320.9 184.2 9,572.2 172.1 9,213.5
Mar-11 432.4 5,994.9 66.73 924.6 286.2 4,097.2 97.1 1,418.0 63.7 9,635.8 62.8 9,276.4
Apr-11 334.1 6,329.0 50.4 975.0 131.8 4,229.0 50.0 1,468.0 186.0 9,821.8 179.1 9,455.5
May-11 350.8 6,679.7 52.9 1,027.9 398.0 4,627.0 151.0 1,619.0 319.2 10,141.0 298.6 9,754.1
Jun-11 367.5 7,047.2 55.4 1,083.3 172.4 4,799.4 65.4 1,684.4 729.1 10,870.2 684.0 10,438.1
Jul-11 334.1 7,381.3 50.4 1,133.7 291.5 5,090.9 110.6 1,795.0 453.7 11,323.9 397.5 10,835.6
Aug-11 384.2 7,765.5 58.0 1,191.7 228.2 5,319.1 86.6 1,881.6 563.6 11,887.5 493.1 11,328.7
Sep-11 350.8 8,116.3 52.9 1,244.6 245.9 5,565.0 93.3 1,974.9 529.0 12,416.5 423.8 11,752.6
Oct-11 350.8 8,467.1 52.9 1,297.5 306.7 5,871.7 116.4 2,091.3 454.0 12,870.6 347.0 12,099.6
Nov-11 334.1 8,801.2 50.4 1,347.9 253.5 6,125.2 96.2 2,187.5 407.0 13,277.6 295.1 12,394.7
Dec-11 317.4 9,118.5 47.9 1,395.8 116.6 6,241.9 44.2 2,231.7 233.3 13,510.9 161.1 12,555.8
Jan-12 334.1 9,452.6 50.4 1,446.2 164.1 6,405.9 62.2 2,293.9 962.0 14,472.9 855.8 13,411.6
Feb-12 334.1 9,786.7 50.4 1,496.6 207.8 6,613.7 78.8 2,372.8 1,155.1 15,627.9 1,017.9 14,429.5
Mar-12 384.2 10,170.9 58.0 1,554.6 185.9 6,799.7 70.5 2,443.3 505.8 16,133.7 396.9 14,826.3
Apr-12 334.1 10,505.0 50.4 1,605.0 284.4 7,084.1 107.9 2,551.2 294.4 16,428.1 197.4 15,023.7
May-12 350.8 10,855.7 52.9 1,657.9 858.6 7,942.7 325.8 2,877.0 395.5 16,823.6 285.4 15,309.1
Jun-12 367.5 11,223.2 55.4 1,713.3 371.9 8,314.6 141.1 3,018.1 853.4 17,677.0 762.2 16,071.3
Jul-12 334.1 11,557.3 50.4 1,763.7 628.9 8,943.5 238.6 3,256.7 533.4 18,210.4 442.2 16,513.5
Aug-12 384.2 11,941.5 58.0 1,821.7 492.2 9,435.7 186.7 3,443.5 620.3 18,830.7 537.7 17,051.1
Sep-12 350.8 12,292.3 52.9 1,874.6 530.5 9,966.2 201.3 3,644.8 541.5 19,372.2 455.1 17,506.2
Oct-12 350.8 12,643.1 52.9 1,927.5 661.7 10,628.0 251.1 3,895.8 462.0 19,834.2 373.0 17,879.2
Nov-12 334.1 12,977.2 50.4 1,977.9 546.9 11,174.9 207.5 4,103.3 416.3 20,250.6 320.8 18,200.0
Dec-12 317.4 13,294.5 47.9 2,025.8 251.6 11,426.4 95.4 4,198.8 269.0 20,519.5 182.0 18,382.0
Jan-13 334.1 13,628.6 50.4 2,076.2 245.2 11,671.6 93.0 4,291.8 1,058.1 21,577.7 941.4 19,323.4
Feb-13 334.1 13,962.7 50.4 2,126.6 310.5 11,982.1 117.8 4,409.6 1,270.6 22,848.3 1,119.7 20,443.0
Mar-13 384.2 14,346.9 58.0 2,184.6 277.9 12,260.0 105.4 4,515.1 556.4 23,404.7 436.6 20,879.6
Apr-13 334.1 14,681.0 50.4 2,235.0 425.0 12,685.0 161.2 4,676.3 323.8 23,728.5 217.1 21,096.7
May-13 350.8 15,031.7 52.9 2,287.9 1,283.0 13,968.0 486.8 5,163.1 435.1 24,163.5 313.9 21,410.6
Jun-13 367.5 15,399.2 55.4 2,343.3 555.7 14,523.7 210.8 5,373.9 938.7 25,102.2 838.4 22,249.0
Jul-13 334.1 15,733.3 50.4 2,393.7 939.8 15,463.5 356.6 5,730.5 586.7 25,689.0 486.4 22,735.4
Aug-13 384.2 16,117.5 58.0 2,451.7 735.5 16,199.0 279.1 6,009.6 682.4 26,371.3 591.4 23,326.9
Sep-13 350.8 16,468.3 52.9 2,504.6 792.7 16,991.7 300.8 6,310.3 595.6 26,967.0 500.6 23,827.4
Oct-13 350.8 16,819.1 52.9 2,557.5 988.8 17,980.6 375.2 6,685.5 508.2 27,475.2 410.3 24,237.7
Nov-13 334.1 17,153.2 50.4 2,607.9 817.2 18,797.8 310.1 6,995.6 458.0 27,933.2 352.8 24,590.6
Dec-13 317.4 17,470.5 47.9 2,655.8 375.9 19,173.7 142.6 7,138.2 295.9 28,229.1 200.2 24,790.8
Jan-14 334.1 17,804.6 50.4 2,706.2 288.9 19,462.6 109.6 7,247.8 1,164.0 29,393.0 1,035.5 25,826.3
Feb-14 334.1 18,138.7 50.4 2,756.6 365.9 19,828.5 138.8 7,386.7 1,397.6 30,790.6 1,231.6 27,057.9
Mar-14 384.2 18,522.9 58.0 2,814.6 327.4 20,155.9 124.2 7,510.9 612.0 31,402.7 480.2 27,538.1
Apr-14 334.1 18,857.0 50.4 2,865.0 500.7 20,656.7 190.0 7,700.9 356.2 31,758.9 238.9 27,777.0
May-14 350.8 19,207.7 52.9 2,917.9 1,511.8 22,168.5 573.6 8,274.5 478.6 32,237.4 345.3 28,122.3
Jun-14 367.5 19,575.2 55.4 2,973.3 654.8 22,823.3 248.4 8,522.9 1,032.6 33,270.0 922.2 29,044.5
Jul-14 334.1 19,909.3 50.4 3,023.7 1,107.4 23,930.7 420.2 8,943.1 645.4 33,915.4 535.0 29,579.6
Aug-14 384.2 20,293.5 58.0 3,081.7 866.7 24,797.4 328.8 9,271.9 750.6 34,666.0 650.6 30,230.1
Sep-14 350.8 20,644.3 52.9 3,134.6 934.1 25,731.4 354.4 9,626.3 655.2 35,321.2 550.6 30,780.8
Oct-14 350.8 20,995.1 52.9 3,187.5 1,165.2 26,896.6 442.1 10,068.4 559.0 35,880.3 451.3 31,232.1
Nov-14 334.1 21,329.2 50.4 3,237.9 963.0 27,859.6 365.4 10,433.7 503.8 36,384.0 388.1 31,620.2
Dec-14 317.4 21,646.5 47.9 3,285.8 443.0 28,302.5 168.1 10,601.8 325.5 36,709.5 220.2 31,840.4
2009 578.1 578.1 89.0 89.0 657.7 657.7 222.3 222.3 1,704.2 1,704.2 1,600.0 1,600.0
2010 4,282.7 4,860.9 660.6 749.6 2,159.2 2,816.9 749.2 971.4 5,825.5 7,529.7 5,656.0 7,256.0
2011 4,257.7 9,118.5 646.2 1,395.8 3,425.0 6,241.9 1,260.3 2,231.7 5,981.2 13,510.9 5,299.8 12,555.8
2012 4,176.0 13,294.5 630.0 2,025.8 5,184.6 11,426.4 1,967.1 4,198.8 7,008.6 20,519.5 5,826.2 18,382.0
2013 4,176.0 17,470.5 630.0 2,655.8 7,747.3 19,173.7 2,939.4 7,138.2 7,709.5 28,229.1 6,408.8 24,790.8
2014 4,176.0 21,646.5 630.0 3,285.8 9,128.8 28,302.5 3,463.6 10,601.8 8,480.5 36,709.5 7,049.7 31,840.4
Energy Efficiency Program Impact Estimates at the Meter
NES Program Home Advantage HEIP Program

W/P D-3A
Page 2 of 3
Jan-09
Feb-09
Mar-09
Apr-09
May-09
Jun-09
Jul-09
Aug-09
Sep-09
Oct-09
Nov-09
Dec-09
Jan-10
Feb-10
Mar-10
Apr-10
May-10
Jun-10
Jul-10
Aug-10
Sep-10
Oct-10
Nov-10
Dec-10
Jan-11
Feb-11
Mar-11
Apr-11
May-11
Jun-11
Jul-11
Aug-11
Sep-11
Oct-11
Nov-11
Dec-11
Jan-12
Feb-12
Mar-12
Apr-12
May-12
Jun-12
Jul-12
Aug-12
Sep-12
Oct-12
Nov-12
Dec-12
Jan-13
Feb-13
Mar-13
Apr-13
May-13
Jun-13
Jul-13
Aug-13
Sep-13
Oct-13
Nov-13
Dec-13
Jan-14
Feb-14
Mar-14
Apr-14
May-14
Jun-14
Jul-14
Aug-14
Sep-14
Oct-14
Nov-14
Dec-14
2009
2010
2011
2012
2013
2014
MWH Σ MWH kW Σ kW MWH Σ MWH kW Σ kW MWH Σ MWH kW Σ kW- - - - - - - - - - - -
- - - - - - - - - - - -
- - - - - - - - - - - -
- - - - - - - - - - - -
- - - - - - - - - - - -
- - - - - - - - - - - -
- - - - - - - - - - - -
- - - - - - - - - - - -
- - - - - - - - - - - -
- - - - - - - - - - - -
- - - - - - - - - - - -
- - - - - - - - - - - -
363.0 363.0 18.6 18.6 - - - - - - - -
4,364.4 4,727.4 429.3 447.9 - - - - - - - -
8,284.0 13,011.4 784.9 1,232.7 - - - - - - - -
10,485.9 23,497.3 995.9 2,228.6 80.3 80.3 9.4 9.4 - - - -
1,116.6 24,614.0 113.9 2,342.5 400.6 480.9 46.6 56.0 - - - -
8,324.5 32,938.5 787.3 3,129.8 345.1 826.0 40.2 96.2 - - - -
5,666.7 38,605.2 535.9 3,665.7 251.9 1,077.9 24.7 120.8 - - - -
15,399.9 54,005.1 1,451.7 5,117.4 438.2 1,516.1 55.4 176.2 - - -
6,557.3 60,562.4 617.0 5,734.4 869.0 2,385.1 101.1 277.3 - - - -
8,394.1 68,956.5 794.2 6,528.6 668.0 3,053.1 77.8 355.1 - - - -
6,033.4 74,989.9 571.5 7,100.1 513.3 3,566.4 59.7 414.8 - - - -
1,562.1 76,552.0 152.5 7,252.6 459.3 4,025.7 53.5 468.3 - - - -
7,294.2 83,846.2 686.0 7,938.6 225.3 4,251.0 25.9 494.2 - - - -
4,172.2 88,018.3 395.0 8,333.6 268.0 4,519.0 31.1 525.3 - - - -
6,324.8 94,343.1 596.8 8,930.3 516.4 5,035.4 60.1 585.4 - - - -
6,937.3 101,280.4 657.2 9,587.5 773.9 5,809.3 168.8 754.2 - - - -
6,622.0 107,902.4 627.3 10,214.9 619.2 6,428.5 135.1 889.2 - - - -
6,306.6 114,209.0 597.5 10,812.3 464.4 6,892.9 101.3 990.5 14,400.0 14,400.0 2,585.0 2,585.0
5,360.6 119,569.6 507.8 11,320.2 495.3 7,388.2 108.0 1,098.6 - 14,400.0 - 2,585.0
5,360.6 124,930.3 507.8 11,828.0 619.2 8,007.4 135.1 1,233.6 - 14,400.0 - 2,585.0
6,937.3 131,867.6 657.2 12,485.2 773.9 8,781.3 168.8 1,402.5 - 14,400.0 - 2,585.0
6,937.3 138,804.8 657.2 13,142.4 619.2 9,400.5 135.1 1,537.5 - 14,400.0 - 2,585.0
6,306.6 145,111.5 597.5 13,739.9 464.4 9,864.9 101.3 1,638.8 - 14,400.0 - 2,585.0
5,627.1 150,738.6 533.1 14,273.0 469.3 10,334.1 102.4 1,741.2 - 14,400.0 - 2,585.0
6,564.6 157,303.2 621.9 14,894.9 281.3 10,615.5 61.4 1,802.5 - 14,400.0 - 2,585.0
3,754.8 161,058.0 355.7 15,250.6 338.8 10,954.3 73.9 1,876.4 - 14,400.0 - 2,585.0
5,959.8 167,017.8 564.6 15,815.2 759.3 11,713.5 165.6 2,042.1 - 14,400.0 - 2,585.0
6,243.6 173,261.3 591.5 16,406.7 948.8 12,662.4 207.0 2,249.0 - 14,400.0 - 2,585.0
5,959.8 179,221.1 564.6 16,971.3 759.3 13,421.6 165.6 2,414.7 - 14,400.0 - 2,585.0
5,676.0 184,897.0 537.7 17,509.0 569.7 13,991.4 124.3 2,538.9 14,400.0 14,400.0 2,585.0 2,585.0
4,824.6 189,721.6 457.1 17,966.0 607.0 14,598.4 132.4 2,671.3 - 14,400.0 - 2,585.0
4,824.6 194,546.2 457.1 18,423.1 759.3 15,357.6 165.6 2,837.0 - 14,400.0 - 2,585.0
6,243.6 200,789.7 591.5 19,014.6 948.8 16,306.5 207.0 3,043.9 - 14,400.0 - 2,585.0
6,243.6 207,033.3 591.5 19,606.0 759.3 17,065.8 165.6 3,209.5 - 14,400.0 - 2,585.0
5,676.0 212,709.3 537.7 20,143.8 569.7 17,635.5 124.3 3,333.8 - 14,400.0 - 2,585.0
5,064.4 217,773.7 479.8 20,623.5 574.7 18,210.2 125.4 3,459.2 - 14,400.0 - 2,585.0
5,251.7 223,025.4 497.5 21,121.1 334.7 18,544.9 73.0 3,532.2 - 14,400.0 - 2,585.0
3,003.8 226,029.2 284.6 21,405.6 403.1 18,948.1 87.9 3,620.1 - 14,400.0 - 2,585.0
4,767.8 230,797.0 451.7 21,857.3 903.4 19,851.5 197.1 3,817.2 - 14,400.0 - 2,585.0
4,994.8 235,791.9 473.2 22,330.5 1,129.0 20,980.5 246.3 4,063.5 - 14,400.0 - 2,585.0
4,767.8 240,559.7 451.7 22,782.2 903.4 21,883.9 197.1 4,260.5 - 14,400.0 - 2,585.0
4,540.8 245,100.4 430.2 23,212.3 677.9 22,561.8 147.9 4,408.4 11,520.0 11,520.0 2,068.0 2,068.0
3,859.7 248,960.1 365.6 23,578.0 722.3 23,284.0 157.5 4,565.9 - 11,520.0 - 2,068.0
3,859.7 252,819.7 365.6 23,943.6 903.4 24,187.5 197.1 4,763.0 - 11,520.0 - 2,068.0
4,994.8 257,814.6 473.2 24,416.8 1,129.0 25,316.4 246.3 5,009.3 - 11,520.0 - 2,068.0
4,994.8 262,809.4 473.2 24,890.0 903.4 26,219.9 197.1 5,206.3 - 11,520.0 - 2,068.0
4,540.8 267,350.2 430.2 25,320.2 677.9 26,897.7 147.9 5,354.2 - 11,520.0 - 2,068.0
4,051.5 271,401.7 383.8 25,704.0 683.9 27,581.6 149.2 5,503.4 - 11,520.0 - 2,068.0
4,201.3 275,603.1 398.0 26,102.0 391.0 27,972.6 85.3 5,588.7 - 11,520.0 - 2,068.0
2,403.1 278,006.2 227.7 26,329.7 470.9 28,443.4 102.7 5,691.4 - 11,520.0 - 2,068.0
3,814.2 281,820.4 361.3 26,691.0 1,055.2 29,498.7 230.2 5,921.5 - 11,520.0 - 2,068.0
3,995.9 285,816.3 378.5 27,069.6 1,318.7 30,817.4 287.6 6,209.2 - 11,520.0 - 2,068.0
3,814.2 289,630.5 361.3 27,430.9 1,055.2 31,872.6 230.2 6,439.4 - 11,520.0 - 2,068.0
3,632.6 293,263.1 344.1 27,775.0 791.8 32,664.4 172.7 6,612.1 14,400.0 14,400.0 2,585.0 2,585.0
3,087.7 296,350.9 292.5 28,067.5 843.6 33,508.0 184.0 6,796.1 - 14,400.0 - 2,585.0
3,087.7 299,438.6 292.5 28,360.1 1,055.2 34,563.2 230.2 7,026.3 - 14,400.0 - 2,585.0
3,995.9 303,434.5 378.5 28,738.6 1,318.7 35,881.9 287.6 7,313.9 - 14,400.0 - 2,585.0
3,995.9 307,430.3 378.5 29,117.2 1,055.2 36,937.1 230.2 7,544.1 - 14,400.0 - 2,585.0
3,632.6 311,063.0 344.1 29,461.3 791.8 37,728.9 172.7 7,716.8 - 14,400.0 - 2,585.0
3,241.2 314,304.2 307.1 29,768.4 798.8 38,527.7 174.2 7,891.1 - 14,400.0 - 2,585.0
- - - - - - - - - - - -
76,552.0 76,552.0 7,252.6 7,252.6 4,025.7 4,025.7 468.3 468.3 - - - -
74,186.6 150,738.6 7,020.4 14,273.0 6,308.4 10,334.1 1,272.9 1,741.2 14,400.0 14,400.0 2,585.0 2,585.0
67,035.1 217,773.7 6,350.6 20,623.5 7,876.1 18,210.2 1,718.0 3,459.2 - 14,400.0 - 2,585.0
53,628.1 271,401.7 5,080.5 25,704.0 9,371.4 27,581.6 2,044.2 5,503.4 (2,880.0) 11,520.0 (517.0) 2,068.0
42,902.4 314,304.2 4,064.4 29,768.4 10,946.1 38,527.7 2,387.7 7,891.1 2,880.0 14,400.0 517.0 2,585.0
Energy Efficiency Program Impact Estimates at the Meter
Residential Behavorial ProgramRes Lighting Appliance Recycling

W/P D-3A
Page 3 of 3
Jan-09
Feb-09
Mar-09
Apr-09
May-09
Jun-09
Jul-09
Aug-09
Sep-09
Oct-09
Nov-09
Dec-09
Jan-10
Feb-10
Mar-10
Apr-10
May-10
Jun-10
Jul-10
Aug-10
Sep-10
Oct-10
Nov-10
Dec-10
Jan-11
Feb-11
Mar-11
Apr-11
May-11
Jun-11
Jul-11
Aug-11
Sep-11
Oct-11
Nov-11
Dec-11
Jan-12
Feb-12
Mar-12
Apr-12
May-12
Jun-12
Jul-12
Aug-12
Sep-12
Oct-12
Nov-12
Dec-12
Jan-13
Feb-13
Mar-13
Apr-13
May-13
Jun-13
Jul-13
Aug-13
Sep-13
Oct-13
Nov-13
Dec-13
Jan-14
Feb-14
Mar-14
Apr-14
May-14
Jun-14
Jul-14
Aug-14
Sep-14
Oct-14
Nov-14
Dec-14
2009
2010
2011
2012
2013
2014
MWH Σ MWH kW Σ kW MWH Σ MWH kW Σ kW MWH Σ MWH kW Σ kW- 6,706.0 - 630.0 - - - - 45.4 6,751.4 16.1 646.1
- 6,706.0 - 630.0 - - - - 16.1 6,767.5 5.6 651.7
- 6,706.0 - 630.0 - - - - 52.2 6,819.7 17.4 669.1
- 6,706.0 - 630.0 765.4 765.4 176.8 176.8 820.3 7,640.0 197.8 866.9
- 6,706.0 - 630.0 930.9 1,696.3 215.9 392.7 1,053.6 8,693.6 306.0 1,172.9
- 6,706.0 - 630.0 765.2 2,461.5 244.3 637.0 917.8 9,611.4 348.6 1,521.5
- 6,706.0 - 630.0 2,335.8 4,797.4 487.5 1,124.4 2,582.0 12,193.4 703.0 2,224.5
- 6,706.0 - 630.0 1,384.5 6,181.8 392.7 1,517.1 1,712.8 13,906.2 671.3 2,895.8
- 6,706.0 - 630.0 2,518.4 8,700.2 437.4 1,954.6 2,887.0 16,793.2 743.1 3,638.8
- 6,706.0 - 630.0 2,885.6 11,585.9 514.7 2,469.3 3,421.7 20,215.0 904.9 4,543.7
- 6,706.0 - 630.0 1,762.2 13,348.1 397.8 2,867.1 2,594.8 22,809.8 786.8 5,330.5
- 6,706.0 - 630.0 214.0 13,562.1 49.2 2,916.3 398.4 23,208.2 127.0 5,457.5
- 6,706.0 - 630.0 3,749.0 17,311.1 739.2 3,655.5 5,275.8 28,484.0 1,605.5 7,063.0
- 6,706.0 - 630.0 2,338.2 19,649.3 473.7 4,129.1 7,434.2 35,918.2 1,299.4 8,362.5
- 6,706.0 - 630.0 3,635.7 23,284.9 832.0 4,961.1 12,732.7 48,650.9 2,121.1 10,483.5
- 6,706.0 - 630.0 2,768.8 26,053.8 489.2 5,450.3 14,432.1 63,083.0 2,232.7 12,716.3
- 6,706.0 - 630.0 2,715.7 28,769.5 697.7 6,147.9 5,434.4 68,517.5 1,610.7 14,327.0
- 6,706.0 - 630.0 1,448.3 30,217.8 372.8 6,520.8 11,340.2 79,857.7 2,010.2 16,337.2
- 6,706.0 - 630.0 1,984.8 32,202.6 492.8 7,013.6 9,133.0 88,990.7 1,769.1 18,106.3
- 6,706.0 - 630.0 3,403.6 35,606.2 670.4 7,684.0 20,374.2 109,364.9 2,833.0 20,939.3
- 6,706.0 - 630.0 1,418.2 37,024.3 234.8 7,918.8 9,939.3 119,304.2 1,512.6 22,451.9
- 6,706.0 - 630.0 4,072.6 41,097.0 713.2 8,632.0 14,274.0 133,578.1 2,172.6 24,624.4
- 6,706.0 - 630.0 3,346.2 44,443.2 780.2 9,412.2 10,840.1 144,418.3 1,809.1 26,433.5
- 6,706.0 - 630.0 1,877.1 46,320.3 255.4 9,667.6 4,393.2 148,811.5 562.1 26,995.6
- 6,706.0 - 630.0 3,069.0 49,389.3 749.0 10,416.6 13,419.7 162,231.2 3,528.0 30,523.6
- 6,706.0 - 630.0 4,689.5 54,078.8 1,108.8 11,525.5 10,036.6 172,267.8 1,883.0 32,406.6
- 6,706.0 - 630.0 4,434.4 58,513.2 1,045.8 12,571.3 12,057.8 184,325.6 1,929.3 34,335.9
- 6,706.0 - 630.0 3,035.0 61,548.2 738.0 13,309.3 11,398.1 195,723.7 1,843.5 36,179.4
- 6,706.0 - 630.0 3,219.0 64,767.2 782.0 14,091.3 11,528.1 207,251.8 2,047.0 38,226.4
- 6,706.0 - 630.0 3,314.0 68,081.2 806.0 14,897.3 25,754.0 233,005.9 4,894.6 43,121.0
- 6,706.0 - 630.0 3,412.0 71,493.2 829.0 15,726.3 10,347.2 243,353.1 2,003.4 45,124.4
- 6,706.0 - 630.0 3,513.0 75,006.2 854.0 16,580.3 10,668.8 254,021.9 2,134.5 47,259.0
- 6,706.0 - 630.0 3,617.0 78,623.2 879.0 17,459.3 12,453.9 266,475.8 2,275.1 49,534.0
- 6,706.0 - 630.0 3,724.0 82,347.2 905.0 18,364.3 12,392.0 278,867.9 2,213.6 51,747.6
- 6,706.0 - 630.0 3,834.0 86,181.2 932.0 19,296.3 11,599.6 290,467.5 2,072.5 53,820.1
- 6,706.0 - 630.0 3,625.0 89,806.2 879.0 20,175.3 10,388.7 300,856.2 1,767.6 55,587.7
- 6,706.0 - 630.0 3,166.0 92,972.2 770.0 20,945.3 11,472.0 312,328.2 2,421.7 58,009.5
- 6,706.0 - 630.0 3,259.0 96,231.2 793.0 21,738.3 9,049.6 321,377.8 2,369.7 60,379.2
- 6,706.0 - 630.0 3,356.0 99,587.2 816.0 22,554.3 11,151.0 332,528.8 2,071.6 62,450.8
- 6,706.0 - 630.0 3,455.0 103,042.2 840.0 23,394.3 11,560.2 344,089.0 1,994.2 64,444.9
- 6,706.0 - 630.0 3,639.0 106,681.2 885.0 24,279.3 11,962.9 356,052.0 2,279.3 66,724.2
- 6,706.0 - 630.0 3,734.0 110,415.2 908.0 25,187.3 25,972.4 367,624.4 5,113.7 69,253.0
- 6,706.0 - 630.0 3,832.0 114,247.2 932.0 26,119.3 10,760.0 378,384.4 2,252.7 71,505.6
- 6,706.0 - 630.0 3,933.0 118,180.2 957.0 27,076.3 11,013.6 389,397.9 2,362.0 73,867.7
- 6,706.0 - 630.0 4,037.0 122,217.2 982.0 28,058.3 12,652.2 402,050.1 2,489.7 76,357.4
- 6,706.0 - 630.0 4,144.0 126,361.2 1,008.0 29,066.3 12,621.4 414,671.5 2,442.1 78,799.5
- 6,706.0 - 630.0 4,254.0 130,615.2 1,035.0 30,101.3 11,797.0 426,468.5 2,275.6 81,075.1
- 6,706.0 - 630.0 4,368.0 134,983.2 1,063.0 31,164.3 10,845.1 437,313.6 1,993.5 83,068.6
- 6,706.0 - 630.0 3,586.0 138,569.2 872.0 32,036.3 10,809.8 448,123.4 2,527.3 85,595.9
- 6,706.0 - 630.0 3,679.0 142,248.2 895.0 32,931.3 9,001.2 457,124.6 2,555.4 88,151.3
- 6,706.0 - 630.0 3,776.0 146,024.2 919.0 33,850.3 10,665.7 467,790.2 2,167.7 90,319.0
- 6,706.0 - 630.0 3,875.0 149,899.2 943.0 34,793.3 11,081.7 478,871.9 2,091.2 92,410.2
- 6,706.0 - 630.0 4,059.0 153,958.2 987.0 35,780.3 11,799.1 490,671.0 2,489.4 94,899.6
- 6,706.0 - 630.0 4,154.0 158,112.2 1,011.0 36,791.3 22,754.5 499,025.6 4,761.7 97,076.3
- 6,706.0 - 630.0 4,252.0 162,364.2 1,034.0 37,825.3 10,694.5 509,720.1 2,450.6 99,526.9
- 6,706.0 - 630.0 4,353.0 166,717.2 1,059.0 38,884.3 10,918.1 520,638.2 2,550.1 102,077.0
- 6,706.0 - 630.0 4,457.0 171,174.2 1,084.0 39,968.3 12,320.0 532,958.2 2,657.7 104,734.8
- 6,706.0 - 630.0 4,564.0 175,738.2 1,110.0 41,078.3 12,310.1 545,268.3 2,618.7 107,353.4
- 6,706.0 - 630.0 4,674.0 180,412.2 1,137.0 42,215.3 11,501.9 556,770.2 2,428.3 109,781.7
- 6,706.0 - 630.0 4,788.0 185,200.2 1,165.0 43,380.3 10,512.6 567,282.8 2,088.7 111,870.4
- 6,706.0 - 630.0 3,700.0 188,900.2 900.3 44,280.5 10,079.3 577,362.1 2,579.1 114,449.5
- 6,706.0 - 630.0 3,900.0 192,800.2 948.9 45,229.5 8,871.6 586,233.6 2,700.2 117,149.7
- 6,706.0 - 630.0 4,000.0 196,800.2 973.3 46,202.7 10,193.1 596,426.7 2,227.2 119,376.9
- 6,706.0 - 630.0 4,100.0 200,900.2 997.6 47,200.3 10,605.6 607,032.3 2,143.0 121,519.9
- 6,706.0 - 630.0 4,300.0 205,200.2 1,046.3 48,246.6 11,510.7 618,543.0 2,609.6 124,129.6
- 6,706.0 - 630.0 4,400.0 209,600.2 1,070.6 49,317.2 25,279.3 632,302.2 5,398.6 127,460.1
- 6,706.0 - 630.0 4,500.0 214,100.2 1,094.9 50,412.1 10,518.2 642,820.5 2,577.1 130,037.2
- 6,706.0 - 630.0 4,600.0 218,700.2 1,119.3 51,531.4 10,744.4 653,564.9 2,679.3 132,716.5
- 6,706.0 - 630.0 4,700.0 223,400.2 1,143.6 52,675.0 11,954.6 665,519.5 2,767.7 135,484.2
- 6,706.0 - 630.0 4,900.0 228,300.2 1,192.3 53,867.2 12,026.1 677,545.6 2,747.3 138,231.5
- 6,706.0 - 630.0 4,900.0 233,200.2 1,192.3 55,059.5 11,125.2 688,670.8 2,513.0 140,744.5
- 6,706.0 - 630.0 5,000.0 238,200.2 1,216.6 56,276.1 10,125.8 698,796.6 2,134.0 142,878.5
6,706.0 6,706.0 630.0 630.0 13,562.1 13,562.1 2,916.3 2,916.3 23,208.2 23,208.2 5,457.5 5,457.5
- 6,706.0 - 630.0 32,758.2 46,320.3 6,751.4 9,667.6 125,603.3 148,811.5 21,538.1 26,995.6
- 6,706.0 - 630.0 43,485.8 89,806.2 10,507.6 20,175.3 152,044.7 300,856.2 28,592.2 55,587.7
- 6,706.0 - 630.0 45,177.0 134,983.2 10,989.0 31,164.3 136,457.4 437,313.6 27,480.9 83,068.6
- 6,706.0 - 630.0 50,217.0 185,200.2 12,216.0 43,380.3 129,969.2 567,282.8 28,801.8 111,870.4
- 6,706.0 - 630.0 53,000.0 238,200.2 12,895.8 56,276.1 131,513.8 698,796.6 31,008.1 142,878.5
Total Energy Efficiency Program Values
Energy Efficiency Program Impact Estimates at the Meter
Home Depot CFL Program EEBusiness
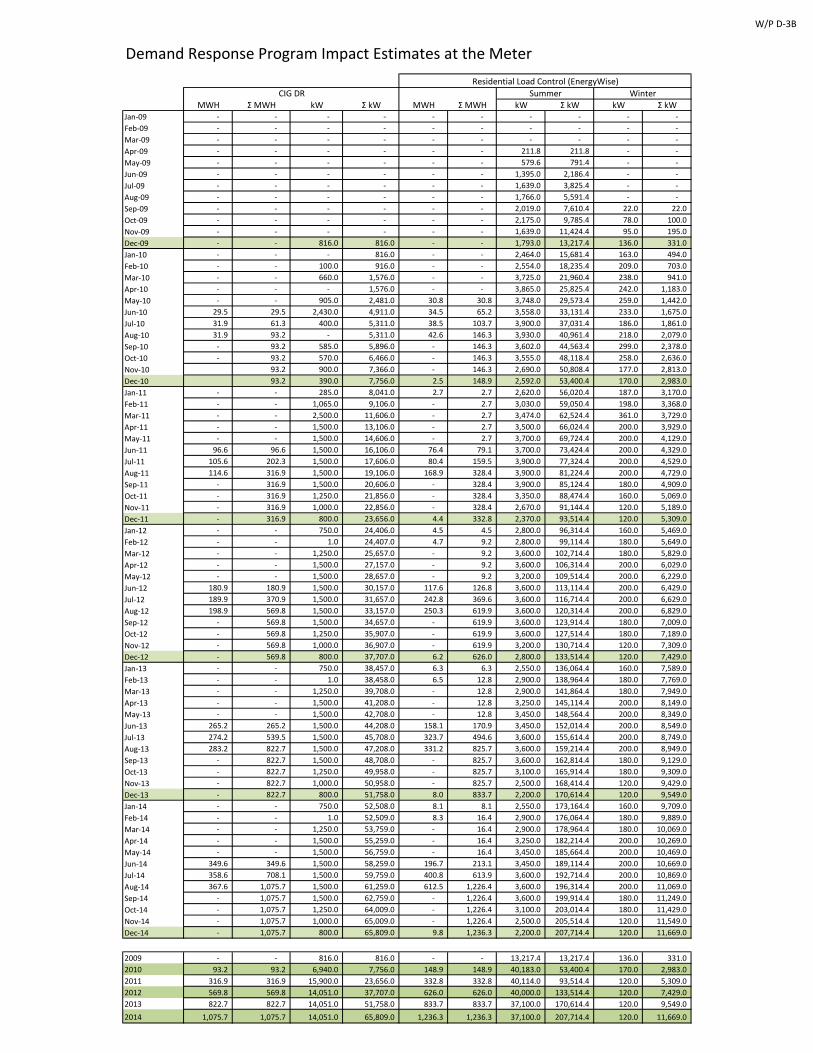
W/P D-3B
Demand Response Program Impact Estimates at the Meter
MWH Σ MWH kW Σ kW MWH Σ MWH kW Σ kW kW Σ kWJan-09 - - - - - - - - - -
Feb-09 - - - - - - - - - -
Mar-09 - - - - - - - - - -
Apr-09 - - - - - - 211.8 211.8 - -
May-09 - - - - - - 579.6 791.4 - -
Jun-09 - - - - - - 1,395.0 2,186.4 - -
Jul-09 - - - - - - 1,639.0 3,825.4 - -
Aug-09 - - - - - - 1,766.0 5,591.4 - -
Sep-09 - - - - - - 2,019.0 7,610.4 22.0 22.0
Oct-09 - - - - - - 2,175.0 9,785.4 78.0 100.0
Nov-09 - - - - - - 1,639.0 11,424.4 95.0 195.0
Dec-09 - - 816.0 816.0 - - 1,793.0 13,217.4 136.0 331.0
Jan-10 - - - 816.0 - - 2,464.0 15,681.4 163.0 494.0
Feb-10 - - 100.0 916.0 - - 2,554.0 18,235.4 209.0 703.0
Mar-10 - - 660.0 1,576.0 - - 3,725.0 21,960.4 238.0 941.0
Apr-10 - - - 1,576.0 - - 3,865.0 25,825.4 242.0 1,183.0
May-10 - - 905.0 2,481.0 30.8 30.8 3,748.0 29,573.4 259.0 1,442.0
Jun-10 29.5 29.5 2,430.0 4,911.0 34.5 65.2 3,558.0 33,131.4 233.0 1,675.0
Jul-10 31.9 61.3 400.0 5,311.0 38.5 103.7 3,900.0 37,031.4 186.0 1,861.0
Aug-10 31.9 93.2 - 5,311.0 42.6 146.3 3,930.0 40,961.4 218.0 2,079.0
Sep-10 - 93.2 585.0 5,896.0 - 146.3 3,602.0 44,563.4 299.0 2,378.0
Oct-10 - 93.2 570.0 6,466.0 - 146.3 3,555.0 48,118.4 258.0 2,636.0
Nov-10 93.2 900.0 7,366.0 - 146.3 2,690.0 50,808.4 177.0 2,813.0
Dec-10 93.2 390.0 7,756.0 2.5 148.9 2,592.0 53,400.4 170.0 2,983.0
Jan-11 - - 285.0 8,041.0 2.7 2.7 2,620.0 56,020.4 187.0 3,170.0
Feb-11 - - 1,065.0 9,106.0 - 2.7 3,030.0 59,050.4 198.0 3,368.0
Mar-11 - - 2,500.0 11,606.0 - 2.7 3,474.0 62,524.4 361.0 3,729.0
Apr-11 - - 1,500.0 13,106.0 - 2.7 3,500.0 66,024.4 200.0 3,929.0
May-11 - - 1,500.0 14,606.0 - 2.7 3,700.0 69,724.4 200.0 4,129.0
Jun-11 96.6 96.6 1,500.0 16,106.0 76.4 79.1 3,700.0 73,424.4 200.0 4,329.0
Jul-11 105.6 202.3 1,500.0 17,606.0 80.4 159.5 3,900.0 77,324.4 200.0 4,529.0
Aug-11 114.6 316.9 1,500.0 19,106.0 168.9 328.4 3,900.0 81,224.4 200.0 4,729.0
Sep-11 - 316.9 1,500.0 20,606.0 - 328.4 3,900.0 85,124.4 180.0 4,909.0
Oct-11 - 316.9 1,250.0 21,856.0 - 328.4 3,350.0 88,474.4 160.0 5,069.0
Nov-11 - 316.9 1,000.0 22,856.0 - 328.4 2,670.0 91,144.4 120.0 5,189.0
Dec-11 - 316.9 800.0 23,656.0 4.4 332.8 2,370.0 93,514.4 120.0 5,309.0
Jan-12 - - 750.0 24,406.0 4.5 4.5 2,800.0 96,314.4 160.0 5,469.0
Feb-12 - - 1.0 24,407.0 4.7 9.2 2,800.0 99,114.4 180.0 5,649.0
Mar-12 - - 1,250.0 25,657.0 - 9.2 3,600.0 102,714.4 180.0 5,829.0
Apr-12 - - 1,500.0 27,157.0 - 9.2 3,600.0 106,314.4 200.0 6,029.0
May-12 - - 1,500.0 28,657.0 - 9.2 3,200.0 109,514.4 200.0 6,229.0
Jun-12 180.9 180.9 1,500.0 30,157.0 117.6 126.8 3,600.0 113,114.4 200.0 6,429.0
Jul-12 189.9 370.9 1,500.0 31,657.0 242.8 369.6 3,600.0 116,714.4 200.0 6,629.0
Aug-12 198.9 569.8 1,500.0 33,157.0 250.3 619.9 3,600.0 120,314.4 200.0 6,829.0
Sep-12 - 569.8 1,500.0 34,657.0 - 619.9 3,600.0 123,914.4 180.0 7,009.0
Oct-12 - 569.8 1,250.0 35,907.0 - 619.9 3,600.0 127,514.4 180.0 7,189.0
Nov-12 - 569.8 1,000.0 36,907.0 - 619.9 3,200.0 130,714.4 120.0 7,309.0
Dec-12 - 569.8 800.0 37,707.0 6.2 626.0 2,800.0 133,514.4 120.0 7,429.0
Jan-13 - - 750.0 38,457.0 6.3 6.3 2,550.0 136,064.4 160.0 7,589.0
Feb-13 - - 1.0 38,458.0 6.5 12.8 2,900.0 138,964.4 180.0 7,769.0
Mar-13 - - 1,250.0 39,708.0 - 12.8 2,900.0 141,864.4 180.0 7,949.0
Apr-13 - - 1,500.0 41,208.0 - 12.8 3,250.0 145,114.4 200.0 8,149.0
May-13 - - 1,500.0 42,708.0 - 12.8 3,450.0 148,564.4 200.0 8,349.0
Jun-13 265.2 265.2 1,500.0 44,208.0 158.1 170.9 3,450.0 152,014.4 200.0 8,549.0
Jul-13 274.2 539.5 1,500.0 45,708.0 323.7 494.6 3,600.0 155,614.4 200.0 8,749.0
Aug-13 283.2 822.7 1,500.0 47,208.0 331.2 825.7 3,600.0 159,214.4 200.0 8,949.0
Sep-13 - 822.7 1,500.0 48,708.0 - 825.7 3,600.0 162,814.4 180.0 9,129.0
Oct-13 - 822.7 1,250.0 49,958.0 - 825.7 3,100.0 165,914.4 180.0 9,309.0
Nov-13 - 822.7 1,000.0 50,958.0 - 825.7 2,500.0 168,414.4 120.0 9,429.0
Dec-13 - 822.7 800.0 51,758.0 8.0 833.7 2,200.0 170,614.4 120.0 9,549.0
Jan-14 - - 750.0 52,508.0 8.1 8.1 2,550.0 173,164.4 160.0 9,709.0
Feb-14 - - 1.0 52,509.0 8.3 16.4 2,900.0 176,064.4 180.0 9,889.0
Mar-14 - - 1,250.0 53,759.0 - 16.4 2,900.0 178,964.4 180.0 10,069.0
Apr-14 - - 1,500.0 55,259.0 - 16.4 3,250.0 182,214.4 200.0 10,269.0
May-14 - - 1,500.0 56,759.0 - 16.4 3,450.0 185,664.4 200.0 10,469.0
Jun-14 349.6 349.6 1,500.0 58,259.0 196.7 213.1 3,450.0 189,114.4 200.0 10,669.0
Jul-14 358.6 708.1 1,500.0 59,759.0 400.8 613.9 3,600.0 192,714.4 200.0 10,869.0
Aug-14 367.6 1,075.7 1,500.0 61,259.0 612.5 1,226.4 3,600.0 196,314.4 200.0 11,069.0
Sep-14 - 1,075.7 1,500.0 62,759.0 - 1,226.4 3,600.0 199,914.4 180.0 11,249.0
Oct-14 - 1,075.7 1,250.0 64,009.0 - 1,226.4 3,100.0 203,014.4 180.0 11,429.0
Nov-14 - 1,075.7 1,000.0 65,009.0 - 1,226.4 2,500.0 205,514.4 120.0 11,549.0
Dec-14 - 1,075.7 800.0 65,809.0 9.8 1,236.3 2,200.0 207,714.4 120.0 11,669.0
2009 - - 816.0 816.0 - - 13,217.4 13,217.4 136.0 331.0
2010 93.2 93.2 6,940.0 7,756.0 148.9 148.9 40,183.0 53,400.4 170.0 2,983.0
2011 316.9 316.9 15,900.0 23,656.0 332.8 332.8 40,114.0 93,514.4 120.0 5,309.0
2012 569.8 569.8 14,051.0 37,707.0 626.0 626.0 40,000.0 133,514.4 120.0 7,429.0
2013 822.7 822.7 14,051.0 51,758.0 833.7 833.7 37,100.0 170,614.4 120.0 9,549.0
2014 1,075.7 1,075.7 14,051.0 65,809.0 1,236.3 1,236.3 37,100.0 207,714.4 120.0 11,669.0
Residential Load Control (EnergyWise)
WinterSummerCIG DR

W/P D‐5
2009 VintageResidential Home
Energy Improvement
1 Present Value of Avoided Costs W/P D-5A 3,417,121$
2 Present Value of Program Costs Docket 2010-161-E W/P D-1 2,809,135
3 Net Program Benefits 607,986$
4 SC Allocation Factor Line C 15.02%
5 SC Allocated Utility Cost Test Lines 3 X 4 91,347$
6 DSM Program Incentive at 8% Lines 5 X 8%
7 EE Program Incentive at 13% Lines 5 X 13% 11,875$
8 Program Performance Incentive (PPI) Lines 6 + 7 11,875$
9 Income Tax Rate Docket 2010-161-E W/P D-1C 37.68%
10 Income Taxes - (Lines 8 X 9) (4,475)$
11 Net‐of‐Tax PPI ‐ Total NPV Lines 9 + 10 7,401$
12 Rev Vintage Year 2009 ‐ Year 1 PPILine 11 x 0.089234 x (1 + 0.089234 )10
(1 + 0.089234 ) 10 - 1 1,149$
13 Income Tax Gross‐Up Factor 1 - Line 9 62.32%
14 Adjusted PPI Line 12 / Line 13 1,844$
15 PPI Values for Test Period Line 14 1,844$
16 Original Vintage 2009 PPI Docket 2010-161-E W/P D-1 9,314
17 PPI Over / (Under) Collection Line 16 - Line 15 7,470$
Allocation FactorsA 01‐2009 thru 04‐2009 Docket 2010-161-E 15.19%B 05‐2009 thru 12‐2009 Docket 2010-161-E 14.94%C Weighted Allocation (Line A x 4 + Line B x 8) / 12 15.02%
D 01‐2010 thru 04‐2010 Docket 2010-161-E 14.94%E 05‐2010 thru 12‐2010 Docket 2010-161-E 14.59%F Weighted Allocation (Line D x 4 + Line B x 8) / 12 14.71%
Progress Energy Carolinas, Inc.Calculation of Revised Program Performance Incentives

W/P D‐5A
PEC Residential Home Energy Improvement - Vintage Year-2009
BENEFITS(1) (2) (3) (4)
TOTAL AVOIDED AVOIDEDFUEL & O&M T&D CAP. GEN. CAP. TOTAL
SAVINGS COSTS COSTS BENEFITSYEAR $(000) $(000) $(000) $(000)2009 98 92 117 3062010 101 73 93 2672011 106 76 96 2782012 110 78 98 2872013 139 80 101 3202014 146 83 104 3332015 158 85 108 3502016 168 87 111 3662017 182 90 114 3852018 202 92 118 4122019 190 94 121 4062020 178 97 125 3992021 188 100 128 4162022 210 102 132 4452023 223 105 136 4642024 144 59 76 2802025 152 60 79 2912026 165 62 81 3082027 104 35 46 1852028 110 36 47 1932029 0 0 0 02030 0 0 0 02031 0 0 0 02032 0 0 0 02033 0 0 0 02034 0 0 0 02035 0 0 0 02036 0 0 0 02037 0 0 0 02038 0 0 0 0
NOMINAL 3,074 1,586 2,031 6,692
NPV 1,496 845 1,077 3,417
Present Value: i=8.46% 3,417,121

Workpapers Section R – DSM/EE Revenues

W/P R-2Page 1 of 2
A. SC DSM Program Recovery
General Service
Residential Billing Amounts Opt-Out Credits Net Billings Lighting Total
1 Apr-10 W/P R-4 SC 04-10 10,253.09$ 10,209.57$ (6,109.54)$ 4,100.03$ -$ 14,353.12$
2 May-10 W/P R-4 SC 05-10 9,252.33 9,466.45 (5,434.93) 4,031.52 - 13,283.85
3 Jun-10 W/P R-4 SC 06-10 13,739.87 11,437.57 (6,337.64) 5,099.93 - 18,839.80
4 Jul-10 W/P R-4 SC 07-10 56,597.46 18,027.24 (9,828.84) 8,198.40 - 64,795.86
5 Aug-10 W/P R-4 SC 08-10 57,709.47 17,792.47 (9,399.17) 8,393.30 - 66,102.77
6 Sep-10 W/P R-4 SC 09-10 51,080.34 17,515.19 (9,321.50) 8,193.69 - 59,274.03
7 Oct-10 W/P R-4 SC 10-10 35,006.33 16,106.16 (9,118.74) 6,987.42 - 41,993.75
8 Nov-10 W/P R-4 SC 11-10 31,356.58 15,526.44 (9,988.66) 5,537.78 - 36,894.36
9 Dec-10 W/P R-4 SC 12-10 56,372.37 13,249.40 (6,562.61) 6,686.79 - 63,059.16
10 Jan-11 W/P R-4 SC 01-11 75,439.73 17,034.07 (9,805.29) 7,228.78 - 82,668.51
11 Feb-11 W/P R-4 SC 02-11 55,835.74 14,406.31 (8,152.89) 6,253.42 - 62,089.16
12 Mar-11 W/P R-4 SC 03-11 39,458.56 12,342.53 (6,337.52) 6,005.01 - 45,463.57
13 Period Totals Σ Lines 1 thru 12 492,101.87$ 173,113.40$ (96,397.33)$ 76,716.07$ -$ 568,817.94$
B. SC DSDR Program Recovery
General Service
Residential Billing Amounts Opt-Out Credits Net Billings Lighting Total
14 Apr-10 W/P R-4 SC 04-10 65,398.08$ 104,730.40$ (62,672.03)$ 42,058.37$ -$ 107,456.45$
15 May-10 W/P R-4 SC 05-10 59,014.83 97,107.56 (55,751.90) 41,355.66 - 100,370.49
16 Jun-10 W/P R-4 SC 06-10 87,589.76 117,357.28 (65,040.21) 52,317.07 - 139,906.83
17 Jul-10 W/P R-4 SC 07-10 158,605.84 196,338.22 (107,048.91) 89,289.31 - 247,895.15
18 Aug-10 W/P R-4 SC 08-10 161,633.52 193,783.62 (102,369.21) 91,414.41 - 253,047.93
19 Sep-10 W/P R-4 SC 09-10 143,060.56 190,762.52 (101,523.29) 89,239.23 - 232,299.79
20 Oct-10 W/P R-4 SC 10-10 98,045.93 175,415.61 (99,314.92) 76,100.69 - 174,146.62
21 Nov-10 W/P R-4 SC 11-10 87,823.04 169,103.98 (108,789.50) 60,314.48 - 148,137.52
22 Dec-10 W/P R-4 SC 12-10 157,888.81 144,303.31 (71,475.39) 72,827.92 - 230,716.73
23 Jan-11 W/P R-4 SC 01-11 211,294.32 185,523.21 (106,792.37) 78,730.84 - 290,025.16
24 Feb-11 W/P R-4 SC 02-11 156,404.24 156,903.51 (88,795.56) 68,107.95 - 224,512.19
25 Mar-11 W/P R-4 SC 03-11 110,498.72 134,426.34 (69,023.84) 65,402.50 - 175,901.22
26 Period Totals Σ Lines 14 thru 25 1,497,257.65$ 1,865,755.56$ (1,038,597.13)$ 827,158.43$ -$ 2,324,416.08$
C. SC EE Program Recovery
General Service
Residential Billing Amounts Opt-Out Credits Net Billings Lighting Total
27 Apr-10 W/P R-4 SC 04-10 32,421.93$ 69,490.92$ (41,584.27)$ 27,906.65$ -$ 60,328.58$
28 May-10 W/P R-4 SC 05-10 29,257.35 64,433.02 (36,992.62) 27,440.40 - 56,697.75
29 Jun-10 W/P R-4 SC 06-10 43,450.29 77,952.05 (43,233.98) 34,718.07 - 78,168.36
30 Jul-10 W/P R-4 SC 07-10 189,803.92 161,846.76 (88,245.91) 73,600.85 - 263,404.77
31 Aug-10 W/P R-4 SC 08-10 193,537.84 159,746.65 (84,388.19) 75,358.46 - 268,896.30
32 Sep-10 W/P R-4 SC 09-10 171,306.32 157,253.22 (83,690.86) 73,562.36 - 244,868.68
33 Oct-10 W/P R-4 SC 10-10 117,399.28 144,600.29 (81,870.39) 62,729.90 - 180,129.18
34 Nov-10 W/P R-4 SC 11-10 105,159.30 139,403.23 (89,680.76) 49,722.47 - 154,881.77
35 Dec-10 W/P R-4 SC 12-10 189,053.65 118,956.68 (58,920.83) 60,035.85 - 249,089.50
36 Jan-11 W/P R-4 SC 01-11 252,999.00 152,936.30 (88,034.43) 64,901.87 - 317,900.87
37 Feb-11 W/P R-4 SC 02-11 187,253.00 129,343.60 (73,198.73) 56,144.87 - 243,397.87
38 Mar-11 W/P R-4 SC 03-11 132,331.48 110,814.82 (56,899.89) 53,914.93 - 186,246.41
39 Period Totals Σ Lines 27 thru 38 1,643,973.36$ 1,486,777.54$ (826,740.86)$ 660,036.68$ -$ 2,304,010.04$
Progress Energy Carolinas, Inc.Test Period DSM/EE Cost Recovery Summary ($)

W/P R-2Page 2 of 2
Progress Energy Carolinas, Inc.Test Period DSM/EE Cost Recovery Summary ($)
D. SC Total DSM/DSDR/EE Recovery
General Service
Residential Billing Amounts Opt-Out Credits Net Billings Lighting Total
40 Apr-10 Σ Lines 1, 14 & 27 108,073.10$ 184,430.89$ (110,365.84)$ 74,065.05$ -$ 182,138.15$
41 May-10 Σ Lines 2, 15 & 28 97,524.51 171,007.03 (98,179.45) 72,827.58 - 170,352.09
42 Jun-10 Σ Lines 3, 16 & 29 144,779.92 206,746.90 (114,611.83) 92,135.07 - 236,914.99
43 Jul-10 Σ Lines 4, 17 & 30 405,007.22 376,212.22 (205,123.66) 171,088.56 - 576,095.78
44 Aug-10 Σ Lines 5, 18 & 31 412,880.83 371,322.74 (196,156.57) 175,166.17 - 588,047.00
45 Sep-10 Σ Lines 6, 19 & 32 365,447.22 365,530.93 (194,535.65) 170,995.28 - 536,442.50
46 Oct-10 Σ Lines 7, 20 & 33 250,451.54 336,122.06 (190,304.05) 145,818.01 - 396,269.55
47 Nov-10 Σ Lines 8, 21 & 34 224,338.92 324,033.65 (208,458.92) 115,574.73 - 339,913.65
48 Dec-10 Σ Lines 9, 22 & 35 403,314.83 276,509.39 (136,958.83) 139,550.56 - 542,865.39
49 Jan-11 Σ Lines 10, 23 & 36 539,733.05 355,493.58 (204,632.09) 150,861.49 - 690,594.54
50 Feb-11 Σ Lines 11, 24 & 37 399,492.98 300,653.42 (170,147.18) 130,506.24 - 529,999.22
51 Mar-11 Σ Lines 12, 25 & 38 282,288.76 257,583.69 (132,261.25) 125,322.44 - 407,611.20
52 Period Totals Σ Lines 40 thru 51 3,633,332.88$ 3,525,646.50$ (1,961,735.32)$ 1,563,911.18$ -$ 5,197,244.06$

W/P R-3Page 1 of 1
SC Total Billing Units
General Service
Residential Billing Units Opt-Out Units Net Units Billing Units Opt-Out Units Net Units Total
1 Apr-10 W/P R-4 SC 04-10 139,727,756 329,340,765 (197,081,842) 132,258,923 7,707,195 (243,152) 7,464,043 279,450,722
2 May-10 W/P R-4 SC 05-10 126,120,851 305,345,392 (175,320,452) 130,024,940 7,688,566 (224,462) 7,464,104 263,609,895
3 Jun-10 W/P R-4 SC 06-10 187,122,175 368,455,927 (203,969,260) 164,486,667 7,741,727 (261,842) 7,479,885 359,088,727
4 Jul-10 W/P R-4 SC 07-10 232,188,062 391,914,492 (213,670,517) 178,243,975 7,724,989 (243,152) 7,481,837 417,913,874
5 Aug-10 W/P R-4 SC 08-10 236,512,456 386,779,663 (204,332,767) 182,446,896 7,706,108 (236,935) 7,469,173 426,428,525
6 Sep-10 W/P R-4 SC 09-10 209,358,310 380,778,596 (202,641,307) 178,137,289 7,723,036 (245,218) 7,477,818 394,973,417
7 Oct-10 W/P R-4 SC 10-10 143,522,257 350,158,144 (198,233,382) 151,924,762 7,705,953 (240,283) 7,465,670 302,912,689
8 Nov-10 W/P R-4 SC 11-10 128,498,741 337,517,513 (217,144,706) 120,372,807 7,712,654 (243,006) 7,469,648 256,341,196
9 Dec-10 W/P R-4 SC 12-10 230,941,785 288,030,064 (142,665,444) 145,364,620 7,691,804 (238,352) 7,453,452 383,759,857
10 Jan-11 W/P R-4 SC 01-11 309,077,522 370,305,815 (213,158,431) 157,147,384 7,711,988 (257,652) 7,454,336 473,679,242
11 Feb-11 W/P R-4 SC 02-11 228,803,895 313,180,645 (177,236,643) 135,944,002 7,712,556 (255,390) 7,457,166 372,205,063
12 Mar-11 W/P R-4 SC 03-11 161,634,512 268,313,906 (137,772,130) 130,541,776 7,724,581 (252,962) 7,471,619 299,647,907
13 Period Totals Σ Lines 1 thru 12 2,333,508,322 4,090,120,922 (2,283,226,881) 1,806,894,041 92,551,157 (2,942,406) 89,608,751 4,230,011,114
Progress Energy Carolinas, Inc.Test Period DSM/DSDR/EE Cost Recovery Units (kWh)
Lighting

W/P R-4 SC 04-10Source: RMCRY4
State: South Carolina
Total
Rate Class KWH DSM DSDR EE Recovery
Residential 139,727,756 10,253.09$ 65,398.08$ 32,421.93$ 108,073.10$
Res RECD (reflected above) - - - - -
Net Residential 139,727,756 10,253.09$ 65,398.08$ 32,421.93$ 108,073.10$
Small General Service 19,061,089 590.90$ 6,061.46$ 4,021.90$ 10,674.26$
Medium General Svc 128,121,971 3,971.78 40,742.79 27,033.74 71,748.31
Large General Service 182,157,705 5,646.89 57,926.15 38,435.28 102,008.32
Less: Opt-Outs (197,081,842) (6,109.54) (62,672.03) (41,584.27) (110,365.84)
Net General Service 132,258,923 4,100.03$ 42,058.37$ 27,906.65$ 74,065.05$
Lighting 7,707,195 -$ -$ -$ -$
Less: Opt Outs (243,152) - - - -
Net Lighting 7,464,043 -$ -$ -$ -$
Total 279,450,722 14,353.12$ 107,456.45$ 60,328.58$ 182,138.15$
DSM/EE Rate Billings (net of GRT & SC Reg fee)
Month of April 2010
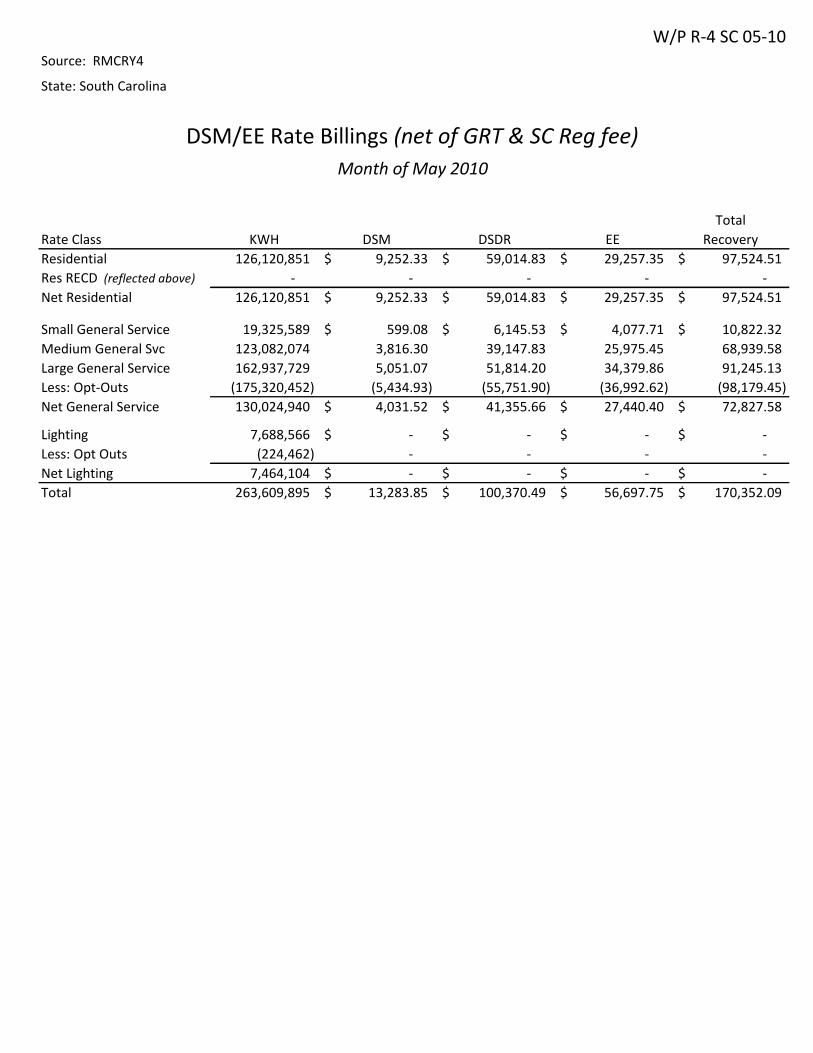
W/P R-4 SC 05-10Source: RMCRY4
State: South Carolina
Total
Rate Class KWH DSM DSDR EE Recovery
Residential 126,120,851 9,252.33$ 59,014.83$ 29,257.35$ 97,524.51$
Res RECD (reflected above) - - - - -
Net Residential 126,120,851 9,252.33$ 59,014.83$ 29,257.35$ 97,524.51$
Small General Service 19,325,589 599.08$ 6,145.53$ 4,077.71$ 10,822.32$
Medium General Svc 123,082,074 3,816.30 39,147.83 25,975.45 68,939.58
Large General Service 162,937,729 5,051.07 51,814.20 34,379.86 91,245.13
Less: Opt-Outs (175,320,452) (5,434.93) (55,751.90) (36,992.62) (98,179.45)
Net General Service 130,024,940 4,031.52$ 41,355.66$ 27,440.40$ 72,827.58$
Lighting 7,688,566 -$ -$ -$ -$
Less: Opt Outs (224,462) - - - -
Net Lighting 7,464,104 -$ -$ -$ -$
Total 263,609,895 13,283.85$ 100,370.49$ 56,697.75$ 170,352.09$
DSM/EE Rate Billings (net of GRT & SC Reg fee)
Month of May 2010

W/P R-4 SC 06-10Source: RMCRY4
State: South Carolina
Total
Rate Class KWH DSM DSDR EE Recovery
Residential 187,122,175 13,739.87$ 87,589.76$ 43,450.29$ 144,779.92$
Res RECD (reflected above) - - - - -
Net Residential 187,122,175 13,739.87$ 87,589.76$ 43,450.29$ 144,779.92$
Small General Service 26,479,290 820.87$ 8,420.51$ 5,587.24$ 14,828.62$
Medium General Svc 152,654,945 4,747.73 48,732.47 32,417.93 85,898.13
Large General Service 189,321,692 5,868.97 60,204.30 39,946.88 106,020.15
Less: Opt-Outs (203,969,260) (6,337.64) (65,040.21) (43,233.98) (114,611.83)
Net General Service 164,486,667 5,099.93$ 52,317.07$ 34,718.07$ 92,135.07$
Lighting 7,741,727 -$ -$ -$ -$
Less: Opt Outs (261,842) - - - -
Net Lighting 7,479,885 -$ -$ -$ -$
Total 359,088,727 18,839.80$ 139,906.83$ 78,168.36$ 236,914.99$
DSM/EE Rate Billings (net of GRT & SC Reg fee)
Month of June 2010

W/P R-4 SC 07-10Source: RMCRY4
State: South Carolina
Total
Rate Class KWH DSM DSDR EE Recovery
Residential 232,188,062 56,597.46$ 158,605.84$ 189,803.92$ 405,007.22$
Res RECD (reflected above) - - - - -
Net Residential 232,188,062 56,597.46$ 158,605.84$ 189,803.92$ 405,007.22$
Small General Service 31,421,458 1,445.24$ 15,740.26$ 12,974.98$ 30,160.48$
Medium General Svc 162,854,749 7,490.64 81,581.18 67,247.17 156,318.99
Large General Service 197,638,285 9,091.36 99,016.78 81,624.61 189,732.75
Less: Opt-Outs (213,670,517) (9,828.84) (107,048.91) (88,245.91) (205,123.66)
Net General Service 178,243,975 8,198.40$ 89,289.31$ 73,600.85$ 171,088.56$
Lighting 7,724,989 -$ -$ -$ -$
Less: Opt Outs (243,152) - - - -
Net Lighting 7,481,837 -$ -$ -$ -$
Total 417,913,874 64,795.86$ 247,895.15$ 263,404.77$ 576,095.78$
DSM/EE Rate Billings (net of GRT & SC Reg fee)
Month of July 2010

W/P R-4 SC 08-10Source: RMCRY4
State: South Carolina
Total
Rate Class KWH DSM DSDR EE Recovery
Residential 236,512,456 57,709.47$ 161,633.52$ 193,537.84$ 412,880.83$
Res RECD (reflected above) - - - - -
Net Residential 236,512,456 57,709.47$ 161,633.52$ 193,537.84$ 412,880.83$
Small General Service 32,181,564 1,480.73$ 16,127.15$ 13,294.53$ 30,902.41$
Medium General Svc 165,710,663 7,622.92 83,023.86 68,441.61 159,088.39
Large General Service 188,887,436 8,688.82 94,632.61 78,010.51 181,331.94
Less: Opt-Outs (204,332,767) (9,399.17) (102,369.21) (84,388.19) (196,156.57)
Net General Service 182,446,896 8,393.30$ 91,414.41$ 75,358.46$ 175,166.17$
Lighting 7,706,108 -$ -$ -$ -$
Less: Opt Outs (236,935) - - - -
Net Lighting 7,469,173 -$ -$ -$ -$
Total 426,428,525 66,102.77$ 253,047.93$ 268,896.30$ 588,047.00$
DSM/EE Rate Billings (net of GRT & SC Reg fee)
Month of August 2010

W/P R-4 SC 09-10Source: RMCRY4
State: South Carolina
Total
Rate Class KWH DSM DSDR EE Recovery
Residential 209,358,310 51,080.34$ 143,060.56$ 171,306.32$ 365,447.22$
Res RECD (reflected above) - - - - -
Net Residential 209,358,310 51,080.34$ 143,060.56$ 171,306.32$ 365,447.22$
Small General Service 30,420,022 1,398.68$ 15,232.57$ 12,554.80$ 29,186.05$
Medium General Svc 166,926,965 7,678.66 83,630.71 68,941.17 160,250.54
Large General Service 183,431,609 8,437.85 91,899.24 75,757.25 176,094.34
Less: Opt-Outs (202,641,307) (9,321.50) (101,523.29) (83,690.86) (194,535.65)
Net General Service 178,137,289 8,193.69$ 89,239.23$ 73,562.36$ 170,995.28$
Lighting 7,723,036 -$ -$ -$ -$
Less: Opt Outs (245,218) - - - -
Net Lighting 7,477,818 -$ -$ -$ -$
Total 394,973,417 59,274.03$ 232,299.79$ 244,868.68$ 536,442.50$
DSM/EE Rate Billings (net of GRT & SC Reg fee)
Month of September 2010

W/P R-4 SC 10-10Source: RMCRY4
State: South Carolina
Total
Rate Class KWH DSM DSDR EE Recovery
Residential 143,522,257 35,006.33$ 98,045.93$ 117,399.28$ 250,451.54$
Res RECD (reflected above) - - - - -
Net Residential 143,522,257 35,006.33$ 98,045.93$ 117,399.28$ 250,451.54$
Small General Service 22,410,006 1,030.86$ 11,227.41$ 9,255.33$ 21,513.60$
Medium General Svc 138,596,283 6,374.31 69,423.12 57,225.24 133,022.67
Large General Service 189,151,855 8,700.99 94,765.08 78,119.72 181,585.79
Less: Opt-Outs (198,233,382) (9,118.74) (99,314.92) (81,870.39) (190,304.05)
Net General Service 151,924,762 6,987.42$ 76,100.69$ 62,729.90$ 145,818.01$
Lighting 7,705,953 -$ -$ -$ -$
Less: Opt Outs (240,283) - - - -
Net Lighting 7,465,670 -$ -$ -$ -$
Total 302,912,689 41,993.75$ 174,146.62$ 180,129.18$ 396,269.55$
DSM/EE Rate Billings (net of GRT & SC Reg fee)
Month of October 2010

W/P R-4 SC 11-10Source: RMCRY4
State: South Carolina
Total
Rate Class KWH DSM DSDR EE Recovery
Residential 128,498,741 31,356.58$ 87,823.04$ 105,159.30$ 224,338.92$
Res RECD (reflected above) - - - - -
Net Residential 128,498,741 31,356.58$ 87,823.04$ 105,159.30$ 224,338.92$
Small General Service 17,676,982 813.12$ 8,855.94$ 7,300.33$ 16,969.39$
Medium General Svc 118,786,659 5,464.84 59,520.05 49,067.65 114,052.54
Large General Service 201,053,872 9,248.48 100,727.99 83,035.25 193,011.72
Less: Opt-Outs (217,144,706) (9,988.66) (108,789.50) (89,680.76) (208,458.92)
Net General Service 120,372,807 5,537.78$ 60,314.48$ 49,722.47$ 115,574.73$
Lighting 7,712,654 -$ -$ -$ -$
Less: Opt Outs (243,006) - - - -
Net Lighting 7,469,648 -$ -$ -$ -$
Total 256,341,196 36,894.36$ 148,137.52$ 154,881.77$ 339,913.65$
DSM/EE Rate Billings (net of GRT & SC Reg fee)
Month of November 2010

W/P R-4 SC 12-10Source: RMCRY4
State: South Carolina
Total
Rate Class KWH DSM DSDR EE Recovery
Residential 230,941,785 56,372.37$ 157,888.81$ 189,053.65$ 403,314.83$
Res RECD (reflected above) - - - - -
Net Residential 230,941,785 56,372.37$ 157,888.81$ 189,053.65$ 403,314.83$
Small General Service 24,126,366 1,109.83$ 12,087.55$ 9,964.45$ 23,161.83$
Medium General Svc 139,667,259 6,424.69 69,973.30 57,682.58 134,080.57
Large General Service 124,236,439 5,714.88 62,242.46 51,309.65 119,266.99
Less: Opt-Outs (142,665,444) (6,562.61) (71,475.39) (58,920.83) (136,958.83)
Net General Service 145,364,620 6,686.79$ 72,827.92$ 60,035.85$ 139,550.56$
Lighting 7,691,804 -$ -$ -$ -$
Less: Opt Outs (238,352) - - - -
Net Lighting 7,453,452 -$ -$ -$ -$
Total 383,759,857 63,059.16$ 230,716.73$ 249,089.50$ 542,865.39$
DSM/EE Rate Billings (net of GRT & SC Reg fee)
Month of December 2010
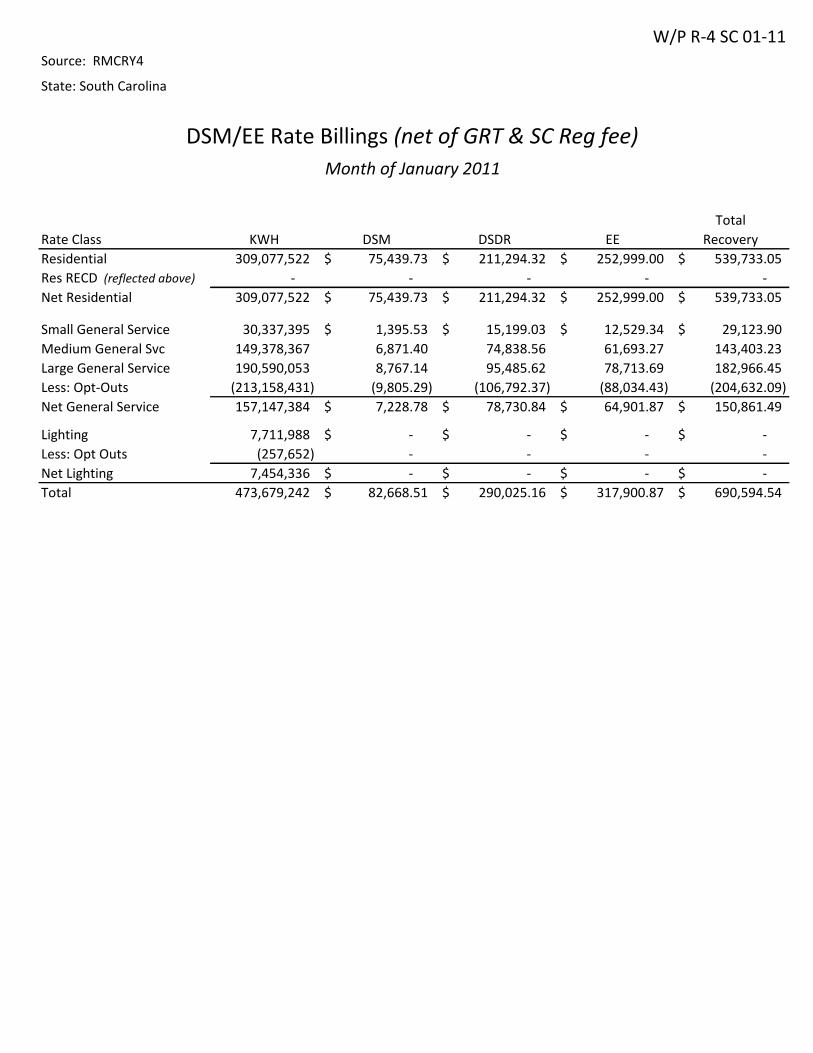
W/P R-4 SC 01-11Source: RMCRY4
State: South Carolina
Total
Rate Class KWH DSM DSDR EE Recovery
Residential 309,077,522 75,439.73$ 211,294.32$ 252,999.00$ 539,733.05$
Res RECD (reflected above) - - - - -
Net Residential 309,077,522 75,439.73$ 211,294.32$ 252,999.00$ 539,733.05$
Small General Service 30,337,395 1,395.53$ 15,199.03$ 12,529.34$ 29,123.90$
Medium General Svc 149,378,367 6,871.40 74,838.56 61,693.27 143,403.23
Large General Service 190,590,053 8,767.14 95,485.62 78,713.69 182,966.45
Less: Opt-Outs (213,158,431) (9,805.29) (106,792.37) (88,034.43) (204,632.09)
Net General Service 157,147,384 7,228.78$ 78,730.84$ 64,901.87$ 150,861.49$
Lighting 7,711,988 -$ -$ -$ -$
Less: Opt Outs (257,652) - - - -
Net Lighting 7,454,336 -$ -$ -$ -$
Total 473,679,242 82,668.51$ 290,025.16$ 317,900.87$ 690,594.54$
DSM/EE Rate Billings (net of GRT & SC Reg fee)
Month of January 2011
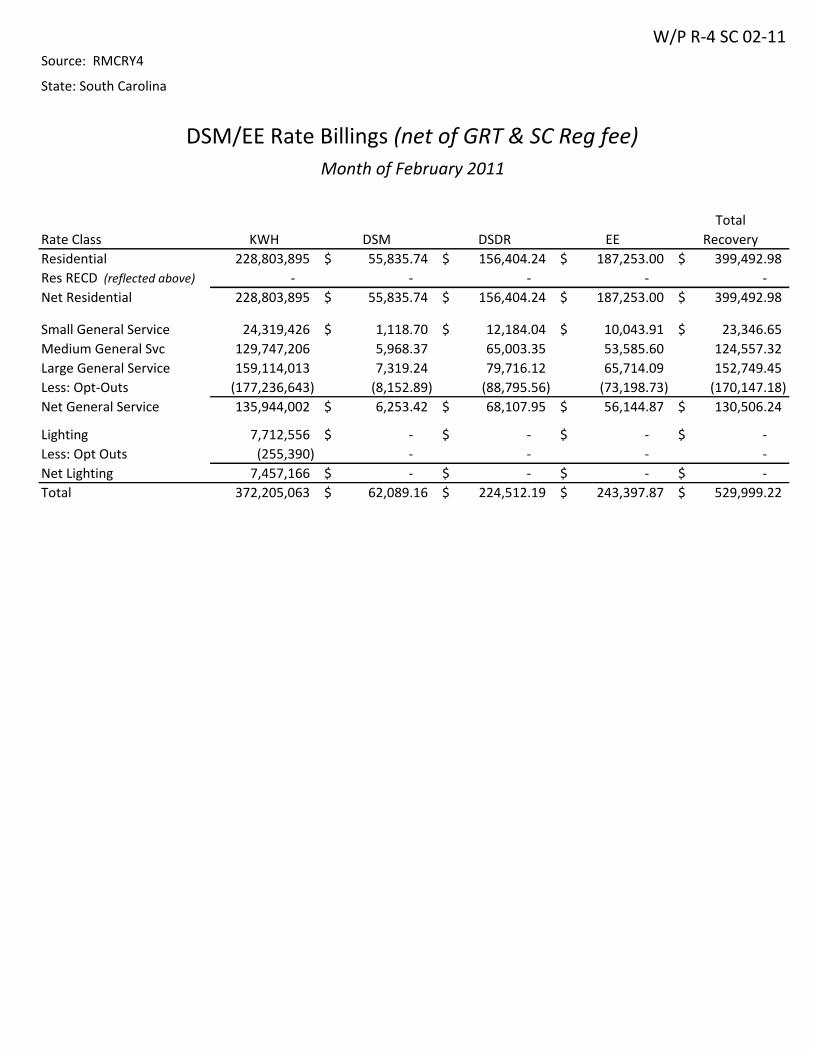
W/P R-4 SC 02-11Source: RMCRY4
State: South Carolina
Total
Rate Class KWH DSM DSDR EE Recovery
Residential 228,803,895 55,835.74$ 156,404.24$ 187,253.00$ 399,492.98$
Res RECD (reflected above) - - - - -
Net Residential 228,803,895 55,835.74$ 156,404.24$ 187,253.00$ 399,492.98$
Small General Service 24,319,426 1,118.70$ 12,184.04$ 10,043.91$ 23,346.65$
Medium General Svc 129,747,206 5,968.37 65,003.35 53,585.60 124,557.32
Large General Service 159,114,013 7,319.24 79,716.12 65,714.09 152,749.45
Less: Opt-Outs (177,236,643) (8,152.89) (88,795.56) (73,198.73) (170,147.18)
Net General Service 135,944,002 6,253.42$ 68,107.95$ 56,144.87$ 130,506.24$
Lighting 7,712,556 -$ -$ -$ -$
Less: Opt Outs (255,390) - - - -
Net Lighting 7,457,166 -$ -$ -$ -$
Total 372,205,063 62,089.16$ 224,512.19$ 243,397.87$ 529,999.22$
DSM/EE Rate Billings (net of GRT & SC Reg fee)
Month of February 2011

W/P R SC 03-11Source: RMCRY4
State: South Carolina
Total
Rate Class KWH DSM DSDR EE Recovery
Residential 161,634,512 39,458.56$ 110,498.72$ 132,331.48$ 282,288.76$
Res RECD (reflected above) - - - - -
Net Residential 161,634,512 39,458.56$ 110,498.72$ 132,331.48$ 282,288.76$
Small General Service 19,907,506 915.84$ 9,974.74$ 8,222.98$ 19,113.56$
Medium General Svc 123,268,569 5,670.35 61,757.55 50,909.92 118,337.82
Large General Service 125,137,831 5,756.34 62,694.05 51,681.92 120,132.31
Less: Opt-Outs (137,772,130) (6,337.52) (69,023.84) (56,899.89) (132,261.25)
Net General Service 130,541,776 6,005.01$ 65,402.50$ 53,914.93$ 125,322.44$
Lighting 7,724,581 -$ -$ -$ -$
Less: Opt Outs (252,962) - - - -
Net Lighting 7,471,619 -$ -$ -$ -$
Total 299,647,907 45,463.57$ 175,901.22$ 186,246.41$ 407,611.20$
DSM/EE Rate Billings (net of GRT & SC Reg fee)Month of March 2011