llectro-optical tests of ccd imagers at … camera timing controller unit." _-_ iarray counter...
TRANSCRIPT

LLECTRO-OPTICAL TESTS OF CCD IMAGERS AT THE GEODSS ETS. (UlFE S0 0 F KOSTIS'IACK. C N *TLFPHE F
192S-0-C-0002
UNCLASSIFIECO TA-is,9 ES0-TR-79-386 Ma* T 7

3 6
-., 12.0
1111 51= 1. 1166i
MICROCOPY RESOLUTION TEST CHART
NATIONAL BURAU Of SIANI)AI)[S 1%1 A

le
F 4
0 .~

tcf5
44
tit

|I
MASSACHUSETTS INSTITUTE OF TECHNOLOGY
LINCOLN LABORATORY
ELECTRO-OPTICAL TESTSOF CCD IMAGERS AT THE GEODSS ETS
D. F. KOSTISHACKC. H. GYLFPHE, JR.
M. J. MacDONALD
N. G. S. PONG
Group 94
DTICll ELECTEDTECHNICAL REPORT 539 AUG 22 1980
20 FEBRUARY 1980 wB
Approved for public release; distribution unlimited.
LEXINGTON MASSACHUSETTS

ABSTRACT
As part of the GEODSS-CCD Technology Program, a series of three
electro-optical tests of CCD Imagers was conducted on the GEODSS
Experimental Test System (ETS) at Socorro. New Mexico. The tests
were preliminary to establish the basis for developing and testing an
advanced CCD automatic detection system which would provide Im-
proved sensitivity and scan coverage rate for GEODSS applications.
These preliminary tests resulted in the successful demonstration of
STARE and Image-motlon-compensation (IMC) modes of operation,
and provided a thorough evaluation and verification of present CCD
system design models. Also, interesting electro-optical performance
levels were demonstrated, compared with existing GEODSS system
designs.
AtCESStON Ief
NTIS White ketiWO BufftSKIM13
WMWOMIED 03JUSTIFICATION
By
.AVAIL Ond
titt

CONTENTS
Abstract iii
I. INTRODUCTION IA. Site-Test Objectives IB. Results Summary 1
11. EXPERIMENTAL SYSTEM 2A. CCDs Tested 2B. CCD Camera Electronics 5C. Video Electronics 6D. Data Recording and Displays 6E. Site-Test Configurations 9
HI. DESCRIPTION OF TESTS 12A. Brief Summary 12B. Test Outlines 13
IV. DATA ANALYSIS 13
A. Point Target Image on CCD Focal Plane 13B. Electro-Optical Responsivity 18C. Electro-Optical Imager Sensitivity 20
D. Satellite Observations 23E. IMC Scan Alignment and Stability 25F. Scan Comparison Demonstration 27
V. CONCLUSIONS 29
Acknowledgments 30
Iv

ELECTRO-OPTICAL TESTS OF CCD IMAGERS
AT THE GEODSS ETS
I. INTRODUCTION
In January and December t978 and March 1979, a series of electro-optical tests was con-
ducted on the GEODSS Experimental Test System (ETS) at Socorro, New Mexico on experimental
CCD imagers as part of the GEODSS-CCD Technology Program at Lincoln Laboratory. The CCD
imager chips tested were designed and fabricated through the joint technology program in the
Space Surveillance Group and the Microelectronics Group. This report describes these tests
and summarizes the data and results.
As part of the GEODSS Program in the Space Surveillance Group, several projects are di-
rected at the development of technologies which could lead to an automatic search and detection
system for satellite surveillance, with improvements in sensitivity and high scan coverage rate.
This proposed system design is based on the unique features provided by charge-coupled-device
(CCD) technologies for both optical imaging as well as video analog signal processing. The focal
plain design for the proposed system incorporates a mosaic array of 25 to 30 CCD imager chips
which are continuously scanned in the CCD Image-motion-compensation (IMC) mode with multiple
measurements provided by several imagers on-focal-plane in the scan direction for MTI pro-
cessing. CCD imager and processing chips are being developed by the Microelectronics Group
in support of this technology program design. A preliminary measurements program is presently
under way to determine the electro-optical characteristics of these CCD imagers in laboratory
measurements, as well as camera field tests using existing telescopes at the GEODSS ETS.
A. Site-Test Objectives
The overall objectives for the initial CCD camera site-tests were to evaluate the electro-
optical, mechanical, and operational interfaces with the existing ETS sensors and to measure
various aspects of CCD camera performance to allow a comparison with laboratory measure-
ments and theoretical design predictions. Specifically, all interface requirements were to be
satisfied and measurements taken on calibration stars and selected satellites to provide data on
sensitivity, dynamic range, photo-responsivity, resolution, metric registration, acquisition
capability for STARE and !MC, and effects of telescope dynamics for the IMC mode. The electro-
optical experimental system and measurements were aimed at sensor characterization only.
Although STARE and IMC modes were used and targets acquired, it was not intended or possible
to conduct automatic searches with the existing imager electronic test system.
B. Results Summary
All site test objectives were achieved in this preliminary series of tests. Both STARE-
and IMC-mode operation were successfully demonstrated for the single-chip CCD camera. Over
the total of the periods of testing; more than t00 measurement observations were accomplished
in approximately 6 nights of adequate seeing conditions, out of a total of 23 days at the ETS site.
The CCD electro-optical performance models were thoroughly evaluated and verified. Mea-
surements agreed with the models for electro-optical responsivity and sensitivity to within a
few tenths of a visual magnitude for both STARE and IMC modes.
I

Low-light-level calibration solar stars were visually detectable at magnitudes as low as
17.2 M v for STARE mode and 15.9 M v for IMC mode, with integration times of 0.9 and 0. 25 sec.
respectively. The observed signal-to-noise ratios were >6. These magnitudes agreed within
a few tenths of a visual magnitude with the predicted electro-optical sensitivity which was modi-
fied from the ideal values to account for the size mismatch between the existing point-target
image-seeing disc diameter and the CCD pixel size. In an automatic search system application,
either the CCD pixel size and telescope focal-plane scale factor would have to be specified to
yield an optimized match, or extensive real-time video signal processing would have to be im-
plemented to maximize probability of detection.
The CCD imagers for these field-tests exhibited nominal quantum efficiencies of 20 to 30 per-
cent, with camera electronic noise levels typically at 35 to 45 equivalent rms electrons. Suc-
cessful techniques for focal-plane alignment, operating point adjustment, metric calibration,
and object acquisition for IMC scans were developed.
I1. EXPERIMENTAL SYSTEM
A. CCDs Tested
The series of tests was centered around developmental CCD imager chips designed to
provide the requirements for the proposed CCD automatic search system. Table I lists the re-
quired and existing device parameters. As can be seen in the table, not all of the required chip
capability had been achieved at the times of the tests. However, laboratory measurements of
the existing parameters permitted useful design evaluation in these preliminary site-tests.
TABLE I
CCD REQUIREMENTS AND STATUS BY MARCH 1979
100 X 400 CCD Characteristics
Goal Status
Dark Current (nA/cm2 ) 5 <5
Transfer Efficiency 0.99992 0.99998
Noise (electrons) 20 12
Quantum Efficiency (percent) 40 20 to 30
Dynamic Range 042 X 104
Chip Alignment (mils) *0. 1 <0. I
Defective Columns (percent) <5 18
L i w , - ...

INPUT L-MinhR
M-.TANSFERtGATE
100-a 400-CELL IMAGING ARRAY
VO VD0
IPT TRANiSFER GATE f n-
GATES F05-CELL OUTPUT REGIER O-CHIP
Fig. 1. Schematic of 100- x 4 0 0 -pixel CCD image sensor.
A schematic diagram of the 100- x 400-pixel CCD is shown in Fig. 1. For operation as animager only, the active 100 x 400 array, output register, and output circuits are used. TheCCD imagers are two-phase, buried n-channel devices, using polysilicon gate electrodes, im-planted column barriers, and input and output register blooming drains. The output floating-diffusion circuit includes a MOSFET amplifier followed by an off-chip bipolar transistor to drive
the video circuit load.
Fig. 2. CCD imager chip in test package.
The preliminary site-tests were conducted on single-chip focal planes. The CCD mountedin a single-chip package for testing is shown in Fig. 2. The imagers are front-illuminated through
the polysilicon gates.
3

44cc
10 4 i C7

B. CCD Camera Electronics
A block diagram of the experimental camera system for testing the individual imager chips
is shown in Fig. 3. The CCD to be tested is mounted in a 24-pin socket in a refrigeration dewar
which uses liquid nitrogen for coolant. A resistive "no-dew" heater is used to eliminate con-
densation and icing on the Plexiglas window. The high-power, high-speed drivers which supply
the necessary clock levels to operate the CCD and DC level adjustments are located in the cam-
era electronics assembly shown behind the chip dewar in Fig. 4. The timing logic which supplies
the CCD drive clocks and display ramp generators, and the DC power supplies make up the con-
troller assembly shown in Fig. 5.
Fig. 4. Single-chip CCD camera.
gZ
Fig. 5. CCD camera timing controller unit.
" _-_

IARRAYCOUNTER
*I V ARRAY
02V CLOCKS
i ~~OR COUNTER Oql OTUORI OUTPUT
REGISTER-42OR#2 CLOCKS
XG GATE
-~ ~ F XGoc LENGTH ,• G
SQUARE WAVE
GENE R ATOR "CDS TRIGGER
Fig. 6(a). CCD STARE-mode timing logic block diagram.
The timing logic is located on individual plug-in boards which are interchangeable, depending
on the choice of either STARE or !MC mode of operation. A functional diagram of these logic
circuits is shown in Figs. 6(a) and (b). Several options for frame timing such as lockup to optical
shutters is possible with the STARE logic. The IMC logic permits lockup of the line transfer
clocks of the CCD to pulses generated by the telescope axis encoders during IMC scans.
C. Video Electronics
For the objectives of these preliminary tests, the video from the CCD was first amplified
by a low-noise video preamplifier-driver. Correlated double-sampling was used to remove
various forms of clock leak-through and noise; and the imager video was fanned out to several
offset buffer amplifier channels for displays and data recording. Figure 7 is a diagram of this
analog video network.
D. Data Recording and Displays
Several types of displays and data recordings were used in the tests. The video clocked
from the CCD imager is not in standard TV format. For example, in the STARE mode of oper-
ation a frame integration period selectable from 0.1 to 20 sec can be used. Following the inte-
gration period, the frame of video data in normally clocked out at a 400-kHz analog bit rate;
that is, the 40,000 cells of the frame are read out in 0.1 sec. The video is displayed on a high-
speed x-y-z monitor with synchronized ramps generated in the controller assembly logic. Either
log or linear amplitude can be displayed.
The CCD video also was converted to standard TV composite video format which permitted
display on TV monitors and recording on cassette video-tape recorders. For the IMC mode
6

lObINO) 0)3 AV~dSIO bI1lS 8
T, ,
T~ V
j7 0
~ .0
~E
jo
2H-----------------
__ __ ___ V

~3~~iga r- LOW-7N~oSE ;RE APLIFIER
IRAP NVERT BUFFER j CABLE
T. IG E
CCSETD IM vER OFFSA LO D I VTERDA OR ONE R V ER AM A MOF'EOCFC E AMPVID IO
SCOEIE HTRER TERNO CESFR ILOJ DGJRTSRMI ITIE
I THO O D -O -xDIIA MEMORY TOAAOGTVORA
Fig. 7Analg. vi.e ntorkCAD scgal corter.nddiply
aA A T
__________ ____________

tests, no image framing was provided by the CCD camera; therefore, scan conversion to TV
was required for all TMC di3play and recording. For Site-Test I, two Princeton Electronic
Product's CRT scan converters were multiplexed to store and convert alternate CCD fields-of-
view. For Site-Test IT[, a Quantex DS-20 Digital Image Memory/Processor was used for scan
conversion which provided a TV format covering four CCD fields-of-view. Figure 8 is a diagram
of the Quantex scan-converter configuration. The expanded field-of-view was essential in en-
abling IMC scans through particular star and satellite targets of interest.
Amplitude measurements in STARE mode on calibrated point targets were taken with an os-
cilloscope displaying a selectable horizontal line of the video pulse shape of the target. An os-
cilloscope camera was used to record the video pulse displayed.
Initial tests were also conducted in STARE mode on a video digitizer-recording system which
digitizes a selectable 32- X 32-pixel portion of the 100- X 400-pixel CCD array with a 12-bit
dynami L range. The digitized point target amplitudes can be recorded by the ETS MODCOMP
computers on magnetic tape for signal analysis and processing during and after observation
periods.
Photographic cameras were also used to record observed star-satellite fields on the TV
monitors.
E. Site-Test Configurations
The three CCD sensor site-tests involved the use of both large-aperture telescopes at the
GEODSS ETS in both the Cassegrainian and prime focus configurations. Table II lists the optical
parameters of each of the telescope options. In general, the Cassegrainian position for the focal
plane provided greater resolution and ease in mechanically interfacing the CCD camera to the
telescope. The prime focus position provided more desirable pixel size - seeing disc size match,
enabling operation approaching designed performance and a somewhat larger field-of-view.
Table I also indicates the specific telescope used for each of the three tests. Between the first
TABLE II
TYPICAL CHARACTERISTICS OF TELESCOPES AT THE GEODSS ETSFOR THE CCD ELECTRO-OPTICAL TESTS
31-In. 31-1n. 14-In.Couegrain Prime Focus Folded Schmidt
f/Number f/5 f/2.87 f/1.7
Field-of-View (cleg) 1.16 2.0 7.0
Focal-PloneScale Factor (mils/i" ) 0.754 0.43 0.122
Effective Aperture (m 2 ) 0.20 0.29 0.039
Site-Test 1: "B system 31-in. Camgain
Site-Test I: "A" system 31-In. prime focus
Site-Test III: "B" system 31-In. prime focus
9

Fig. 9. "A" system telescopes at GEODSS ETS.
Fig. 10. CCD camera on 31-in. telescope at ETS in prime-focal position.
to

and second tests, the "A" telescope was modified by Boller & Chivens to permit locating cameras
at the prime focus position with no interference between the telescope motion and dome motion.
Therefore, for both Tests I and II the more desirable prime focus scale factor was used first
on the "A" tower and later on the 'B" tower systems.
For all tests, the wide-field 14-in. folded Schmidt telescopes at the ETS were used to assist
in acquiring calibration stars and satellites of interest using the ETS Ebsicon camera systems.
The "A" system telescopes are shown in Fig. 9. In Fig. 10, the CCD camera is shown
mounted on the "A" telescope used in Test Zr. As seen in the figure, the CCD camera structure
was contained in a minimum-diameter profile in order to maintain maximum telescope aperture.
A simplified block diagram of the total site-test system is shown in Fig. 11. During the
STARE mode testing periods, objects of Interest were first located in the 14-in, telescope field-
of-view. The telescopes were then slewed to move the targets into the limited field-of-view of
the CCD imager which was outlined on the 14-in. monitor. Finally, the telescope operator would
locate the target within the CCD field-of-view manually while observing the console TV display
of the actual CCD imager video. For targets too dim to be observed by the 14-in, telescopes,
the CCD camera was used directly to acquire the targets within known local star fields.
TELSCO PE
cT ME'EC RONSOO
(;CO ONS SYTE CON'
ECORDE C
Fig. 11. CCD site-test system block diagraum.
For the TMC mode testing, only positive declination scans were used to minimize camera
realignument problems. Each measurement required that the object of interest be located first
with the 14-In, telescope. The telescopes were then moved to position the target directly above
the marked CCD field-of-view. The telescopes were then offset in negative declination several
degrees before scan initialization. This large offset permitted the positive declination scan
rate to stabilize before the target appeared In and scanned through the CCD field-of-view. Before
the declination scan was enabled by calling up a computer-stored fixed rate, the right-ascension
11
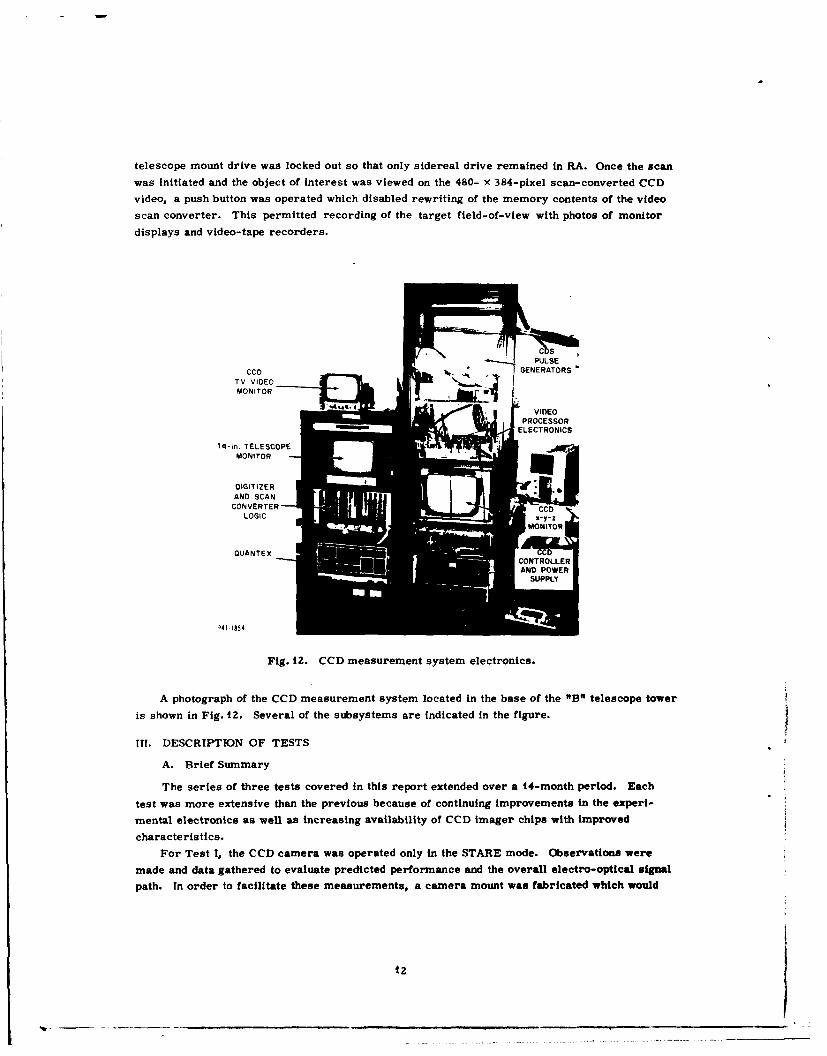
telescope mount drive was locked out so that only sidereal drive remained in RA. Once the scan
was initiated and the object of interest was viewed on the 480- X 384-pixel scan-converted CCD
video, a push button was operated which disabled rewriting of the memory contents of the video
scan converter. This permitted recording of the target field-of-view with photos of monitor
displays and video-tape recorders.
CCC DPULSE
CCD • GENERATORS
MONITOR
VID)EOPROCESSOR
ELECTRONICS
14-in. TELESCOPE
MONITOR
DIGITIZER .
AND SCAN
CONVERTERLOGIC X ' i
QUANTEXCONTROLLER
AND POWERSUPPLY
P41 1854
Fig. 12. CCD measurement system electronics.
A photograph of the CCD measurement system located in the base of the "B" telescope tower
is shown in Fig. 12. Several of the subsystems are indicated in the figure.
ITT. DESCRIPTION OF TESTS
A. Brief Summary
The series of three tests covered in this report extended over a 44-month period. Each
test was more extensive than the previous because of continuing improvements in the experi-
mental electronics as well as Increasing availability of CCD imager chips with improved
characteristics.
For Test I, the CCD camera was operated only in the STARE mode. Observations were
made and data gathered to evaluate predicted performance and the overall electro-optical signal
path. In order to facilitate these measurements, a camera mount was fabricated which would
12

interface with the telescope instrument rotator assembly and provide a chopper wheel shutter.
Also, a liquid nitrogen supply was developed which would transfer LN2 through relatively flexible
insulated copper tubing to the CCD camera while allowing the telescope to be moved at moderate
rates and adequate angles.
The Test 11 site-test included the operation of the CCD imager in both STARE and IMC modes.
The STARE mode was used to permit camera alignment and provide electro-optical signal path
and sensitivity data with lower-noise video electronics under cooled CCD conditions. The TMC
experiments were the initial tests of the optical, electrical, and mechanical alignment of the
scanning image across the imager focal plane, with the photoelectron charge being clocked in
the imager chip. For Test 1T1, a camera mount was fabricated to interface with the telescope
prime focus spider, providing a chopper wheel shutter and minimum aperture blockage. The
CCD imager chips for this test featured higher small-signal transfer efficiency, and fewer blem-
ishes than previous devices.
Both STARE and IMC modes were used in the third site-test. For both cases, the CCD was
cooled permitting low-light-level measurements. Specific calibration stars and satellites were
acquired and scanned, permitting the first operational evaluation of IMC mode sensitivity and
optical path responsivity. A unique test was conducted using both the 31-in. ETS telescopes.
one with an Ebsicon camera and the other with the CCD camera, which demonstrated the obser-
vation dynamics of the IMC mode during continuous scan.
B. Test Outlines
In addition to the many electro-optical measurements conducted, several mechanical and
operational tests were also performed. Table HI provides an outline of the activities for each
of the three site-test periods.
TV. DATA ANALYSIS
This section presents the results of the three CCD Imager site-tests. The results described
below include only samples from each of the test areas outlined in Table 1iT. Data were gathered
for all test areas as well as many additional, secondary, operational, and setup tests which will
not be covered in this report.
A. Point Target Image on CCD Focal Plane
For quantitative measurements on any electro-optical system in which the point target image
or seeing disc-of- illuminance is not centered on and is less than or equal to the imager pixel size,
a point-spread-function analysis of the actual illuminance distribution per pixel must be per-
formed in order to account for all light energy from the calibration object being observed. During
the CCD tests at the ETS, large variations in seeing characteristics were observed, depending
on existing atmospheric conditions as well as the particular telescope optics being used. The
31-In. telescopes at the ETS during observations exhibited nominal "good" seeing discs, with
80 percent of point target illuminance distributed over a 3- 's-dam disc as observed visually
and with photographic plates. Such "good" seeing conditions were rarely observed during the
three CCD site-test periods. Figures 13(a) and (b) show several samples of measured light
distributions across a selected portion of a row of CCD pixels as observed during the first test.
The trace in Fig. 13(a) Indicates a typical point target distribution. With a Cassegranian focal-
plane scale factor of 0.754 mil/f-ec, 90 percent of the energy falls within a 7.9-s-"c-dam seeing
13

TABLE III
OUTLINE OF ACTIVITIES FOR EACH SITE-TEST
TEST I (10 to 20 January 1978)
General Test Conditions
CCD camera on 31-in. telescopes, Cassegrainian position
CCD chip cooled to approximately -50C
Optical shutter used for 0. 1-sec integration tests
Night-sky background during nights of low-light-level
observation were - 22mse -
Moderate video gain and sensitivity
CCDs had low charge transfer efficiency
A. STARE Mode Only
1. Observe calibration solar-type stars and measure amplitudes for various
integration times (t = 0.1, 0.5, 1, 5, 10, 20) to verify the electro-
optical path model and sensitivity predictions for a wide range of star
visual magnitudes.
2. Observe multiple stars in the CCD field-of-view of magnitudes within
the camera dynamic range to evaluate field metric registration.
3. Observe solar-type stars of various magnitudes and over a wide range
of seeing conditions and measure amplitude pulse-shape distributions.
4. Observe geosynchronous satellites in track mode and sidereal drive
to evaluate streak dynamics.
TEST II (11 to 16 December 1978)
General Test Conditions
High video sensitivity and CCD charge transfer efficiency
CCD camera on 31-In. telescope 'A,' prime focus position
Night-sky background was relatively high, . 17 to |8mi "2
even for best night of test period
A. STARE Mode
All low-light-level observations were made with the CCD chip
cooled to approximately -10C
14

TABLE III (Continued)
1. Observe solar-type calibration stars of various magnitudes and measure
amplitudes for integration times of t = 0.1, 0.25 sec to verify electro-
optical path model and sensitivity predictions.
2. For above observations, measure amplitude pulse-shape distributions for
various seeing conditions.
3. Observe low-level calibration stars to provide signal sources for digitizer
data recording program development.
B. IMC Mode
All observations were made with CCD chip at ambient temperature, _-r100 to 150C
Only positive declination scans were used
No electronic lockup of telescope scan to CCD charge transfer was used
The CCD focal plane was rotationally aligned to the telescope scan direction
to within one resel, 2.9 ie, from the top pixel to the bottom pixel of the
100-pixel CCD imager columns
The focal-plane scale factor resulted in a nominal telescope scan rate of
1104 i /sec for a CCD transfer rate of 400 Hz or a total time delay
integration time of 0.25 sec
All video was scan converted to composite TV format and recorded on video-
tape cassettes and with photographs of TV display monitors.
1. Scan at nominal 1104-i"/sec rate through star fields with appropriate
magnitude objects and record imager fields-of-view to permit evaluation
of point target smearing or distortion.
2. Scan at 10-percent greater-than-nominal rate to evaluate scan rate - charge
transfer rate mismatch effects.
3. Scan at 10-percent lower-than-nominal rate to evaluate scan rate - charge
transfer rate mismatch effects.
TEST III (26 March to 2 April 1979)
General Test Conditions
CCD camera on 31-In. telescope 'B,' prime focus position
CCD imager chip cooled to .- 40C
Periods of low night-sky-background (. 22%ti_2) were available
i5

TABLE III (Continued)
Light haze overcast present most of observation time
Several CCD imagers operated
Extensive effort to reduce electronic interference
A. STARE Mode
1. Observe solar-type calibration stars over a wide range of magnitudes at
integration times from 0.1 to 0.9 sec to establish maximum sensitivity and
responsivity operating points.
2. Measure amplitude pulse-shape distributions during above observations to
evaluate existing seeing conditions.
3. Observe calibration stars, satellites, and star clusters to be recorded by the
32- X 32-sample digitizer system for two-dimensional pulse-shape analysis.
B. IMC Mode
A digital scan converter was used to provide expanded field-of-view in IMC mode
increased to 480 X 384 pixels. The video was tape recorded and video monitors
were photographed
CCD focal plane was rotationally aligned with telescope scan to better than
0.5 pixel
Only positive declination scans were used and at 1104-;/sec scan rate
No lockup of the CCD transfer rate to the telescope scan encoder was needed or
used
1. Low-light-level calibration stars were scanned and recorded for evaluation
of IMC mode sensitivity and responsivity using an operator-activated frame
capture in the digital scan converter.
2. Selected satellites were scanned and recorded.
3. Video level offsets and gain were adjusted from test-to-test to optimize
sensitivity.
4. A scan was conducted synchronized with the other 31-in. telescope
with an Ebeican camera, and both CCD and TV videos were recorded for
scan comparison.
5. Many scans were conducted to find sectors which were least degraded by
telescope mount litter.
16

disc. For very brief and rare occasions, the seeing improved to the extent shown in Fig. 13(b),
which at 3.2 sec approaches the site seeing limit.
t:0.
8 PIXELS OR 201AsecOR 12.8j.ec/d iv.
Fig. t3(a). Amplitude vs pixel for typical seeing condition of 5 pixels or 7.9 sec
w
C
n
8 PIXELS OR 20,use¢ -,-
OR 12.8s;-/div.
Fig. 13(b). Amplitude vs pixel for beat seeing condition of 3.2 ec.
17
40

Amplitude measurements were made with the CCD imagers by photographing oscilloscope
A-scope displays as in Figs. 13(a) and (b) with calibrated voltage scale for each calibrated objectobserved in the STARE mode. A Gaussian distribution curve was fitted to the A-scope traces,
and values for a and peak voltage were obtained. It was assumed that the illuminance pixel
distribution [point spread function (PSF)] was circularly symmetric two-dimensional Gaussian.
Having the two-dimensional a2 and peak voltage Vp, the total voltage equivalent to all light falling
on one pixel could be calculated from
V =V2ira 2 (1)T P 2
where
a2 1.51a (2)
This PSF correction was generated for each amplitude measurement and used in responsivity
and sensitivity calculations.
B. Electro-Optical Responsivity
1. Definitions
A fundamental evaluation of the CCD imager capability involved the measurement of overall
sensor responsivity which is defined as camera output voltage as a function of the magnitude of
calibrated stars observed. The measurement results were compared with a comprehensive
model of the entire electro-optical path, Including atmosphere, telescope optics. CCD. and video
electronics, to evaluate the consistency of the model. Parameters for the CCD imager model
were derived from laboratory bench tests.
The predicted electro-optical sensor response was calculated using the following relation-
ships:
v= 154.55 X 10⁴ ) (3)
andV T
(4
for which,
M v = visual magnitude of observed object.
08 = object photon flux at face of telescope,
V T = single pixel video output voltage [see Eq. (1)],
Ro = CCD output responsivity (w2 pV/electron).
G v = video voltage gain,
AT = telescope apparent aperture,
t = integration time,
Q = CCD quantum efficiency,
IT - optical path lose due to (a) camera window and
(b) atmospheric extinction.
to

The reference photon flux value of 4.55 x 10 4 photons/m 2 /sec is for a 15-M v solar objectat the face of the telescope at an altitude of 4 kft through one site-air-mass.
2. Measurement Description
For periods of relatively stable seeing conditions for all three site-tests, several solar-
type calibration stars were observed and camera output voltages were measured for a wide range
of visual magnitudes and several imager integration periods. Because it was necessary to record
the existing light-per-pixel distribution using A-scope traces to permit derivation of the appro-
priate PSF correction factors, observations were made in STARE mode only.
3. Results
In Test I, a large number of calibration stars were observed under varying conditions. The
accumulatcd amplitude data are shown in Fig. 14 which is a plot of the stellar visual magnitude
vs CCD camera video output voltage. The dashed line in this figure represents a least-squares
fit to the measured data. The solid line is the calculated responsivity characteristic using the
model described above. Although the measurements were made at several different integration
times, the plot is normalized to 0.4-sec integration and single-pixel seeing performance. The
degree of scatter in the plotted data can be attributed to inaccuracies in estimating the PSF cor-
rection factor and atmospheric variations which are difficult to model.
-CALCULATED
9My0 5-0O0 0
'5r -
CCD CAMERA I TEST
01 02 05 1 2 5 10 20 50 110 200 5oo
Vop,.,V)
Fig. 14. Visual magnitude vs camera output.
Electro-optlcal responsivity measurements were conducted during all three site-tests using
STARE mode and primarily solar-type calibration stars. Samples of the data compared with
the design model are shown in Table IV. The samples were chosen to show the spread in agree-
ment with model. Visual magnitudes from 9.3 to 13.9 M were used. This range of amplitudes
gave sufficient signal-to-noise to eliminate the effects of noise from the measurements.
As seen in Table IV, surprisingly good agreement of better than 0.1 M was obtained between
Test TI measurements and model calculations. The model verification was not quite as impres-
sive in Test III because of hazy sky conditions during this test period that could not be modeled
sufficiently.
19

TABLE IV
CCD CAMERA ELECTRO-OPTICAL RESPONSEMODEL EVALUATION
Object M PSF Measured M AM
Test I SA- 102-739 10.77 3.7 10.21 -0.56SA-100-607 10.06 3.1 9.32 -0.74SA-97-346 9.27 3.1 9.19 -0.08
SA-99-90 10.24 3.8 9.41 -0.83
Test II SA-115-350 11.05 1.8 11.02 -0.041-69 12.27 2.0 12.32 +0.07SA-115-271 9.70 9.0 9.63 -0.071-50 13.86 1.8 13.77 -0.09
Test III SA-107-998 10.44 2.2 10.66 +0.22SA- 107-691 11.08 2.1 11.45 +0.37
SA-96-25 12.3 2.4 12.68 +0.38SA-96-517 11.43 3.5 11.10 -0.33
* Bright object used for high signal-to-noise
" Model validated to within 0.83 to 0.04 AM range
C. Electro-Optical Imager Sensitivity
1. Definitions
The evaluation of the CCD imager camera capability also included a measure of the obser-vation sensitivity, which for these tests involved the comparison of the minimum-light-levelstars visually detected on the CCD monitor with the calculated sensitivity limits based on thedesign model. The CCD camera sensitivity is not only limited by the electro-optical respon-sivity evaluated above, but also the CCD imager and video circuits electronic noise and existingnight- sky background.
The predicted CCD camera sensitivity is calculated based on the approximate signal-to-noise relationship*
S/N (Sig
sig + *NSB + Ni)
* R. Weber and T. H. Brooks, "The Limits of Detectability of a Low- Light- Level Point-SourceSensor as a Function of Telescope Aperture, Sensor Resolution, Night-Sky Background, andPre-readout Electron Gain,* Technical Note 1974-21, Lincoln Laboratory. M.I.T.(16 August 1974), DDC AD-785137/1.
20

where
Vsig = number of photoelectrons collected per pixel from the point target,
tNSB z as above, but from night-sky background, and
Ni = rms number of noise electrons referred to the first video
amplifier input at the specified CCD readout clock rate.
This relationship can be restated, solving for minimum target photon flux at the face of the
telescope, with the resultant quadratic expression:
Q2AT2 tZ) 0 Z - ATQITt(S/N) 2 0s- [OBG ATITQt(S/N) + N. 2 (S/N)Z ] = 0 (6)QAT 1T s -I
where
0 = night-sky background photon flux,
a - resel angular size,
S/N = single-pixel signal-to-rms-nolse ratio, assumed to be equal to 6
for automatic system detection,
and all other parameters are as defined in Eqs. (3) and (4) above.
After solving for the minimum photon flux, Eq. (3) above can be used to calculate the visual
magnitude sensitivity limit.
Since the realistic seeing conditions cause some of the photon flux to be distributed over
several pixels, the PSF correction as derived previously must be applied to the minimum photon
flux calculated above, resulting in a degradation in sensitivity.
2. Measurement Description
Because the measured sensitivity limits for these electro-optical tests were essentially the
minimum calibrated stars observed on the video monitors by the CCD camera operator rather
than actual magnitude measurements, sensitivity tests were possible for both the STARE and
IMC modes of operation. At several intervals during the low-light-level observations, the focus
conditions were checked and updates on night-sky background and extinction were obtained when
practicable.
In the STARE mode low-light-level observations, the calibration star field was observed
after scan conversion on television monitors. The CCD readout frame rates were typically
between 1 and 5 Hz. These continually updated video frames permitted a degree of observer
"eye integration' on the TV monitor, thus requiring lower signal-to-noise ratios for detection.
However, in the case of the IMC mode sensitivity tests, a single "onetime" video frame of the
calibrated star field being scanned was captured, scanned, converted, and 3tored for viewing
on the TV monitor. Observer leye Integration P was not possible and, therefore, signal-to-
noise ratios of at least 3-to-6 were required for visual monitor detection in IMC mode.
Many of the low-light-level calibrated stars used in the tests were not dirE *% observable
with the Ebsicon 14-In, telescope sensor. Therefore, the CCD camera on the 3t-in. telescopes
was used to make the final target acquisitions for these sensitivity tests.
3. Results
A summary of the electro-optical sensitivity model evaluation results is presented in
Table V for all three ETS site-tests. Shown are the integration times and differences in visual
21
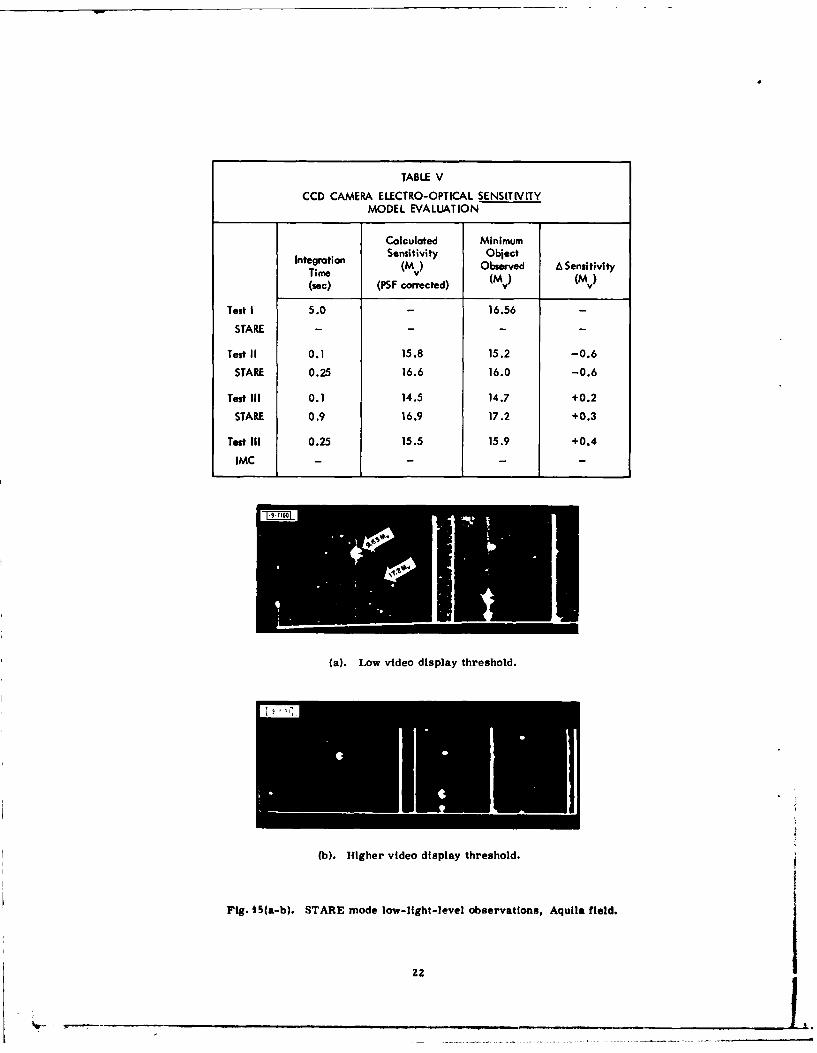
TABLE V
CCD CAMERA ELECTRO-OPTICAL SENSITIVITYMODEL EVALUATION
Calculated Minimum
Integration Sensitivity ObjectTime (MV) Observed A Sensitivity(sec) (PSF corrected) (M V) (MV)
Test 1 5.0 -16.56
STARE - - -
Test 11 0.1 15.8 15.2 -0.6
STARE 0.25 16.6 16.0 -0.6
Test 111 0.1 14.5 14.7 +0.2
STARE 0.9 16.9 17.2 +0.3
Test 111 0.25 15.5 15.9 +0.4
IMC - - -
(a). Low video display threshold.
(b). Higher video display threshold.
Fig. 15(a-b). STARE mode low-ligh t-level observations, Aquila field.j

magnitude between predicted model sensitivity and the dimmer objects observed. The calculated
sensitivity levels included values for existing night-sky background, and extinction, system elec-
tronic noise level, and PSF allowances for the indicated integration times and a S/N of 6.
Sensitivity predictions for Test I were not modeled because the CCD imagers that were
available for this preliminary test had a fabrication defect which required relatively low clock
voltages. The low clock voltages resulted in less-than-desirable array transfer efficiencies
which limited low-light-level performance.
Although TMC mode operation was used in Test 11, cooling of the CCD imager in IMC was
not attempted and, therefore, low-light-level measurements for this mode were not considered.
The comparison results of Table V show excellent agreement with the model predictions.
The plus signs in the results indicate observations at levels lower than the predicted limits.
STARE mode amplitude measurements made on some of the minimum object observations showed
signal-to-noise values greater than 6.
Examples of calibration star field observations are shown in the photographs in Figs. 15(a)
through (d). Both STARE and IMC mode data are shown from the third site-test. The CCD video
was scan-converted to TV format for display. The STARE mode fields [Figs. 45(a) and (b)] are
100 pixels high by 400 pixels wide. This field in Aquila (19:59.3 RA1950, +04°50, DEC 1950)
shows a bright object 9.63 Mv and a nearby dim object 17.2 My, as indicated In Fig. 15(a). The
circular blooming of the bright objects does not occur in the CCD imager, but is caused by point
saturation blooming in the TV monitor. The charge spillover in the CCD remains in-column as
seen in the figure. Blemishes in the CCD are displayed as columns and hot spots in the STARE
mode.
For the IMC mode blemishes are displayed as bright columns only, as seen in Figs. 15(c)
and (d) for which the field covers approximately 480 by 384 pixels made possible by the expand
memory of the digital scan converter. The expanded stored field is a captured segment of the
sky which was being continuously scanned by the telescope in declination at +1104 ie/sec with
a constant RA value and sidereal drive running. Although the SA-100 star field for this field-
of-view is only calibrated down to 13.9 My. interpolation of data from video tape recordings
shows an observation of a star at 16 Mv with S/N > 6 as Indicated in Fig. 15(c).
D. Satellite Observations
The series of preliminary site-tests covered in this report was mainly concerned with
electro-optical measurements. No automatic satellite detection capability was tested. However,
satellite objects were observed during the tests for functional qualitative demonstrations. More
than twenty satellites were acquired and tracked in the STARE and TMC modes.
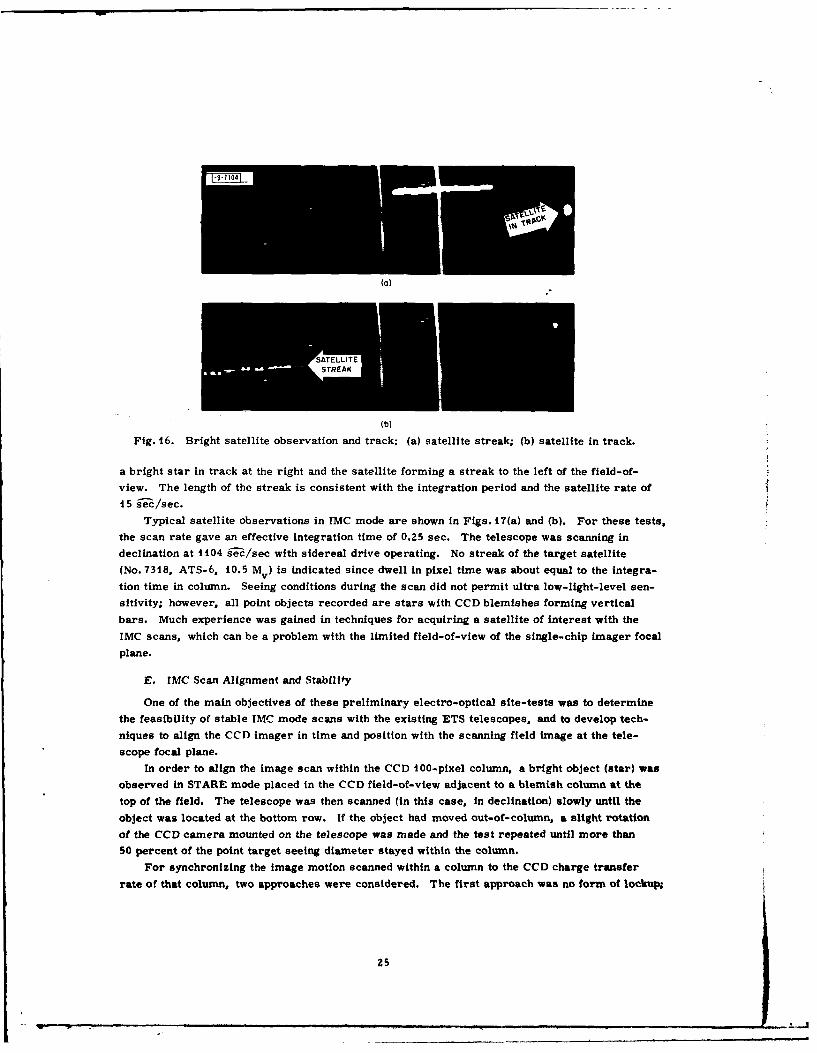
Figures 16(a) and (b) are examples of STARE mode satellite observations in Site-Test I.
Shown are photographs of TV monitor presentations of the 100- x 400-pixel Imager CCD video
after scan conversion. Integration of -8 sec was performed on the CCD followed by 0.1-sec
readout of the CCD array. Video gain was greatly reduced for this test to eliminate saturation
of electronics. Figure 16(a) shows the relatively bright satellites (No. 8565, CTS-t, at -12.5 Mv?
In track at the right of the field-of-view. The bright streak to the left is caused by a bright star
being in the field-of-view while tracking the satellite. The bright vertical streaks and small
point objects are CCD blemishes. In Fig. 16(b) the telescope is locked In sidereal drive, with
23

op .Lwvde ipa trsod
(). Highe video display threshold.
'Fig. 15(c-d). TMC mode low-light-level observations. SA-100 field.
24
-9-fl104
(a)
STREAK
(b)
Fig. 16. Bright satellite observation and track: (a) satellite streak; (b) satellite in track.
a bright star in track at the right and the satellite forming a streak to the left of the field-of-
view. The length of the streak is consistent with the integration period and the satellite rate of
15 ige/sec.
Typical satellite observations in IMC mode are shown in Figs. 17(a) and (b). For these tests,
the scan rate gave an effective integration time of 0.25 sec. The telescope was scanning in
declination at 1104 9ie/sec with sidereal drive operating. No streak of the target satellite
(No. 7318, ATS-6, 10.5 My) is indicated since dwell in pixel time was about equal to the integra-
tion time in column. Seeing conditions during the scan did not permit ultra low-light-level sen-
sitivity; however, all point objects recorded are stars with CCD blemishes forming vertical
bars. Much experience was gained in techniques for acquiring a satellite of interest with the
IMC scans, which can be a problem with the limited field-of-view of the single-chip imager focal
plane.
E. IMC Scan Alignment and Stability
One of the main objectives of these preliminary electro-optical site-tests was to determine
the feasibility of stable IMC mode scans with the existing ETS telescopes, and to develop tech-
niques to align the CCD imager in time and position with the scanning field image at the tele-
scope focal plane.
In order to align the image scan within the CCD 100-pixel column, a bright object (star) was
observed in STARE mode placed in the CCD field-of-view adjacent to a blemish column at the
top of the field. The telescope was then scanned (in this case, in declination) slowly until the
object was located at the bottom row. If the object had moved out-of-column, a slight rotation
of the CCD camera mounted on the telescope was made and the test repeated until more than
50 percent of the point target seeing diameter stayed within the column.
For synchronizing the image motion scanned within a column to the CCD charge transfer
rate of that column, two approaches were considered. The first approach was no form of lockup;
25

Fig. 17. Satellite ATS-6 acquired in IMC scan: (a) low video display threshold,
(b) higher video display threshold.
26

the telescope scan rate was adjusted until charge transfer and image scan rates were equal. Thesecond technique, using lockup, provided digital circuitry which measures (with selectable inte-gration) the encoder output of the scanned axis of the telescope mount. The measured scan rateis used to determine the charge transfer clock rate of the CCD while the scan is proceeding.This lockup technique would not eliminate rate mismatch due to high frequency jitter, but would
cancel slow rate drift mismatch.The lockup technique could not be tested during the site-tests because anomalies in the tele-
scope drive led to noisy encoder outputs. These anomalies have been removed since the lasttest period. Laboratory tests of the lockup circuitry indicate successful operation with simulatedrate drift conditions.
During the IMC site-tests, telescope scan rate drift in joystick modes was found to be in-
significant for the single-chip 0.25-sec scan periods; therefore, transfer rate lockup was notrequired. The photographs of video displays in Figs. 18(a) through (c) show the results of sync
and non-sync IMC scans. The displays are captured frames of 100 × 400 pixels. In Fig. 18(a),the imaged stars are processed as circular objects indicating full synchronized scan. Seeingconditions were about 1.5 to 2.0 pixels for these tests, with low video gain and the CCD operatingat ambient temperature. The telescope scan rate was intentionally increased by about 10 percentover the sync rate for Fig. I 8(b), yielding an elongated image in the scan direction of about10 out of 100 pixels, as would be expected. The slight slope deviation from vertical of the elon-
gation is due to about one-half pixel misalignment of the CCD array with respect to the scandirection. A rate change of about IZ-percent reduction was used for Fig. 18(c), resulting in theexpected image smear or elongation of -13 to 14 pixels and with the opposite slope to vertical
compared with the rate increase mismatch of Fig. 18(b).
The IMC scan tests indicate that for the 100-pixel (single-chip) scan case and in the absenceof high-frequency mechanical jitter, the ETS telescope mounts are adequate for this mode ofoperation. For the future 5-chip focal-plane IMC site-tests, a scan rate stability with jitter and
rate drift less than 0.1 percent is required over the 3-sec focal-plane scan period. Themicroprocessor-controlled telescope drives at ETS presently hold the scan rate to better than0.1 percent, and photographic plate measurements indicate that the rate jitter should also be
less than the required upper limit.
F. Scan Comparison Demonstration
During Site-Test Ill, a test was conducted which provided a demonstration of the operatingdynamics of the CCD scanning in TMC mode compared with a STEP-STARE mode sensor such
as the Ebsicon. The test involved the two 31-In, telescopes at the ETS simultaneously scanningin declination with sidereal drive at about the same right-ascension position.
Both telescopes scanned In positive declination at 1104 "e/sec. On one telescope, the CCDsingle-chip camera was mounted at the prime focus position yielding a field-of-view of about0.3. On the other telescope, the Ebalcon camera was mounted at the Cassegralnian position
and operated In zoom, yielding a comparable field-of-view of about 0.5%The CCD camera video was scan-converted to TV format and sequential frames were digi-
tally captured, displayed, and video-tape recorded. The Ebsicon camera video was also video-tape recorded. The two video-tape recordings were used to generate a movie strip of the simulta-neous scans displayed side-by-side. Figure 19 shows a sample frame of the movie strip. TheCCD video shows the utility of Image motion compensation to generate useful video information
27

RINI
(a)
(b)
(c)
Fig. 18. IMC mode scan synchronization tests: (a) IMC scan full sync; (b) +10-percentscan rate offset; (c) -12-percent scan rate offset.
28

0.33* 0.1 5* s(+ 104 sec/seec declinotion scan)
CCD CAMERA - IMC MODE ESSICON CAMERA - TV MODE
Fig. 19. Frame from movie of declination scan comparison of CCD and Ebsicon cameras.
during the efficient, continuous high-rate scan. The Ebsicon video display in the movie shows
the high density of objects (stars) and the short-period time available in the high-rate scan for
measurement.
V. CONCLUSIONS
These preliminary electro-optical field-tests of the Lincoln Laboratory-developed CCD
imagers have achieved all test objectives and form a useful basis of experience for the future
CCD automatic detection system tests at the ETS. Several factors encountered during the tests.
which will have to be addressed for the next series of tests, are:
(a) The three site-tests provided many opportunities for measurement and
evaluation of the realistic optical seeing conditions to be expected at the
ETS. Although the "nominal-good3 seeing provides approximately single-
pixel imaging for the existing CCD design, the occurrence of this conditionis very rare. Therefore, both an estimate of automatic detection system
performance degradation as a function of seeing conditions as well as real-
time video processing techniques for minimizing the effects of multi-pixel
seeing are recommended for future tests.
(b) A considerable amount of electronic interference pickup in the low-noise
video subsystems was encountered in these preliminary tests at the ETS
which did limit the sensitivity performance compared with measurements
conducted in the laboratory. Efforts will be required to locate and elim-inate the sources of this Interference.
(c) The dynamics of the telescope mounts at the ETS result in high frequency
jitter as well as low frequency rate drift during the high rate scans for the
IMC mode. Various components of the mount drives including torque motors
and gear surfaces must be in top working condition to reduce these effectsto acceptable levels. For each telescope mount there are particular regions
of RA and DEC within which the most stable scans exist. The IMC mode
testing should emphasize these regions.
29
_ __ _ _,___ _ _ __ _ __ _ .. tk

(d) The operational and object acquisition techniques developed during thesetests indicate that it is desirable to have the capability for fast switchingbetween STARE and IMC modes of operation. This capability will permitreal-time local metric calibration of the CCD Peld-of-view immediatel-preceding an IMC limited scan of a required target.
ACKNOWLEDGMENTS
The CCD imagers used in the reported tests were developedand characterized by Dr. Barry E. Burke of the Microelec-tronics Group. His expertise in solid-state device researchas well as his interest and thoroughness in this program
are greatly appreciated.
The authors also express their appreciation for the high-quality technician support provided by Kenneth M. Tibbetsin fabrication and field-testing of the experimental system.The thorough preparations, expert support, and interest con-tributed by site personnel, particularly Dr. William E. Krag,Dr. Eugene W. Rork, David E. Beatty, Frank W. Thomason,and Robert L. Trelan, are greatly appreciated. The authorsare also grateful to Marie Grey for her patience and exper-tise in typing this report, and to Edward Freedman for pro-gramming support for the STARE mode digitizer tests. Theassistance of Anthony J. Yakutis in supplying video display.recording, and his experienced help in post-test data review
are greatly appreciated.
30
!~~~~~~4 ... _ !mn ,I

UNCLASSIFIEDSECURITY CLASSIFICATION OF THIS PAGE (When Data Entered)
REPORT DOCUMAENTATION PAGE BEFORE COMPLETING FORM-1. REPORT 8C .GOVT ACCESSION NO. 3. RECIPIENT'S CATALOG NUMBER
ESD-TR-79-326 A R0 1 64- TITLE (-ad Subs,I1e) 5. TYPE OF REPORT A PERIOD COVERED
Electra-Optical Tests of CCD Imagers Tcncl~pt.
at the G EODSS ETS jTechnical Report 539
7. AUTHOR(0J 8.CON AG*-OR-Ge*At4TN tBIMERfs
Daniel F Kostishack Carl H yfp e, Jr. F92-#CWI' Malcolm J. ac~onald Norman G.S Pong
9. PERFORMING ORGANIZATION NAME AND ADDRESS 0.POOA-LMNPROJECT. TASKCAREA A WORK UNIT NUMBERS
Lincoln Laboratory, M.I.T. -'Program Element Nos.63428FP.O.~ ~ ~ ~ Bo/3ad144
Lexigton MA 2173Project No. 322111. CONTROLLING OFFICE NAME AND ADDRESS 12. REPORT DATE
Air Force Systems Command, USAF ---- 20 February 1980Andrews AFB , i~ ~ . IO AE
Washington. DC 20331 ( r p /f) 3
14. MONITORING AGENCY NAME A ADDRE SS (if different from Controlling Office) -I . 3TCURITY CLASS. (of this report)
Electronic Systems Division UnclassifiedHanscom AFB n(I)T ~, 5. DECL ASSI FICATION DOWNGRADINGBedford, MA 01731 SCH EDULE
16. DISTRIBUTION STATEMENT (of this Report)I
Approved for public release; distribution unlimited.
17. DISTRIBUTION STATEMENT (of the abstract entered sn Stock 20, ifilifferent iom Report)
10. SUPPLEMENTARY NOTES
None
19. K EY WORDS (Consinue on reverse side if necesseary Oa identify by block num be')
electro-optical devices deep space surveillancecharge-coupled device Imagers automatic detection systemSTARE mode lmage-motlon-compensation (lMC) modeG EODSS
70. ABSTRAC,>Csniaeon reverse side JI eessemy ad ideanily by bloek number)
As part of the GEODSS-CCD Technology Program, a series of three electro-optical testsof CCD imagers was conducted on the GEODSS Experimental Teat System (ETS) at Socorro,New Mexico. The tests were preliminary to establish the basis for developing and testing anadvanced CCD automatic detection system which would provide improved sensitivity and scancoverage rate for GEODSS applications. These preliminary tests resulted in the successfuldemonstration of STARE and lmage-motlon-compensatlon (IMC) modes of operation. andprovided a thorough evaluation and verification of present CCD system design models. Also,interesting electro-optical performance levels were demonstrated, compared with existingGEOIDSS system designs
D @D BINO I )AN\4 OSU3T UNCLASSIFIED , ) 1/ <SECURITv CLASSUPICAYION OF TIlS PA@E (l..no teed) )