lloyd’s ils investor presentation/media/files/lloyds/investor...c t u a l 2 0 1 4 a c t u a l 2 0...
TRANSCRIPT

Lloyd’s ILS Investor Presentation
© Lloyd’s
February 2018
John Parry, Chief Financial Officer

2
Disclaimer
© Lloyd’s
This information is not intended for distribution to, or use by, any person or entity in any jurisdiction or country where such distribution or use would be contrary to local law or regulation. It is the responsibility of any person publishing, downloading or communicating the contents of this document or communication, or any part thereof, to ensure compliance with all applicable legal and regulatory requirements.
The content of this presentation does not represent a prospectus or invitation in connection with any solicitation of capital. Nor does it constitute an offer to sell securities or insurance, a solicitation or an offer to buy securities or insurance, or a distribution of securities in the United States or to a U.S. person, or in any other jurisdiction where it is contrary to local law. Such persons should inform themselves about and observe any applicable legal requirement.

3© Lloyd’s
Strategy 5
Brexit 8
Oversight 11
Capital 15
Central Fund – ILS opportunity 28
Agenda

Strategy
© Lloyd’s

5
The benefits of placing business and operating at Lloyd’s
© Lloyd’s
The advantages of operating at Lloyd’s remain strong
Customers & distribution Capital Operations & services
• Access to business brought to Lloyd’s
• A broad and expanding licence network in over 200 territories
• Delegated authority and subscription models
• All policies underpinned by the Central Fund
• Efficient and Flexible
• Single Financial Strength Rating
• Economies of scale from central services
Talent Brand Market oversight
• The Lloyd’s market is a recognised centre of specialist underwriting, claims and analytics expertise
• Lloyd’s has a globally recognisable brand
• Reputation for paying all valid claims in a timely and efficient manner
• Corporation oversees risks written at Lloyd’s
• Proportionate and robust market oversight regime consistent with an entrepreneurial and innovative culture

6
New entrants
© Lloyd’s
7
6
8
5
3
2
4
3
2
4
3
3
2
1
4
2
3
4
4
4
1
1
1
1 1
4
3
1
0
2
4
6
8
10
12
2007 2008 2009 2010 2011 2012 2013 2014 2015 2016 2017 2018
Approved Managing Agents
Approved SPA
Approved Syndicates
Interest in business joining the Lloyd’s
Market remains strong.
The SPA structure remains attractive for the
development of new businesses.
Groups are continuing to access the market
initially at member level, supporting third
party syndicates.

Brexit
© Lloyd’s

8
Why do we need the Lloyd’s Brussels subsidiary?GWP(1) (EUR MN)
© Lloyd’s
1,445
1,447
1,202
2,891
1,202
Note: (1) based on 2016 EEA GWP, excluding Life
Accessible
Reverse solicitation
Prohibited
Accessible via LIC
Do nothing – World Trade Organisation Rules Lloyd’s Insurance Company

9
.
• Lloyd’s Brexit lobbying position: continued trade with Single Market. No ‘hard Brexit’, transitional arrangements instead. Ongoing engagement with UK Government
• Brussels Subsidiary will be a fully fledged Insurance Company, fully regulatory and tax compliant
• Allows continued trading under the Lloyd’s brand and benefiting from Lloyd’s robust financial ratings
• Maximum Reinsurance back to syndicates (100%)
• Initial capital injection from Society of Lloyd’s
Timeline of the Lloyd’s Brussels subsidiary
Lloyd’s
October 2017Regulatory application submitted
July 2018Operationally ready
and regulatory authorisation
received
Q2 2018Market onboarding
Q4 2017Company set-up 1 Jan 2019
March 2019UK exits EU
Timeline:
Live Trading Q3 2018Business
processing
© Lloyd’s

Oversight
© Lloyd’s

11
Risk Appetite Framework
Key Corporation risk Market oversight risk
Corporation purpose:
Board level Tier 1 metrics
Pillar: Sustainability
Strategic, Group, Insurance, Credit
Pillar: Solvency
Market, Liquidity
Pillar: Operational
Reputation, Legal & Reg, Conduct
Under our trusted name, the Corporation acts to create and maintain a competitive, innovative and secure market. Our dedicated people serve to protect and promote the interests of the market and its policyholders, provide valued services to market participants and advance the interests of
capital providers over the long term
Delivery metrics
Monitoring metrics
Attractiveness of Lloyd’s Market
Underwritingprofitability
Syndicate capability
Liquidity
Reinsurance failure
Catastrophe exposure
Reserve deterioration
Central Fund investment
Operational effectiveness
Financial crime and sanctions
Regulatory, legal & tax compliance
Conduct
Cyber (data protection and
theft)
Risk objective: Management of financial risks ensures that Lloyd’s is not exposed to undue
concentration and is able to withstand an extreme event & trade forward
Risk objective: Risk of operational and other events is managed to ensure Lloyd’s
maintains its strong reputation
Risk objective: Lloyd’s strategy must deliver a sustainable business model over the
medium term
Board reporting dashboard = 13 key metricsLloyd’s has redeveloped the risk appetite framework
© Lloyd’s

12
Performance Management – four priorities
© Lloyd’s
Operating expenses
Market facilities
Acquisition costs
Catastrophe cover

13
Approach to business planning
© Lloyd’s
Focus on combined ratio
20
13
act
ua
l
20
14
act
ua
l
20
15
act
ua
l
20
16
act
ua
l
20
17
pla
n
20
18
pre
HIM
pla
n
20
18
po
stH
IM p
lan
Entry = closing a performance gap
High-level plan
New timetable: staggered deadlines
Direct presentations to CPG
Pre HIM
Post HIM
Rate vs exposure changes

Capital
© Lloyd’s

15
Lloyd’s capital base is diversifying in line with our strategy
© Lloyd’s
US Insurance Industry
2011 – 23.1%2017 – 18.8%
UK Insurance Industry 2011 – 22.6%2017 – 13.0%
Japan Insurance Industry
2011 – 5.5%2017 – 13.7%
Bermuda Insurance Industry
2011 – 18.2%2017 – 15.9%
European Insurance Industry 2011 – 4.7%2017 – 11.5%
Middle/Far East Insurance Industry
2011– 0.4%2017 – 2.8%
Private Capital 2011 – 12%2017 – 10.2%
Worldwide Non-Insurance 2011 – 8.1%2017 – 4.2%
Rest of World Insurance Industry 2011 – 5.5%2017 – 9.8%
Other Capital Sources:

16
Strong and Flexible Capital Structure:
All premiums received by a syndicate are held in its premium trust funds and are the first resource for paying policyholder claims from that syndicate.
Each member provides Capital to support its underwriting at Lloyd’s. Each managing agent produces its own capital assessment in respect of each managed syndicate stating how much capital it considers is needed to cover its underlying business risks with a 99.5% confidence level.
The central assets are available at the discretion of the Council of Lloyd’s to meet any valid claim that cannot be met by the resources of any member. It is funded by members’ annual contributions and subordinated debt issued by the Society in 2014 and 2017.
3
2
1severalAssets
Syndicate level Assets£52,983m
Callable layer(≤ 3%) 2
£875m
Subordinated Debt/Securities £792m
Central Fund £2,030mCorporation Net assets1
Members Funds at Lloyd’s (FAL)£22,291m
SecondLink
Firstlink
ThirdLink
mutualAssets
Lloyd’s “Chain of Security”
Cla
ims/ Losses
1) Corporation net assets: Corporation Reserves, Associates Reserve, Revaluation Reserve, Translation Reserve; 2) Callable layer: Central Fund assets may be supplemented by a ‘callable layer’ of up to 3% of members’ overall premium limits in any one calendar year. These funds would be drawn from premium trust funds. Source: Lloyd’s pro forma financial statements, 30 June 2017
£83m

17
Balance sheet
Balance sheet
£m December 2014 December 2015 December 2016 June 2017
Cash and investments 54,889 56,900 67,646 65,941
Reinsurers’ share of unearned premiums 1,976 2,368 3,110 4,422
Reinsurers’ share of claims outstanding 8,785 8,610 11,310 11,963
Other assets 14,063 15,751 19,536 23,122
Total assets 79,713 83,629 101,602 105,448
Gross unearned premiums (12,652) (13,723) (16,548) (19,212)
Gross claims outstanding (38,134) (38,833) (47,747) (47,373)
Other liabilities (5,514) (5,975) (8,710) (10,884)
Net resources 23,413 25,098 28,597 27,979
Member assets 20,835 22,453 25,718 25,074
Central assets1 2,578 2,645 2,879 2,905
Source: Lloyd’s pro forma financial statements, 30 June 2017. 1Central assets are the net assets of the Society including the Central Fund, excluding subordinated debt liabilities and the callable layer.
December 2014 – HY 2017

18
Lloyd’s financial strength ratings are strong
© Lloyd’s
Source: S&P Research update October 2017, S&P Full Rating Report September 2017, Fitch Ratings Press Release October 2017, Fitch Ratings Full Rating Report July 2017, A.M. Best press release July 2017, Best’s Rating of Lloyd’s 2017, September 2017
Ratings Standard & Poor’s Fitch Ratings A.M. Best
Insurer financial strength (IFS)
Affirmed October 2017Negative outlook
Affirmed October 2017Negative outlook
Affirmed July 2017Stable outlook
Subordinated debt rating
A- A- a-
Key strengthsquoted by the rating agency
• Very strong competitive position with wide geographic and product coverage
• Very strong capital and earnings and strong financial flexibility
• Strong risk controls, risk culture and risk management
• Very strong business profile and strong market performance
• Strong and well structured risk management framework
• Strong member and central capital
• Strong and stable risk-adjusted capitalisation
• Good financial flexibility
• Strong underwriting performance
• Excellent business profile
IFS Ratings
AA-
A+
A
A-
BBB+
S&P
2011 2012 2013 2014 2015 2016 2017
Fitch
AM Best
A+(Strong)
AA-(Very strong)
A(Excellent)

19
500300
0
100
200
300
400
500
2017 2018 2019 2020 2021 2022 2023 2024 2025 2026 2027
Nominal value (£m)
Lloyd’s Tier 2 subordinated debt outstanding
Debt Profile
Issue Date Issuer StatusBond Rating (S&P/Fitch)
CurrencyAmount Issued (£m)
Amount Outstanding
(£m)
Coupon (%)
First Call Date
Maturity Date
07 Feb ‘17Society of
Lloyd’sTier 2 A-/A- GBP 300 300 4.875 07 Feb ‘27 07 Feb ‘47
30 Oct ‘14Society of
Lloyd’sTier 2 A-/A- GBP 500 500 4.750 N/A 30 Oct ‘24
N.B.: Chart shows bonds at the earlier of maturity and first call date
© Lloyd’s
20
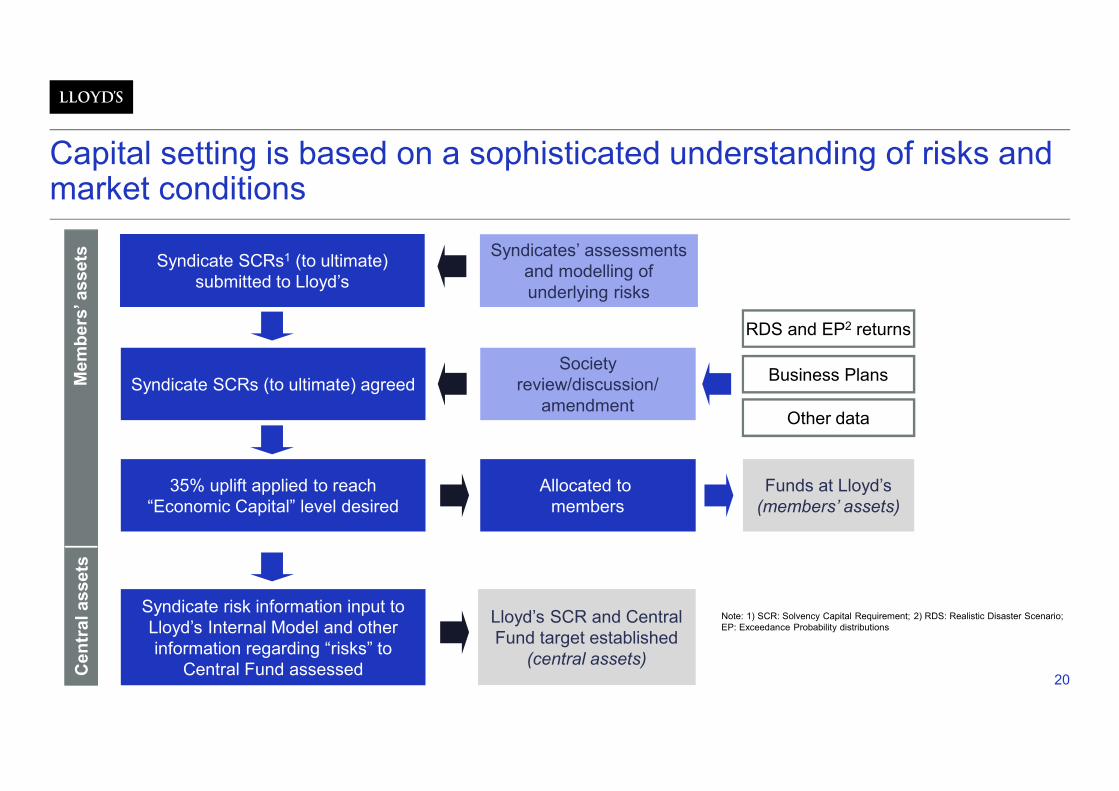
Capital setting is based on a sophisticated understanding of risks and market conditions
Syndicate risk information input toLloyd’s Internal Model and other information regarding “risks” to
Central Fund assessed
35% uplift applied to reach“Economic Capital” level desired
Syndicate SCRs (to ultimate) agreed
Syndicate SCRs1 (to ultimate) submitted to Lloyd’s
Allocated to members
Lloyd’s SCR and Central Fund target established
(central assets)
Funds at Lloyd’s(members’ assets)
Societyreview/discussion/
amendment
RDS and EP2 returns
Business Plans
Other data
Syndicates’ assessments and modelling of underlying risks
Mem
bers
’ assets
Cen
tral assets
Note: 1) SCR: Solvency Capital Requirement; 2) RDS: Realistic Disaster Scenario; EP: Exceedance Probability distributions

21
How does Lloyd’s calculate and cover solvency?
© Lloyd’s
Under Solvency II the Solvency Capital Requirement (SCR) must be calculated
Sufficient capital to cover a 1 in 200 year loss event for the entity over a one year time period
Lloyd’s calculates two SCRs
Both the Lloyd’s MWSCR and CSCR are calculated using Lloyd’s Internal Model
Solvency also assessed at the member level
SCR Scope of calculation Capital available to cover SCR
Lloyd’s Market Wide SCR (MWSCR)
Covers whole Lloyd’s market All capital held at Lloyd’s including syndicate assets, member level capital and central capital
Lloyd’s Central SCR (CSCR) Covers central risks only, in particular risk that members may not have enough capital to meet losses (and thus hit Central Fund)
Central capital – mainly the Central Fund
22
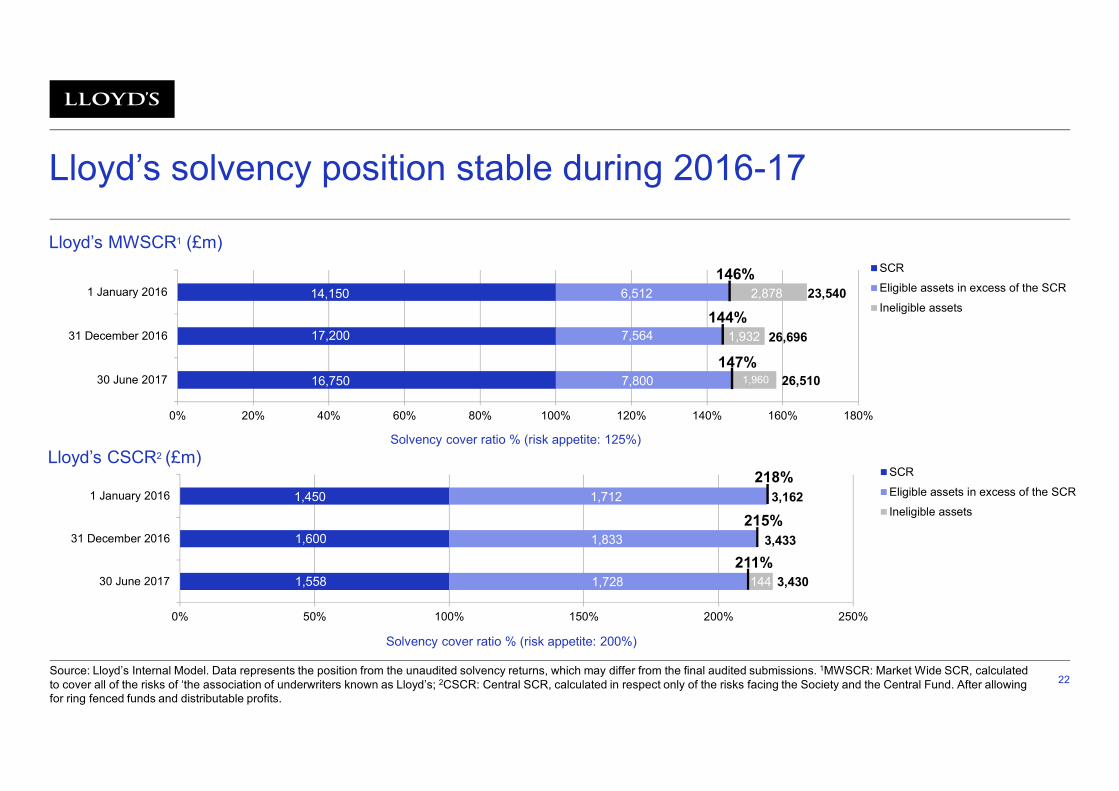
Lloyd’s solvency position stable during 2016-17
Source: Lloyd’s Internal Model. Data represents the position from the unaudited solvency returns, which may differ from the final audited submissions. 1MWSCR: Market Wide SCR, calculated to cover all of the risks of ‘the association of underwriters known as Lloyd’s; 2CSCR: Central SCR, calculated in respect only of the risks facing the Society and the Central Fund. After allowing for ring fenced funds and distributable profits.
0% 20% 40% 60% 80% 100% 120% 140% 160% 180%
30 June 2017
31 December 2016
1 January 2016
SCR
Eligible assets in excess of the SCR
Ineligible assets
Lloyd’s MWSCR1 (£m)
147%
144%
0% 50% 100% 150% 200% 250%
30 June 2017
31 December 2016
1 January 2016
SCR
Eligible assets in excess of the SCR
Ineligible assets
Lloyd’s CSCR2 (£m)218%
211%
26,510
1,932
7,800
7,564
1,558 3,430
1,600
1,960
3,4331,833
1,728
17,200
16,750
26,696
Solvency cover ratio % (risk appetite: 125%)
Solvency cover ratio % (risk appetite: 200%)
144
146%14,150 6,512 2,878 23,540
1,450 1,712 3,162
215%

23
Industry wide insured catastrophe losses Lloyd’s major claims1
Major claims < 5% of industry wide insured cat losses (to June)
GBP bnUSD bn
Note: 1) Indexed for inflation to 2016. Claims in other currencies translated at the exchange rate prevailing at the date of loss. Source: Swiss Re Sigma Report 2016, Lloyd’s Annual Report 2016 & Lloyd’s Interim Report 2017
0
1
2
3
4
5
6
2001 2002 2003 2004 2005 2006 2007 2008 2009 2010 2011 2012 2013 2014 2015 2016 2017H1
0
20
40
60
80
100
120
140
2001 2002 2003 2004 2005 2006 2007 2008 2009 2010 2011 2012 2013 2014 2015 2016

24
Impact of natural catastrophes in H2
© Lloyd’s
Industry estimates still vary widely
Significant industry losses
Market-turning event?
Earnings event?
Capital event?
It’s not only Harvey, Irma and Maria
USD Billions Industry loss estimates
EventLloyd’s net
claims estimatesLow range estimate
High range estimate
Harvey 1.8 7.5 35
Irma 2.1 32 55
Maria 0.9 15 40
Total 4.8 54.5 130
25
-
2,000
4,000
6,000
8,000
10,000
12,000
14,000
16,000
18,000
All othersyndicates
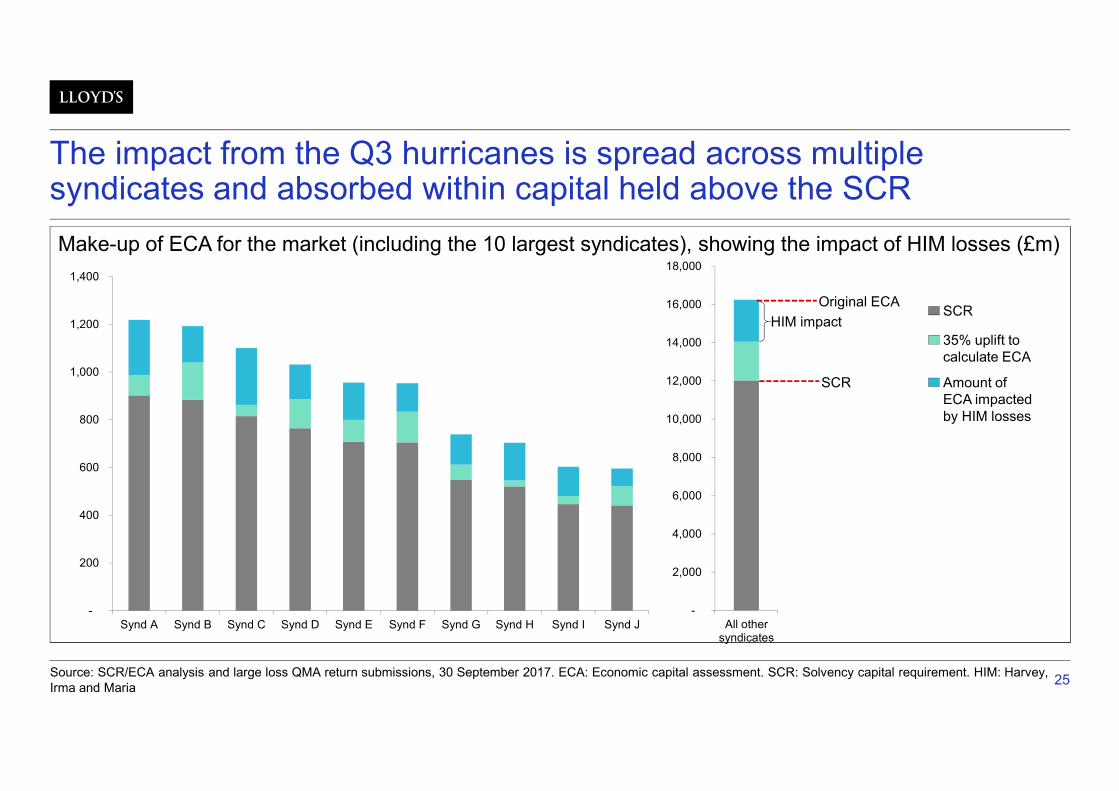
The impact from the Q3 hurricanes is spread across multiple syndicates and absorbed within capital held above the SCR
Make-up of ECA for the market (including the 10 largest syndicates), showing the impact of HIM losses (£m)
Source: SCR/ECA analysis and large loss QMA return submissions, 30 September 2017. ECA: Economic capital assessment. SCR: Solvency capital requirement. HIM: Harvey, Irma and Maria
SCR
SCR
Original ECA
35% uplift to calculate ECA
Amount of ECA impacted by HIM losses
HIM impact
-
200
400
600
800
1,000
1,200
1,400
Synd A Synd B Synd C Synd D Synd E Synd F Synd G Synd H Synd I Synd J
26
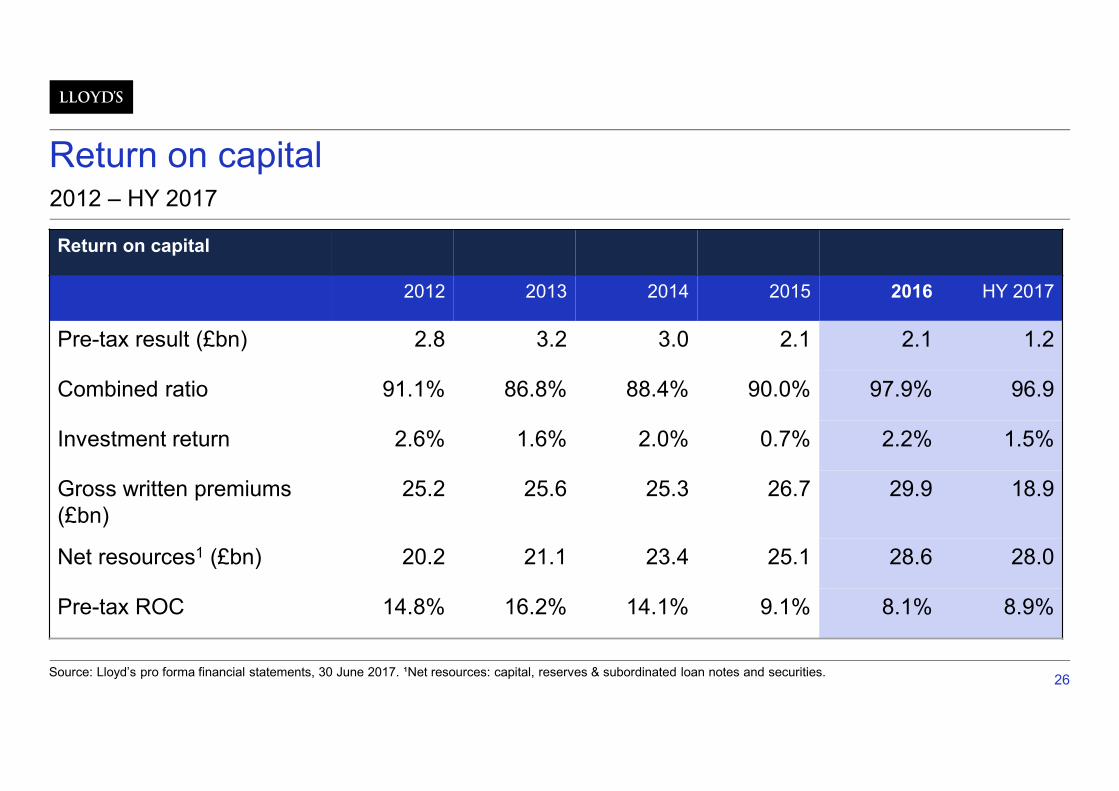
Return on capital
Return on capital
2012 2013 2014 2015 2016 HY 2017
Pre-tax result (£bn) 2.8 3.2 3.0 2.1 2.1 1.2
Combined ratio 91.1% 86.8% 88.4% 90.0% 97.9% 96.9
Investment return 2.6% 1.6% 2.0% 0.7% 2.2% 1.5%
Gross written premiums (£bn)
25.2 25.6 25.3 26.7 29.9 18.9
Net resources1 (£bn) 20.2 21.1 23.4 25.1 28.6 28.0
Pre-tax ROC 14.8% 16.2% 14.1% 9.1% 8.1% 8.9%
Source: Lloyd’s pro forma financial statements, 30 June 2017. ¹Net resources: capital, reserves & subordinated loan notes and securities.
2012 – HY 2017

ILS Opportunity (?)
© Lloyd’s

28
Current Lloyd’s capital structure
© Lloyd’s
Reminder
Central Fund (Discretionary) – Use requires cessation of Lloyd’s underwriting
SCR(U) as ECU: +35%
SCR(U): 100%
(Graphic represents the notional syndicate level stack)

29
Where would an ILS sit in Lloyd’s capital structure?
© Lloyd’s
Central Fund (Discretionary)
SCR(U) as ECU: +35%
SCR(U): 100%
(Graphic represents the notional syndicate level stack)
Potential ILS layers?

30
Insurance Risk dominates Lloyd’s SCR
Catastrophe risk30%
Non-Cat Premium risk37%
Reserving risk22%
Market risk2%
RI credit risk5%
Additional Central Fund risk2%
Operational risk2%
2017 SCR
Insurance risk 89% of total
© Lloyd’s

31
Lloyd’s solvency Q2 2017; current Central Assets Central solvency ratio
Tier 1 Tier 2 Tier 3 Total
£m £m £m £m
Society assets:- Subordinated debt (valued at fair value)1
- Deferred tax- Balance of net assets (net of Lloyd’s China provision)
Callable layer (available at the 1:200 year stress level)
1,827
680
88835
88835
1,827
680
Total central own funds available to meet the central SCR 2,507 888 35 3,430
Lloyd’s central SCR 1,558
‘Excess’ central own funds not eligible to meet central SCR - 109 35 144
Total central own funds eligible to meet the central SCR(Tier 2 and 3 assets can only cover up to 50% of central SCR)
2,507 779 - 3,286
Lloyd’s central solvency ratio 211%
(1) The 2014 and 2017 dated debt is Tier 2

32
Historical experience shows cash requirements lag declaration of losses to Central Fund…
0
200
400
600
800
1,000
1,200
1,400
1,600
2001 2002 2003 2004 2005 2006 2007 2008 2009 2010
£m
Net Paid Forecast drawdowns
Improved £578m
Source: Central Fund Accounts Dec 10 / Central Fund Modelling System

33
… and recent experience has minimal Central Fund losses
© Lloyd’s
-10
-5
0
5
10
15
20
25
2011 2012 2013 2014 2015 2016 2017
Ne
t lo
sse
s to
Ce
ntr
al F
un
d (
£m
)
All relates to 2007 & prior. No new hits 2008 to date
Nil Nil

34
Some rebuttable assumptions…
Central Fund solvency coverage meets risk appetite and supports the target Ratings
Central Fund exposure / concern is insurance risk…
…and is split roughly equally across natural catastrophe, other premium risk and reserve risk
Tier 2 allowance is maxed out
Restricted Tier 1 debt issue an option…
…to weigh against an ILS issue
Gearing and coupon / premium cover not a concern
© Lloyd’s

35
Key considerations for supplementing Central Assets
Cash v solvency
Post loss adequacy – second loss response?
Actual hit to CF or to benefit of members who trade forward?
Cat cover only or all insurance risks?
Multi year…run-off / collateral retention?
© Lloyd’s