lmi tuesdays!!!!!
TRANSCRIPT
NC Department of Commerce | Labor & Economic Analysis Division1
LMI TUESDAYS!!!!!
Session 9: North Carolina’s Industry Outlook!
September 7, 2021
NC Department of Commerce | Labor & Economic Analysis Division
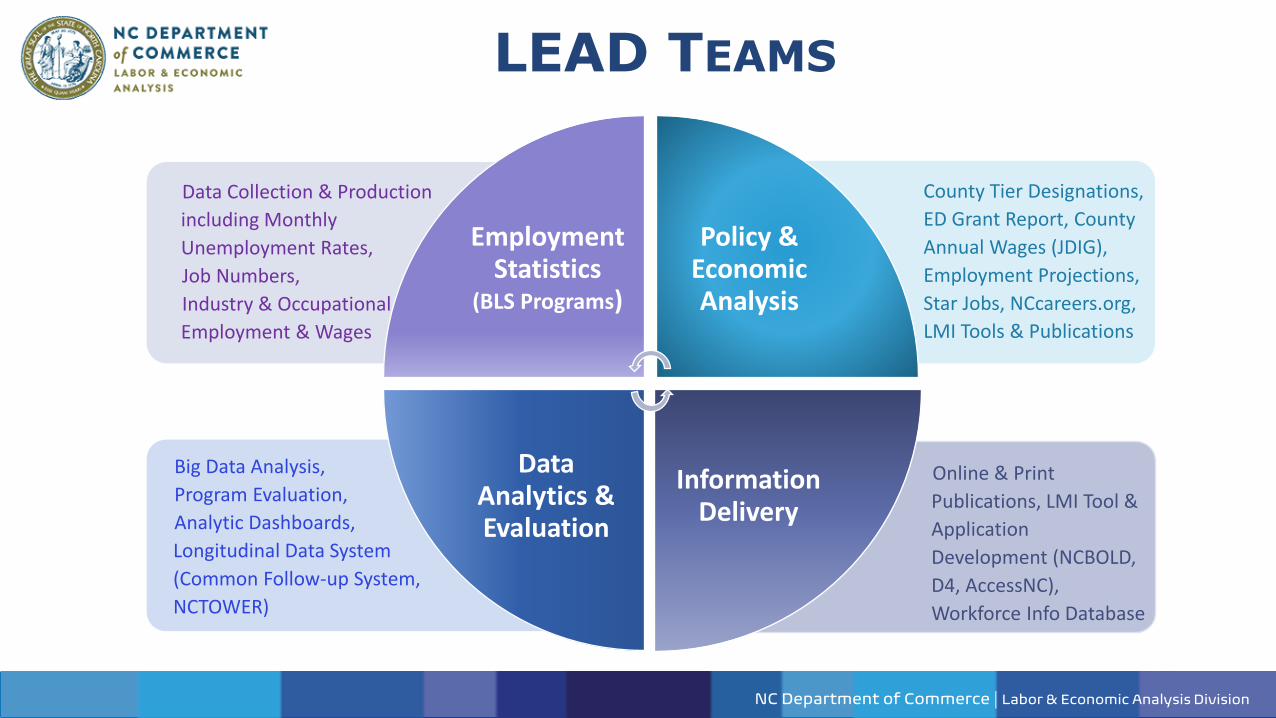
Online & Print
Publications, LMI Tool &
Application
Development (NCBOLD,
D4, AccessNC),
Workforce Info Database
Big Data Analysis,
Program Evaluation,
Analytic Dashboards,
Longitudinal Data System
(Common Follow-up System,
NCTOWER)
County Tier Designations,
ED Grant Report, County
Annual Wages (JDIG),
Employment Projections,
Star Jobs, NCcareers.org,
LMI Tools & Publications
Data Collection & Production
including Monthly
Unemployment Rates,
Job Numbers,
Industry & Occupational
Employment & Wages
Employment Statistics
(BLS Programs)
Policy & Economic Analysis
Information Delivery
Data Analytics & Evaluation
LEAD TEAMS
NC Department of Commerce | Labor & Economic Analysis Division
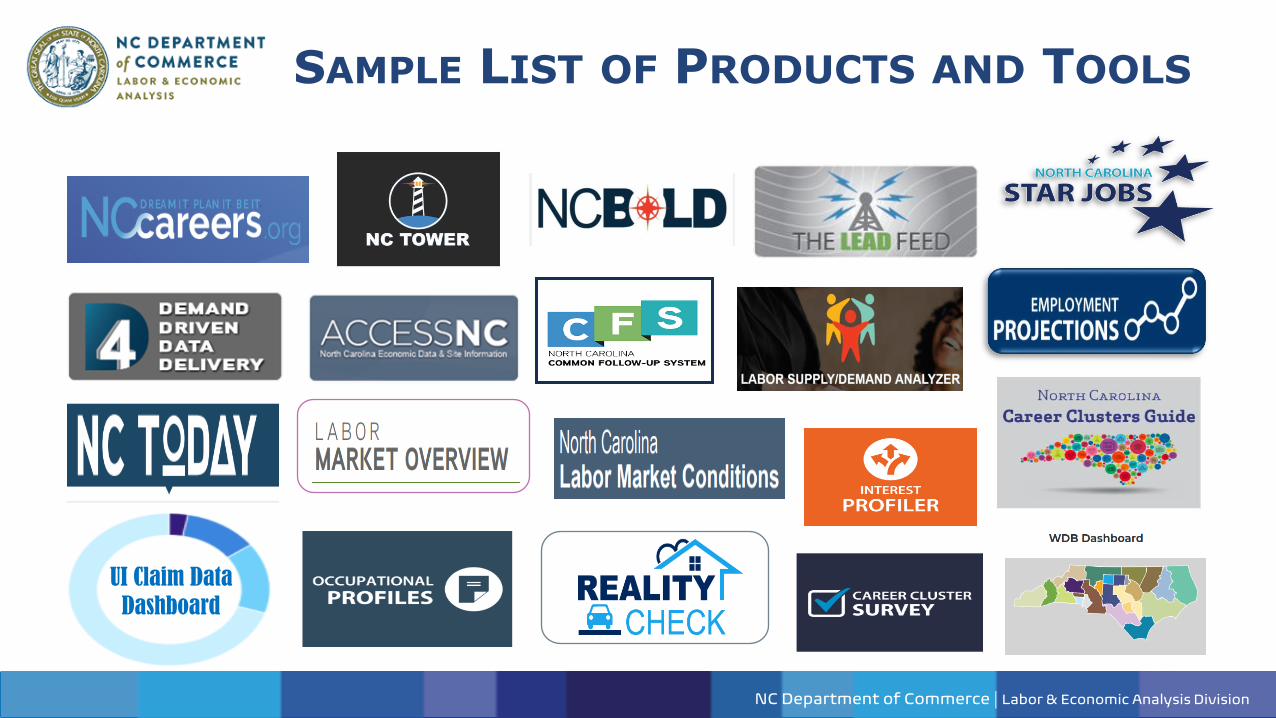
SAMPLE LIST OF PRODUCTS AND TOOLS
UI Claim Data
Dashboard
NC Department of Commerce | Labor & Economic Analysis Division4
1. What are the current industries and their locations?
2. Where do we project future growth?
NC Department of Commerce | Labor & Economic Analysis Division
https://d4.nccommerce.com/
Quarterly Census of Employment and Wages (QCEW)
• Latest 2021Q1• Down to County Level• Detailed Industries
5
NC Department of Commerce | Labor & Economic Analysis Division
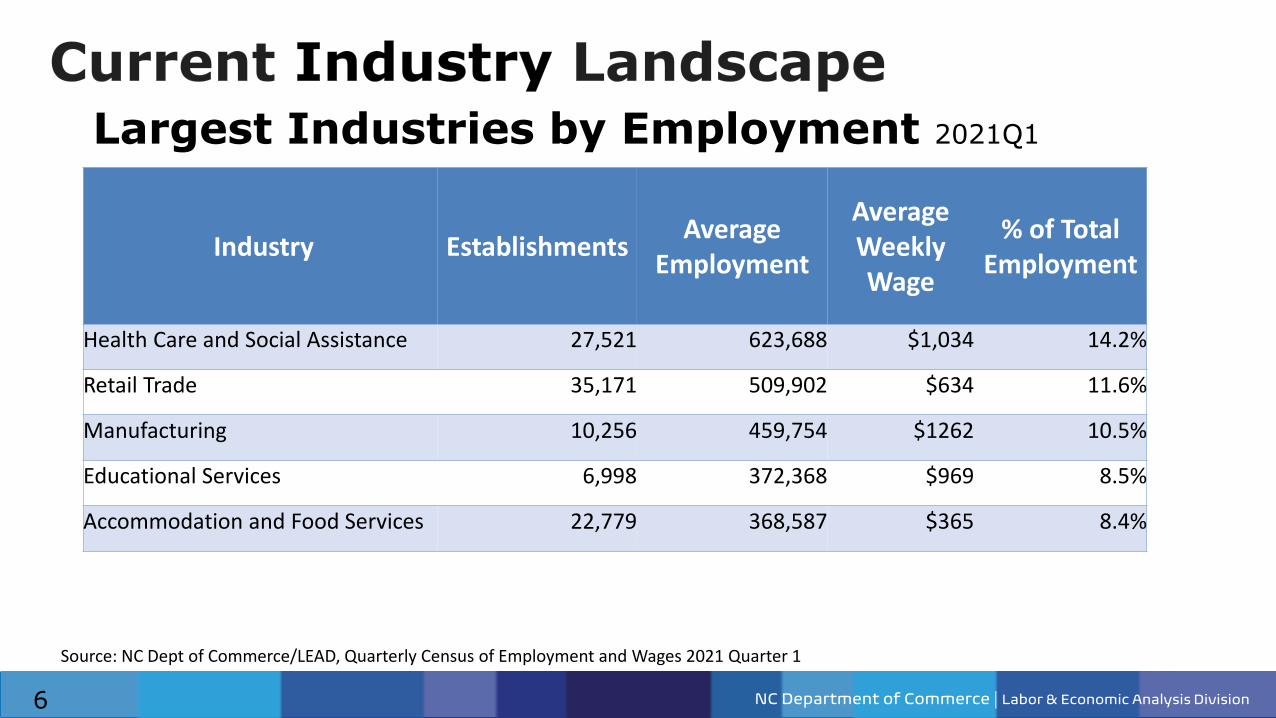
Largest Industries by Employment 2021Q1
Source: NC Dept of Commerce/LEAD, Quarterly Census of Employment and Wages 2021 Quarter 1
6
Industry EstablishmentsAverage
Employment
Average Weekly Wage
% of Total Employment
Health Care and Social Assistance 27,521 623,688 $1,034 14.2%
Retail Trade 35,171 509,902 $634 11.6%
Manufacturing 10,256 459,754 $1262 10.5%
Educational Services 6,998 372,368 $969 8.5%
Accommodation and Food Services 22,779 368,587 $365 8.4%
NC Department of Commerce | Labor & Economic Analysis Division
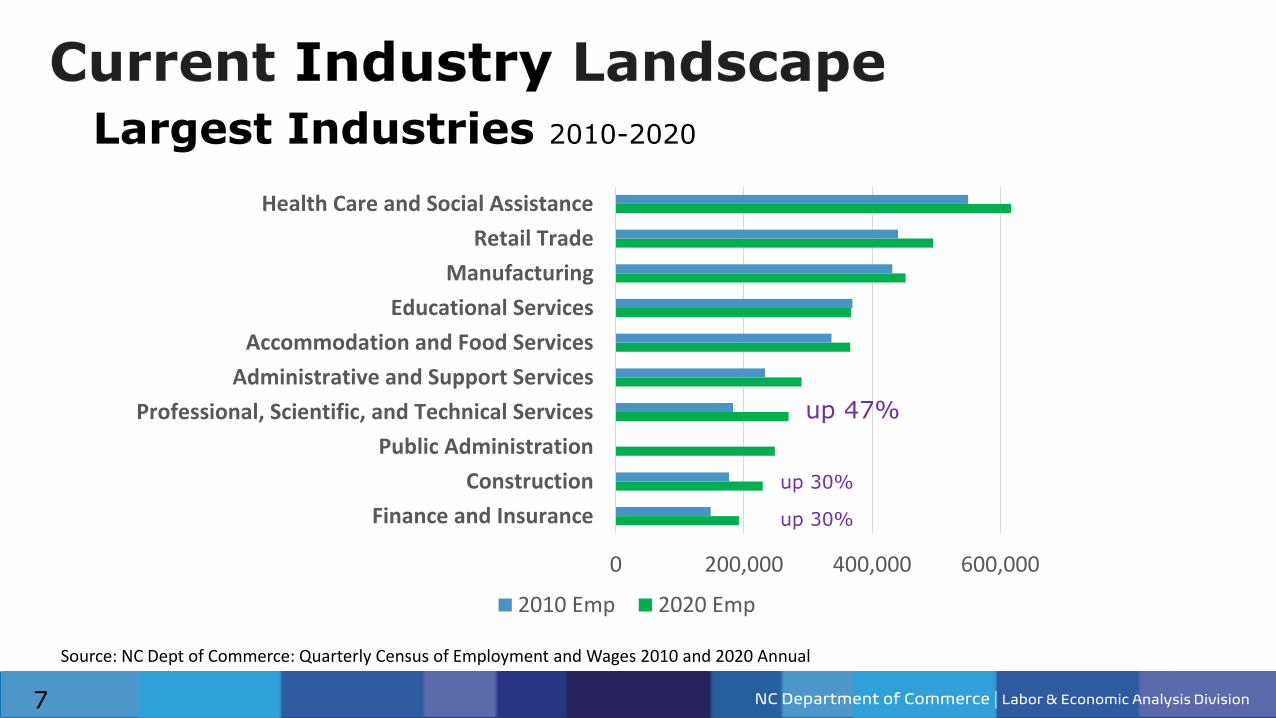
Source: NC Dept of Commerce: Quarterly Census of Employment and Wages 2010 and 2020 Annual
7
0 200,000 400,000 600,000
Finance and Insurance
Construction
Public Administration
Professional, Scientific, and Technical Services
Administrative and Support Services
Accommodation and Food Services
Educational Services
Manufacturing
Retail Trade
Health Care and Social Assistance
2010 Emp 2020 Emp
Largest Industries 2010-2020
up 47%
up 30%
up 30%
NC Department of Commerce | Labor & Economic Analysis Division
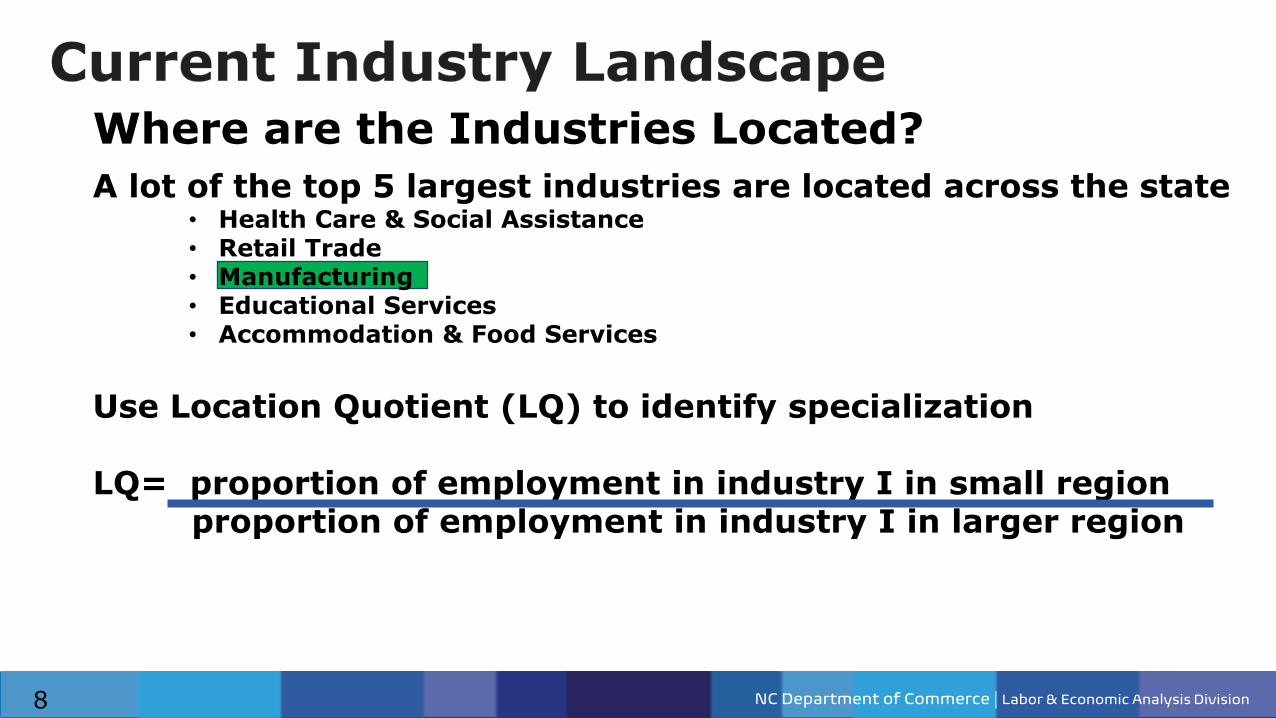
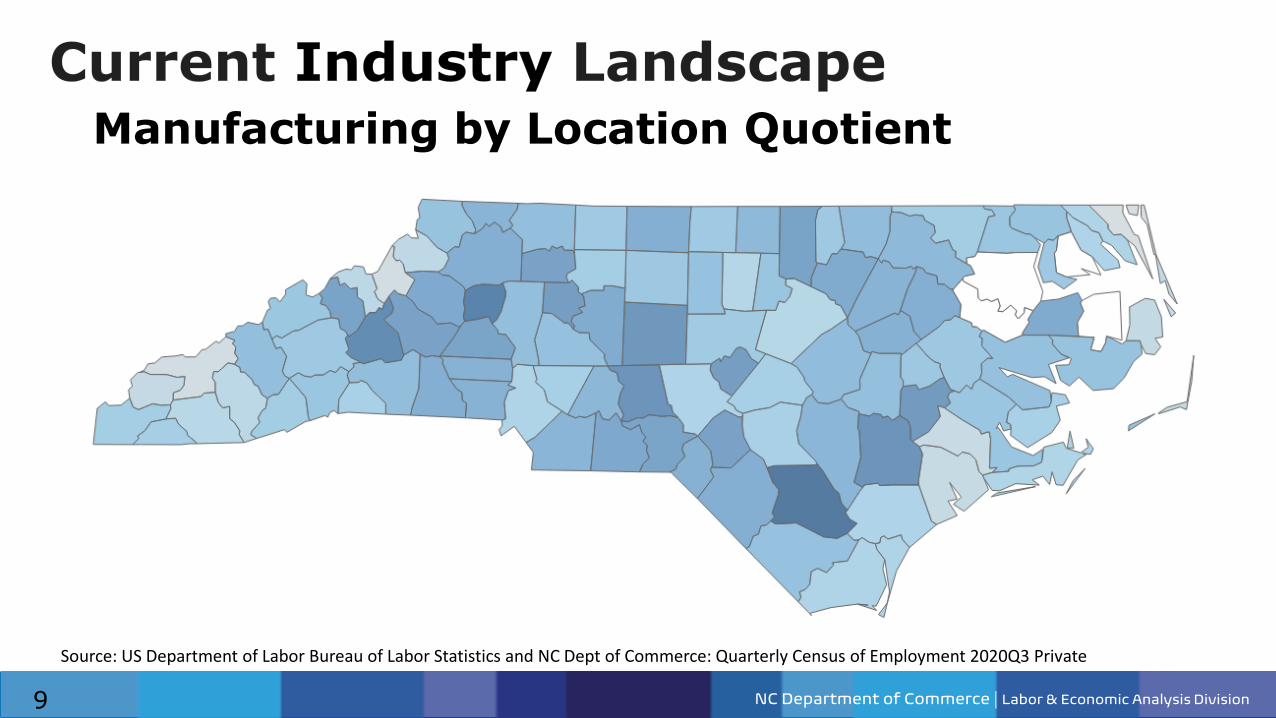
A lot of the top 5 largest industries are located across the state• Health Care & Social Assistance• Retail Trade• Manufacturing• Educational Services• Accommodation & Food Services
Use Location Quotient (LQ) to identify specialization
LQ= proportion of employment in industry I in small regionproportion of employment in industry I in larger region
Where are the Industries Located?
8
NC Department of Commerce | Labor & Economic Analysis Division
Source: US Department of Labor Bureau of Labor Statistics and NC Dept of Commerce: Quarterly Census of Employment 2020Q3 Private
9
Manufacturing by Location Quotient
NC Department of Commerce | Labor & Economic Analysis Division
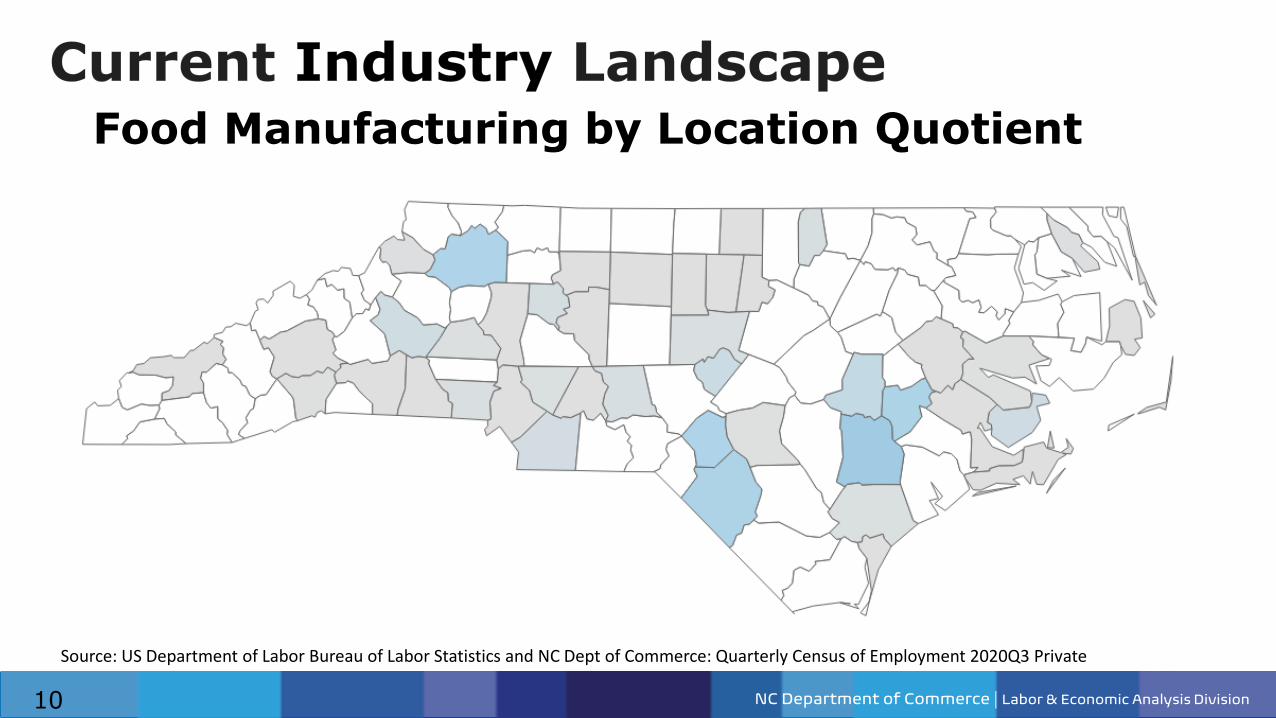
Source: US Department of Labor Bureau of Labor Statistics and NC Dept of Commerce: Quarterly Census of Employment 2020Q3 Private
10
Food Manufacturing by Location Quotient
NC Department of Commerce | Labor & Economic Analysis Division
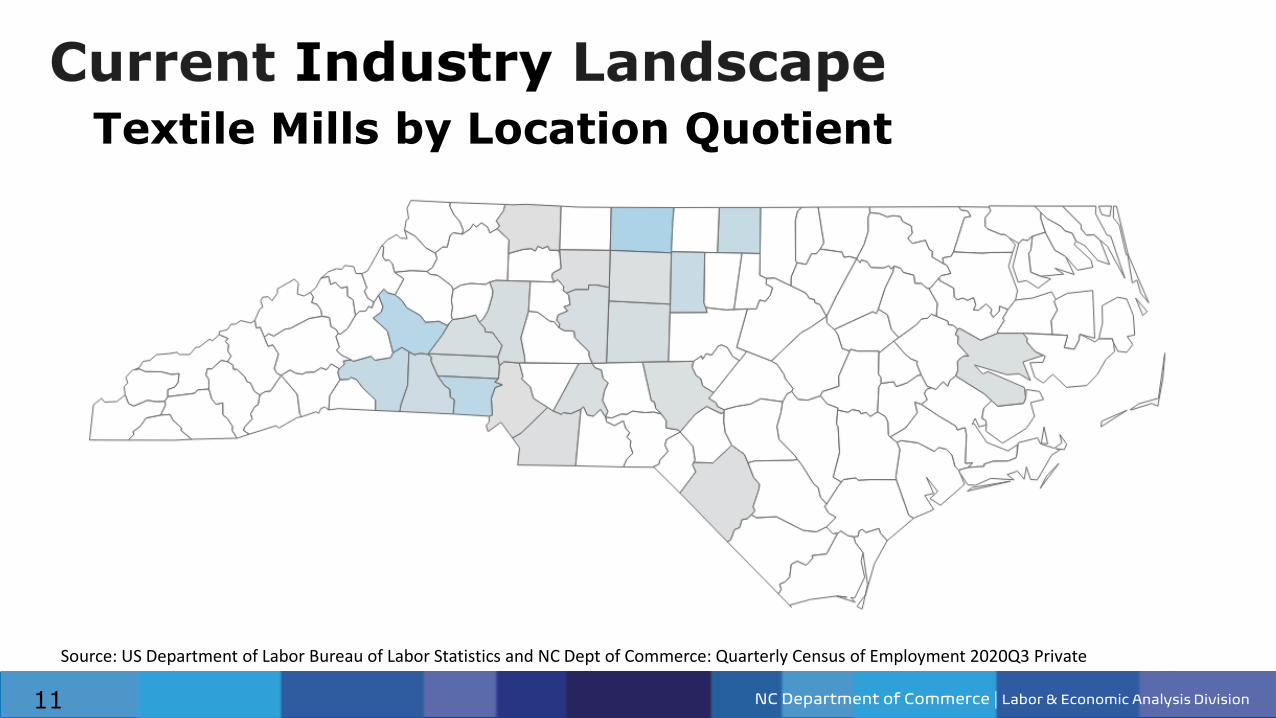
Source: US Department of Labor Bureau of Labor Statistics and NC Dept of Commerce: Quarterly Census of Employment 2020Q3 Private
11
Textile Mills by Location Quotient
NC Department of Commerce | Labor & Economic Analysis Division
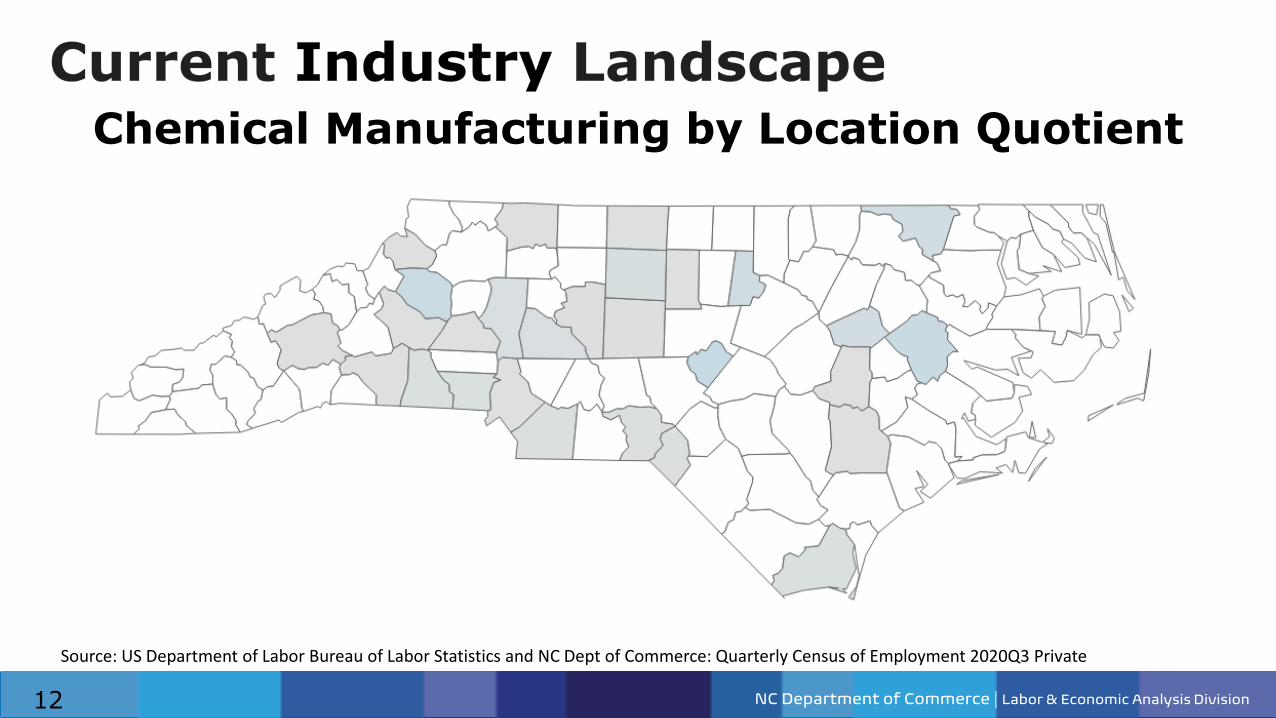
Source: US Department of Labor Bureau of Labor Statistics and NC Dept of Commerce: Quarterly Census of Employment 2020Q3 Private
12
Chemical Manufacturing by Location Quotient
NC Department of Commerce | Labor & Economic Analysis Division
Source: US Department of Labor Bureau of Labor Statistics and NC Dept of Commerce: Quarterly Census of Employment 2020Q3 Private
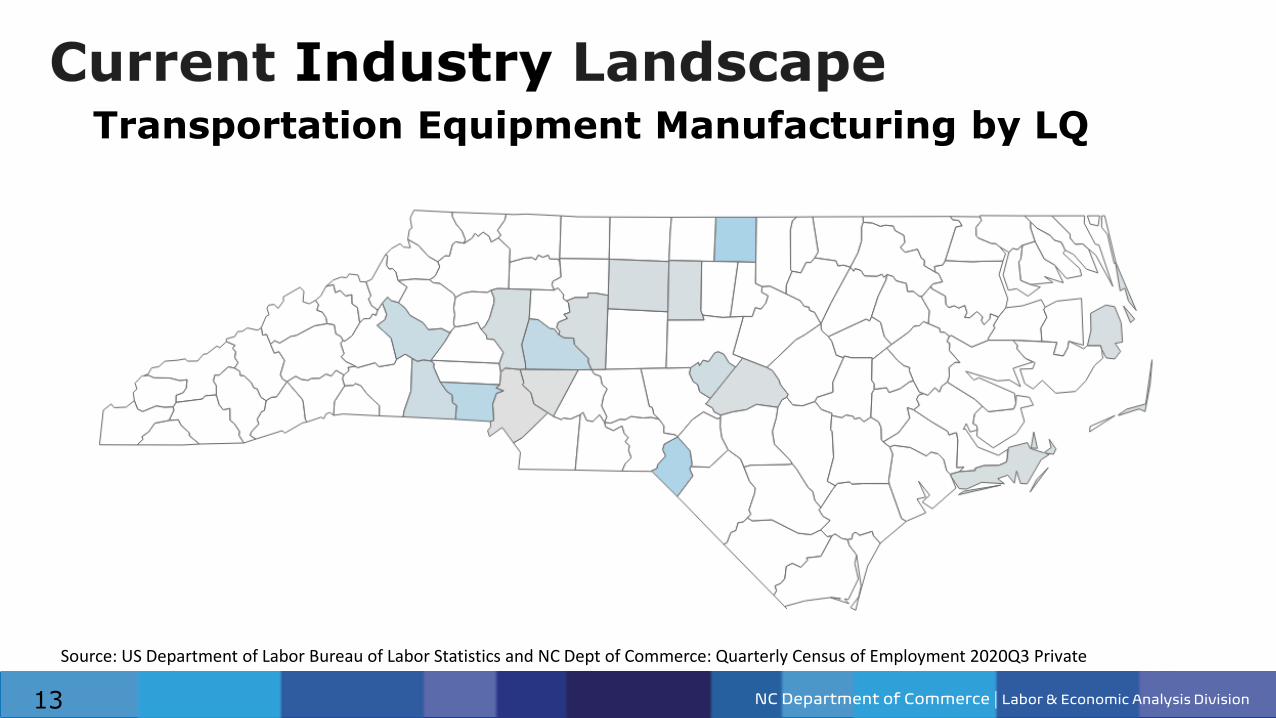
13
Transportation Equipment Manufacturing by LQ
NC Department of Commerce | Labor & Economic Analysis Division
Source: US Department of Labor Bureau of Labor Statistics and NC Dept of Commerce: Quarterly Census of Employment 2020Q3 Private
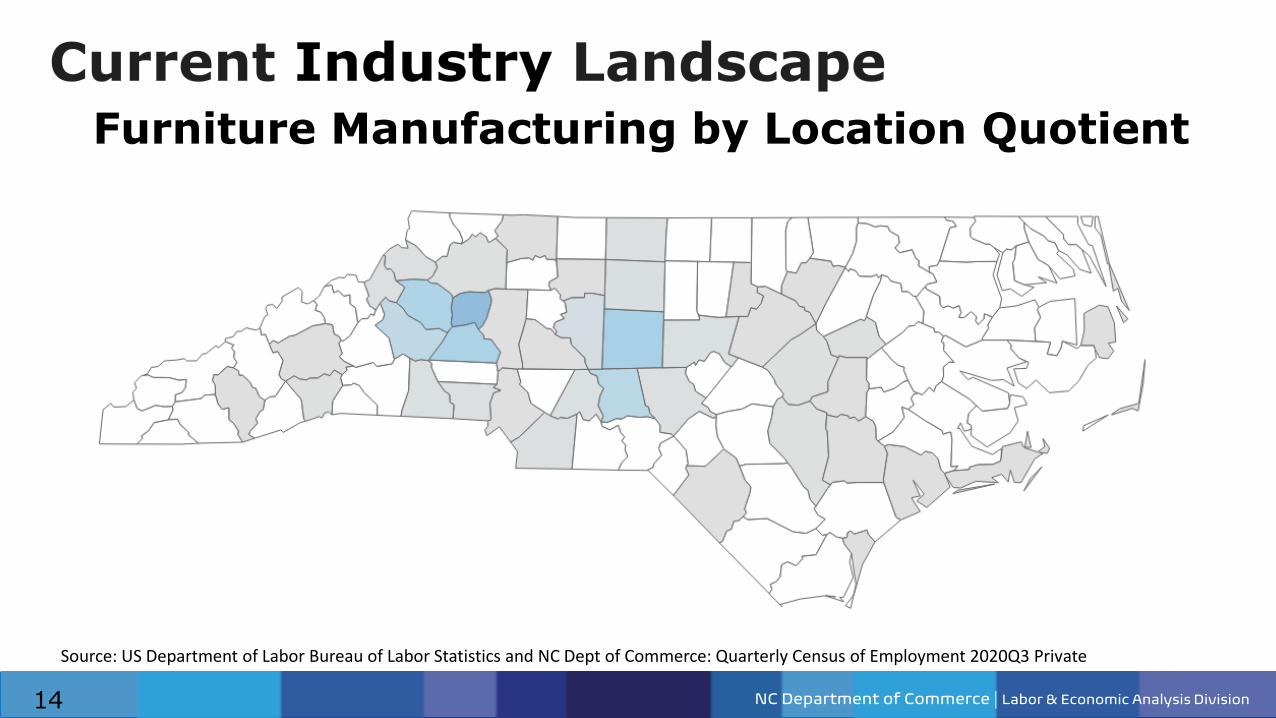
14
Furniture Manufacturing by Location Quotient
NC Department of Commerce | Labor & Economic Analysis Division
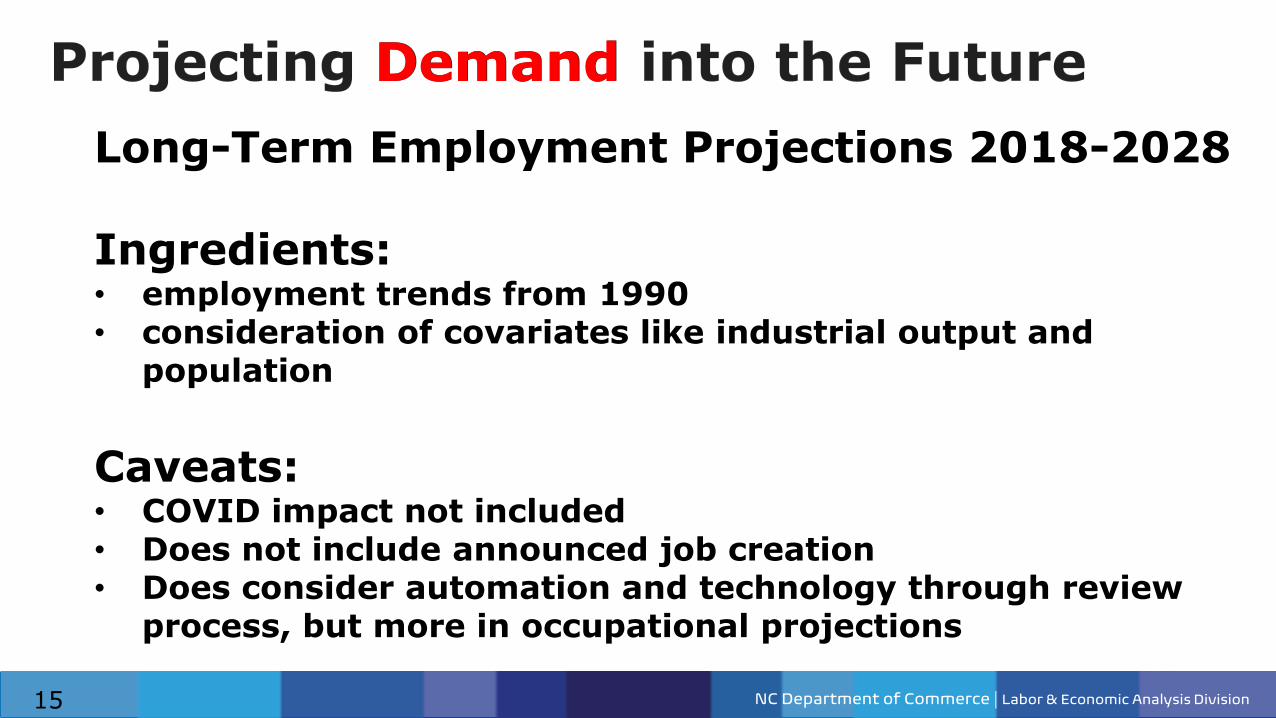
Long-Term Employment Projections 2018-2028
Ingredients: • employment trends from 1990• consideration of covariates like industrial output and
population
Caveats:• COVID impact not included• Does not include announced job creation• Does consider automation and technology through review
process, but more in occupational projections
15
Demand
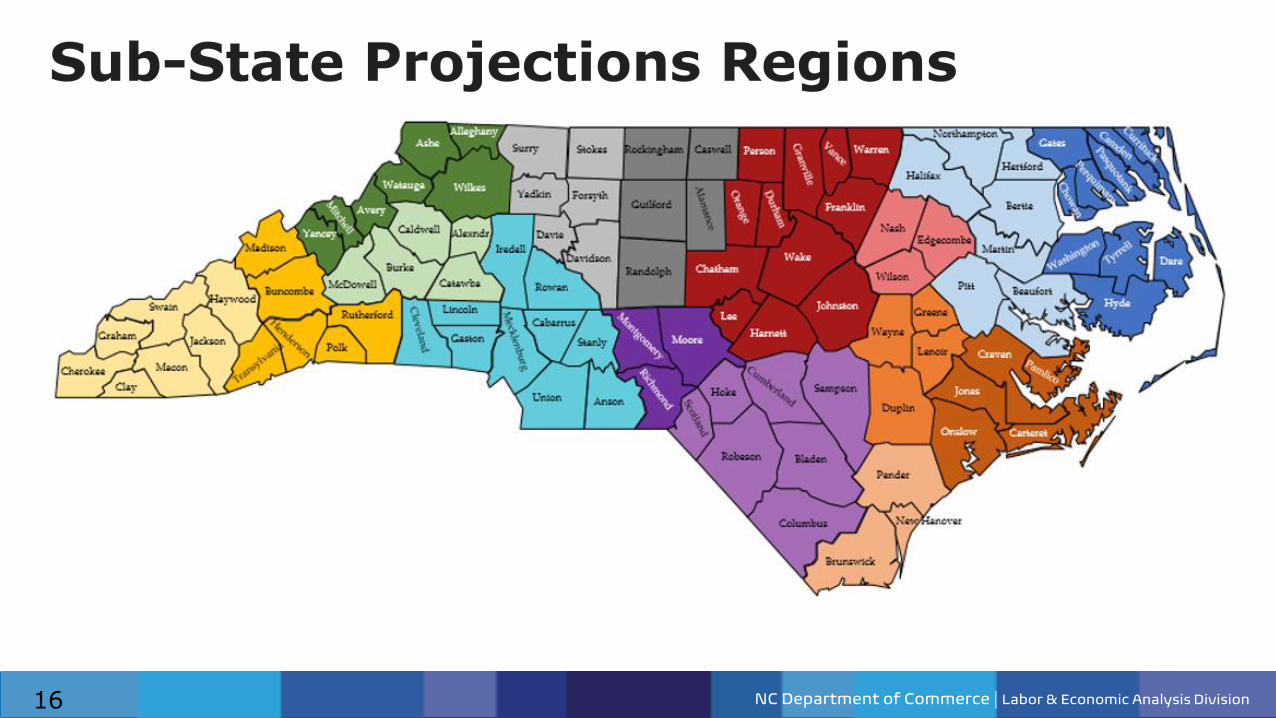
NC Department of Commerce | Labor & Economic Analysis Division16
NC Department of Commerce | Labor & Economic Analysis Division17
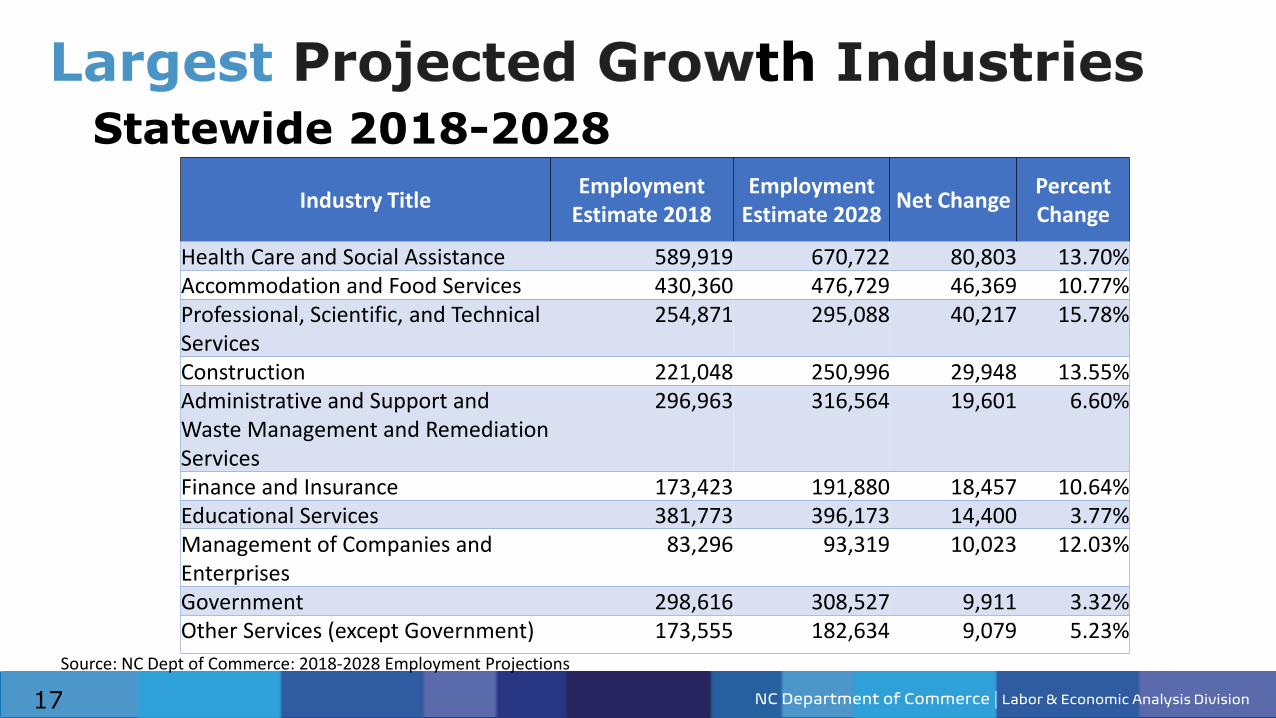
Statewide 2018-2028
Source: NC Dept of Commerce: 2018-2028 Employment Projections
Industry TitleEmployment
Estimate 2018Employment
Estimate 2028Net Change
Percent Change
Health Care and Social Assistance 589,919 670,722 80,803 13.70%Accommodation and Food Services 430,360 476,729 46,369 10.77%Professional, Scientific, and Technical Services
254,871 295,088 40,217 15.78%
Construction 221,048 250,996 29,948 13.55%Administrative and Support and Waste Management and Remediation Services
296,963 316,564 19,601 6.60%
Finance and Insurance 173,423 191,880 18,457 10.64%Educational Services 381,773 396,173 14,400 3.77%Management of Companies and Enterprises
83,296 93,319 10,023 12.03%
Government 298,616 308,527 9,911 3.32%Other Services (except Government) 173,555 182,634 9,079 5.23%
NC Department of Commerce | Labor & Economic Analysis Division18
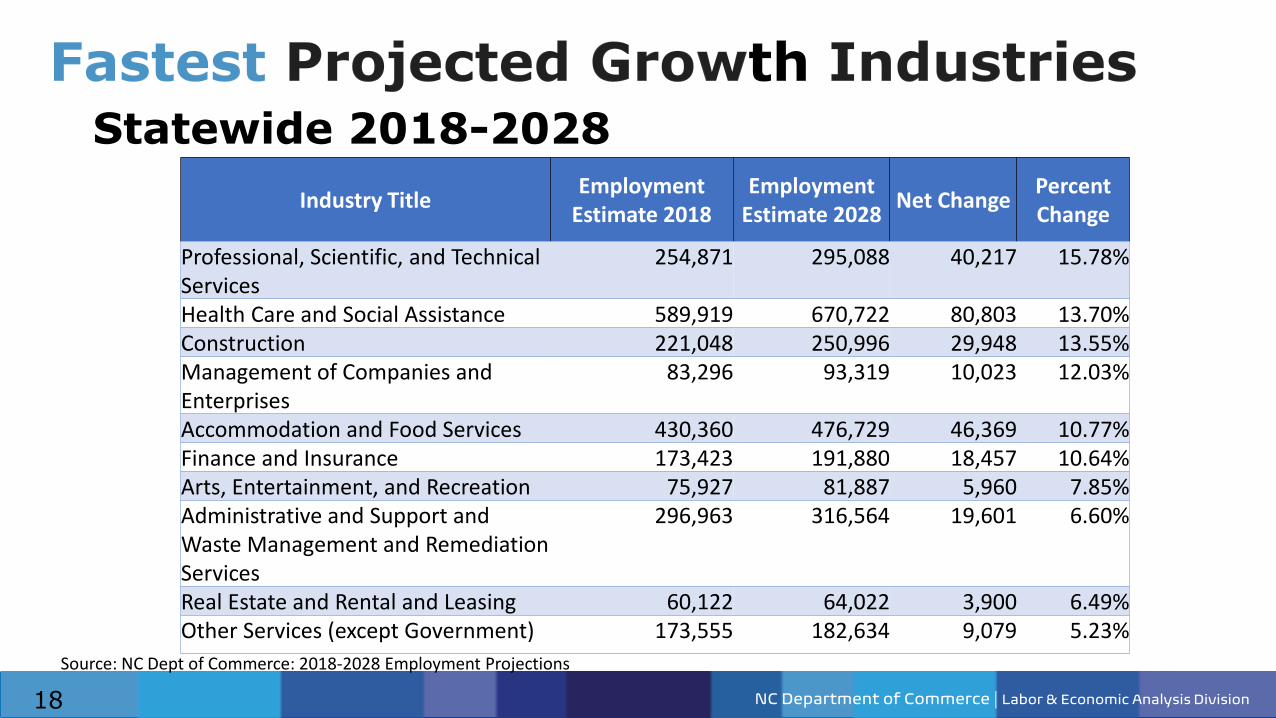
Statewide 2018-2028
Source: NC Dept of Commerce: 2018-2028 Employment Projections
Industry TitleEmployment
Estimate 2018Employment
Estimate 2028Net Change
Percent Change
Professional, Scientific, and Technical Services
254,871 295,088 40,217 15.78%
Health Care and Social Assistance 589,919 670,722 80,803 13.70%Construction 221,048 250,996 29,948 13.55%Management of Companies and Enterprises
83,296 93,319 10,023 12.03%
Accommodation and Food Services 430,360 476,729 46,369 10.77%Finance and Insurance 173,423 191,880 18,457 10.64%Arts, Entertainment, and Recreation 75,927 81,887 5,960 7.85%Administrative and Support and Waste Management and Remediation Services
296,963 316,564 19,601 6.60%
Real Estate and Rental and Leasing 60,122 64,022 3,900 6.49%Other Services (except Government) 173,555 182,634 9,079 5.23%
NC Department of Commerce | Labor & Economic Analysis Division
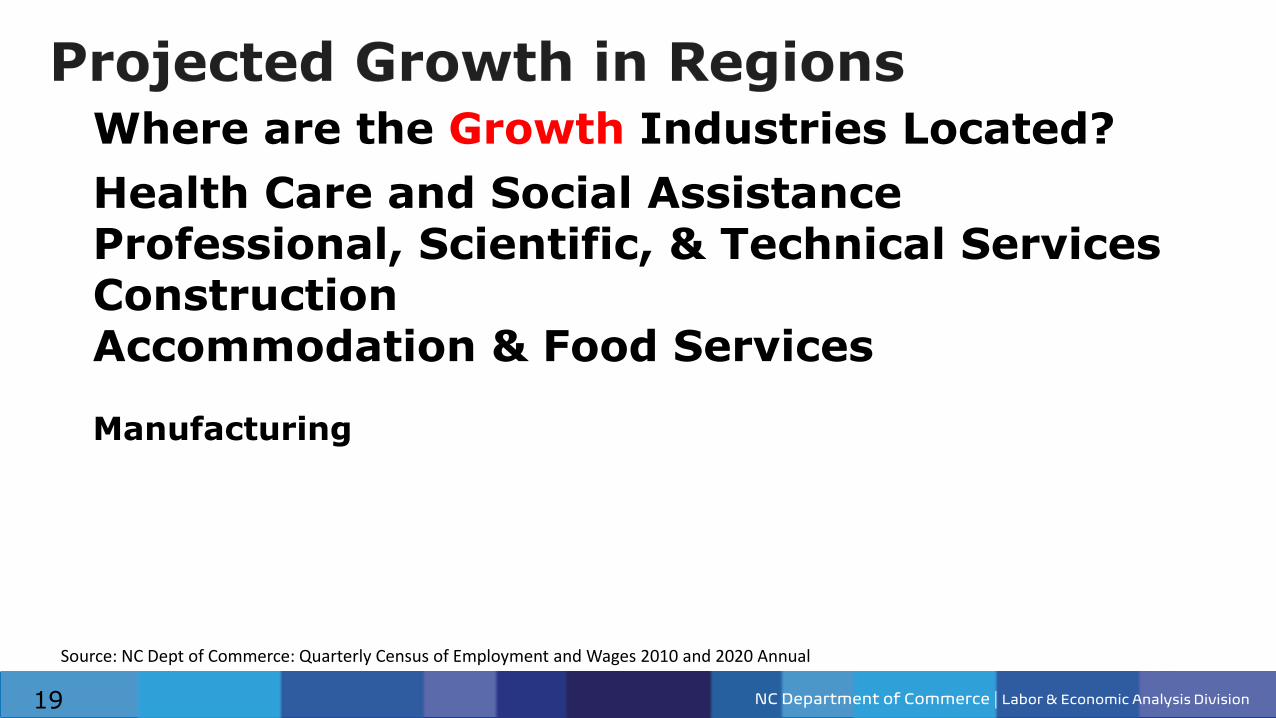
Source: NC Dept of Commerce: Quarterly Census of Employment and Wages 2010 and 2020 Annual
19
Where are the Growth Industries Located?
Health Care and Social AssistanceProfessional, Scientific, & Technical ServicesConstructionAccommodation & Food Services
Manufacturing
NC Department of Commerce | Labor & Economic Analysis Division
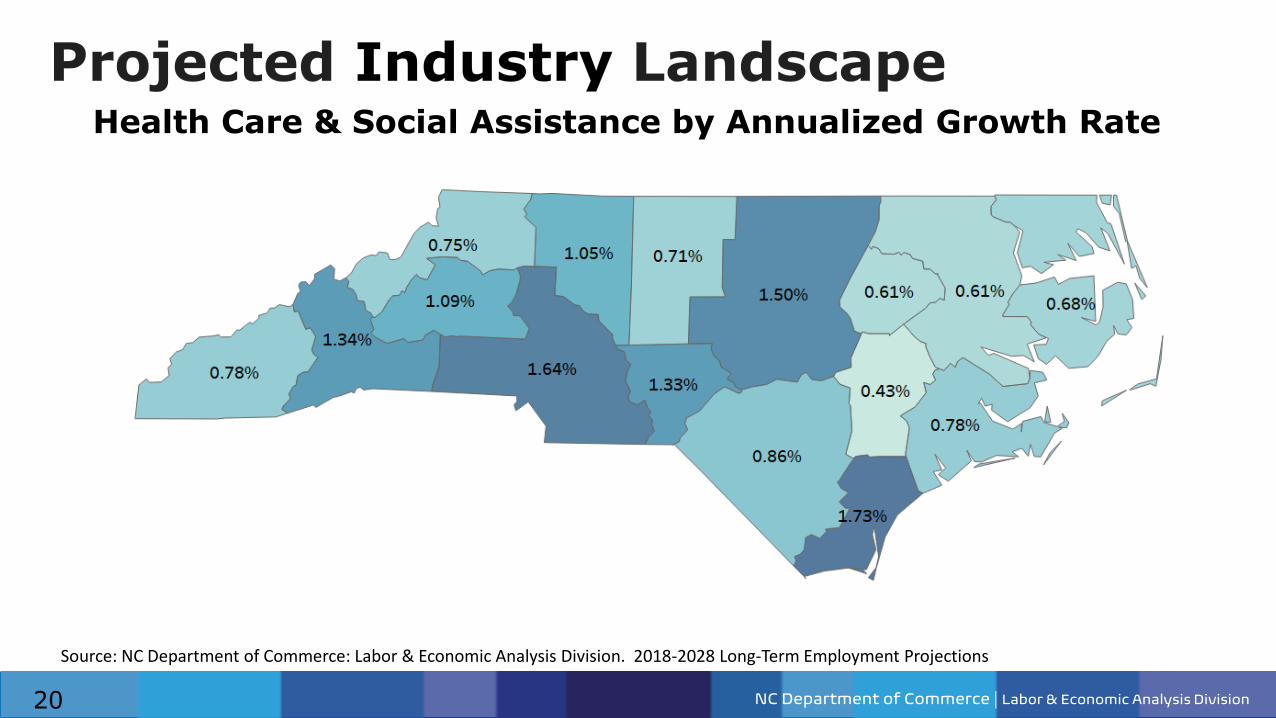
Source: NC Department of Commerce: Labor & Economic Analysis Division. 2018-2028 Long-Term Employment Projections
20
Health Care & Social Assistance by Annualized Growth Rate
NC Department of Commerce | Labor & Economic Analysis Division
Source: NC Department of Commerce: Labor & Economic Analysis Division. 2018-2028 Long-Term Employment Projections
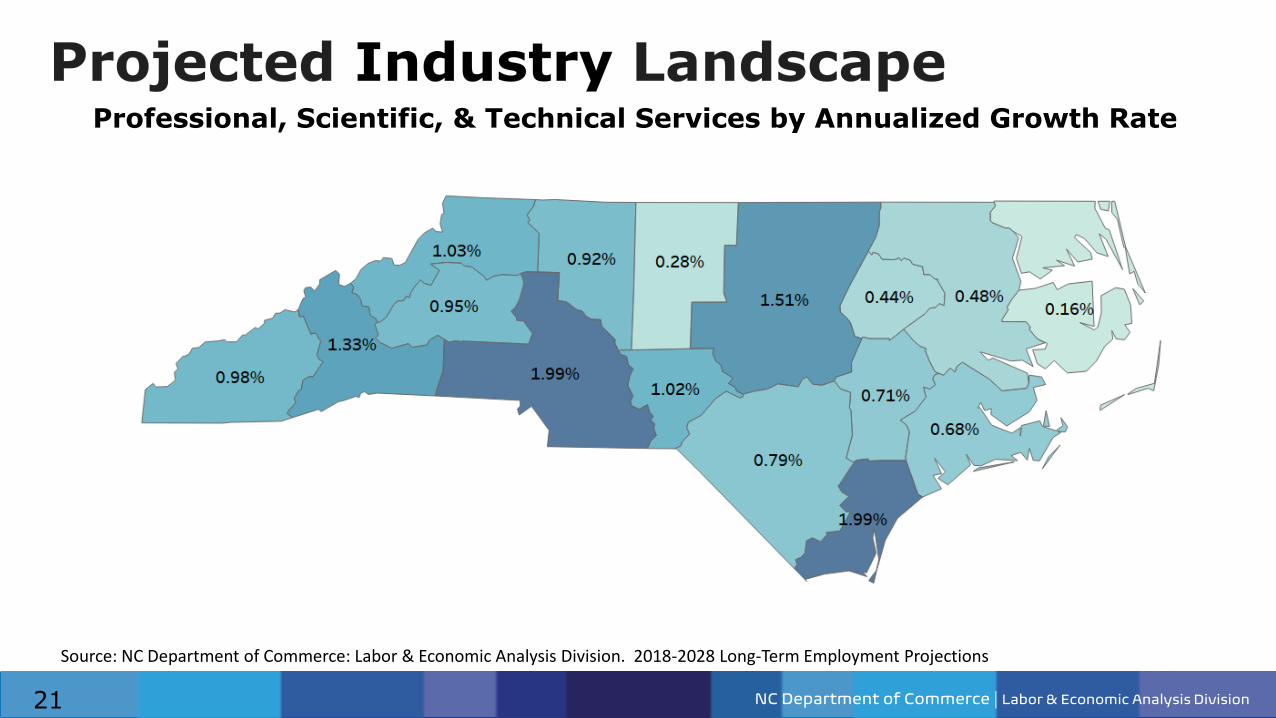
21
Professional, Scientific, & Technical Services by Annualized Growth Rate
NC Department of Commerce | Labor & Economic Analysis Division
Source: NC Department of Commerce: Labor & Economic Analysis Division. 2018-2028 Long-Term Employment Projections
22
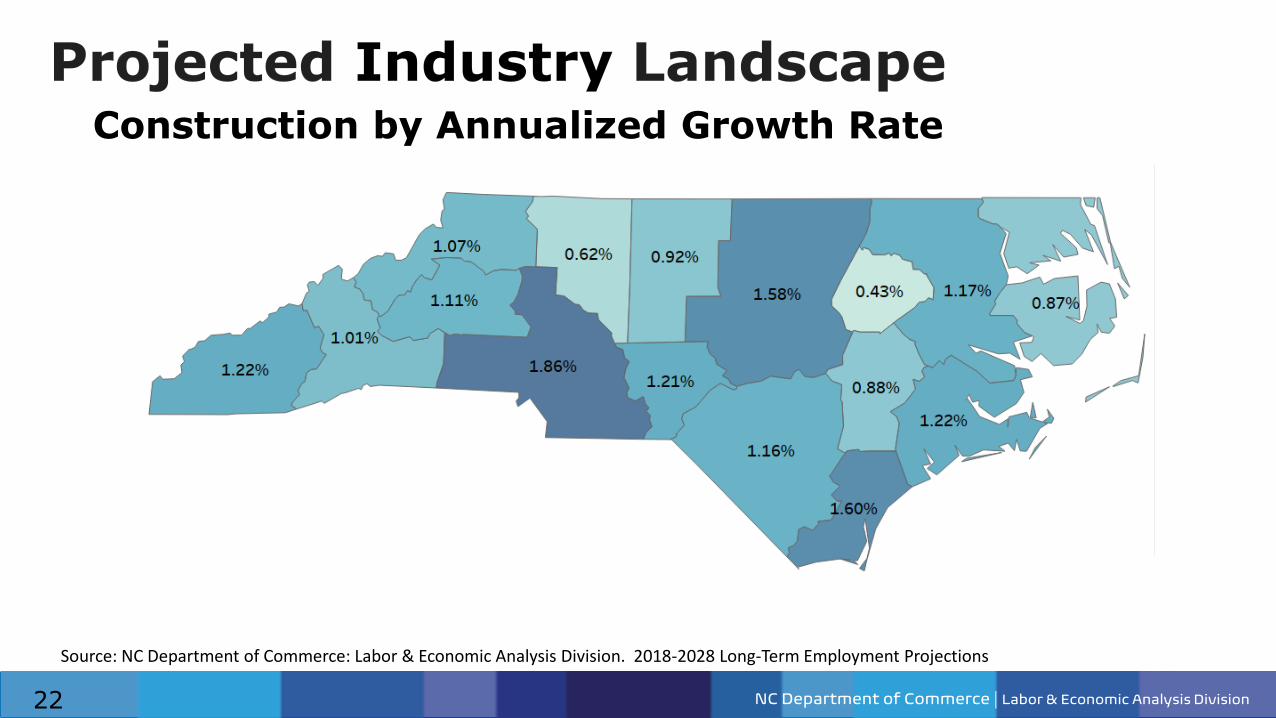
Construction by Annualized Growth Rate
NC Department of Commerce | Labor & Economic Analysis Division
Source: NC Department of Commerce: Labor & Economic Analysis Division. 2018-2028 Long-Term Employment Projections
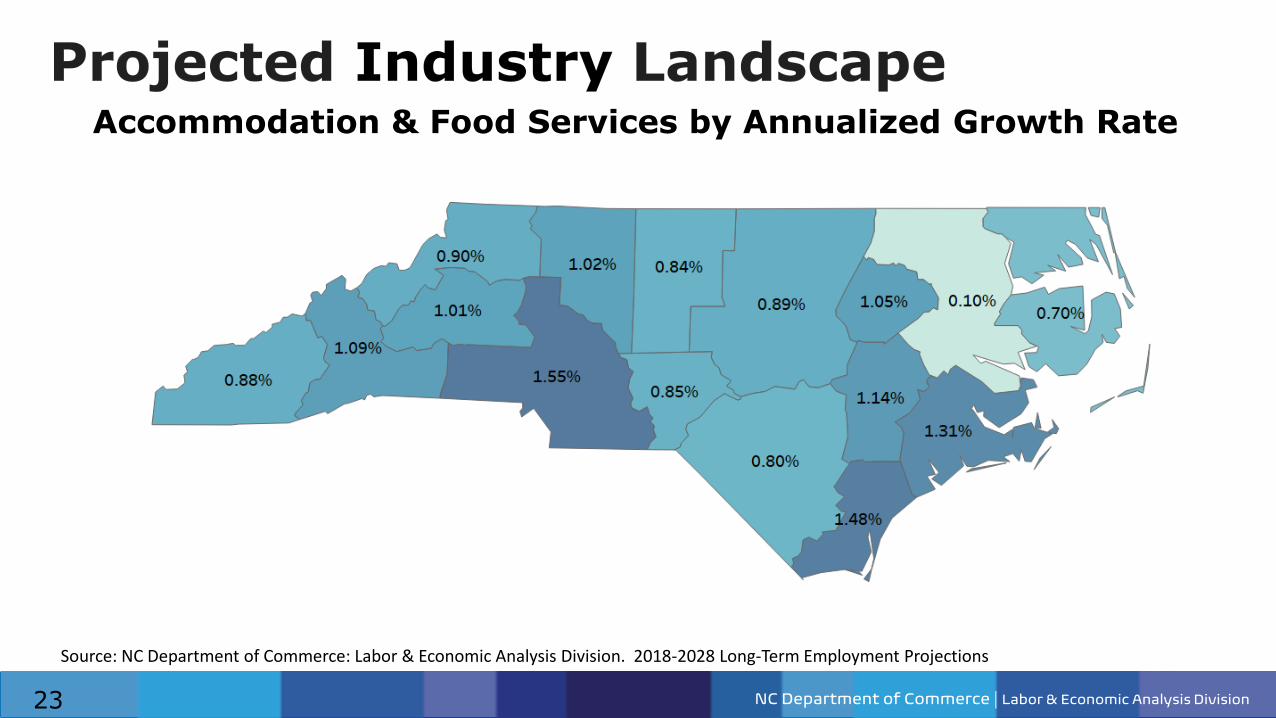
23
Accommodation & Food Services by Annualized Growth Rate
NC Department of Commerce | Labor & Economic Analysis Division
Source: NC Department of Commerce: Labor & Economic Analysis Division. 2018-2028 Long-Term Employment Projections
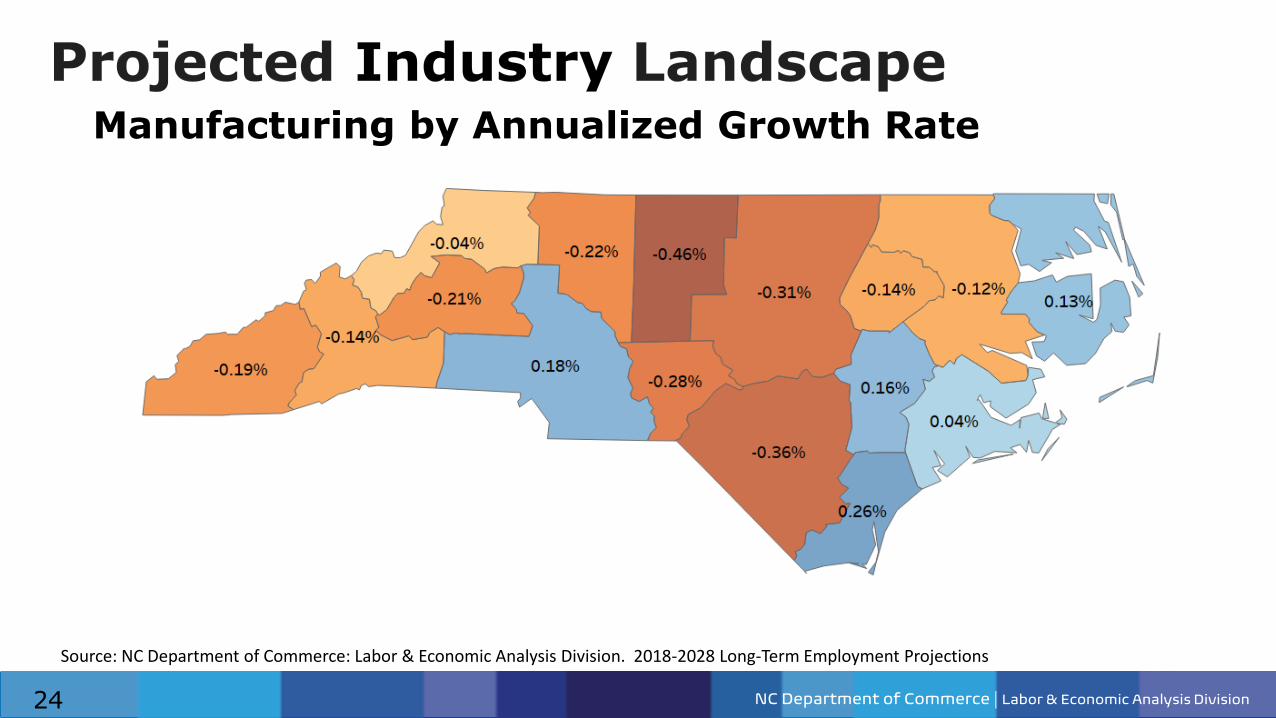
24
Manufacturing by Annualized Growth Rate
NC Department of Commerce | Labor & Economic Analysis Division25
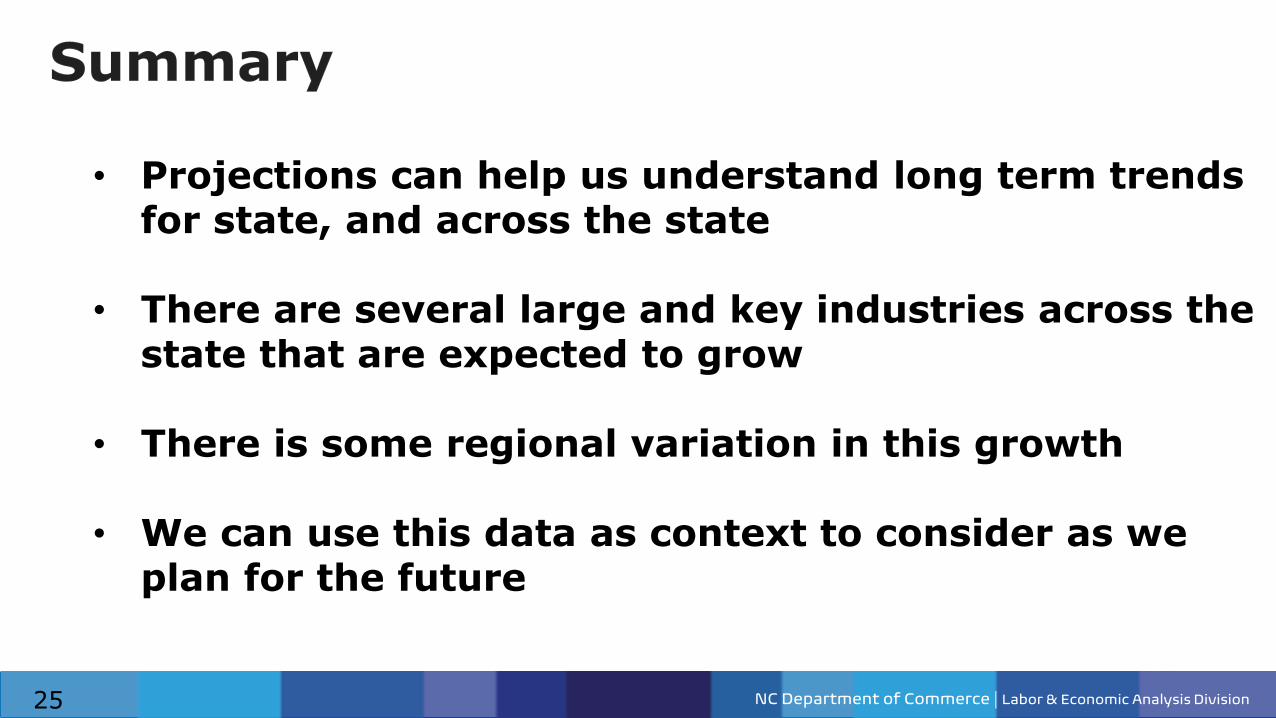
• Projections can help us understand long term trends for state, and across the state
• There are several large and key industries across the state that are expected to grow
• There is some regional variation in this growth
• We can use this data as context to consider as we plan for the future

NC Department of Commerce | Labor & Economic Analysis Division26
Questions?
NC Department of Commerce | Labor & Economic Analysis Division27
Session 10: Cross County Commuting Patterns
This session will very briefly touch upon some research we’ve presented recently on commuting patterns in our state, and more importantly, briefly show you the Census Bureau’s OnTheMap application so you can start looking at your own patterns.
Topic for September 21

NC Department of Commerce | Labor & Economic Analysis Division28
Do you have a topic you’d like to see us try to cover?
Would you like to talk about your experience?
Email me at: [email protected] !!!
NC Department of Commerce | Labor & Economic Analysis Division29
Thank You!
Follow us on Twitter…
@LeadNC @CareersInNC