lobbying at the water’s edge: corporations and
TRANSCRIPT

LABORATORY ON INTERNATIONAL
LAW AND REGULATION
ILAR Working Paper
#22
July 2015
Lobbying at the Water’s Edge: Corporations and Congressional Foreign Policy Lobbying
EMILIE M. HAFNER-BURTON, THAD KOUSSER AND DAVID G. VICTOR

About the Laboratory on International Law and Regulation (ILAR)
The Laboratory on International Law and Regulation (ILAR) is an international, interdisciplinary laboratory that explores when and why international laws actually work. Among scholars, this question has triggered a lively debate that ILAR is engaging with better theories and evidence. ILAR research examines a wide array of issues from environment and energy to human rights, trade and security issues. The ILAR team looks at these issues from the international perspective and also through comparisons across countries.
The Laboratory is part of School of Global Policy and Strategy at University of California, San Diego. ILAR gratefully acknowledges anchor funding from the nonpartisan Electric Power Research Institute, BP, plc, the Norwegian Research Foundation and from UC San Diego’s School of International Relations and Pacific Studies.
Laboratory on International Law and Regulation School of Global Policy and Strategy University of California, San Diego
9500 Gilman Drive La Jolla, CA 92093-0519
http://ilar.ucsd.edu
About the Authors
Emilie M. Hafner-Burton is professor at the School of Global Policy and Strategy and director of the School's International Law and Regulation Laboratory. Most recently, Hafner-Burton served as professor of politics and public policy at Princeton University, where she held joint appointments in the Department of Politics and the Woodrow Wilson School for International and Public Affairs. She also served as research scholar at Stanford Law School and fellow of Stanford's Center for International Security and Cooperation (CISAC). Previously, she was postdoctoral prize research fellow at Nuffield College at Oxford University, recipient of MacArthur fellowships at Stanford's CISAC and affiliate at the Center for Democracy, Development and the Rule of Law at Stanford University. Hafner-Burton's research at Oxford, Stanford and Princeton examined ways to improve protections for human rights, the design of international and regional trad policy, and a wide array of other topics related to the use of economic sanctions, social network analysis and international law.
Thad Kousser is a professor at the University of California San Diego. He has authored, co- authored, or edited the books The Power of American Governors (Cambridge University Press, 2012), The Logic of American Politics, 7th Edition (CQ Press, forthcoming), Politics in the American States, 10th Edition (CQ Press, 2012), The New Political Geography of California (Berkeley Public Policy Press, 2008), Term Limits and the Dismantling of State Legislative Professionalism (Cambridge University Press, 2005), and Adapting to Term Limits: Recent Experiences and New Directions (Public Policy Institute of California, 2004). His work has also been published in journals such as the American Political Science Review, the Revue Francaise de Science Politique, the Journal of Politics, Political Analysis, Legislative Studies Quarterly, and State Politics and Policy Quarterly. He is a recipient of the UCSD Academic Senate's Distinguished Teaching Award, the Faculty Mentor of the Year Award, served as co- editor of the journal State Politics and Policy Quarterly, and has worked as a staff assistant in the California, New Mexico, and United States Senates.
David G. Victor is a professor at the School of Global Policy and Strategy and director of the School's International Law and Regulation Laboratory. Most recently, Victor served as director of the Program on Energy and Sustainable Development at the Freeman Spogli Institute for International Studies at Stanford University, where he was also a professor at Stanford Law School. Previously, he directed the science and technology program at the Council on Foreign Relations (CFR) in New York, where he directed the Council's task force on energy and was senior adviser to the task force on climate change. Victor's research at Stanford and the Council examined ways to improve management of the nation's $50 billion strategic oil reserve, strategies for managing investment in "geoengineering," and a wide array of other topics related to technological innovation and the impact of innovation on economic growth. His research also examined global forest policy, global warming, and genetic engineering of food crops.

Lobbying at the Water’s Edge: The Corporate Foreign Policy Lobby
Abstract:
by Emilie M. Hafner-Burton, Thad Kousser,
and David G. Victor1
July 13, 2015
Each year, groups ranging from multinationals to non-profits spend hundreds of millions of dollars lobbying America’s federal government on foreign policy. This massive flow of private dollars raises concerns about the health of political pluralism in the realm of America’s international relations. Using an original dataset that combines tens of thousands of Lobbying Disclosure Act filings from 2007 to 2011, information on the content of proposed legislation, and financial data on all publically listed firms in the U.S., we argue that corporate interests dominate the foreign policy lobby; that there are inequalities among firms in lobbying investment that parallel market advantages; and that the firms that lobby are not representative of the median voter. Rather than providing counteractive lobbying that represents the broad range of American opinion, the multitude of voices that lobby major foreign policy bills affecting America’s stance in the world are likely compounding the bias towards large corporations that on average advocate center-right positions.
REVIEW DRAFT. PLEASE DO NOT QUOTE
1 Emilie Hafner-Burton is Professor, School of Global Policy and Strategy and Department of Political Science, UC San Diego ([email protected]). Thad Kousser is Professor, Department of Political Science, UC San Diego ([email protected]). David Victor is Professor, School of Global Policy and Strategy, UC San Diego ([email protected]).
A previous version was presented at the 2014 Meetings of the American Political Science Association, Washington D.C., August 27th-September 1st and the 2014 Meetings of the Midwest Political Science Association, Chicago, Illinois, April 3-6th.The authors are grateful to Linda Wong, Heidi Hall, Albert Ho, and David Searle for their research assistance, to Adam Bonica and Alex Bronstein-Moffy for sharing data, and to Dorie Apollonio, Lawrence Broz, Ben Fordham, Peter Gourevitch, Gordon Hanson, Seth Hill, William Howell, David Lake, Eleanor Powell and Dana Wippo for helpful comments.

The Constitution delegates broad powers to Congress to shape American foreign policy, and Congressional actions thus have considerable influence on U.S. relations globally (McCormick 2012). Each year, groups ranging from multinationals to local governments and non-profits spend hundreds of millions of dollars seeking to influence America’s decisions on foreign policy. Firms, perhaps more than any other interest group, are thought to exert special influence in this domain (Fordham 2008a, 2008b; Fordham and Kleinberg 2012; Keohane and Milner 1996; Milner 1997; Mosley 2011; Rogowski 1989; Broz 2005; Jacobs and Page 2005). Indeed, the incentive for firms at home to influence the policies of the U.S. abroad has risen with globalization, which has made firms much more sensitive to a wide range of foreign policy issues—from trade and tax policy coordination to accounting standards, investment support and regulatory harmonization (Büthe and Mattli 2011; Büthe and Milner 2014). Many US-based firms have long obtained the majority of their profits overseas and view America’s foreign policy as an extension of their global commercial strategy (Garten 1997). It is thus surprising that very little is actually known about the corporate foreign policy lobby. Who is lobbying—and over which issues—to shape America’s international affairs?
Understandably, the long tradition of scholarship centrally focused on firms’ incentives to influence American foreign policy has concentrated mainly in the realm of international trade (Milner 1988a, 1988b), although some research has investigated the forces that might influence congressional voting on international financial policies such as funding for the International Monetary Fund (Broz 2008). Economic legislation, however, accounts for less than half of what companies spend. Understandably, as well, scholars have studied corporate influence on politics by focusing on places where data are available—which, until recently, meant political action committee (PAC) contributions (Bombardini 2008; Broz and Brewster Hawes 2006; Fleisher 1993; Grier and Munger 1993; Milyo, Primo, and Groseclose 2000).2 New disclosure laws now make it possible to study lobbying expenditures on foreign policy issues directly. This type of political money far exceeds PAC contributions (Apollonio 2005) and allows firms much greater ability to target their spending to specific legislative activities of interest.
There are good reasons to examine how the corporate lobby tries to influence America’s foreign affairs. The massive flow of private dollars, and perhaps private influence, into the foreign policy making arena raises questions about whether the actions of organized interest groups unduly influence America’s relations with the rest of the world. The hope, drawn from American pluralist thought, is that a diversity of interest groups will exert robust influence that on balance favors the public good (Dahl 1956, 1961; Lindblom 1977; Truman 1951). A system marked by active lobbying can be beneficial, a “political system in which all the active and legitimate groups in the population can make themselves heard at some critical stage in the process of decision” (Dahl 1956, 137). Yet pluralism requires both broad participation and a diversity interests. And the fear is that lobbying might exacerbate societal inequalities if some interests are better organized and more active in a policy realm than others.3 If all of the most engaged actors on foreign policy speak for a narrow sector of society, then our system “is skewed, loaded and unbalanced in favor of a fraction of a minority” (Schattschneider 1960, 36), elevating that fraction rather than restraining it. This fear
2 Some notable exceptions include Hansen and Mitchell (2000) and Ludema, Mayda, and Mishra (2010). See also: (Ansolabehere, de Figueiredo, and Jr. 2003; Bombardini 2008; Brasher and Lowery 2006; Drope and Hansen 2006; Kim 2012). 3 Dahl (1986) and Lindblom (1977) admitted and critics of pluralism such as Schattsneider (1960) and Lowi (1969) insisted on this point.

dovetails with recent research suggesting that the American political system more generally advantages an “unheavenly chorus”—the richest and best-organized interests that actively make their political voices heard at the expense of the less advantaged (Lessig 2011; Schlozman, Verba, and Brady 2012).
Such concerns are particularly important with regard to America’s international relations.. International institutions are typically accessible mainly to governments and not broader interests in society. Citizens have little input into American foreign policy or the workings of most international organizations. And such concerns have long amplified fears about a ‘democratic deficit’ in international affairs (Dahl 1999; Moravcsik 1998). If the foreign policies of the world’s most powerful democratic government is distorted by a few voices then the pernicious effects of that deficit could be even greater—and extend even broader—than feared.
This paper presents an original dataset that makes it possible to address these positive as well as normative concerns about the domestic sources of America’s foreign policy, and thus, their international relations with the rest of the world. It is among the only (to our knowledge) to identify systematically which firms lobby the federal government specifically on international affairs—not simply for trade and finance, but the full gamut of foreign policy issues.4 Our analysis is based on Lobbyist Disclosure Act filings, which cover lobbying directed at both legislative and executive branch officials (Straus 2010). We focus on the filings that target Congressional bills dealing with international relations; thus congressional foreign policy bills are the subject of the lobbying activities, but the object of lobbying can be members of either branch.
Deploying this large new dataset, we argue that there is a clear—and perhaps worrisome— hierarchy to corporate spending on American foreign policy, that there are predictable inequalities among firms in lobbying investment that parallel market advantages, and that the firms that lobby are not representative of the median voter.
First, corporate lobbying is highly skewed within the ranks of industry. It is a small minority of firms in any given industry that lobbies on foreign policy of any kind—of the 8,186 publically traded firms in our sample, only 8% reported lobbying on foreign policy. Those that lobby tend to be large and prosperous and situated in the top ranks of concentrated industries.
Second, the companies that lobby on foreign policy are in no way representative of American society more generally, which is polarized between liberals and conservatives but has a slight leftward tilt. By contrast, the corporate lobby is on average less dispersed than individuals or other lobbying groups but skewed to the right. This skew is greater among the biggest lobbying players. Companies lobbying on U.S. foreign policy do not represent the full range of policy positions in the American public and likely advocate policies—on average—that are more conservative than what the median voter desires.
Third, there is variation in the concentration of corporate lobbying across foreign policy issue areas. On matters of international security, lobbying tends to be dominated by a narrow handful of industries, with firms from few other sectors at the table. On matters of international political economy (IPE), however, lobbying is more widely diffused across nearly all sectors of the economy—just about every industry seeks to influence government by lobbying on IPE. This pattern may reflect a shift in corporate concerns that coincides with the globalization of American business, where companies in all sectors now recognize that a well-functioning global economy is broadly in their interests. The legislation that has the most effect—the enrolled bills that eventually become law—also attract many more voices seeking access compared to foreign policy bills that
4 For research on public support for American global activism and on the determinants of Senate voting on military resource allocation, intervention, and foreign aid, see Fordham (2008a, 2008b).

never advance through the Congressional process, most of which attract scant lobbying attention from only a handful of groups.5 Although it is beyond the scope of this paper to determine whether lobbying is successful, that the loudest voices on America’s international relations are a narrow range of companies is potentially quite troubling.6
In section one, we describe this landscape of lobbying and show that interest groups concerned with America’s relations internationally spend far more on lobbying politicians than on contributing to their campaigns. Approximately one in ten lobbying dollars spent on Capitol Hill are targeted at foreign policy issues and firms account for the majority of these lobbying filings and expenditures. Moreover, less than half of lobbying contributions are spent on the trade and investment-related bills which have been the primary focus of most scholarship. Next, we turn to theory to explain which types of firms lobby and for which foreign policy issues. In section three, we present results of our multivariate models explaining lobbying behavior by firms, both in the foreign policy arena generally and in specific issues within it such as IPE and security. We focus on publically traded firms, which account for 50% of all foreign policy lobbying expenditures because micro level firm data are publically available for these organizations. We provide evidence that the foreign policy bills that actually become U.S. law mobilize a larger number of groups to lobby and that the corporate foreign policy lobby is on average skewed center-right. Finally, we conclude with several possible implications.
I. The Foreign Policy Lobby
Who seeks to influence Congress and the executive branch on foreign policy issues, how do these groups spend their money, and what is the scale of the foreign policy lobby overall? In order to answer these questions, we created an original dataset by combining multiple government sources with information on firms drawn from census reports, academic studies, and a widely used database of firm-level financial information (Compustat). To obtain information on lobbyist filings and campaign contributions, we purchased data from the now-defunct “First Street,” a subscription service operated by CQ Press. First Street brought together information on Lobbyist Disclosure Act (LD-1 and LD-2) filings, Federal Elections Commission campaign contribution reports (linked to lobbying clients through the LD-203 forms), and information on legislation provided by the Library of Congress’ “Thomas” web archive. Working with First Street staff, we identified the 7,051 bills tagged with at least one of the Congressional Research Service’s (CRS) subject codes that fell into First Street’s “International Relations and Trade” grouping. Because the quarterly lobbying filings must identify the bills that an interest group lobbied, we were able to pull the 404,335 filings that targeted at least one foreign policy bill. Each filing identifies a client, and using First Street’s unique client number allowed us to obtain the campaign finance reports filed by these interest groups.
Figure 1 combines data from these linked reports. It shows that from 2007 through 2010, the years in which all of First Street’s datasets are complete, foreign policy lobbying expenditures dwarf campaign contributions every year. This is not news to those who study lobbying in American politics. As Apollonio’s (2005) study of interest group activity shows, lobbying
5 Enrolled bills are those that pass both houses of Congress and are sent to the president for a signature or veto. None of the bills in our sample were vetoed by Presidents George H.W. Bush or Barack Obama. 6 Baumgartner et al. (2009) find that lobbying campaigns are not automatically successful – 60% of the lobbying efforts in their sample failed. Yet when lobbyists were successful, they won significant policy changes.
expenditures greatly exceed campaign contributions for all types of groups except for labor unions.7
The totals shown in this figure exaggerate the actual amounts of money that are spent, either through lobbying or in campaign donations, on foreign policy alone. A bill that touches on at least one foreign policy issue may also affect other policy areas, and be combined on the same lobbying report with other bills that have nothing to do with foreign policy. Similarly, campaign contributions are given to legislators who vote on foreign policy bills along with a host of other issues. Both totals are similarly overstated, making them a fair basis for comparison in Figure 1, but in the analysis of lobbying behavior that follows, it is vital that we estimate more precisely the number of lobbying dollars aimed specifically at foreign policy.
To refine our estimates, we rely on CRS issue codes. Each bill is given multiple codes, including both issue areas such as “International Finance,” “Building Construction,” or “Health Policy,” and proper nouns such as “Virginia” and the “Virgin Islands.” After eliminating the proper noun codes, we counted the total number of CRS codes that fall in the foreign policy realm and divided that into the total number of CRS codes attached to the bill altogether. The full list of these foreign policy codes, as well as the subcategories of foreign policy activity into which they fall, is provided in Appendix 1. This gives us a foreign policy factor for each bill, which we use to determine how much of the money spent lobbying was aimed at foreign policy. For instance, the bill 110 S. 796, the “Fair Currency Act of 2007,” was tagged with 15 overall CRS codes, eight of which were foreign policy codes, giving it a foreign policy factor of 0.53. If an interest group filed a report that it spent $100,000 lobbying on this bill alone, we would categorize $53,000 of this spending as foreign policy lobbying. If that filing instead reported lobbying on two bills, 110 S. 796 and another bill completely unrelated to foreign policy, we would categorize $26,500 of the group’s spending as aimed at foreign policy.
We categorized any bill with a factor below 0.10 as “unrelated to foreign policy,” a level we determined by sampling 100 bills at random and reading each bill—assigning a four point scale displaying whether the bill was squarely within the realm of foreign policy (code 1) or peripheral (code 4). This approach shows a clear break point at 0.1, with most bills below 0.1 being categorized as peripheral to foreign policy while a majority of bills above this cutpoint received a score that marked them as bills that were indeed related. We then screened out of our dataset all bills (and lobbying efforts) with an index below 0.1. Bills that remain in the dataset range from the Congo Conflict Minerals Act of 2009—ranking 0.42 on our foreign policy scale—to the Food Import Safety Act of 2007 (0.30 on our scale) to the Pharmaceutical Market Access Act of 2009, a bill that dealt with the importation of prescription drugs (0.13). Each of these bills dealt with important foreign policy issues. We note that use of the index to discount some of the dollars spent lobbying leaves us with, if anything, a conservative estimate of the lower bound of money spent by Washington’s foreign policy lobby.
This trimmed our dataset to 3,126 bills introduced between 2007 and 2010, which interest groups reported lobbying on in 14,012 filings. Discounting the filing amounts by our foreign policy factor produces the data displayed in Figure 2, which illustrates how much of the money spent lobbying government is focused on foreign policy. Compared against the congressional lobbying totals reported by the Center for Responsive Politics (2014), foreign policy lobbying represents about 10% of the total amount spent inside the beltway. For instance, in 2010, interest groups spent
7 In fact, the disparity between lobbying spending and campaign contributions might be even greater if the LDA required disclosure of all those who attempt to influence policy. LaPira and Thomas (2013) estimate that the “shadow lobbying” community, whose members advertise on lobbyists.info, is just as big as the registered lobbying community.
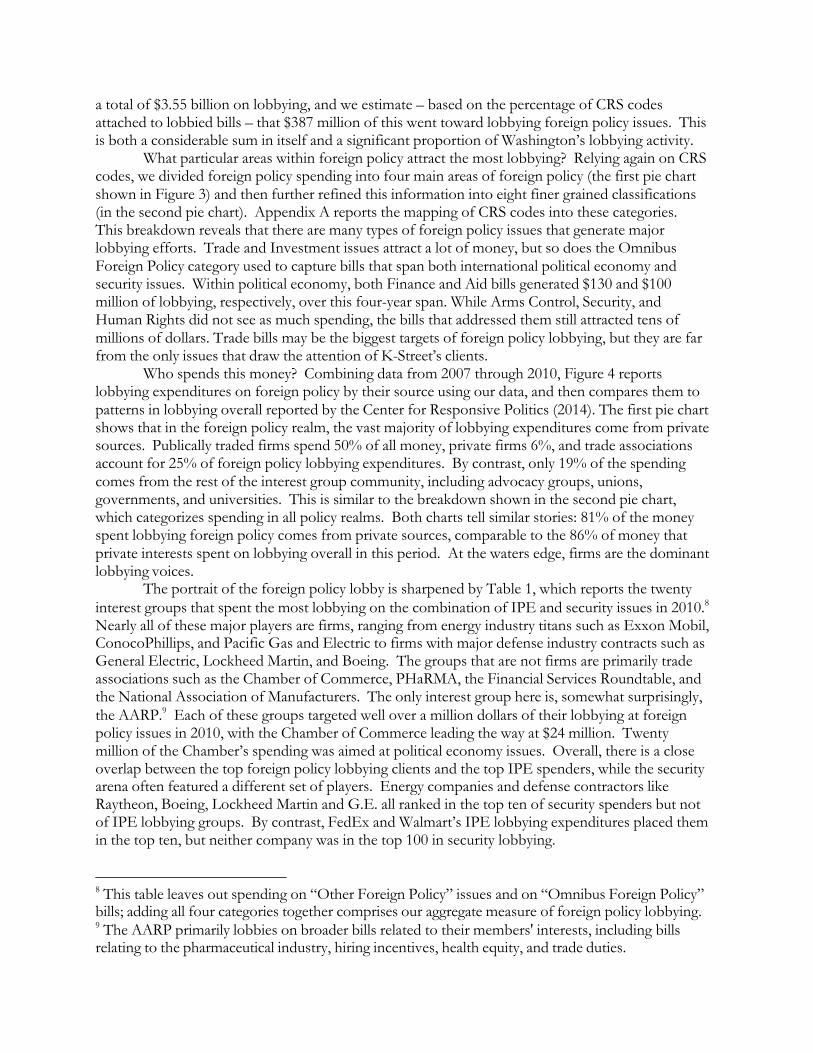
a total of $3.55 billion on lobbying, and we estimate – based on the percentage of CRS codes attached to lobbied bills – that $387 million of this went toward lobbying foreign policy issues. This is both a considerable sum in itself and a significant proportion of Washington’s lobbying activity.
What particular areas within foreign policy attract the most lobbying? Relying again on CRS codes, we divided foreign policy spending into four main areas of foreign policy (the first pie chart shown in Figure 3) and then further refined this information into eight finer grained classifications (in the second pie chart). Appendix A reports the mapping of CRS codes into these categories. This breakdown reveals that there are many types of foreign policy issues that generate major lobbying efforts. Trade and Investment issues attract a lot of money, but so does the Omnibus Foreign Policy category used to capture bills that span both international political economy and security issues. Within political economy, both Finance and Aid bills generated $130 and $100 million of lobbying, respectively, over this four-year span. While Arms Control, Security, and Human Rights did not see as much spending, the bills that addressed them still attracted tens of millions of dollars. Trade bills may be the biggest targets of foreign policy lobbying, but they are far from the only issues that draw the attention of K-Street’s clients.
Who spends this money? Combining data from 2007 through 2010, Figure 4 reports lobbying expenditures on foreign policy by their source using our data, and then compares them to patterns in lobbying overall reported by the Center for Responsive Politics (2014). The first pie chart shows that in the foreign policy realm, the vast majority of lobbying expenditures come from private sources. Publically traded firms spend 50% of all money, private firms 6%, and trade associations account for 25% of foreign policy lobbying expenditures. By contrast, only 19% of the spending comes from the rest of the interest group community, including advocacy groups, unions, governments, and universities. This is similar to the breakdown shown in the second pie chart, which categorizes spending in all policy realms. Both charts tell similar stories: 81% of the money spent lobbying foreign policy comes from private sources, comparable to the 86% of money that private interests spent on lobbying overall in this period. At the waters edge, firms are the dominant lobbying voices.
The portrait of the foreign policy lobby is sharpened by Table 1, which reports the twenty interest groups that spent the most lobbying on the combination of IPE and security issues in 2010.8
Nearly all of these major players are firms, ranging from energy industry titans such as Exxon Mobil, ConocoPhillips, and Pacific Gas and Electric to firms with major defense industry contracts such as General Electric, Lockheed Martin, and Boeing. The groups that are not firms are primarily trade associations such as the Chamber of Commerce, PHaRMA, the Financial Services Roundtable, and the National Association of Manufacturers. The only interest group here is, somewhat surprisingly, the AARP.9 Each of these groups targeted well over a million dollars of their lobbying at foreign policy issues in 2010, with the Chamber of Commerce leading the way at $24 million. Twenty million of the Chamber’s spending was aimed at political economy issues. Overall, there is a close overlap between the top foreign policy lobbying clients and the top IPE spenders, while the security arena often featured a different set of players. Energy companies and defense contractors like Raytheon, Boeing, Lockheed Martin and G.E. all ranked in the top ten of security spenders but not of IPE lobbying groups. By contrast, FedEx and Walmart’s IPE lobbying expenditures placed them in the top ten, but neither company was in the top 100 in security lobbying.
8 This table leaves out spending on “Other Foreign Policy” issues and on “Omnibus Foreign Policy” bills; adding all four categories together comprises our aggregate measure of foreign policy lobbying. 9 The AARP primarily lobbies on broader bills related to their members' interests, including bills relating to the pharmaceutical industry, hiring incentives, health equity, and trade duties.
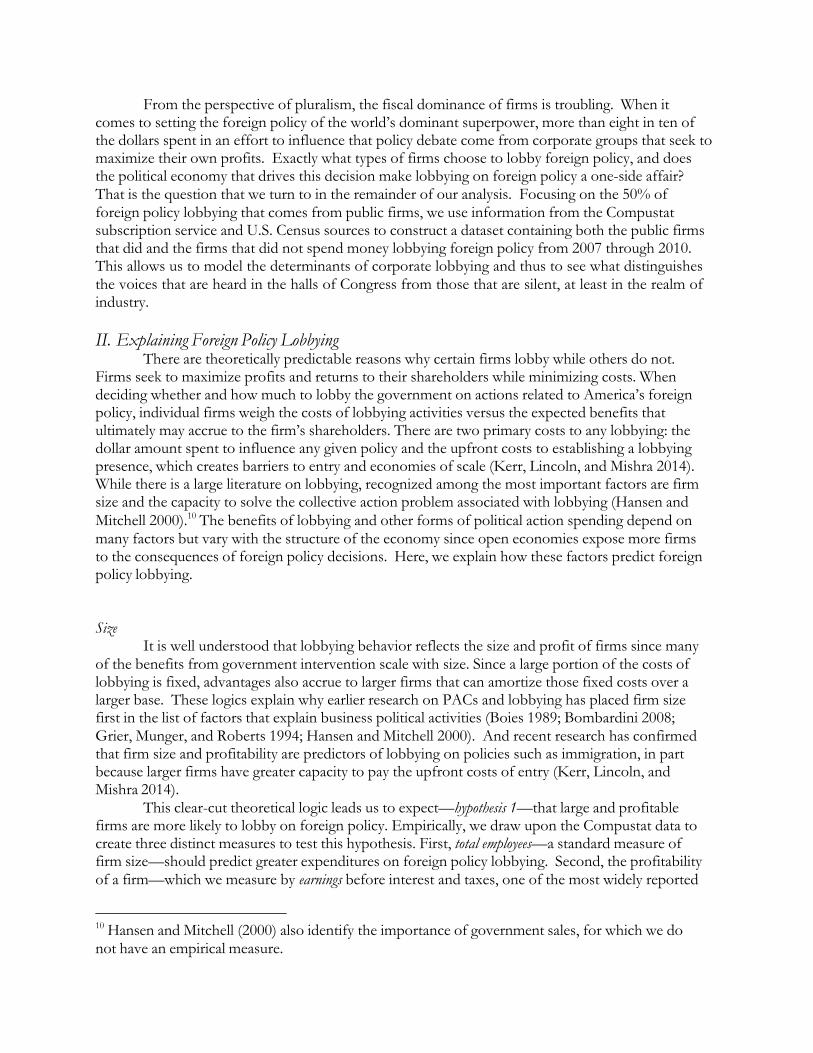
From the perspective of pluralism, the fiscal dominance of firms is troubling. When it comes to setting the foreign policy of the world’s dominant superpower, more than eight in ten of the dollars spent in an effort to influence that policy debate come from corporate groups that seek to maximize their own profits. Exactly what types of firms choose to lobby foreign policy, and does the political economy that drives this decision make lobbying on foreign policy a one-side affair? That is the question that we turn to in the remainder of our analysis. Focusing on the 50% of foreign policy lobbying that comes from public firms, we use information from the Compustat subscription service and U.S. Census sources to construct a dataset containing both the public firms that did and the firms that did not spend money lobbying foreign policy from 2007 through 2010. This allows us to model the determinants of corporate lobbying and thus to see what distinguishes the voices that are heard in the halls of Congress from those that are silent, at least in the realm of industry.
II. Explaining Foreign Policy Lobbying
There are theoretically predictable reasons why certain firms lobby while others do not. Firms seek to maximize profits and returns to their shareholders while minimizing costs. When deciding whether and how much to lobby the government on actions related to America’s foreign policy, individual firms weigh the costs of lobbying activities versus the expected benefits that ultimately may accrue to the firm’s shareholders. There are two primary costs to any lobbying: the dollar amount spent to influence any given policy and the upfront costs to establishing a lobbying presence, which creates barriers to entry and economies of scale (Kerr, Lincoln, and Mishra 2014). While there is a large literature on lobbying, recognized among the most important factors are firm size and the capacity to solve the collective action problem associated with lobbying (Hansen and Mitchell 2000).10 The benefits of lobbying and other forms of political action spending depend on many factors but vary with the structure of the economy since open economies expose more firms to the consequences of foreign policy decisions. Here, we explain how these factors predict foreign policy lobbying.
Size It is well understood that lobbying behavior reflects the size and profit of firms since many
of the benefits from government intervention scale with size. Since a large portion of the costs of lobbying is fixed, advantages also accrue to larger firms that can amortize those fixed costs over a larger base. These logics explain why earlier research on PACs and lobbying has placed firm size first in the list of factors that explain business political activities (Boies 1989; Bombardini 2008; Grier, Munger, and Roberts 1994; Hansen and Mitchell 2000). And recent research has confirmed that firm size and profitability are predictors of lobbying on policies such as immigration, in part because larger firms have greater capacity to pay the upfront costs of entry (Kerr, Lincoln, and Mishra 2014).
This clear-cut theoretical logic leads us to expect—hypothesis 1—that large and profitable firms are more likely to lobby on foreign policy. Empirically, we draw upon the Compustat data to create three distinct measures to test this hypothesis. First, total employees—a standard measure of firm size—should predict greater expenditures on foreign policy lobbying. Second, the profitability of a firm—which we measure by earnings before interest and taxes, one of the most widely reported
10 Hansen and Mitchell (2000) also identify the importance of government sales, for which we do not have an empirical measure.

accounting measures of profitability—should predict foreign policy lobbying. Third, firm rank sales— the firms with the largest market shares—should be more politically engaged on foreign policy. To measure a firm’s rank sales we look at all 23 sectors of the economy at the two-digit North American Industry Classification System (NAICS). We rank all publically traded firms within each sector based on employees (our measure of firms size), with “1” as the largest.
Collective Action
Firm size is not the only determinant of corporate lobbying. As Mancur Olson (1965) argued long ago, collective goods tend to be under-supplied unless the group that would benefit from collective action is small and the benefits from working in concert are concentrated. A similar logic of collective action is at work in foreign policy lobbying. Often, lobbying generates benefits that flow to a whole industry and thus the provision of those goods depends on the incentives for collective action. Following Olson, any particular firm will lobby if it is dominant within an industry—that is, if it can recover a particularly large share of the industry-wide benefits for itself. Dominance depends on relative size, which can be measured by ranking each firm by size within its industry. Dominance also depends on the concentration of the industry itself since dominant firms in highly concentrated industries will reap a larger share of the collective benefit for themselves. In highly diffuse industries—for example, the thousands of rural electric cooperatives—even the largest firms may see relatively few benefits for themselves from lobbying on behalf of the whole industry. Related work by Bombardini (2008) also theorizes that industrial sectors, where the distribution of firm size is more dispersed, are more likely to have a larger fraction of the sector output produced by firms large enough to incur the fixed cost of contributing to politicians and participating in the lobby.
Olson’s established logic leads us to expect—hypothesis 2—that an individual firm is more likely to provide public goods to its industry, and thus to lobby on foreign policy, when the industry is concentrated and the firm is highly ranked by size within the industry so that a large share of those public goods flow to the firm that invests most in foreign policy influence. We compute the concentration of the industry by following a standard procedure from the economics literature. For each sector, we estimate a regression with the log of each firm’s sales ranking (plus 0.5) as the dependent variable and the log of the firm’s sales as the sole independent variable. The estimated coefficient of sales for each sector is our measure of concentration, with larger (less negative) coefficients indicating that the most highly ranked firms account for larger proportions of a sector’s sales.
Open Economy
Our expectations regarding corporate size and collective action are not unique to foreign policy—they derive from the vast literatures on American politics and apply generally, we expect, to all lobbying efforts. What is unique to foreign policy, however, is the extent to which the “open economy politics” associated with globalization alters how firms think about their exposure to events in the broader global economy (Lake 2009).
Firms, because they seek to maximize profits, will lobby on legislation that affects their sector of the economy. Financial firms will lobby on international financial legislation. Aerospace firms will lobby on arms control as that might affect demand for their fighter jets and drones. However, as economies become more open, a wide array of firms—not just the big exporters— increasingly rely on global markets for capital and on a well-functioning transportation system for trade in primary resources, intermediate goods and final products. They rely on investment law to protect networks of factories. And firms from just about every sector of industry are developing interests in the international economy. This kind of logic has long been used to explain the

orientation of policy in small countries—where national firms must become globally enmeshed because the home market is too small to serve as an engine of growth (Weil 1970). An example from our data set is Altria Client Services. Though Altria's business interests reside mostly in tobacco, they have lobbied extensively on bills relating to foreign tax havens and financial regulations—issues that affect both their own priorities and their broader sector's interests. This leads us to predict—hypothesis 3—that firms now broadly participate in IPE lobbying regardless of sector.
International security legislation is another matter. There is no equivalent open economy of security policy. Arms control, for example, remains largely a state matter, and with the exception of large defense contractors and arms producers or procurers, there is little reason to expect broad participation by companies across sectors. Rather, we expect that on security matters it is a narrow subset of industries with direct economic interests in security that lobby. For example, in 2010 the defense technology contractor Raytheon lobbied exclusively on bills relating to defense appropriations and expansions of intelligence and military capabilities.
III. Predicting Foreign Policy Lobbying by Public Firms
We now explore these hypotheses by constructing a dataset that combines firms which did
and did not lobby on foreign policy, estimating a model that predicts each firm’s lobbying expenditures.11 Our dataset links the lobbying records obtained through First Street to the characteristics of 8,186 public firms contained in the Compustat directory, augmented by information on the sector in which they operate from the Census’ North American Industry Classification System (NAICS) (see U.S. Census Bureau 2014).
Our dependent variable is the annual dollar amount of a firm’s lobbying expenditures targeted at foreign policy (or a subcategory of it, in later models), ranging from the modal case of zero dollars up to the $34,510,644 that the Chamber of Commerce spent on total foreign policy lobbying in 2010. This dependent variable averages $21,219 across our entire sample, but $257,348 in the 2,295 cases in which a firm filed a lobbying report with foreign policy bills. We observe lobbying activity or inactivity from 2007 through 2010, yielding a total of 27,834 observations.12
Because these are not independent observations, our errors in predicting one firm’s expenditures in 2007 are very likely linked to its errors in the other years. As a consequence, we estimate all of our models with standard errors clustered at the firm level.
Following other work we control for a firm’s degree of exposure to regulation (Fouirnaies and Hall 2014). There is no systematic firm-level measure of exposure to regulation. Here we employ a method that utilizes Tobin’s “Q”—a measure, pioneered by James Tobin, that assesses the ratio of what the stock market thinks a firm is valued (total market capitalization) versus the booked value of the firm’s assets, adjusted for debt and other accounting assets and liabilities. Tobin’s Q is a measure of whether stock owners see some value in a firm beyond what the accountants estimate is
11 We focus the analysis on total expenditures rather than any lobbying behavior because we are most interested in which firms are spending the most money—rather than any money—to lobby Congress on foreign policy. Our results are largely consistent when we predict a binary measure of any lobbying. 12 Our data structure allow up to four observations for each firm, but because some firms were not in the Compustat dataset in all four years or had missing data in one or more years, our total number of observations falls short of 4 X 8,186.

the firm’s value if broken up and sold tomorrow. Stockholders are forward-looking and can assess the value of government intervention for a firm; however, accountants must also include a reasonable estimate of those same market interventions in the value of the firm’s assets. Thus in Tobin’s Q the value of government intervention appears in both the numerator and the denominator (perhaps with more volatility in the numerator), helping to explain why Tobin’s Q is about 1 for firms in established industries that equity holders and accountants alike know how to value. To calculate Tobin’s Q we use the method reported by Kaplan and Zingales (1997), which has the advantage that all of the parameters are reported by Compustat for publically traded firms.13
We also conduct extensive robustness checks, reported in the Appendix Tables A.1, A.2, and A.3, in which we run yearly cross-sectional models,14 separately estimate the decision to lobby or not and the decision of how much to spend,15 and then analyze these decisions together in a Heckman model.16 In each, we find substantively similar results to the ones presented below. Because of this, and because the estimation of rho in the Heckman model did not provide strong evidence of a correlation between errors in models of the two decision stages, in our main text we present our OLS results.
The Corporate Hierarchy
Table 3 presents the results of our basic model, which predicts spending on lobbying all areas of foreign policy combined. The first result is that the estimated effect of a firm’s number of employees provides strong support for Hypothesis 1. Firm size predicts political activity.
13 There is a large literature on calculation of Tobin’s Q and a variety of other methods as well (e.g., Abel and Eberly 2011; Chung and Pruitt 1994; Lindenberg and Ross 1981). 14 Our first robustness check, presented in Appendix Table A.1, runs separate cross-sectional models for each year rather than combining all four into a single model. We find remarkably consistent patterns in the factors that predict lobbying expenditures across all four years. 15 In our second check, presented in Appendix Table A.2, we run two models that break down the stages of lobbying decisions rather than combining them as we do in our main analysis. First, we estimate a logit model of the decision to lobby at all or not to lobby on our full sample of firms. Second, we estimate an OLS model predicting the size of lobbying expenditures for only the 2,326 firms that chose to lobby (and for which we have the full set of explanatory factors). The only differences that emerge between this and our main model is that the coefficient on the interaction between a firm’s sales ranking and its industry’s concentration variable falls just short of 95% statistical significance, likely due to the fact that the sample is so much smaller. 16 Our final robustness check estimates a Heckman model, which first estimates the chances that a firm lobbies at all – that it is “selected” in the group of cases for which we observe a lobbying amount -- and then runs a second stage OLS regression on the firms that choose to lobby that explains how much they spent after correcting for this selection bias. In order to meet the assumptions of the Heckman model, we withheld from the second stage model four industry fixed effects which appear to affect selection into lobbying but do not influence lobbying amounts (fixed effects for the industries of wholesale trade, administrative support and waste management, professional, scientific, and technical services, and health care and social assistance). Again, our results are nearly identical to those that we report in the main text, with the exceptions being that the interaction of industry rank and concentration is not a significant predictor in the selection model. (We also see similar patterns when we run a single model on the natural log of lobbying expenditures.) There is a weak negative correlation between the errors in the two equations, with a rho of -0.16, with a standard error of 0.10.

Controlling for other factors, firms with one thousand more employees will spend a predicted $944 more on lobbying foreign policy every year. The positive and significant coefficient on a firm’s earnings also suggests that lobbying is the domain primarily of the firms that can afford it. Every extra hundred million dollars of earnings should translate into about $1,248 more in lobbying expenditures, ceteris paribus. The third implication of Hypothesis 1 in our model comes from the postulation that within an industry (such as “Utilities” or “Petroleum and Chemical Manufacturing”), firms with the largest market shares should be the most politically engaged on foreign policy. The negative and significant coefficient on a firm’s sales rank fits with this expectation, showing that the #1 ranked firm in a sector spends more than the #10 ranked firm.
Hypothesis 2 predicts that the concentration of interests within a sector should change the dynamics of foreign policy lobbying because it will affect the incentives and capacity to solve the collective action problems associated with lobbying. Specifically, we expect to find that concentrated industries yield concentrated benefits when the leading firms bear the costs of collective action. Concentration, then, should accentuate the impact of a firm’s ranking; top-ranked firms within a sector should be even more likely to lobby when they operate in highly concentrated industries. This is exactly that pattern we see in the significant interaction between a firm’s sales ranking within a sector and that sector’s level of concentration (based on the distribution of sales within a sector). Sales ranking alone has a negative impact, meaning that top-ranked firms lobby more, and this pattern is accentuated in the most concentrated sectors.
Figure 5 demonstrates the interaction between these two variables graphically. The dark line shows the predicted increase in lobbying that would come if a firm rose from #10 to #1 in the rankings – or made any 10-point ranking rise – while the dashed lines show the 95% confidence interval around this predicted effect. Because of the significant interaction, this effect varies across levels of industry concentration, and our graph charts this variation across the observed range of industry concentration in our dataset. In the most dispersed industries, the impact of a rankings rise is apparently negative, but far short of statistical significance. A rankings rise has a positive and statistically significant impact in the average industry, and a 10-point rise should bring a $1,258 increase in lobbying expenditures in our most highly concentrated industry, holding companies. The interaction between these two variables shows that in industries dominated by a few firms, those firms act on their incentives to be the most active political players. In less concentrated industries, political engagement on foreign policy is spread out across more firms.
These findings are consistent across all different issue areas of foreign policy, the results in Table 4 show.17 These four models predicting lobbying expenditures on IPE, Security, Other Foreign Policy, and Omnibus Foreign Policy bills, estimated together in a seemingly unrelated regressions framework, yield nearly identical results. That is not because the firms that lobby in one area are always the same firms that lobby in another; Table 1 showed that IPE and Security bills were often lobbied by distinct groups of players. What Table 4 does indicate is that the same firm characteristics and thus the same strategic logics that drive firms to spend on political activity in one realm of foreign policy—such as trade—also operate in the other realms such as security.
The Open Economy
In Hypothesis 3 we expected that all firms would gain benefits from lobbying in IPE with an open economy; by contrast, in particular domains such as security only firms operating within that area would benefit from lobbying. For an empirical test of this expectation we focus, here, on the
17 In both these models and in the model reported in Table 3, we find no linear impact of our control variable, Tobin’s Q.

difference between IPE and security. We determine whether there is a difference in the breadth of lobbying across issue area by an examination of industry-level fixed effects.18 We include these effects (which indicate how much more firms in a given industry spent on average compared to the largest industry in our data, financial services) in all of our models. Figure 6 presents a compact look at the impact of industry fixed effects on lobbying in IPE and in security. The fixed effects are converted into a percentage of the average expenditure in each realm, showing them as vertical bars only if they are statistically significant at the 95% confidence level. If one of these realms of foreign policy shows many tall bars, that indicates that corporations in some sectors of the economy spend much more on lobbying than other sectors. If, by contrast, there are few tall bars representing significant fixed effects, that means that lobbying participation is spread more evenly across economic sectors.
The lesson here is that, regardless of sector, firms now broadly participate in IPE lobbying. They all appear to share a stake in these substantive areas of policy, with no sector (other than metal and electronic manufacturing) much more invested than others. By contrast, when it comes to bills touching on security issues, firms in eleven of the sectors lobby significantly more than financial firms and other sectors. Security seems to be a niche foreign policy realm, with sectors like metal and electronic manufacturing (which includes most defense contractors), “mining, quarrying, and oil and gas extraction,” holding companies, and petroleum and chemical manufacturers spending the most. In short, security bills attract the attention of a very narrow range of industries, whereas firms from nearly every sector are represented in policy debates over international economic issues.
IV. How Many Lobbying Voices, and Do they Sing in Unison?
Our multivariate analyses, so far, raise troubling questions about the assumption of pluralism. The largest firms with the greatest stakes in highly concentrated industries devote the most money to lobbying the U.S. government on foreign policy. These findings also raise additional empirical questions, which we can begin to address by analyzing our rich dataset in different ways. Here, we briefly explore two of these questions.
First, when Congress considers a piece of foreign policy legislation, how many voices will weigh in on it? Theories of pluralism demand not only that many groups will be generally active in Washington’s affairs, but that multiple groups representing different interests will lobby the very same bills. Our prior analysis only looks at overall lobbying activity, but the Lobbying Disclosure Act mandates that groups designate the individual bills on which they are active. Looking at our data at the level of individual bills rather than combining a group’s spending across all bills allows us to compute a count of the number of groups that reported lobbying a given foreign policy bill. If many groups lobby the same bills, this may be evidence of what Austen-Smith and Wright (1994) termed “counteractive lobbying” (also see Baumgartner and Leech (1996) for a discussion of the complexities of measuring counteractive lobbying).
Figure 7 reports the distribution of this count of how many groups lobbied a given bill. Importantly, we harness the richness of the First Street dataset to look at each bill’s legislative history and then to place bills into three different categories. The first and darkest line shows lobbying counts for the 1,548 foreign policy bills in our dataset that were introduced in the House or Senate, then essentially never heard from again. These bills attracted relatively little lobbying attention. Only one group lobbied on 46% of them, 36% saw between two and five groups
18 We adopt this approach, rather than simply measuring a firm’s exposure to the international economy through its exports or reliance on imported intermediate inputs because, in our datasets, these measures are not available at the firm level.

lobbying, and none generated interest among more than one hundred groups. This pattern does not fulfill the pluralist ideal, with relatively few voices heard from on each piece of legislation. Then again, these are the bills that Congressional committees declined to take up, a signal that they were not deemed important.19
For bills that advance further in the process—closer to becoming law—the patterns of lobbying shift. Consider, first, bills that advance at least to the hearing stage, without ultimately becoming law. Of these 488 bills, less than a third were lobbied by only one group, 29% by a handful of groups, and 24% were lobbied by between eleven and one hundred groups. On more serious legislation, it seems, a larger number of groups mobilized to lobby each bill. On the 90 foreign policy bills that became law in our time period, Congress and the executive branch heard from many more voices. More than one hundred groups lobbied on 29% of these bills, with between eleven and one hundred groups lobbying on other 21% of them. When Congress is in the final throes of making policy, at least, a multitude of groups make their wishes known.
While having many groups at the table is necessary for pluralism to work as theorized, it is not sufficient: this multitude must voice a variety of views that reflect the broad interests of the American public. This is what is needed for truly counteractive lobbying, and for the interest group community to represent the public interest without bias. This raises a thorny empirical question that has often been noted in the study of interest groups. Merely listing the groups that lobby cannot resolve debates about bias and pluralism because “it is difficult to know what in the abstract an unbiased pressure system would look like” (Schlozman and Tierney 1983, 1007). Baumgartner and Leech (1998, 93) note that “the absence of a clear point of reference makes it difficult for scholars to agree on the degree to which the Washington interest-group system is biased,” and Lowery and Gray (2004, 7) add their surprise that “far less attention has been accorded to the antecedent assumption that the distribution of organized interests seeking influence is biased with respect to the distribution of interests in society.”
Bonica’s (2013; 2014) recent advance in jointly estimating the ideological distribution of interest groups and the everyday citizens who contribute to politicians at all levels of American government makes this sort of comparison possible. His approach, which uses contribution patterns to place candidates, individual donors, and donating groups on a common ideological scale, allows one to compare the distribution of organized interests with the distribution of interests in society. By matching up the interest groups in his dataset with the lobbying clients – not just firms, by all types of lobbying groups – in ours, we can ask whether the groups lobbying foreign policy are generally reflective of the ideology of American voters (or at least those who make political contributions, one of the caveats to our application of Bonica’s data that we explore below).
Figure 8 sheds light on this question, drawing on data from the 2007-08 campaign cycle. In the graph on the left, the dotted gray line shows the ideological distribution of 3.3 million individuals. It has two peaks, liberals at the left and more conservative individuals on the right, with a bit greater density on the left and a mean value of -0.18 on Bonica’s scale. The dashed black line displays the distribution of all 250,848 groups making campaign contributions. Groups are much more densely packed in the ideological center than individuals, and skew to the right with a mean value of 0.09. In the solid black line are the 1,144 foreign policy lobbying groups that we were able to match to Bonica’s dataset. Their distribution looks like that of the large set of interest groups, only more so. The groups that are active in foreign affairs are even more tightly packed in similar ideological locations, and skew even more to the right with a mean of 0.17. (The mean position of
19 Of course, the fate of these bills may have been endogenous to the lobbying activity; strong opposition from one powerful may have doomed them.

foreign policy lobbying groups is significantly different from both the mean interest group position and the mean position of the public, at the 99% confidence level.)
The graph at the right zooms in on the foreign policy lobbying, adding the ideological distributions of the fifty groups spending the most money in the security realm (in solid gray) and on IPE bills (dotted gray). These major players are located even more closely together than foreign policy lobbying groups overall, and are skewed even further to the right. The mean location of the security spenders is 0.25, while the average location of the top IPE lobbying groups is 0.24.
Several caveats are in order about applying Bonica’s data to our question. First, Bonica’s measure of the ideologies of individuals only comes from those who donate, rather than all voters. However, since contributors are typically wealthier than voters in general, it is likely that this creates a rightward bias in our measure of the public interest. That bias, then, works against our finding that interest groups skew to the right of the public, rather than providing an alternative explanation of our finding. Another caveat in interpreting Bonica’s data as a pure measure of ideological position for interest groups is that, because his scores are derived from contribution patterns, lobbying groups that give in order to preserve their access to incumbents and members of key committees (see Grimmer and Powell 2014) by giving to politicians from both parties will look more centrist than they truly are. Because of this, we cannot definitively conclude that the groups lobbying foreign policy are less polarized than individual Americans, who rarely split their giving across parties. Yet if foreign policy lobbying groups are not quite as centrist as they appear in Figure 8, this only increases the concern about their rightward bias, compared with citizens. Access-seeking behavior may push their mean position closer to that of the American public, when in fact the positions they advocate once they gain access are likely even more conservative than Bonica’s data can reveal. Overall, these caveats make us more confident of the direction of our findings.
Because the corporate interests lobbying foreign policy are located so consistently on the center-right of the spectrum and because their distribution does not mimic that of individuals in American society, pluralism does not appear to operate in this realm. Rather than providing counteractive lobbying that represents the broad range of American opinion, the multitude of voices that lobby major foreign policy bills are likely compounding the bias towards large corporations that on average advocate center-right positions. Viewed from the lens of pluralist theory, this constellation of positions clearly falls short of what is necessary for interest groups to act as faithful agents of the people on matters of foreign policy.
V. Conclusion
Using a new dataset, this paper demonstrates empirically that when it comes to U.S. foreign policy, firms and trade associations far outspend labor unions, state and local governments, universities, and other interest groups, by better than a four-to-one margin. Large public firms spend most of this money, with the biggest and most profitable among them turning their advantage in financial resources into a louder voice in foreign policy debates. The top-ranked firms in an industry are the most active, especially when market shares within an industrial sector are highly concentrated among a handful of dominant players.
This article raises normative concerns for the American political system and potentially its foreign policy. The hope of pluralism is that, even when political advocacy is done by interest groups rather than through direct citizen engagement, all sectors of society are fairly represented by lobbyists who line up on multiple sides of an issue (Dahl 1956, 1961; Lindblom 1977; Truman 1951). Yet critics of pluralism warn that this arrangement will falter when only the most privileged groups arguing one side of an issue are represented (Schattschneider 1960).
In the foreign policy arena, perhaps even more so than in the realm of domestic politics, the
predominance of firms over other types of interest groups threatens the pluralist balance of power. The strongest voices in America’s foreign policy debates—at least when it comes to lobbying—are those of a small group of private interests skewed on average center-right seeking to turn their market advantages into political influence in ways that could affect not just U.S. policy but international relations more generally. Whether firms actually buy influence over Congress and the executive branch, purchase access to these officials, or merely counteract each other, they spend the most in an effort to shape American foreign policy. While it is beyond the scope of this paper to demonstrate that such lobbying translates into influence, what is clear is that corporate interests dominate the foreign policy lobby, that there are predictable inequalities among firms in lobbying investment that parallel market advantages, and the firms that lobby are not representative of the median voter. And in the realm of international security, especially, a very narrow range of corporate interests vies for access. This raises normative concerns that should merit further study from American politics and international relations scholars alike.

Figure 1. Lobbying Expenditures Dwarf Campaign Contributions

Figure 2. What Proportion of Lobbying Dollars are Targeted at Foreign Policy?

Figure 3. Which Areas of Foreign Policy Attract the Most Lobbying Money?

Figure 4. What Types of Groups Lobby in the Foreign and Domestic Policy Arenas?

Figure 5. The Impact of a Rise in Sales Rankings, at Different Levels of Industry Concentration

Figure 6. Exploring Foreign Policy Lobbying by Individual Industries (sector fixed-effect coefficients)

Figure 7. How Many Groups Lobby Foreign Policy Bills, by final bill disposition

0 Top 50 Security Spenders Top 50 IPE Spenders Individuals All Groups Groups Lobbying IR
-2 -1 0 1 2
Ideological Position -2 -1 0 1 2
Figure 8. The Ideological Distributions of Individuals, Interest Groups, and Groups Lobbying Foreign Policy
Den
sity
0.0
0.5
1.0
1.5
Den
sity
0.0
0.5
1.0
1.5

Table 1. Top Twenty Foreign Policy Lobbying Clients, 2010
Client Combined Lobbying IPE Rank IPE Lobbying Security Rank Security Lobbying
Chamber of Commerce of the U.S.A. $24,162,194 1 $20,438,267 1 $3,723,927 Pacific Gas and Electric Company $13,137,130 2 $12,314,901 9 $822,229
General Electric Company (& Subsidiaries) $9,401,558 3 $7,122,581 2 $2,278,977
AARP $5,552,091 4 $4,543,267 7 $1,008,824
Conocophillips $4,501,810 10 $2,783,589 3 $1,718,221
Financial Services Roundtable $4,423,909 5 $4,423,909 n/a $0 Verizon Communications Inc. (& Subsidiaries) $3,614,920 7 $3,252,892 23 $362,028
Pharmaceutical Research and Manufacturers of Am. $3,569,582 6 $3,445,554 $124,028
Boeing Company $3,250,407 13 $2,336,471 8 $913,936 Wal-Mart Stores, Inc. $3,198,845 8 $3,103,166 109 $95,679
FedEx Corporation $2,897,336 9 $2,897,236 1904 $100
The Procter and Gamble Company $2,537,107 12 $2,476,685 161 $60,422
Altria Client Services Inc. $2,533,137 11 $2,533,137 n/a $0
Lockheed Martin Corporation $2,400,407 27 $1,318,033 6 $1,082,374
Exxon Mobil Corp $2,125,401 18 $1,602,813 14 $522,588
National Association of Realtors $2,114,617 14 $1,854,478 35 $260,139
Southern Company $1,918,882 32 $1,219,270 11 $699,612
Raytheon Company $1,822,012 71 $705,248 5 $1,116,764
National Association of Manufacturers $1,808,070 19 $1,602,628 47 $205,442
Monsanto Company $1,789,200 15 $1,789,200 n/a $0

Table 2. Sample Bills Lobbied by the Top Ten Foreign Policy Lobbing Clients, 2010
Client Chamber of Commerce of
Bill Name 111 S.1089: Promoting
Bill Classification 1 Finance CRS code and
Bill Description A bill to facilitate the export of United
the U.S.A. American Agricultural and 3 Trade and Investment States agricultural commodities and Medical Exports to Cuba Act of CRS code products to Cuba as authorized by the 2009 Trade Sanctions Reform and Export
Enhancement Act of 2000, to establish an agricultural export promotion program with respect to…
Pacific Gas and Electric 111 S.1462: American Clean 1 Trade and Investment An original bill to promote clean energy Company Energy Leadership Act of 2009 CRS code, 1 Arms
Control CRS code technology development, enhanced energy efficiency, improved energy security, and energy innovation and
workforce development, and for other purposes.
General Electric Company 111 S.1934: Foreign Account 1 Finance CRS code A bill to amend the Internal Revenue (Including Subsidiaries) Tax Compliance Act of 2009 Code of 1986 to prevent the avoidance of
tax on income from assets held abroad, and for other purposes.
AARP 111 H.R.1408: Inclusive Home 1 Trade and Investment To require all newly constructed, federally Design Act of 2009 CRS code, 2 Human assisted, single-family houses and town Rights CRS codes houses to meet minimum standards of visitability for persons with disabilities.
Conocophillips 111 S.1700: Energy Security 1 Other CRS code, 1 A bill to require certain issuers to disclose Through Transparency Act of Omnibus CRS code payments to foreign governments for the 2009 commercial development of oil, natural gas, and minerals, to express the sense of Congress that the President should disclose any payment relating to the…
28

Financial Services Roundtable
111 S.2473: A bill to provide for the liquidation or reliquidation of certain entries of truck tires entered on or after July 7, 2004, and on or before July 12, 2006.
2 Trade and Investment CRS codes
A bill to provide for the liquidation or reliquidation of certain entries of truck tires entered on or after July 7, 2004, and on or before July 12, 2006.
Verizon Communications Inc. and Its Subsidiaries
111 S.1649: Weapons of Mass Destruction Prevention and Preparedness Act of 2009
1 Trade and Investment CRS code, 1 Aid CRS code, and 1 Arms Control CRS Code
A bill to prevent the proliferation of weapons of mass destruction, to prepare for attacks using weapons of mass destruction, and for other purposes.
Pharmaceutical Research and Manufacturers of America
111 H.R.3012: TRADE Act of 2009
1 Finance CRS code, 5 Trade and Investment CRS codes, and 1 Human Rights CRS Code
To require a review of existing trade agreements and renegotiation of existing trade agreements based on the review, to set terms for future trade agreements, to express the sense of the Congress that the role of Congress in trade policymaking…
Boeing Company 111 H.R.3326: Department of Defense Appropriations Act, 2010
1 Aid CRS code, 1 Arms Control CRS code, and 1 Human Rights CRS code
Making appropriations for the Department of Defense for the fiscal year ending September 30, 2010, and for other purposes.
Wal-Mart Stores, Inc. 111 S.1462: American Clean Energy Leadership Act of 2009
1 Trade and Investment CRS code, 1 Arms Control CRS code
An original bill to promote clean energy technology development, enhanced energy efficiency, improved energy security, and energy innovation and workforce development, and for other
purposes.
29

Table 3. Explaining Public Firm Foreign Policy Lobbying Expenditures
Variable Coefficient (std. error)
Employees (in thousands) $944.4*** (158.6)
Earnings Before Interest and Taxes (in $ millions) $12.48***
(3.56)
Ranking of Firm’s Sales within Sector -$254.7*** (93.68)
Concentration of Firms within Sector -8,382
(88,031)
Interaction of Sales Ranking X Concentration of Firms -696.6** (290.7)
Tobin’s Q $0.09
(0.17)
Constant -8,982 (31,853)
Sector Fixed Effects included
Observations 27,834
R-squared 0.1
Note: Table entries are OLS regression coefficients, with standard errors clustered at the firm level in parentheses. The model includes fixed effects for 23 industrial sectors. * indicates p<.05 in a two-tailed test, ** indicates p<.01 in a two- tailed test.
Table 4. Explaining Public Firm Foreign Policy Lobbying, by issue area
Variable International Security Other Omnibus

Political Economy
Foreign Policy
Foreign Policy
Employees (in thousands) $632.7*** $85.93*** $67.47** $158.3*** (105.8) (29.05) (29.63) (57.05)
Earnings Before Interest and Taxes 6.76*** 1.22*** 0.99*** 3.52*** (1.89) (0.38) (0.36) (1.19)
Ranking of Firm’s Sales in Sector -106.7** -36.50*** -34.38*** -77.17*** (53.34) (11.61) (10.15) (28.17)
Concentration of Firms in Sector -4,584 -2,286 1,060 -2,571 (64,554) (7,577) (7,873) (15,518)
Interaction of Sales Ranking X -277.8* -102.5*** -101.3*** -215.0** Concentration of Firms (165.6) (35.15) (31.03) (87.74)
Tobin’s Q 0.041 0.015 0.005 0.03 (0.13) (0.015) (0.01) (0.03)
Constant 1,400 -3,136 -2,688 -4,559 (23,854) (2,842) (3,025) (4,963)
Sector Fixed Effects included included included included
Observations 27,834 27,834 27,834 27,834
R-squared 0.09 0.04 0.04 0.08 Note: Table entries are least squares regression coefficients from a seemingly unrelated regression model, with standard errors clustered at the firm level in parentheses. All models include fixed effects for 23 industrial sectors. * indicates p<.05 in a two-tailed test, ** indicates p<.01 in a two-tailed test.
References
Abel, Andrew B., and Janice C. Eberly. 2011. “How Q and Cash Flow Affect Investment without Frictions: An Analytic Explanation.” Review of Economic Studies 78(4): 1179–1200.
Ansolabehere, Stephen, John M. de Figueiredo, and James M. Snyder Jr. 2003. “Why Is There so Little Money in U.S. Politics?” Journal of Economic Perspectives 17(1): 105–130.
Apollonio, Dorie E. 2005. “Predictors of Interest Group Lobbying Decisions.” The Forum 3(3): 1–19.
Austen-Smith, David, and John R. Wright. 1994. “Counteractive Lobbying.” American Journal of Political Science 38(1): 25–44.
Baumgartner, Frank R., Jeffrey M. Berry, Marie Hojnacki, David C. Kimball, et al. 2009. Lobbying and Policy Change: Who Wins, Who Loses, and Why. Chicago: University of Chicago Press.
Baumgartner, Frank R., and Beth L. Leech. 1998. Basic Interests: The Importance of Groups in Politics and in Political Science. Princeton, NJ: Princeton University Press.
Baumgartner, Frank R., and Beth L. Leech. 1996. “The Multiple Ambiguities of ‘Counteractive Lobbying.’” American Journal of Political Science 40(2): 521–542.
Boies, John L. 1989. “Money, Business, and the State: Material Interests, Fortune 500 Corporations, and the Size of Political Action Committees.” American Sociological Review 54(5): 821–833.
Bombardini, Matilde. 2008. “Firm Heterogeneity and Lobby Participation.” Journal of International Economics 75(2): 329–348.
Bonica, Adam. 2013. Database on Ideology, Money in Politics, and Elections: [Computer file]. Stanford University Libraries. http://data.stanford.edu/dime (Accessed March 10, 2015).
Bonica, Adam. 2014. “Mapping the Ideological Marketplace.” American Journal of Political Science 58(2): 367–386.
Brasher, Holly, and David Lowery. 2006. “The Corporate Context of Lobbying Activity.” Business and Politics 8(1): 1–25.
Broz, J. Lawrence. 2005. “Congressional Politics of International Financial Rescues.” American Journal of Political Science 49(3): 479–496.
Broz, J. Lawrence. 2008. “Congressional Voting on Funding the International Financial Institutions.” Review of International Organizations 3(4): 351–374.
Broz, J. Lawrence, and Michael Brewster Hawes. 2006. “U.S. Domestic Politics and International Monetary Fund Politics.” In Delegation and Agency in International Organizations, eds. Darren G. Hawkins et al. New York: Cambridge University Press, p. 77–106.
Büthe, Tim, and Walter Mattli. 2011. The New Global Rulers: The Privatization of Regulation in the World Economy. Princeton, NJ: Princeton University Press.
Büthe, Tim, and Helen V. Milner. 2014. “Foreign Direct Investment and Institutional Diversity in Trade Agreements: Credibility, Commitment, and Economic Flows in the Developing World, 1971–2007.” World Politics 66(1): 88–122.
Center for Responsive Politics. 2014. “Lobbying Database.” OpenSecrets.org. www.opensecrets.org/lobby/.
Chung, Kee H., and Stephen W. Pruitt. 1994. “A Simple Approximation of Tobin’s Q.” Financial Management 23(3): 70–74.
Dahl, Robert A. 1956. A Preface to Democratic Theory. Chicago: University of Chicago Press. Dahl, Robert A. 1999. “Can International Organizations be Democratic? A Skeptic’s View.” In
Democracy’s Edges, eds. Ian Shapiro and Casiano Hacker-Cordón. London ; New York: Cambridge University Press, p. 19–36.

Dahl, Robert A. 1986. “Rethinking Who Governs? New Haven Revisited.” In Community Power: Directions for Future Research, ed. Robert J. Waste. Newbury Park, CA: SAGE.
Dahl, Robert A. 1961. Who Governs?: Democracy and Power in an American City. New Haven, CT: Yale University Press.
Downs, Anthony. 1957. An Economic Theory of Democracy. Boston: Harper and Row. Drope, Jeffrey M., and Wendy Hansen. 2006. “Does Firm Size Matter? Analyzing Business
Lobbying in the United States.” Business and Politics 8(2): 1–19. Fleisher, Richard. 1993. “PAC Contributions and Congressional Voting on National Defense.”
Legislative Studies Quarterly 18(3): 391–409. Fordham, Benjamin O. 2008a. “Economic Interests and Congressional Voting on Security
Issues.” Journal of Conflict Resolution 52(5): 623–640. Fordham, Benjamin O. 2008b. “Power or Plenty? Economic Interests, Security Concerns, and
American Intervention.” International Studies Quarterly 52(4): 737–758. Fordham, Benjamin O., and Katja B. Kleinberg. 2012. “How Can Economic Interests Influence
Support for Free Trade?” International Organization 66(2): 311–328. Fouirnaies, Alexander, and Andrew B. Hall. 2014. “The Financial Incumbency Advantage:
Causes and Consequences.” Journal of Politics 76(3): 711–724. Garten, Jeffrey E. 1997. “Business and Foreign Policy.” Foreign Affairs (May/June). Grier, Kevin B., and Michael C. Munger. 1993. “Comparing Interest Group PAC Contributions
to House and Senate Incumbents, 1980-1986.” Journal of Politics 55(3): 615–643. Grier, Kevin B., Michael C. Munger, and Brian E. Roberts. 1994. “The Determinants of
Industry Political Activity, 1978-1986.” American Political Science Review 88(4): 911–926. Grimmer, Justin, and Eleanor Neff Powell. 2014. “Money in Exile: Campaign Contributions and
Committee Access.” Stanford University. Unpublished manuscript. Grossman, Gene M., and Elhanan Helpman. 2001. Special Interest Politics. Cambridge, MA: MIT
Press. Hansen, Wendy L., and Neil J. Mitchell. 2000. “Disaggregating and Explaining Corporate
Political Activity: Domestic and Foreign Corporations in National Politics.” American Political Science Review 94(4): 891–903.
Hillman, Amy J., Gerald D. Keim, and Douglas Schuler. 2004. “Corporate Political Activity: A Review and Research Agenda.” Journal of Management 30(6): 837–857.
Jacobs, Lawrence R., and Benjamin I. Page. 2005. “Who Influences U.S. Foreign Policy?” American Political Science Review 99(1): 107–123.
Kaplan, Steven N., and Luigi Zingales. 1997. “Do Investment-Cash Flow Sensitivities Provide Useful Measures of Financing Constraints?” Quarterly Journal of Economics 112(1): 169– 215.
Keohane, Robert O., and Helen V. Milner, eds. 1996. Internationalization and Domestic Politics. Cambridge, UK: Cambridge University Press.
Kerr, William R., William F. Lincoln, and Prachi Mishra. 2014. “The Dynamics of Firm Lobbying.” American Economic Journal: Economic Policy 6(4): 343–79.
Kim, In Song. 2012. “A Theory of Open Trade with Heterogeneous Firms.” Chicago. Paper presented at the Midwest Political Science Association.
Lake, David A. 2009. “Open economy politics: A critical review.” Review of International Organizations 4(3): 219–244.
LaPira, Tim, and Herschel F. Thomas III. 2013. "Just How Many Newt Gingrich’s Are There on K Street? Estimating the True Size and Shape of Washington’s Revolving Door." Chicago. Paper presented at the Midwest Political Science Association.
Lessig, Lawrence. 2011. Republic, Lost: How Money Corrupts Congress-and a Plan to Stop It. New York: Twelve (Hachette).

Lindblom, Charles E. 1977. Politics and Markets : The World’s Political Economic Systems. New York: Basic Books.
Lindenberg, Eric B., and Stephen A. Ross. 1981. “Tobin’s q Ratio and Industrial Organization.” Journal of Business 54(1): 1–32.
Lowery, David, and Virginia Gray. 2004. “Bias in the Heavenly Chorus: Interests in Society and before Government.” Journal of Theoretical Politics 16(1): 5–29.
Lowi, Theodore J. 1969. The end of liberalism: Ideology, policy, and the crisis of public authority. New York: WW Norton.
Ludema, Rodney D., Anna Maria Mayda, and Prachi Mishra. 2010. “Protection for Free?: The Political Economy of US Tariff Suspensions.” Washington, DC. IMF Working Paper WP/10/211.
McCormick, James M., ed. 2012. The Domestic Sources of American Foreign Policy: Insights and Evidence. 6th Edition. Lanham, Md: Rowman & Littlefield.
Milner, Helen V. 1997. Interests, Institutions, and Information. Princeton, NJ: Princeton University Press.
Milner, Helen V. 1988a. Resisting Protectionism: Global Industries and Politics of International Trade. Princeton, NJ: Princeton University Press.
Milner, Helen V. 1988b. “Trading Places: Industries for Free Trade.” World Politics 40(3): 350– 376.
Milyo, Jeffrey, David Primo, and Timothy Groseclose. 2000. “Corporate PAC Campaign Contributions in Perspective.” Business and Politics 2(1): 75–88.
Mitra, Devashish. 1999. “Endogenous Lobby Formation and Endogenous Protection: A Long- Run Model of Trade Policy Determination.” American Economic Review 89(5): 1116–1134.
Moravcsik, Andrew. 2004. “Is there a ‘Democratic Deficit’ in World Politics? A Framework for Analysis.” Government and Opposition 39(2): 336–363.
Mosley, Layna. 2011. Labor Rights and Multinational Production. Cambridge, UK: Cambridge University Press.
Olson, Mancur, Jr. 1965. The Logic of Collective Action: Public Goods and the Theory of Groups. Cambridge, MA: Harvard University Press.
Olson, Mancur, Jr., and Richard Zeckhauser. 1966. “An Economic Theory of Alliances.” The Review of Economics and Statistics 48(3): 266–279.
Rogowski, Ronald. 1989. Commerce and Coalitions: How Trade Affects Domestic Political Alignments. Princeton, NJ: Princeton University Press.
Sandler, Todd. 1993. “The Economic Theory of Alliances: A Survey.” Journal of Conflict Resolution 37(3): 446–483.
Schattschneider, Elmer E. 1960. The Semi-Sovereign People: A Realist’s View of Democracy in America. New York: Holt, Rinehart and Winston.
Schlozman, Kay Lehman, and John T. Tierney. 1983. “More of the Same: Washington Pressure Group Activity in a Decade of Change.” Journal of Politics 45(2): 351–377.
Schlozman, Kay Lehman, Sidney Verba, and Henry E. Brady. 2012. The Unheavenly Chorus: Unequal Political Voice and the Broken Promise of American Democracy. Princeton, NJ: Princeton University Press.
Straus, Jacob. 2010. Lobbying the Executive Branch: Current Practices and Options for Change. Washington, DC: Congressional Research Service. CRS Report for Congress.
Truman, David B. 1951. The Governmental Process: Political Interests and Public Opinion. New York: Alfred A. Knopf.
U.S. Census Bureau. 2014. “North American Industry Classification System (NAICS).” www.census.gov/eos/www/naics/ (Accessed June 23, 2015).
Waltz, Kenneth N. 1979. Theory of International Politics. New York: McGraw-Hill.

Weil, Gordon Lee. 1970. The Benelux Nations: The Politics of Small-Country Democracies. New York: Holt, Rinehart & Winston.
Appendix A: Congressional Research Codes that Identified Foreign Policy Bills The following is a list of the CRS codes that we use to identify foreign policy bills, placed into the categories and subcategories that we employ to make finer distinctions between the different foreign policy issue areas.
INTERNATIONAL POLITICAL ECONOMY
Finance Foreign and international banking (157) Foreign and international corporations (238) Foreign loans and debt (162) International finance (3539) International monetary system and foreign exchange (123)
Trade and Investment Competitiveness, trade promotion, trade deficits (315) Foreign trade and international finance (1448) Free trade and trade barriers (229) Export-Import Bank of the United States (210) International exchange and broadcasting (158) Office of the U.S. Trade Representative (309) Overseas Private Investment Corporation (OPIC) (38) Trade (14285) Trade adjustment assistance (425) Trade agreements and negotiations (282) Trade restrictions (559) Normal trade relations, most-favored-nation treatment (48) Tariffs (1377) U.S. and foreign investments (260) U.S. International Trade Commission (143)
Aid Foreign aid (3524) Foreign aid and international relief (768) Multilateral development programs (135) Reconstruction and stabilization (77) U.S. Agency for International Development (USAID) (98)

SECURITY
Arms Control Arms Control and Disarmament Agency (79) Arms control and nonproliferation (346)
Human Rights Human rights (3586) War crimes, genocide, crimes against humanity (201)
Other Collective security (217) Conflicts and wars (491) Sanctions (346)
OTHER Buy American requirements (205) Department of State (996) General foreign operations matters (17) House Committee on Foreign Affairs (30) Internal Revenue Service (IRS) (177) International law and treaties (485) Peace Corps (262) Rule of law and government transparency (223) Senate Committee on Foreign Relations (16) Sovereignty, recognition, national governance and status (326) U.S. Institute of Peace (41)
OMNIBUS CODES Foreign policy (11818) International affairs (14481) International organizations and cooperation (849)

Appendix Table A.1. Yearly Cross-Section Models of Foreign Policy Lobbying Expenditures
Variable Employees (in thousands)
2007 $493.7**
2008 $724.4**
2009 $1,482**
2010 $1,158**
-111.4 -183.8 -294.1 -385.2
Earnings Before Interest and Taxes 12.69** -3.11
7.883* -3.822
18.44* -7.558
13.62* -5.575
Ranking of Firm’s Sales in Sector -216.0* -125.6 -428.5* -323.3* -85.38 -69.39 -173.2 -161.3
Concentration of Firms in Sector -3,418 -10,055 64,760 -83,517 -46,246 -83,353 -201,614 -128,230
Interaction of Sales Ranking X -611.2* -282.3 -1,242* -868.6 Concentration of Firms -267 -212.6 -529.7 -497.3
Tobin’s Q -0.105 0.258* 0.164 0.272 -0.393 -0.111 -0.197 -0.233
Constant -11,541 14,518 -5,618 -39,965 -15,487 -29,337 -72,609 -46,789
Sector Fixed Effects included included included included
Observations 7,579 7,306 7,030 5,919 R-squared 0.20 0.13 0.16 0.06 Note: Table entries are least squares regression coefficients, with standard errors below. All models include fixed effects for 23 industrial sectors. * indicates p<.05 in a two-tailed test, ** indicates p<.01 in a two-tailed test.

Appendix Table A.2. Explaining Any Foreign Policy Lobbying Activity, then Amount of Spending Variable Logit Predicting Any
Lobbying Activity OLS Predicting
Spending by Firms That Lobby
Employees (in thousands) $0.01** $1,115** 0.00 -212.70
Earnings Before Interest and Taxes (in $ millions) 4.21e-05** 15.33**
0.00 -5.58
Ranking of Firm’s Sales within Sector 0.00 -1,503* 0.00 -742.30
Concentration of Firms within Sector -1.91 -437,160
-1.78 -704,689
Interaction of Sales Ranking X Concentration of Firms 0.01 -3,821
-0.01 -2,344
Tobin’s Q 0.00 802.1 0.00 -451.80
Constant -1.92** -73,542
-0.71 -260,532 Sector Fixed Effects included included
Observations 27,834 2,326 R-squared 0.26 0.11
Note: Table entries are logit or OLS regression coefficients, with standard errors clustered at the firm level below. The model includes fixed effects for 23 industrial sectors. * indicates p<.05 in a two-tailed test, ** indicates p<.01 in a two- tailed test.

Appendix Table A.3. Heckman’s Selection Model of Foreign Policy Lobbying Variable Selection Stage
(explaining whether a firm lobbies at all)
Second Stage (predicting lobbying
amount) Employees (in thousands) 0.005** 920.9**
-0.0009 -188.4
Earnings Before Interest and Taxes (in $ millions) 2.77e-05** 13.04** -7.61E-06 -5.75
Ranking of Firm’s Sales within Sector -0.0015 -1,353**
-0.0009 -671.3
Concentration of Firms within Sector -1.359 -244,031 -1.083 -559,079
Interaction of Sales Ranking X Concentration of Firms
0.0017 -0.003
-4,003* 671.3
Tobin’s Q -0.0008 873.1* -0.0009 -496.2
Constant -1.407** 148,745
-0.421 -235,674
Sector Fixed Effects included included
Observations 27,834 2,326
Note: Table entries are logit or OLS regression coefficients, with standard errors clustered at the firm level below. The selection model includes fixed effects for 23 industrial sectors, and the second stage model includes 19 fixed effects, omitting four industry fixed effects that determined whether or not a firm lobbies, but not how much it spends. * indicates p<.05 in a two-tailed test, ** indicates p<.01 in a two-tailed test.