local and firm level influences on innovation performance. jim love. erc understanding small...
TRANSCRIPT

Local and firm-level influences on innovation performance
Stephen Roper, Jim Love and Karen Bonner
Enterprise Research Centre, Warwick Business School and Aston Business School
Background
Change in policy landscape in England:
• Focus of local economic development ( and enterprise) moving from RDAs to LEPs
• Renewed interest in how local business eco-system influences firms’ innovation performance
• How ‘local’ is a business eco-system? Does the spread of local influences vary for large and small firms?
Contribution
• Re-evaluate the impact of local economic environment on innovation: – Skills, occupational structure, perceived barriers to innovation
• Examine the role of firm search and knowledge acquisition – Interactive and non-interactive knowledge search
• Externality (i.e. ‘spillover’) effect of firm search behaviour – Potentially complex effects - spillovers vs. competition effects
• Does this differ at LEP and Local Authority level? – does spatial scale matter?

Local Enterprise Partnerships

Why do innovation eco-systems matter?
• Location still matters even in a globally connected world
• Knowledge has a spatial dimension:
– Some areas are more ‘knowledge rich’ than others – greater pool of
knowledge firms can draw on
– Reflects the range of institutions present as well as nature and extent of inter-connectedness of firms • Evidence that e.g. network density and structure is important in
encouraging innovation at firm level

How do firms draw on their eco-systems?
Few firms innovate entirely from own internal (e.g. R&D) resources
Firms have a choice of how to access external knowledge
• Interactive Search
– Involves strategic intent and mutual engagement of parties – co-operative relationships
• Non-interactive search
– Non-reciprocal e.g. imitation, copying, reverse engineering, codification of public knowledge etc.
• Each has different costs and benefits, but likely to be complementary
Externalities of openness
Externalities arising not from the quasi-public good nature of local knowledge but from the open innovation process:
• the more widespread is the adoption of ‘openness’ in innovation the
greater will be the potential for knowledge diffusion through unplanned and/or informal, unpriced mechanisms
• 3 possible mechanisms: knowledge diffusion or ‘buzz’ effects in dense networks; imitation or demonstration; competition effects
• Roper et al (2013) find evidence of such externalities in Ireland
Empirical approach
Estimate modified innovation production function
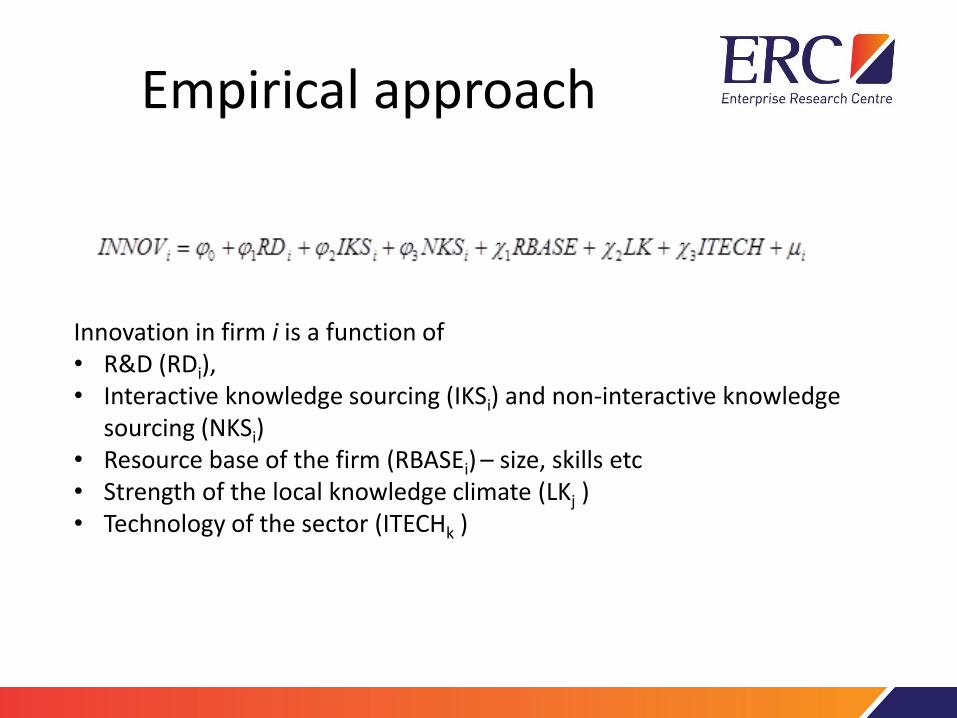
Innovation in firm i is a function of • R&D (RDi), • Interactive knowledge sourcing (IKSi) and non-interactive knowledge
sourcing (NKSi) • Resource base of the firm (RBASEi) – size, skills etc • Strength of the local knowledge climate (LKj ) • Technology of the sector (ITECHk )

Data
• UK Innovation Survey (UKIS).
• We use pooled data from waves four to seven of the UKIS, covering the periods 2002-04, 2004-06, 2006-08 and 2008-10
• Matched to data at both LEP and Local Authority District (LAD) level on: local occupational mix, labour quality, and the perceived barriers to innovation.
• Dependent variables: – Proportion of new products in total sales
– (log) of firms' sales of products or services newly introduced during the previous three years
Data (contd.)
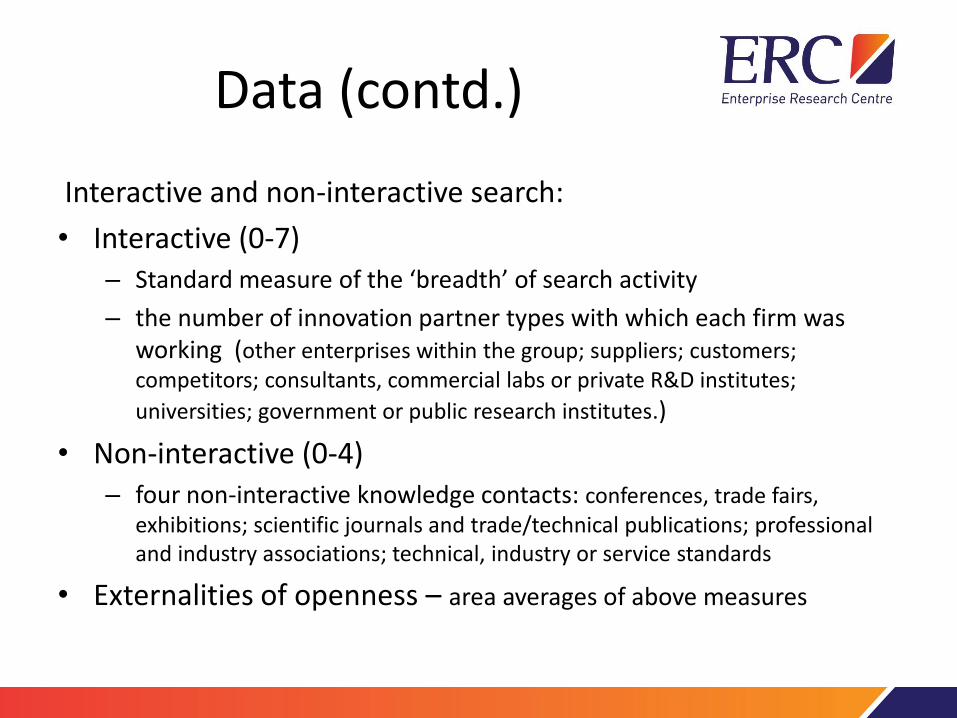
Interactive and non-interactive search:
• Interactive (0-7) – Standard measure of the ‘breadth’ of search activity
– the number of innovation partner types with which each firm was working (other enterprises within the group; suppliers; customers; competitors; consultants, commercial labs or private R&D institutes;
universities; government or public research institutes.)
• Non-interactive (0-4) – four non-interactive knowledge contacts: conferences, trade fairs,
exhibitions; scientific journals and trade/technical publications; professional and industry associations; technical, industry or service standards
• Externalities of openness – area averages of above measures
(1)
VARIABLES All
Employment (Log) -3.789***
(0.474)
R&D Investment 30.94***
(1.403)
Design investment 17.50***
(1.331)
Science Graduates 0.0986***
(0.0369)
Other Graduates 0.144***
(0.0315)
Exporter 5.796***
(1.384)
Interactive search 13.60***
(1.112)
Interactive search sqrd. -1.440***
(0.184)
Non-interactive search 14.28***
(1.468)
Non-interactive search sqrd. -2.828***
(0.379)
LEA SOC 7-9 0.340*
(0.198)
LEA NVQ3+ 0.219
(0.193)
LEA interactive 11.55*
(6.732)
LEA non-interactive -6.039
(8.417)
LEA barriers (avg.) -3.129
(2.997)
Constant -21.60
(26.00)
Observations 30,337
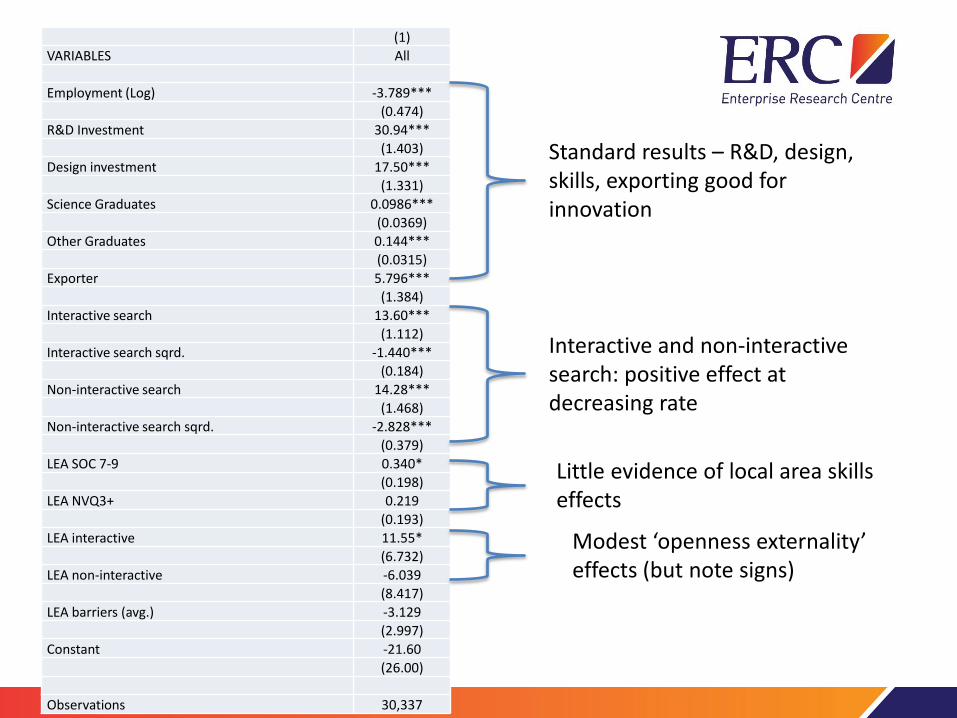
Standard results – R&D, design, skills, exporting good for innovation
Interactive and non-interactive search: positive effect at decreasing rate
Little evidence of local area skills effects
Modest ‘openness externality’ effects (but note signs)
Standard results – R&D, design, skills, exporting good for innovation
Interactive and non-interactive search: positive effect at decreasing rate
Little evidence of local area skills effects
Modest ‘openness externality’ effects (but note signs)
(1) (4) (5) (6)
VARIABLES All Small Medium Large
Employment (Log) -3.789*** -7.068*** -0.362 -0.0886
(0.474) (1.610) (1.424) (0.0737)
R&D Investment 30.94*** 33.58*** 21.55*** 18.77***
(1.403) (1.783) (1.806) (0.404)
Design investment 17.50*** 19.25*** 12.90*** 10.91***
(1.331) (1.742) (1.647) (0.368)
Science Graduates 0.0986*** 0.0919** 0.0878* 0.156***
(0.0369) (0.0457) (0.0472) (0.00978)
Other Graduates 0.144*** 0.154*** 0.0822* 0.0888***
(0.0315) (0.0392) (0.0443) (0.00733)
Exporter 5.796*** 5.840*** 7.056*** 1.392***
(1.384) (1.764) (1.785) (0.398)
Interactive search 13.60*** 15.14*** 9.058*** 7.691***
(1.112) (1.464) (1.125) (0.0997)
Interactive search sqrd. -1.440*** -1.618*** -0.942*** -0.688***
(0.184) (0.243) (0.194) (0.0150)
Non-interactive search 14.28*** 15.59*** 10.71*** 6.250***
(1.468) (1.922) (1.603) (0.147)
Non-interactive search sqrd. -2.828*** -3.109*** -2.116*** -0.926***
(0.379) (0.506) (0.416) (0.0354)
LEA SOC 7-9 0.340* 0.405 0.195 0.312***
(0.198) (0.252) (0.234) (0.0177)
LEA NVQ3+ 0.219 0.181 0.319 0.422***
(0.193) (0.242) (0.223) (0.00987)
LEA interactive 11.55* 12.38 7.132 5.881***
(6.732) (8.592) (7.260) (0.764)
LEA non-interactive -6.039 -5.731 -6.249 -5.850***
(8.417) (10.67) (9.670) (0.489)
LEA barriers (avg.) -3.129 -5.117 3.866 -2.429***
(2.997) (3.811) (3.530) (0.200)
Constant -21.60 -11.84 -45.79* -198.3***
(26.00) (31.40) (24.13) (0.483)
Observations 30,337 15,850 7,515 6,972
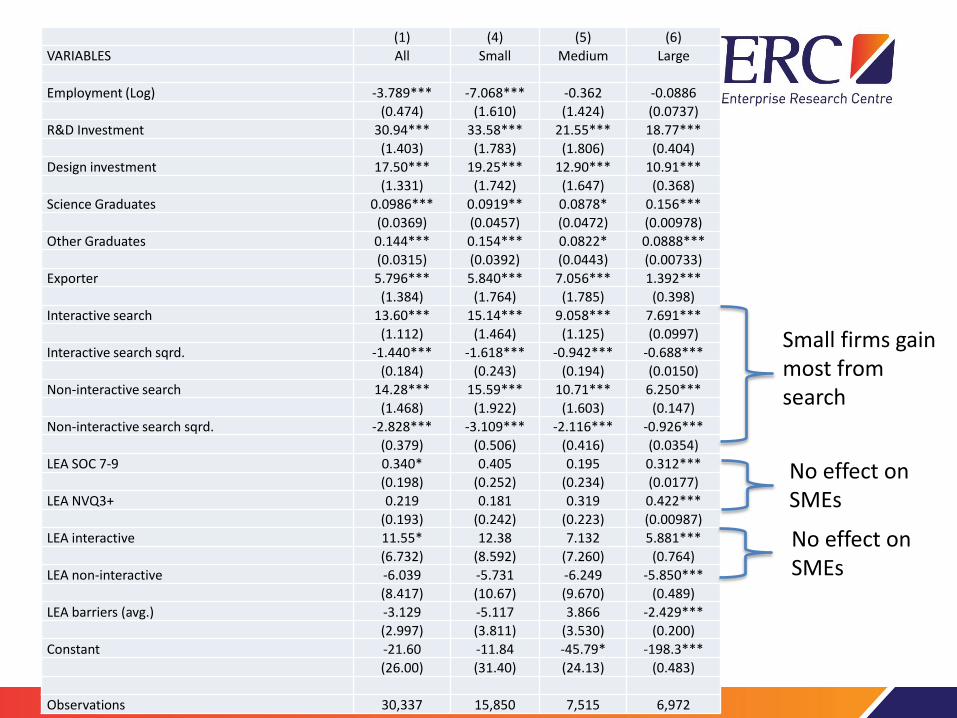
Small firms gain most from search
No effect on SMEs
No effect on SMEs
Small firms gain most from search
No effect on SMEs
No effect on SMEs
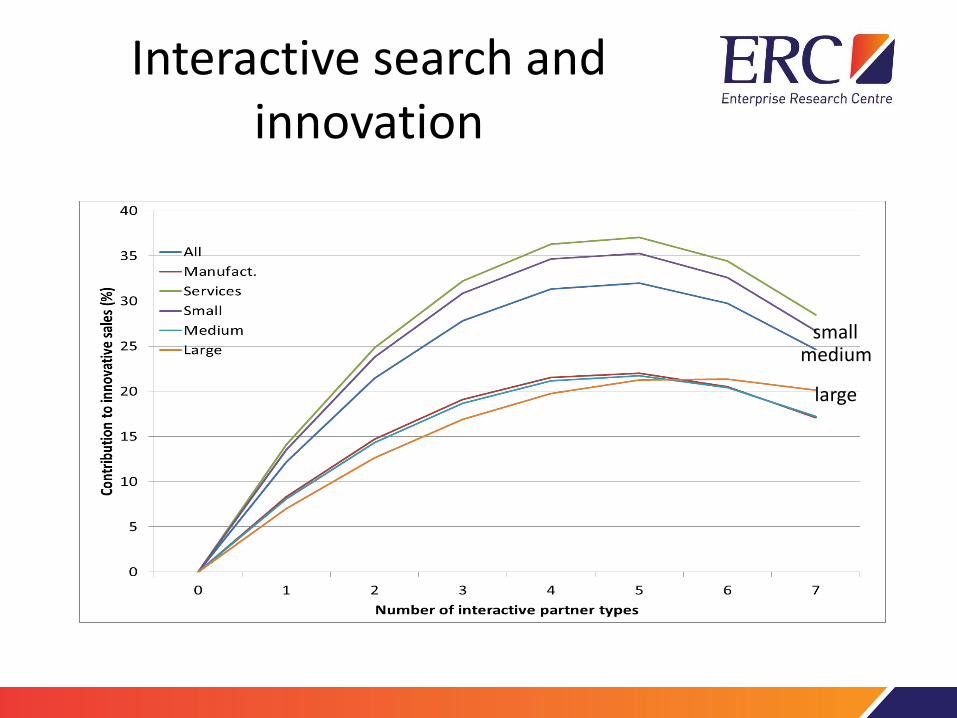
Interactive search and innovation
small medium
large
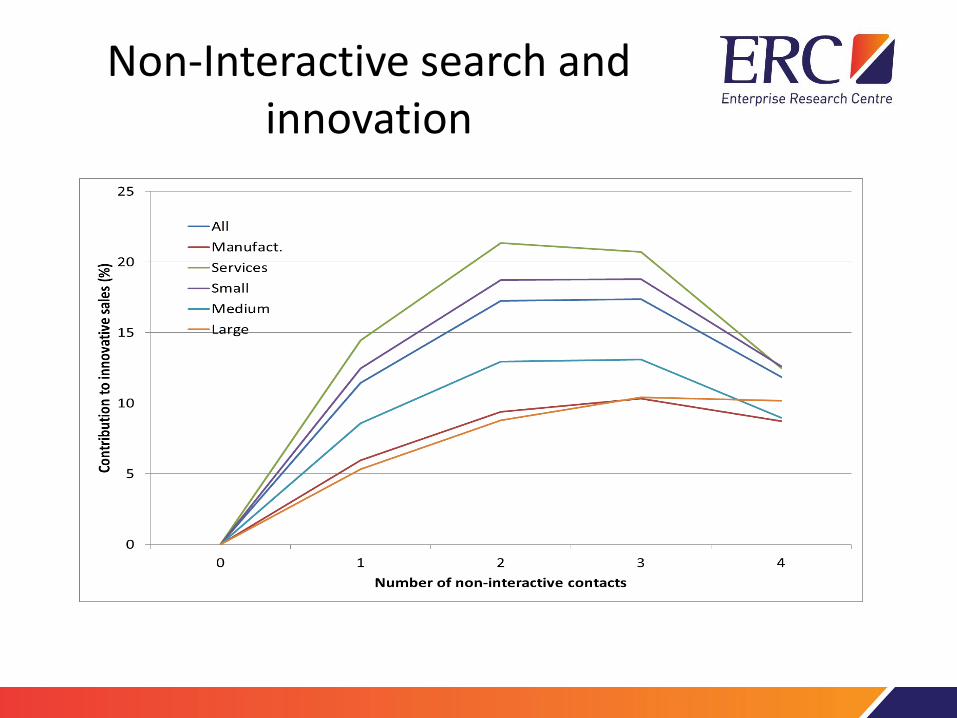
Non-Interactive search and innovation

Does size of local area matter?
General pattern of results unchanged.
Slight differences in results at Local Authority level on externalities of openness:
• Positive effect of interactive search externality stronger at LA level
• Externalities of openness affect small as well as large firms at LA level
Still no evidence of eco-system effects on SME innovation
Summary and conclusions
• Strong effects of interactive and non-interactive knowledge sourcing – but subject to diminishing returns
• For most firms, level of such activity below (private) optimum
• Little effect of local eco-system on innovation on SMEs – Improving skills will make little difference
– Firms not disadvantaged by being in low-skills areas
• Strong positive externality of interactive knowledge sourcing – Potential role for policy intervention?
• Strong negative externality of non-interactive k sourcing – Suggests social costs in areas high in copying, imitation etc.