local and global influences on protein turnover in neurons
TRANSCRIPT

*For correspondence:
(JDL);
(EMS)
Competing interests: The
authors declare that no
competing interests exist.
Funding: See page 20
Received: 12 December 2017
Accepted: 19 May 2018
Published: 19 June 2018
Reviewing editor: Moses V
Chao, New York University
Langone Medical Center, United
States
Copyright Dorrbaum et al.
This article is distributed under
the terms of the Creative
Commons Attribution License,
which permits unrestricted use
and redistribution provided that
the original author and source are
credited.
Local and global influences on proteinturnover in neurons and gliaAline R Dorrbaum1,2, Lisa Kochen1, Julian D Langer1,3*, Erin M Schuman1*
1Max Planck Institute for Brain Research, Frankfurt, Germany; 2Faculty of BiologicalSciences, Goethe University Frankfurt, Frankfurt, Germany; 3Max Planck Institute ofBiophysics, Frankfurt, Germany
Abstract Regulation of protein turnover allows cells to react to their environment and maintain
homeostasis. Proteins can show different turnover rates in different tissue, but little is known about
protein turnover in different brain cell types. We used dynamic SILAC to determine half-lives of
over 5100 proteins in rat primary hippocampal cultures as well as in neuron-enriched and glia-
enriched cultures ranging from <1 to >20 days. In contrast to synaptic proteins, membrane
proteins were relatively shorter-lived and mitochondrial proteins were longer-lived compared to
the population. Half-lives also correlate with protein functions and the dynamics of the complexes
they are incorporated in. Proteins in glia possessed shorter half-lives than the same proteins in
neurons. The presence of glia sped up or slowed down the turnover of neuronal proteins. Our
results demonstrate that both the cell-type of origin as well as the nature of the extracellular
environment have potent influences on protein turnover.
DOI: https://doi.org/10.7554/eLife.34202.001
IntroductionProteins, the fundamental units of all cells, exhibit dynamics in their expression levels in response to
intracellular and extracellular signals. Protein turnover, measured in cells, is the net result of protein
synthesis and degradation. Under steady-state conditions, proteins are continuously turned over
(Boisvert et al., 2012; Cambridge et al., 2011; Cohen et al., 2013; Price et al., 2010). Protein
turnover allows for the removal of damaged proteins and their replacement by new proteins. In
addition, continuous protein turnover is required and exploited to enable cells to dynamically adjust
their proteome according to internal and external perturbations and signals. Turnover rates have
likely been optimized during evolution such that individual proteins possess a life time that repre-
sents the balance between energy-saving stability and dynamic flexibility. In the brain, proteome
remodeling using protein synthesis and degradation is required for learning and memory formation
(Sutton and Schuman, 2006). In addition, several forms of synaptic plasticity studied in vitro also
require protein synthesis and protein degradation (Ehlers, 2003; Kang and Schuman, 1996;
Rosenberg et al., 2014; Schanzenbacher et al., 2016). During homeostatic scaling of cultured hip-
pocampal neurons, for example, specific sets of proteins show increased or decreased protein syn-
thesis associated with the up- or downscaling of synapses (Schanzenbacher et al., 2018;
Schanzenbacher et al., 2016). The turnover of brain proteins has been measured both in vivo and in
vitro. Price et al. (2010) used in vivo metabolic 15N-labelling and the subsequent mass spectromet-
ric analysis of whole brain homogenates to derive the turnover rates for 1010 proteins (average half-
life =~9 days) in the mouse brain. Another study used in vitro metabolic labeling of primary cortical
cultures to measure relatively shorter half-lives for 2802 brain proteins (average half-life =~5 days;
(Cohen et al., 2013)). In both of these studies, however, average half-lives were obtained using
mixed cell populations including multiple neuronal and glial cell types. It is known that proteins can
show very different turnover rates in different tissues (Price et al., 2010) or different cell types
Dorrbaum et al. eLife 2018;7:e34202. DOI: https://doi.org/10.7554/eLife.34202 1 of 24
RESEARCH ARTICLE

(Mathieson et al., 2018) of the same organism, but little is known about protein turnover rates in
different cell types of the brain.
To address these issues, we used a dynamic SILAC approach to determine protein half-lives in pri-
mary hippocampal cultures (containing a mixture
of neurons and glia cells), as well as in neuron-
enriched and glia-enriched cultures. Our results
demonstrate that both the cell-type of origin as
well as the nature of the extracellular environ-
ment have potent influences on protein turnover.
In neurons, protein turnover rates are related to
a protein’s function as well as the intracellular
environment and protein interactions.
Results
Determination of protein half-livesin primary hippocampal culturesTo determine protein half-lives, we used a
dynamic stable isotope labeling with amino acids
in cell culture (SILAC) approach in combination
with LC-MS/MS analysis using mature primary
hippocampal cultures (containing both neurons
and glia, the latter of which do not undergo cell
division, owing to the confluence and maturity of
the cultures, see Materials and methods and Fig-
ure 6—figure supplement 5). Mature primary
neuronal and glial cultures mimic the physiology
of cells in-vivo and are an important system to
study the molecular and cellular mechanisms
that underlie the physiological and pathophysio-
logical function of neuronal networks. Cultured
hippocampal cells were maintained for 18–19
days in growth medium containing natural ‘light’
arginine and lysine, then the medium was
exchanged to one containing ‘heavy’ isotopically
labelled arginine and lysine (Figure 1A). To
reduce cellular stress (see
Materials and methods), we retained a small
amount of the ‘light’ medium and an excess of
‘heavy’ medium was added, yielding a final 4:1
ratio of heavy to light amino acids. Note that fol-
lowing the medium switch, mostly ‘heavy’ argi-
nine and lysine are incorporated into nascent
proteins while the fraction of ‘light’ proteins
decays over time. The cells were allowed to
incorporate the ‘heavy’ amino acids for 1, 3 or 7
days before they were harvested, lysed and pre-
pared for MS analyses (Figure 1A). An additional
sample was harvested just before the medium
change at t = 0. For all identified peptides, the
fraction of heavy and light peptide signal was
quantified by MS at each time point (see pep-
tide.txt uploaded to PRIDE). As the medium con-
tained residual ‘light’ amino acids, we developed
a correction factor for each peptide using the
Fra
ction o
f “lig
ht”
or
“heavy”
pro
tein
s
Time
18-19 DIV
“Heavy”“Light”
1d 3d 7d
Mass spectrometric analysis
Half-life estimation
t0
Medium
composition
A
B
Harvest
0
200
400
600
800
1 2 3 4 5 6 7 8 910
11
12
13
14
15
16
17
18
19
20
>2
0
# o
f pro
tein
gro
ups
Protein half-life [days]
Figure 1. Protein turnover in neurons. (A) Protein half-
lives were determined by a dynamic SILAC approach in
combination with MS. Cells were grown for 18–19 days
in medium containing natural amino acids (‘light’) and
then switched to a medium containing heavy
isotopically labelled arginine (R10) and lysine (K8).
Upon the medium change, the ‘heavy’ amino acids
were incorporated into newly synthesized proteins,
whereas the fraction of ‘light’ pre-existing proteins
decayed over time. The cells were harvested 1, 3 and 7
days after the medium change as well as just before
the medium change (t0) and the fractions of newly
synthesized proteins and pre-existing proteins were
determined by MS. Protein half-lives were determined
based on first order exponential fitting of the fraction
of pre-existing proteins over time. (B) Distribution of
protein half-lives in primary hippocampal cultures
ranged from <1 day to >20 days.
DOI: https://doi.org/10.7554/eLife.34202.002
The following figure supplements are available for
figure 1:
Figure supplement 1. Data processing workflow of
dynamic SILAC samples.
DOI: https://doi.org/10.7554/eLife.34202.003
Figure supplement 2. Accuracy of turnover estimation.
DOI: https://doi.org/10.7554/eLife.34202.004
Figure supplement 3. Comparison to in vivo study.
DOI: https://doi.org/10.7554/eLife.34202.005
Figure supplement 4. Protein decay clusters.
DOI: https://doi.org/10.7554/eLife.34202.006
Dorrbaum et al. eLife 2018;7:e34202. DOI: https://doi.org/10.7554/eLife.34202 2 of 24
Research article Cell Biology Neuroscience

probability of the incorporation of a ‘light’ amino acid into a nascent protein from peptides contain-
ing two arginines or lysines due to a missed tryptic cleavage site (Figure 1—figure supplement 1;
see Materials and methods). Using the above approach, we determined the protein half-lives of
3610 protein groups, using a first order exponential fit of the pre-existing protein levels over time
(Figure 1A,B; Supplementary file 1). The proteins we analyzed exhibited a range of half-lives
from <1 day to >20 days; the median half-life was 5.4 days. For extremely short-lived proteins,
where the data could not be accurately fit by an exponential decay curve, we assigned a half–life
of <1 day. The distribution of protein half-lives, shown in Figure 1B, is right skewed, reflecting a
long-tail of proteins with longer than average half-lives. To assess the quality of the dataset and the
accuracy of the protein half-lives, we computed the standard error (SE) of the rate constant as well
as the coefficient of determination (R2) of the fit for each protein (Figure 1—figure supplement 2A,
D and Supplementary file 1). Across the complete set of protein half-lives in mixed cultures, we
obtained a mean SE of the rate constant of ~0.007 and a median R2 of 0.96 demonstrating an accu-
rate determination of protein half-lives.
Validation of protein half-livesTo validate the half-lives obtained with our MS analysis, we used a different pulsed metabolic label-
ling technique, FUNCAT-PLA, that allows in situ visualization of newly synthesized proteins-of-inter-
est using non-canonical amino acids like azidohomoalanine (AHA) and antibodies (tom Dieck et al.,
2015). Extracellularly applied AHA crosses cell membranes and gets charged by endogenous
methionyl tRNA synthetases and incorporated into nascent proteins (Dieterich et al., 2006). For this
analysis, we chose four proteins (Bassoon, TrkB, GM130 and LaminB1) which exhibit different cellular
functions and half-lives ranging from ~3 days to ~11 days based on our MS analyses. To analyze the
half-lives of these proteins, a pulse of the non-canonical amino acid AHA was delivered for 2 hr to
hippocampal cultures (DIV 18). Then, at variable intervals (a.k.a. chase), the pool of pulse AHA-
labelled Bassoon, TrkB, GM130 or LaminB1 was tagged and visualized (Figure 2A and tom Dieck
et al., 2015). Previous studies demonstrated that 2 hr AHA incorporation is not toxic to cells and
does not affect global protein synthesis or degradation rates (Dieterich et al., 2006). In these
experiments we labelled GM130 or LaminB1 and also used data obtained for TrkB and Bassoon
from tom Dieck et al., 2015 using identical labeling and tagging conditions. For both GM130 and
LaminB1, proteins associated with Golgi and nuclear function, respectively, a decrement in the num-
ber of labelled puncta was observed over days, yielding measured half-lives of 1.9 and 4.4 days,
respectively (Figure 2B, Figure 2—source data 1). For all four proteins examined, the half-lives
obtained by the FUNCAT-PLA analysis were well-correlated with the half-lives obtained with MS
(Pearson correlation = 0.983; Figure 2C). We noted, however, that the half-lives obtained with FUN-
CAT-PLA were systematically shorter. This could be owing to a reduced stability of the AHA-contain-
ing proteins or the azide group used for tagging or other factors, as discussed below.
Protein localization and functionWe next examined the relationship between a protein’s half-life and its location and/or function in
cells. We calculated the half-lives for proteins that reside in cytoplasm, nucleus or plasma membrane,
as well as in many different organelles (Figure 3—source data 1). As shown in Figure 3A, many
groups exhibited a wide range of protein half-lives that were not significantly different from the pop-
ulation average. An exception to this were proteins associated with the nucleus as well as several
groups of membrane proteins, including those associated with the plasma membrane, the Golgi
apparatus membrane and the ER membrane which all exhibited a shorter than average half-life.
Mitochondrial proteins also deviated from the population average: they exhibited significantly lon-
ger half-lives than all other groups. This was a counter-intuitive observation given the exposure of
mitochondrial proteins to elevated levels of reactive oxygen species (Adam-Vizi and Chinopoulos,
2006). Lastly, despite their remote location within axonal and dendritic arbors, we found that synap-
tic proteins as a group do not exhibit significantly different half-lives from the population (Figure 4—
source data 1; see below and Figure 4 for more discussion of individual synaptic protein half-lives).
We next grouped proteins by their half-lives, ascending from less than 3 days to greater than 14
days and performed a Gene Ontology (GO) analysis. We found that proteins associated with distinct
cellular components (B) or molecular functions and biological processes (C) were significantly over-
Dorrbaum et al. eLife 2018;7:e34202. DOI: https://doi.org/10.7554/eLife.34202 3 of 24
Research article Cell Biology Neuroscience

represented (p<0.05, Bonferroni corrected) in certain half-live groups (Figure 3—source data 2).
For example, receptors, signaling molecules, cell adhesion molecules, and proteins involved in stimu-
lus response and cell communication were over-represented in the segment of comparably short-
lived (<3 days) proteins. Ribosomal proteins were enriched in a group with relatively long half-lives
(6–11 days). Amongst the most long-lived (12–15 days) groups we found a significant over-represen-
tation of proteins involved in energy metabolism. In this long-lived group there was also an over-
representation of histones and nuclear pore proteins, consistent with previous reports (Savas et al.,
2012; Toyama et al., 2013). We analyzed in greater detail the proteins that inhabit the presynaptic
and postsynaptic compartments. As mentioned above, synaptic protein show a wide range of
A GM130
C
Half-life MS
0 2 4 6 8 10 12
Ch
ase
Met
Ctr
l
0 1 2 3 NC
0
5
10
15
0 1 3 7 NC
0
20
40
60
80
100
120
15
LaminB1: t1/2 = 4.4 d
Puncta
num
ber
per
neuro
n
Chase period [days]
0
0
5
10
100
80
60
40
20
0 1 2 3 Met
0 1 3 7 Met
B
120
GM130: t1/2 = 1.9 d
2h A
HA
puls
e
0 2 4 6 8 10 12
0
1
2
3
4
5
6 r = 0.983
0
4
3
2
1
5
6
Half-life F
UN
CA
T-P
LA
GM130
TrkB
Bassoon
LaminB1
LaminB1
New protein
MAP2
DAPI
2d
3d
3d
7d
1d1d
Figure 2. Validation of mass spectrometry results with metabolic labeling and visualization. Protein half-lives were
determined by FUNCAT-PLA for GM130 and LaminB1. Degradation of newly synthesized proteins (following a 2 hr
AHA pulse) was monitored for 0 (no chase), 1, 2 and 3 days for GM130 and for 0, 1, 3 and 7 days for LaminB1. (A)
Representative images of neurons with newly synthesized LaminB1 and GM130 as indicated (green), cell body and
dendrites (MAP2, red), nuclei (DAPI, blue). Puncta were dilated for visualization purposes only. Scale bar = 10 mm.
(B) Group analysis of experiments shown in A. Puncta number per neuron is shown for individual cells (grey dots)
as well as the mean (black line). Protein half-life was determined based on exponential fitting of the mean puncta
number per cell. (C) Protein half-lives measured by FUNCAT-PLA and MS exhibit a high and significant correlation
(Pearson correlation (r) = 0.983); data for TrkB and Bassoon were obtained from tom Dieck et al., 2015.
DOI: https://doi.org/10.7554/eLife.34202.007
The following source data is available for figure 2:
Source data 1. FUNCAT-PLA results.
DOI: https://doi.org/10.7554/eLife.34202.008
Dorrbaum et al. eLife 2018;7:e34202. DOI: https://doi.org/10.7554/eLife.34202 4 of 24
Research article Cell Biology Neuroscience

Figure 3. Half-lives of proteins with different cellular locations and functions. (A) Half-life distribution of proteins in different cellular compartments
(LocTree annotation; score �50) and of synaptic proteins (extracted based on UniProt GO annotation). Number of protein groups assigned to each
compartment is given in brackets. Mitochondrial proteins are significantly longer-lived compared to the complete set of quantified half-lives. Except in
mitochondria, membrane proteins tend to be shorter-lived compared to soluble proteins in each compartment. Selected GO terms for cellular
component (B) as well as biological process, molecular function and Panther protein class (C) that are over-represented (p-value<0.05) in distinct half-
life segments. The complete set of over-represented GO terms and the full name of abbreviated GO terms (marked with *) are given in Figure 3—
source data 2.
DOI: https://doi.org/10.7554/eLife.34202.009
The following source data and figure supplement are available for figure 3:
Source data 1. Half-lives of proteins at different sub-cellular localizations.
DOI: https://doi.org/10.7554/eLife.34202.011
Source data 2. GO analysis of half-life segments.
DOI: https://doi.org/10.7554/eLife.34202.012
Figure supplement 1. N-terminal sequence analysis.
DOI: https://doi.org/10.7554/eLife.34202.010
Dorrbaum et al. eLife 2018;7:e34202. DOI: https://doi.org/10.7554/eLife.34202 5 of 24
Research article Cell Biology Neuroscience
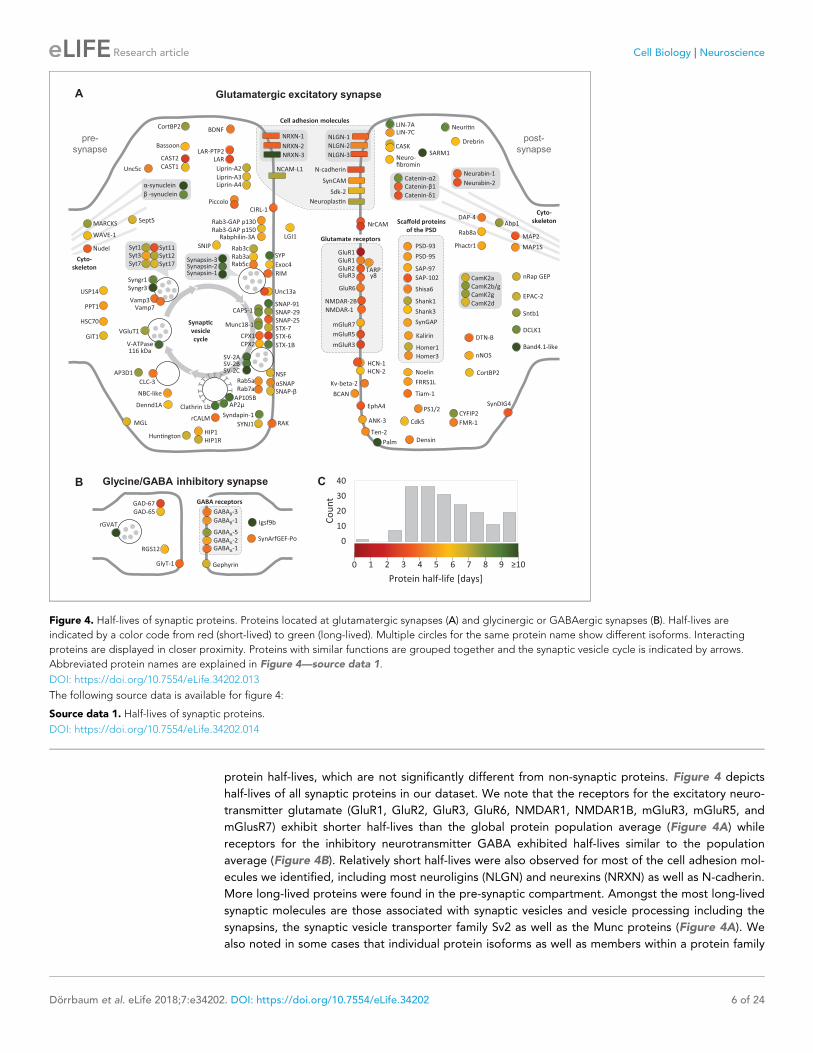
protein half-lives, which are not significantly different from non-synaptic proteins. Figure 4 depicts
half-lives of all synaptic proteins in our dataset. We note that the receptors for the excitatory neuro-
transmitter glutamate (GluR1, GluR2, GluR3, GluR6, NMDAR1, NMDAR1B, mGluR3, mGluR5, and
mGlusR7) exhibit shorter half-lives than the global protein population average (Figure 4A) while
receptors for the inhibitory neurotransmitter GABA exhibited half-lives similar to the population
average (Figure 4B). Relatively short half-lives were also observed for most of the cell adhesion mol-
ecules we identified, including most neuroligins (NLGN) and neurexins (NRXN) as well as N-cadherin.
More long-lived proteins were found in the pre-synaptic compartment. Amongst the most long-lived
synaptic molecules are those associated with synaptic vesicles and vesicle processing including the
synapsins, the synaptic vesicle transporter family Sv2 as well as the Munc proteins (Figure 4A). We
also noted in some cases that individual protein isoforms as well as members within a protein family
Syt17
Glutamatergic excitatory synapse
Clathrin Lb
AP105B
Syt1
Vamp3
Rab3a
RIM
Unc13a
Vamp7
Protein half-life [days]
1 2 3 4 5 6 7 8 9 ≥100
Syt3
Syt7
Syt11
Syt12
T
TCLC-3
Rabphilin-3A
Rab3-GAP p130
Rab3-GAP p150
NLGN-1NRXN-1
NRXN-2
NRXN-3
NLGN-2
NLGN-3
NrCAM
PSD-95
SAP-97
SAP-102
DAP-4
GluR2
GluR1
GluR1
GluR3TARP
γ8
Homer1
Shank1
Shank3
Homer3
VGluT1
Shisa6
SYP
Synapsin-1
Synapsin-3Synapsin-2
NSF
αSNAP
SNAP-25
STX-1BCPX2
CPX1
SV-2A
SV-2CSV-2B
Piccolo
Bassoon
SynCAM
N-cadherin
CAST2
CAST1
Dennd1A
CAPS-1
HCN-1
HCN-2
Glycine/GABA inhibitory synapse
GABAA-5
GABAA-2GABAA-1
GABAB-1
GABAB-3
rGVAT
GAD-67
GAD-65
Gephyrin
SynArfGEF-Po
Exoc4
mGluR5
NMDAR-2B
NMDAR-1
mGluR7
mGluR3
GluR6
ANK-3
BDNF
CASK
Neuro-fibromin
SARM1
SynGAP
FMR-1
Catenin-β1
Catenin-δ1
CYFIP2
Drebrin
DTN-B
nNOS
Neuroplas'n
Neuri'n
Ten-2
Tiam-1
WAVE-1
GIT1
FRRS1L
HSC70
Igsf9b
LGI1
Liprin-A3Liprin-A4
LIN-7A
Densin
MAP1S
MARCKS
MGL
Nudel
Noelin
Syndapin-1
Phactr1
rCALM
Liprin-A2Neurabin-1
Neurabin-2
PPT1
SynDIG4 PS1/2
LAR
nRap GEP
EPAC-2
RGS12
Sdk-2
GlyT-1
SNIP
CamK2a
CamK2b/g
CamK2g
CamK2d
pre-
synapse
post-
synapse
A
B
LAR-PTP2
EphA4
STX-6
SNAP-29
Rab7a
HIP1R
HIP1
SYNJ1
Rab8a
Rab5c
MAP2
Cdk5
V-ATPase 116 kDa
Rab5a
AP3D1
Hun'ngton
PSD-93
STX-7
Abp1
Syngr1
Syngr3
BCAN
SNAP-91
Munc18-1
AP2µ
Catenin-α2
NCAM-L1
Sept5
Kalirin
SNAP-β
Rab3c
CortBP2
CortBP2
DCLK1
Band4.1-like
Palm
CIRL-1
RAK
Kv-beta-2
NBC-like
Sntb1
Unc5c
USP14
0
10
20
30
40
Co
un
t
C
LIN-7C
Glutamate receptors
GABA receptors
Cyto-
skeleton
Synap!c
vesicle
cycle
α-synuclein
β -synuclein
Cyto-
skeleton
Scaffold proteins
of the PSD
Cell adhesion molecules
Figure 4. Half-lives of synaptic proteins. Proteins located at glutamatergic synapses (A) and glycinergic or GABAergic synapses (B). Half-lives are
indicated by a color code from red (short-lived) to green (long-lived). Multiple circles for the same protein name show different isoforms. Interacting
proteins are displayed in closer proximity. Proteins with similar functions are grouped together and the synaptic vesicle cycle is indicated by arrows.
Abbreviated protein names are explained in Figure 4—source data 1.
DOI: https://doi.org/10.7554/eLife.34202.013
The following source data is available for figure 4:
Source data 1. Half-lives of synaptic proteins.
DOI: https://doi.org/10.7554/eLife.34202.014
Dorrbaum et al. eLife 2018;7:e34202. DOI: https://doi.org/10.7554/eLife.34202 6 of 24
Research article Cell Biology Neuroscience

could exhibit very different half-lives, e.g. the synaptotagmins (Syt), the syntaxins (STX) and even
CamK2 subunits (Figure 4A).
Protein complex membersProteins are functionally defined by their interactions and many proteins form stable multi-protein
complexes to execute their cellular functions; these macromolecular complexes are now intensely
studied both structurally and functionally (Purdy et al., 2014; Wohlgemuth et al., 2015). As such,
we also investigated the half-lives of proteins in the context of the complexes they are associated
with. We examined 314 protein complexes (composed of >5 proteins) and found that on average,
proteins that are co-members of a complex have more similar half-lives than randomly selected pro-
teins (Figure 5A; Figure 5—source data 1). We determined whether the protein half-lives of com-
plex members are related to the size of the complex (in terms of number of protein constituents).
We found that the variability of protein half-lives within complexes does not correlate with the num-
ber of constituents in a complex (Figure 5—figure supplement 1).
We next asked if the half-lives of multi-protein complex constituents correlate with the assembly
and disassembly dynamics of the complexes. We analyzed in greater detail several protein com-
plexes with different assembly and disassembly dynamics, including the spliceosome, the ribosome,
the nuclear pore complex, and the ATP synthase (Figure 5B–E; Figure 5—source data 2). The spli-
ceosome is a highly dynamic complex that assembles for each splicing event and then disassembles
again afterwards. For the analysis of the spliceosome, we chose the human ‘B-complex’, the pre-cat-
alytic complex primed for activation, which had recently been described structurally (pdb 5O9Z;
Bertram et al., 2017). This structure contains 38 subunits, of which we detected 20 (Figure 5B,F).
We found that these proteins exhibit a mean turnover of ~4.7 days, which is faster than the global
population of proteins we measured. The ribosome and the ATP-synthase are thought to be more
static complexes. Ribosomal proteins are synthesized in the cytoplasm and subsequently assembled
into the large and small ribosomal subunits in the nucleus and nucleolus, where they interact with a
variety of ribosomal assembly proteins and ribosomal RNA (Pena et al., 2017), before they are
released back into the cytoplasm where they drive protein synthesis. Depending on the translational
activity, the small and large ribosomal subunits can associate and dissociate, but the subunits them-
selves are considered to be stable throughout their life-time. The ribosome comprises ~79 proteins,
47 in the large subunit and 32 in the small subunit. We analyzed our data using a cryo-EM structure
of the Sus scrofa ribosome (pdb 3J7R; Voorhees et al., 2014). We obtained half-lives for 70 of the
76 ribosomal proteins annotated in the structure, which exhibited a mean half-life of 7.8 days across
all subunits (Figure 5C,F). Especially short-lived ribosomal proteins included proteins associated
with both the large (e.g. Rpl21: 4.4 days) and small (e.g. Rps30: 4.0 days) subunits; we note that
these proteins have not been recognized for extra-ribosomal functions (Warner and McIntosh,
2009). The ATP synthase assembles in a step-wise manner. The membrane-embedded rotor as well
as the soluble stalk and head domains are produced and assembled independently, and full ATP syn-
thase assembly is a finely-tuned process dependent on the energy demand of the cell
(Kucharczyk et al., 2009). For the ATP synthase, we analyzed a recently published structure (pdb
5LQX; Vinothkumar et al., 2016) and detected 8 of the 12 ATP synthase proteins found in the struc-
ture (Figure 5E,F). The protein subunits exhibit a relatively limited range of half-lives with a mean
half-live of 11.2 days, with head and stalk subunits displaying more similar half-lives when compared
to the whole complex. The nuclear pore complex (NPC) is a huge membrane-spanning protein com-
plex that comprises static scaffold regions, intermediate adopter regions as well as highly dynamic
regions (Rabut et al., 2004). For analysis of the nuclear pore complex, we used a recent cryo-EM
structure of the eukaryotic NPC (Lin et al., 2016), which contains 19 distinct proteins. We detected
10 of these proteins and found that the observed half-lives correlate very well with previous observa-
tions of subunit stability (Figure 5D,F; Beck and Hurt, 2017). For example, the large structured
solenoid elements of the core and the CNC rings display similar half-lives and they are not predicted
to exchange once the complex has been assembled. In contrast, the protein Nup62 displayed the
shortest half-life of the observed NPC subunits. Nup62, as part of the Nup54/58/62 channel trimer
at the center of the core, is known to dissociate easily from the complex (Lin et al., 2016). We also
observed a significantly shorter half-life of Sec13, a component of the NPC. However, Sec13 is also a
stoichiometric member of the COPII coat so we cannot attribute the observed half-life with dynamic
exchange in the NPC, as our data is averaged over all populations in the cell (see Discussion). Others
Dorrbaum et al. eLife 2018;7:e34202. DOI: https://doi.org/10.7554/eLife.34202 7 of 24
Research article Cell Biology Neuroscience

have described some extremely long-lived proteins associated with the NPC in neurons (in-vivo
study in rat brain; (Savas et al., 2012; Toyama et al., 2013); we also detect some of the same long-
lived NPC components in our neural samples. Of course, we cannot rule out the possibility that all of
the complex member proteins that we analyzed were indeed physically associated with their respec-
tive complexes. With this caveat in mind, we considered the cohesiveness of the half-lives of the four
above protein complexes in a conceptual framework that considers the relative dynamism of the
complex assembly and disassembly (Figure 5G). At the dynamic extreme is the spliceosome; here
were observed that the spliceosome constituents exhibited the fastest turnover of the four com-
plexes examined. At the static extreme, we placed the ATP synthase and the small and the large
subunit of the ribosome. Notably, for the ATP synthase, we observed the longest average half-life.
The NPC is located in the center of the dynamism axis, as it contains both a static core as wells as
dynamic outer filaments. Correspondingly, we found the highest variation of subunit half-lives in the
0
2
4
3 4 5 6 7 8 9
10
11
12
13
14
15
>1
5
F
G
100 Å
B
100 Å
C
100 Å 100 Å
D E
Half-life [days]
stne
utitsn
oc xelp
moc
dehcta
m fo re
bm
uN
3 4 5 6 7 8 9 10 11 12 13 14 152
0
1
2
0
10
20
0
2
4
6
8
spliceosome
ribosome
nuclear pore complex
ATP synthase
16
01
23
45
6A
Stan
dar
d
dev
ia"
on
0
4
3
2
1
5
6 ****
Complex Random
0
1
2
3
4
dynamicsta"c
Complex assembly and disassembly dynamics
noitaive
d dra
dnatS
5 10 15NPC
RPL
RPSspliceosome
ATP syn. (head)
ATP syn. (stalk)
Figure 5. Protein half-lives within multi-protein complexes. (A) Standard deviation (SD) for half-lives within multi-protein complexes compared to SD
between randomly sampled proteins. (B) Structures of the spliceosome (PDB code: 5O9Z), (C) the ribosome (PDB code: 3J7R), (D) the nuclear pore
complex (multiple PDB codes, see Materials and methods) and (E) the ATP-synthase (PDB code: 5LQX) are color-coded according to the protein half-
lives. For the nuclear pore complex (D) only one repeating unit is displayed. The whole complex is shown as an insert (bottom right). RNA molecules
and proteins for which no half-life was determined are shown in grey. (F) Half-life distributions of the complex constituents and the corresponding color
scales. (G) Relationship between the SD of complex members and complex assembly and disassembly dynamics. Average half-lives of complex
members are indicated by the indicated color scale.
DOI: https://doi.org/10.7554/eLife.34202.015
The following source data and figure supplement are available for figure 5:
Source data 1. Half-lives of protein complex constituents.
DOI: https://doi.org/10.7554/eLife.34202.017
Source data 2. Half-lives of constituents of the ribosome, ATP-synthase, spliceosome and nuclear pore complex.
DOI: https://doi.org/10.7554/eLife.34202.018
Figure supplement 1. Correlation of half-life variability within protein complexes and complex size.
DOI: https://doi.org/10.7554/eLife.34202.016
Dorrbaum et al. eLife 2018;7:e34202. DOI: https://doi.org/10.7554/eLife.34202 8 of 24
Research article Cell Biology Neuroscience

NPC. However, both the dynamic spliceosome and the static ribosome sub-complexes displayed
similar subunit half-life variations.
Nature vs. nurture in protein turnoverIn previous studies, different protein lifetimes have been observed in different cell types
(Mathieson et al., 2018) and in different tissues (Price et al., 2010). We thus asked if the protein
lifetimes we examine here are intrinsic to their amino acid sequence (nature) or rather whether there
exist environmental influences (nurture), either intracellular (e.g. the specific cell type in which the
protein is expressed) or extracellular (the types of cells in the extracellular neighborhood). Indeed,
protein degradation and protein stability have been linked to intrinsic sequence properties, such as
the N-terminal amino acid, denoted as ‘N-end rule’ (Bachmair et al., 1986; Gibbs et al., 2014).
Accordingly, we analyzed the N-terminal amino acid sequence for all protein groups that were
assigned to one specific protein sequence. Sequence analysis revealed no significantly over- or
under-represented N-terminal amino acids in the fraction of short-lived proteins (10% of proteins
with shortest half-lives) or long-lived proteins (10% of proteins with longest half-lives), respectively
(Figure 3—figure supplement 1A,B). Interestingly, we found more proteins with a destabilizing
N-terminal amino acid in the fraction of long-lived proteins compared to short-lived proteins (Fig-
ure 3—figure supplement 1C). In primary hippocampal cultures, N-terminal sequence properties
seem to have little impact on protein lifetimes when compared to protein functions and localization.
To examine potential environmental influences, we prepared ‘glia-enriched’ and ‘neuron-
enriched’ cell cultures. The proteomes of these neuron-enriched and glia-enriched cultures were
clearly different from the mixed cultures (Figure 6—figure supplement 1A,H) and the respective
markers of the inappropriate cell type were significantly de-enriched (Figure 6—figure supplement
1B,C, Figure 6—source data 1; see Materials and methods). Proteomic analysis further revealed
that the glia-enriched cultures are strongly enriched in astrocytes and microglia, while markers for
oligodendrocytes do not show a consistent enrichment (Figure 6—figure supplement 1D,E; see
also Figure 6—figure supplement 4).
We next compared protein half-lives in the three different culture types (glial-enriched, neuron-
enriched cultures, and standard ‘mixed’ cultures used for all of the above described experiments;
Figure 6A). We found that, at the population level, the proteins extracted from the glial-enriched
cultures exhibited a significantly faster turnover than the proteins extracted from either the neuron-
enriched or mixed cultures, which were much more similar to one another (Figure 6B). This global
difference in turnover between the proteins from the glial-enriched samples and the other two sam-
ples cannot be explained by simple differences in their respective proteomes, as there was an 75%
and 78% overlap in proteomes between the glial-enriched proteome and neuron-enriched and
mixed proteomes, respectively (Figure 6—figure supplement 1A). We next compared the turnover
rates of individual proteins shared between any two proteomes. A comparison of the turnover rates
in glial-enriched cultures vs mixed cultures revealed a systematic shift of almost the entire proteome
to faster half-lives in glial-enriched cultures (Figure 6C). We considered whether the faster turnover
observed in glial-enriched cultures could be related to ongoing cell-division of glia cells, but, as
noted above, there is no significant cell division of glia in the confluent mature cultures (Figure 6—
figure supplement 5). We further explored the issue of cell division by examining the half-life of His-
tone H3.1 in the mixed vs. glia-enriched cultures. The heavy isotopically labelled form of Histone
H3.1 is only produced by cell division and not by protein turnover in post-mitotic cells (Ahmad and
Henikoff, 2002; Schwartz and Ahmad, 2005; Wu et al., 1982). Similar long half-lives for Histone
H3.1 were obtained in mixed cultures (11.6 days) and glia-enriched cultures (11.2 days) demonstrat-
ing that a similar low rate of cell division takes place in both culture types and that cell division can-
not account for the faster protein turnover in glia cells (Figure 6—figure supplement 5B).
A comparison of the turnover rates of proteins identified in both the neuron-enriched proteome
and the mixed-culture proteome revealed 169 proteins that exhibited a significantly faster turnover
in mixed cultures as well as 68 proteins that exhibited a significantly faster turnover in neuron-
enriched cultures (Figure 6D, Figure 6—source data 2). We asked whether any particular functional
groups are significantly over-represented using Gene Ontology (Figure 6—source data 3). We
found that proteins with faster turnover rates in mixed compared to neuron-enriched cultures were
significantly over-represented in functional groups that represent ribosomal proteins, cytoplasmic
translation, the extracellular matrix and focal adhesion (Figure 6E). Further, we found that proteins
Dorrbaum et al. eLife 2018;7:e34202. DOI: https://doi.org/10.7554/eLife.34202 9 of 24
Research article Cell Biology Neuroscience

Figure 6. Protein turnover rates of different cell types in different cellular environments. (A) Different cell culture types and environments for which
protein turnover was investigated. (B) Protein half-life distributions for different primary neuronal culture types (mixed, neuron-enriched and glia-
enriched cultures). (C and D) show protein-wise half-life comparisons for proteins in glia-enriched versus mixed cultures as well as neuron-enriched
versus mixed cultures. Proteins with significantly regulated turnover rates (p<0.05 at�2 of 3 time points, Bonferroni corrected) are highlighted in color.
(E) GO over-representation analysis of proteins with significantly faster turnover rates in mixed cultures compared to neuron-enriched cultures. Selected
over-represented GO terms (p<0.05) and their log2-fold over-representation are shown. (F) Same as E for proteins with significantly faster turnover rates
in neuron-enriched cultures compared to mixed cultures. (G) Proposed mechanism to explain the increased turnover of glycolytic enzymes in neuron-
enriched cultures. In the absence of glia cells, neurons are not supplied with lactate via the astrocyte-neuron-lactate-shuttle and hence pyruvate
production relies on glycolysis exclusively. Glycolytic enzymes might be used more frequently, damaged more frequently and replaced earlier. (H)
Selected proteins with significantly faster turnover rates in neuron-enriched cultures that are involved in synaptic processes. (I) Protein-wise turnover
comparisons for proteins from neuron-enriched cultures maintained with or without conditioned medium. Proteins with significantly regulated turnover
rates (p<0.05, Bonferroni corrected) are highlighted in color.
DOI: https://doi.org/10.7554/eLife.34202.019
The following source data and figure supplements are available for figure 6:
Source data 1. Relative protein abundances in different culture types.
DOI: https://doi.org/10.7554/eLife.34202.025
Source data 2. Protein half-life comparison between different culture types.
DOI: https://doi.org/10.7554/eLife.34202.026
Source data 3. GO analysis of proteins with different turnover rates in mixed and neuron-enriched cultures.
DOI: https://doi.org/10.7554/eLife.34202.027
Source data 4. Proteins with different turnover rates in neuron-enriched cultures with and without conditioned medium.
Figure 6 continued on next page
Dorrbaum et al. eLife 2018;7:e34202. DOI: https://doi.org/10.7554/eLife.34202 10 of 24
Research article Cell Biology Neuroscience

with faster turnover rates in neuron-enriched cultures were significantly over-represented in func-
tional groups related to glycolytic processes, the regulation of neurotransmitter levels, axon terminus
and myelin sheath (Figure 6F). Within the glycolysis pathway, we discovered that a majority of the
enzymes exhibited faster turnover in neuron-enriched cultures (Figure 6—figure supplement 2). It
has been demonstrated that astrocytes provide lactate (which can be converted to pyruvate by the
lactate dehydrogenase) to neurons (Magistretti and Pellerin, 1999; Mason, 2017); the relative pau-
city of glia in the neuron-enriched cultures would lead to the loss of astrocyte-derived lactate and
could lead to enhanced metabolic activity of the neuron’s own glycolytic axis, and a resulting faster
turnover (Figure 6G). Within the synapse, we noted that several proteins related to the synaptic ves-
icle cycle as well as neurotransmitter synthetic enzymes exhibited a faster turnover in neuron-
enriched cultures relative to mixed cultures (Figure 6H).
In the above experiments, differences in protein turnover in the neuron-enriched versus mixed
(neuron-glia) cultures could be due to secreted factors or due to the physical presence of glial cells.
To address this, we asked whether the composition of the extracellular medium alone could influ-
ence protein turnover. We compared the protein turnover rates in ‘sister’ neuron-enriched cultures
grown in a medium supplemented with conditioned medium (obtained from glia cells and mixed
cortical cultures) or without conditioned medium. As above, we used SILAC to assess protein turn-
over, performing the medium swap (light-to-heavy or heavy-to-light; see Materials and methods) at
DIV 18–19. We observed that cell density was clearly lower for neuron-enriched cultures without con-
ditioned medium compared to sister-cultures that were supplemented with conditioned medium
although cell viability was similar (visual inspection). When we compared the protein turnover rates
in the two conditions, we found that they were very similar to one another, with just a few proteins
showing altered turnover as a result of the presence or absence of pre-conditioned medium
(Figure 6I). We also noted that the proteins that had a faster turnover in neuron-enriched cultures
compared to mixed cultures (see Figure 6D) did not show different turnover kinetics in neuron-
enriched cultures with and without conditioned medium (e.g. glycolytic enzymes and proteins
depicted in Figure 6H; see also Figure 6—source data 4). These data indicate that the differences
in protein turnover we observe between neuron-enriched and neuron-glia cultures likely arise from
physical/mechanical interactions between the cells, presumably owing to adhesive interactions and
its associated signaling.
DiscussionHere, we used a dynamic SILAC approach to describe the turnover rates of neuronal proteins in dif-
ferent cellular environments. All in all, we obtained half-life measurements for over 5100 protein
groups which exhibited a range of half-lives from <1 day to >20 days, with a median half-life of 5.4
days in mixed cultures. A similar half-life distribution (median = 4.2 days) was obtained by
Cohen et al. (2013) who measured the turnover of 2802 protein groups from mixed
cortical cultures. A recent study by Mathieson et al. (2018) reported clearly shorter half-lives for pri-
mary mouse embryonic neurons (median = 1.9 days). These shorter half-lives are likely explained by
the relative immaturity of the cultures (prepared from embryonic rather than postnatal neurons) and
the relative short time in vitro (5 days vs. 18–19 days). We further compared the protein half-lives
Figure 6 continued
DOI: https://doi.org/10.7554/eLife.34202.028
Figure supplement 1. Comparison of different culture types.
DOI: https://doi.org/10.7554/eLife.34202.020
Figure supplement 2. Faster protein turnover of glycolytic enzymes in neuron-enriched cultures.
DOI: https://doi.org/10.7554/eLife.34202.021
Figure supplement 3. Comparison of neuron-enriched cultures with and without conditioned medium.
DOI: https://doi.org/10.7554/eLife.34202.022
Figure supplement 4. Proteomic comparison of glia-enriched cultures prepared from cortex and hippocampus.
DOI: https://doi.org/10.7554/eLife.34202.023
Figure supplement 5. Estimation of cell division in primary cultures.
DOI: https://doi.org/10.7554/eLife.34202.024
Dorrbaum et al. eLife 2018;7:e34202. DOI: https://doi.org/10.7554/eLife.34202 11 of 24
Research article Cell Biology Neuroscience

determined by our in vitro study in mixed cultures to half-lives of mouse brain proteins that were
previously determined by in vivo metabolic labelling. Though proteins were clearly longer-lived in
vivo (average half-life ~9 days) compared to in vitro, a gene-wise comparison revealed a significant
correlation between protein half-lives (Spearman rank correlation = 0.62, p<0.001; Figure 1—figure
supplement 3). The systematic offset could be explained by the different experimental approach,
species (mouse versus rat), cellular compositions and environments as well as by the different ages
of the investigated cells. Visscher et al. (2016) recently reported shorter half-lives for proteins in
young cells (C. elegans larvae) compared to older cells (adult C. elegans).
We validated the protein turnover rates we measured using dynamic SILAC with a metabolic
labelling and visualization strategy, FUNCAT-PLA (tom Dieck et al., 2015). We found that the
ranked half-lives of the proteins determined via MS and FUNCAT-PLA were very well correlated. The
half-lives of proteins visualized in situ with FUNCAT-PLA, however, were systematically shorter than
those determined via MS. Reasons for this offset could include a relative instability of the azide
group or AHA-containing proteins, or an increased sensitivity of the AHA-labeling to detect the
rapid degradation of misfolded proteins which are missed by the continuous SILAC labelling (also
discussed below).
Analysis of our dynamic SILAC data revealed that protein turnover is influenced by the cellular
location of the protein. We found that membrane proteins, in particular those of the plasma mem-
brane, the ER, and the Golgi apparatus exhibited significantly shorter than average half-lives while
mitochondrial proteins exhibited significantly longer half-lives. These systematic differences in pro-
tein turnover might result from different major degradation mechanisms for cytosolic and membrane
proteins (Jin et al., 2018; Tai and Schuman, 2008) as well as the unique quality control mechanism
of mitochondria by fission and fusion (Cagalinec et al., 2013; Gomes and Scorrano, 2008). Interest-
ingly, the population of synaptic proteins exhibited a similar distribution of half-lives to the general
population. Protein half-lives also correlate with protein functions. Receptors, signalling molecules
and proteins involved in cellular communication, for instance, were over-represented in the group of
short-lived proteins. In contrast, other functional classes such as histones and proteins involved in
energy metabolism were over-represented in the fraction of long-lived proteins. This finding sup-
ports the idea that protein lifetimes evolved evolutionary in a way that proteins involved in internal
and external signal response are short-lived to enable faster and more fine-tuned regulation, while
proteins that serve more steady functions in the cell are longer-lived in order to save energy that is
required for protein synthesis and degradation.
Proteins are interactive by design and this interaction is essential for the execution and regulation
of cellular functions. Cohen et al. (2013) showed that interacting proteins have more similar half-
lives compared to non-interacting proteins in primary cortical neurons. Expanding on this, we found
that members of multi-protein complexes display more similar half-lives than randomly selected pro-
teins. Protein complexes differ greatly in their biogenesis, assembly and disassembly kinetics, and
these differences might be reflected in different mean half-lives between complexes or variability of
half-lives within complexes. We examined in detail the half-lives of protein constituents of 4 different
multi-protein complexes: the ATP synthase, the ribosome, the nuclear pore complex and the spliceo-
some. For the four complexes we examined, the most dynamic in terms of assembly and disassembly
is the spliceosome and the proteins in this complex exhibited the shortest half-lives. The nuclear
pore complex exhibited highly variable half-lives of its associated protein constituents, which is in
agreement with previous studies (Beck and Hurt, 2017; Daigle et al., 2001; Mathieson et al.,
2018). Surprisingly, the ribosome, a canonical stable cellular complex where the 40S and 60S subu-
nits are thought to be assembled ‘for life’ in the nucleus and nucleolus, exhibited substantial variabil-
ity in the half-lives of its constituents, suggesting the possibility that some ribosomal proteins may
be exchanged to repair (Pulk et al., 2010) or even specialize ribosomes (Xue and Barna, 2012) in
subcellular compartments (Holt and Schuman, 2013).
The above results must be interpreted with the caveat that we do not know if the half-lives we
measured represent a single functional state for the proteins. A recent study in mouse fibroblasts
demonstrated that ~ 10% of the proteins show non-exponential decay kinetics with a faster degrada-
tion in the first hours after synthesis (McShane et al., 2016). The dynamic SILAC approach we used
here does not allow us to accurately distinguish between different sub-populations of the same pro-
tein that have different stabilities. As unstable proteins are degraded shortly after synthesis, they
represent a low abundant sub-population in the whole cell lysate and contribute less to the
Dorrbaum et al. eLife 2018;7:e34202. DOI: https://doi.org/10.7554/eLife.34202 12 of 24
Research article Cell Biology Neuroscience

measured MS signals compared to the corresponding stable protein population. Furthermore, we
did not acquire samples in the first hours after the medium change, which would be necessary to
accurately resolve protein populations with different decay kinetics. In contrast, sub-populations with
different lifetimes could be better detected in a pulse-chase experiment sampling multiple chase
time points in short time intervals after the pulse. During the pulse, proteins of all sub-populations
are synthesized and during the chase these sub-populations will decay with different time constants:
the fraction of short-lived proteins will vanish after a short time while the longer-lived fraction will
remain much longer before it eventually degrades. Alternatively, in future experiments, the purifica-
tion of subcellular compartments (e.g. synaptosomes) or organelles (e.g. ribosomes) and an indepen-
dent determination of the half-lives of proteins in particular cell locations or functional groups could
provide new insights on sub-populations with different half-lives.
Factors intrinsic to the amino acid sequence have been described, which contribute to the stabil-
ity of proteins; specific amino acids were found to have a destabilizing effect when located at the
protein N-terminus (Bachmair et al., 1986; Gibbs et al., 2014). In our dataset, there was no over-
representation of destabilizing N-terminal amino acids in the fraction of short-lived proteins com-
pared to long-lived proteins, indicating that N-terminal sequence properties have little impact on
protein lifetimes in primary hippocampal cultures.
We further examined whether there is an additional effect of the intracellular environment on
brain protein turnover by comparing the half-lives of the same proteins in either glial- or neuron-
enriched cultures. We found that when expressed in glia, proteins exhibited a significantly faster
turnover rate than they did when expressed in neurons; this difference cannot be explained by glial
cell division. Others have investigated turnover rates for nuclear proteins in different brain cell types
and also observed faster protein turnover for glia cells compared to neurons (Toyama et al., 2013).
We also examined the effect of the extracellular environment on protein turnover, comparing the
turnover of proteins in neuron-enriched cultures to mixed cultures, which contain both neurons and
glia. We found that while the majority of protein half-lives were not changed between the two condi-
tions, a significant group of proteins exhibited faster or slower turnover when glia were present in
the extracellular environment. We believe that most of the changes in half-life are likely due to adhe-
sive interactions with glial cells, rather than secreted factors, as there were no big differences in turn-
over when we compared neuron-enriched cultures treated, or not, with glial conditioned medium.
Proteins that showed faster turnover in the absence of glia included both glycolytic enzymes and
proteins associated with vesicle cycling. This turnover regulation is likely related to the activity state
of the respective proteins. In the absence of glia cells, neurons lack lactate supplied from glia (by the
glia-neuron lactate shuttle), and thus require increased glycolytic activity to produce pyruvate. The
observed increase in turnover of glycolytic enzymes might reflect this increased activity. A similar
correlation between turnover and the activity of individual proteins was recently demonstrated in
yeast (Martin-Perez and Villen, 2017). Taken together, these data indicate a potent influence of
both the intracellular (local) and extracellular (global) environment on protein turnover.
In the present experiments we rely on the relative enrichment of neurons or glia in special culture
conditions. With the recent development of cell type-specific metabolic labelling (Alvarez-
Castelao et al., 2017), there exists the possibility to directly examine the protein turnover of distinct
cell types in combination with the dynamic SILAC approach employed here. In addition, understand-
ing how plasticity regulates and exploits turnover to modify brain proteomes is a goal of future
studies.
Materials and methods
Preparation and maintenance of cultured neurons and glia cellsMixed culturesDissociated hippocampal neurons were prepared and maintained as previously described
(Aakalu et al., 2001). Briefly, hippocampi from postnatal day 1 rat pups (strain Sprague-Dawley)
were dissected and dissociated by papain and plated at a density of 18,000 cells/cm2 onto poly-D-
lysine-coated Petri dishes (MatTek, Ashland, Massachusetts). Cultures were maintained in Neuroba-
sal-A medium (Invitrogen, Carlsbad, California) supplemented with B-27 (Invitrogen) and Glutamax
Dorrbaum et al. eLife 2018;7:e34202. DOI: https://doi.org/10.7554/eLife.34202 13 of 24
Research article Cell Biology Neuroscience

(Invitrogen) at 37˚C. All experiments were carried out with the approval of the German animal exper-
iment authorities.
Primary hippocampal cultures for FUNCAT-PLA experimentsFor FUNCAT-PLA experiments, primary hippocampal neurons were prepared as described above
and plated at a density of approximately 20,000 cells/cm2 onto poly-D-lysine-coated glass-bottom
Petri dishes (MatTek).
Neuron-enriched culturesHippocampal cells were dissociated and plated as described above at a density of approximately
25,000 cells/cm2. After one day, 3 mM cytosine b-D-arabinofuranoside (AraC; Sigma-
Aldrich, St. Louis, Missouri) was added for 48 hr. Subsequently, the cells were maintained in a
medium composed of Neurobasal-A supplemented with B-27 and Glutamax of which 20% were pre-
conditioned over cortical neurons and 30% were pre-conditioned over glia cells.
Neuron-enriched sister cultures with and without pre-conditioned mediumHippocampal cells were dissociated and plated as described above and plated at a density of
approximately 25,000 cells/cm2. Eight hours after plating, the medium was fully exchanged with
‘light’ or ‘heavy’ (K10, R8) Neurobasal-A supplemented with B-27 and Glutamax (NGM) or with
‘light’ or ‘heavy’ (K10, R8) Neurobasal-A supplemented with B-27 and Glutamax of which 20% were
pre-conditioned over cortical cultures and 30% were pre-conditioned over glia cells (NGM- condi-
tioned). One day after plating, 3 mM AraC was added for 48 hr. Subsequently, the cells were main-
tained again in ‘heavy’ or ‘light’ NGM or NGM conditioned as before.
Glia-enriched culturesThe cortex from postnatal day 1 rat pups was dissected and dissociated as described above. 20% of
the cell suspension was plated out and maintained on non-coated 6 cm Petri dishes (MatTek). Cells
were initially grown in MEM++. Medium was exchanged with fresh MEM++ after 4 hr and after 4
days. After 7 days in culture, medium was exchanged by conditioned medium composed of Neuro-
basal-A supplemented with B-27 and Glutamax of which 5% were pre-conditioned over cortical neu-
rons and 15% were pre-conditioned over glia cells.
Comparison of glia-enriched cultures prepared from cortex andhippocampusThe cortex from a postnatal day 1 rat pup was dissected and dissociated by papain. Five percent of
the cell suspension was plated on non-coated 3 cm Petri dishes (MatTek). Four hippocampi from
two rat pups (postnatal day 1) were dissected and dissociated by papain. Twenty-five percent of the
pooled cell suspension was plated on non-coated 3 cm Petri dishes. Cells were maintained in MEM+
+ at 37˚C. After 11 days in culture, cells were washed with ice-cold DPBS (Invitrogen) supplemented
with protease inhibitor (cOmplete EDTA-free, Roche, Basel, Switzerland), scraped, pelleted by cen-
trifugation, frozen in liquid nitrogen and stored at �80˚C.
Dynamic SILAC experiment in mixed, neuron-enriched and glia-enrichedculturesAfter 18–19 days in culture, the growth medium was exchanged with a medium that was depleted of
arginine and lysine (customized; Invitrogen) and added ‘heavy’ isotopically labeled arginine (R10;
Thermo Fisher, Waltham, Massachusetts) and lysine (K8; Thermo Fisher) resulting in a final percent-
age of 80% Arg10/Lys8% and 20% remaining ‘light’ arginine (R0)/lysine (K0). Visual inspection of the
cells in pilot experiments revealed improved cell viability when a thin layer of initial medium
remained on the cells during the medium change compared to a complete medium removal and
addition of fresh medium or medium that was pre-conditioned in sister-cultures. Cells were har-
vested 0, 1, 3 and 7 days after the medium switch. Cells were washed with ice-cold DPBS supple-
mented with protease inhibitor (cOmplete EDTA-free, Roche), scraped, pelleted by centrifugation,
frozen in liquid nitrogen and stored at �80˚C. For each culture type, three independent biological
replicates were performed.
Dorrbaum et al. eLife 2018;7:e34202. DOI: https://doi.org/10.7554/eLife.34202 14 of 24
Research article Cell Biology Neuroscience

Dynamic SILAC experiment in neuron-enriched sister cultures with andwithout conditioned mediumAfter 18–19 days in culture, approximately 80% of the medium was swapped between a heavy and
light neuron-enriched cultures without conditioned medium or between heavy and light neuron-
enriched cultures with conditioned medium, respectively. Cells were harvested 7 days after the
medium switch. For each culture type, one dish was also harvested just before the medium change
(0 day). Two independent biological replicates were performed.
Sample preparation for MS analysisThe cell pellets were lysed in lysis buffer (8 M urea, 200 mM Tris/HCl [pH 8.4], 4% CHAPS, 1 M NaCl,
cOmplete EDTA-free protease inhibitor) using a pistil and sonication for 4 � 30 s at 4˚C. The sam-
ples were incubated with Benzonase (1 mL of a � 250 units/mL stock solution; Sigma) for 10 min, and
centrifuged for 5 min at 10,000 x g to clear the samples from cell debris.
The proteins were digested as described by Wisniewski et al. (2009). In brief, the samples were
mixed with Urea Buffer A (UA: 8 M urea, 0.1 M Tris/HCl [pH 8.5]), loaded onto a 10 kDa Microcon fil-
ter (Merck Millipore, Burlington, Massachusetts) and centrifuged at 17,000 x g for 20 min. After an
additional wash step with UA, the proteins on the filter membrane were reduced with 10 mM TCEP
(in UA) for 30 min. TCEP was subsequently removed by centrifugation and proteins were then added
95 mM IAA in UA and incubated in the dark for 30 min. IAA was removed by centrifugation and the
samples were washed three times with 100 mL of Urea Buffer B (UB: 8 M urea, 0.1 M Tris/HCl [pH
8.0]). Proteins were digested with Endopeptidase LysC (Promega, Madison, Wisconsin) in a protein
to enzyme ratio of 50:1 and subsequently with trypsin (Promega) in a protein to enzyme ratio of
100:1. Samples were desalted using C18 StageTips (Rappsilber et al., 2007) or SepPak cartridges
(Waters, Milford, Massachusetts) as described by Schanzenbacher et al. (2016). Samples were dried
by vacuum centrifugation and stored at �20˚C until LC-MS analysis.
LC-MS/MS AnalysisThe dried peptide samples were reconstituted in 5% acetonitrile with 0.1% formic acid and subse-
quently loaded using a nano-HPLC (Dionex U3000 RSLCnano) onto a PepMap100 loading column
(C18, L = 20 mm, 3 mm particle size, Dionex, Sunnyvale, California) and washed with loading buffer
(2% acetonitrile, 0.05% trifluoroacetic acid in water) for 6 min at a flow rate of 6 mL/min. Peptides
were separated on a PepMap RSLC analytical column (C18, L = 50 cm, <2 mm particle size, Dionex)
by a gradient of phase A (water with 5% v/v dimethylsulfoxide and 0.1% formic acid) and phase B
(5% dimethylsulfoxide, 15% water and 80% acetonitrile v/v/v). The gradient was ramped from 4% B
to 48% B in 178 min at a flow rate of 300 nL/min. All solvents were LC-MS grade and purchased
from Fluka. Peptides eluting from the column were ionized online using a Nanospray Flex ion source
(Thermo Scientific) and analyzed either in a ‘Q Exactive Plus’ (Thermo Scientific) or in an ‘Orbitrap
Elite’ (Thermo Scientific) mass spectrometer in data-dependent acquisition mode. For Q Exactive
Plus measurements, precursor ion spectra were acquired over the mass range 350–1400 m/z (mass
resolution 70 k), and the top10 precursor ions were selected for fragmentation (HCD; normalized
collision energy = 30) and analysis in MS2 mode (resolution 17.5 k). For Orbitrap Elite measure-
ments, precursor ion spectra were acquired over the mass range 350–1600 m/z (FTMS; mass resolu-
tion 120 k), and the top15 precursor ions were selected for fragmentation (CID; normalized collision
energy = 35) and analysis in MS2 mode (ITMS). The full parameter sets are listed in
Supplementary file 2. All dynamic SILAC samples were measured in triplicate LC-MS/MS runs. The
samples for comparison of glia-enriched cultures obtained from cortex and hippocampus were mea-
sured in technical duplicates.
Database searchesRaw data were analyzed with MaxQuant (version 1.6.0.1; RRID:SCR_014485 [Cox and Mann, 2008;
Tyanova et al., 2016a]) using customized Andromeda parameters (see Supplementary file 3).
For all searches, spectra were matched to a Rattus norvegicus database downloaded from uni-
prot.org (37,669 entries, reviewed and unreviewed; RRID:SCR_002380) and a contaminant and
decoy database. Precursor mass tolerance was set to 4.5 ppm, fragment ion tolerance to 20 ppm
(QExactive Plus) or 0.5 Da (Orbitrap Elite), respectively. Carbamidomethylation (+57.021) of cysteine
Dorrbaum et al. eLife 2018;7:e34202. DOI: https://doi.org/10.7554/eLife.34202 15 of 24
Research article Cell Biology Neuroscience
residues was set as fixed modification and protein-N-terminal acetylation (+42.011) as well as methi-
onine oxidation (+15.995) were set as variable modifications. A False discovery rate of 0.01 was
applied at the PSM and protein level. If not stated otherwise, only unique peptides were included in
down-stream analysis. For the dynamic SILAC samples, two different parameter sets were used to (a)
relatively quantify protein abundance and assess the rate of incorporation of ‘light’ amino acids into
nascent proteins during the ‘heavy’ pulse (R10 and K8 as variable modifications) and to (b) quantify
‘heavy/light’ ratios (R10 and K8 as heavy SILAC labels). For (a), heavy arginine (R10; +10.008) and
heavy lysine (K8; +8.014) were set as additional variable modifications, whereas for (b), R10 and K8
were set as heavy SILAC partners (multiplicity = 2).
All proteomics data associated with this manuscript have been uploaded to the PRIDE online
repository (Vizcaıno et al., 2013).
Bioinformatic processing and data analysisRelative protein quantification in dynamic SILAC samplesProtein results from MaxQuant search B were filtered to remove decoys and contaminants and pro-
tein intensities were subsequently normalized to the mean intensity of each injection (Figure 6—
source data 1). GO over-representation analysis of neuron-related proteins (detected in �2 neuron-
enriched samples and absent in all glia-enriched samples) and glia-related proteins (detected in �2
glia-enriched samples and absent in all neuron-enriched samples), respectively, was performed using
the Gene List Analysis tool of the Panther Classification System (RRID:SCR_015893; Mi et al., 2013).
All identified proteins were used as reference data set. Significantly over-represented GO terms
(p<0.05; Bonferroni corrected) are shown in Figure 6—figure supplement 1D,E. For principle com-
ponent analysis (Figure 6—figure supplement 1F; performed using Perseus software package; ver-
sion 1.5.2.6; RRID:SCR_015753 (Tyanova et al., 2016b), protein intensities were averaged within
biological replicates and log2 transformed. Only proteins with expression values for all biological
replicates could be used for principle component analysis.
For a quantitative comparison of individual proteins, protein intensities of technical replicates
were averaged. To characterize the cellular composition of the different culture types, relative
expression levels of established neuronal and glial marker proteins as well as previously reported
astrocyte, oligodendrocyte and microglia marker proteins (the top 20 most enriched proteins in the
respective cell types reported by Sharma et al., 2015) were compared between the different culture
types (Figure 6—figure supplement 1B–E). Forty-three of these astrocyte, oligodendrocyte and
microglia marker proteins, that were detected in mixed cultures at all time points within a samples
set (biological replicate), were used to quantify the relative expression levels of glia proteins over
the time course of the dynamic SILAC experiment (7 days; see Figure 6—figure supplement 5A).
Incorporation of light arginine and lysine into nascent proteinsPeptide results from MaxQuant search A were filtered for decoys and contaminants. Peptides con-
taining two arginine and/or lysine residues (due to a missed tryptic cleavage site) were extracted
and the ratio of the following combinations was calculated for each sample (except t0 samples)
based on the number of detections: ‘light-heavy’ and ‘heavy-heavy’. The probabilities of incorpo-
ration of a light or heavy amino acid, respectively, into a nascent protein was calculated using the
following equation system:
P Lð ÞþP Hð Þ ¼ 1 (1)
2 �P Lð Þ �P Hð Þ ¼LH
LLþLHþHH(2)
P Hð Þ �P Hð Þ ¼HH
LLþLHþHH(3)
LL: Newly synthesized peptides containing two ‘light’ Arg/Lys; cannot be experimentally
assessed, since newly synthesized ‘light’ peptides cannot be distinguished from pre-existing
peptides
Dorrbaum et al. eLife 2018;7:e34202. DOI: https://doi.org/10.7554/eLife.34202 16 of 24
Research article Cell Biology Neuroscience

LH: Newly synthesized peptides containing one ‘light’ and one ‘heavy’ Arg/Lys; experimentally
assessed for each sample
HH: Fraction of newly synthesized peptides containing two ‘heavy’ Arg/Lys; experimentally
assessed for each sample
P(L): Probability of incorporation of a ‘light’ Arg/Lys into a nascent protein
P(H): Probability of incorporation of a ‘heavy’ Arg/Lys into a nascent protein
Combination of equations 1-3 lead to:
P Hð Þ ¼2 � HH
LH
1þ 2 � HHLH
(4)
P Lð Þ ¼ 1�P Hð Þ (5)
For protein half-life determination, P(H) is used as a correction factor to convert the fraction of
‘light’ peptides into the fraction of pre-existing peptides (see below).
Protein half-life determinationPeptide results from MaxQuant search B were filtered for decoys and contaminants. The fractions of
remaining light peptides (%L) were calculated for each measurement and each peptide based on the
H/L ratios (computed by MaxQuant) using equation 6. For t0 samples, %L was set to 1, if the pep-
tide was only detected in its ‘light’ form and hence no H/L was computed.
%L¼1
1þH=L(6)
%L: fraction of remaining ‘light’ peptide
H/L: Heavy-light ratio computed by MaxQuant
The fraction of light peptide was converted into the fraction of pre-existing peptide (%old) using
a correction factor that corrects for incorporation of light Arg/Lys into newly synthesized proteins,
see equation 7. Resulting negative values were excluded from further analysis.
%old¼ 1�1�%L
P Hð ÞMC(7)
%old: fraction of pre-existing peptide
P(H): Correction factor; probability of incorporation of a ‘heavy’ Arg/Lys into a nascent protein
MC: number of missed cleavages
Peptides were subsequently filtered within biological replicates. Only peptides that were quanti-
fied at all four time points (t0, 1d, 3d, 7d) and with a mean %old >0.9 at t0 were considered for fur-
ther analysis. Only peptides unique for a protein group were used for further analysis. In a few cases,
two protein groups were merged (in order to rescue peptides) and only peptides unique for the
merged group were further considered. For protein group 5450 (Rps27A) peptides assigned to the
sequence of ubiquitin were removed, so that all remaining peptides were specific for Rps27A. The
filtered peptide data of the biological replicates was merged. For each culture type, protein group
and time point, %old values that were identified as outliers (%old <quartile 25–1.5*interquartile
range or %old >quartile 75 + 1.5*interquartile range) were removed. Protein groups which average
%old did not show a continuous decay over time were excluded from further analysis. Hierarchical
clustering (kmeans method; based on average %old values per protein group) was applied to find
groups of proteins with similar turnover kinetics (Figure 1—figure supplement 4). Cluster A and B
(Figure 1—figure supplement 4) contain proteins with comparably short life-times (�50% remaining
pre-existing protein after 1 day) that cannot be accurately fit and were hence assigned a half-life of
‘<1 day’. For all other proteins, the peptide data (%old over time) were ln transformed and fitted by
a linear function, as described in equation 8. Protein half-lives (t1/2) were calculated based on the
rate constant k (negative value of slope of the fit), see equation 9. Half-lives, rate constants, stan-
dard errors of the slope and coefficients of determination (R2) are given for all proteins and all cul-
ture types in Figure 1—figure supplement 2 and Supplementary file 1.
Dorrbaum et al. eLife 2018;7:e34202. DOI: https://doi.org/10.7554/eLife.34202 17 of 24
Research article Cell Biology Neuroscience

ln %oldð Þ ¼�k � t (8)
k: rate constant of protein turnover t: Incubation time with “heavy” medium
t1=2 ¼ln 2ð Þ
k(9)
Analysis of protein half-lives in mixed culturesN-end ruleN-terminal amino acid sequences (excluding initiator methionine) were analyzed for 1797 protein
groups that contain only one protein. Sequence over-representation analysis was performed using
pLogo (O’Shea et al., 2013).
Subcellular localizationSubcellular localizations were assigned to protein groups from mixed cultures using the LocTree3
database (Goldberg et al., 2014). Only proteins assigned to a single localization with a score >50
were considered for analysis (Figure 3A; Figure 3—source data 1). Synaptic proteins were
extracted based on GO term annotations (Uniprot) and literature (Figure 3A, Figure 4, and Fig-
ure 4—source data 1). Half-lives at different cellular localizations were compared by a Mann-Whit-
ney test (Bonferroni correction for multiple testing).
Functional analysisProteins from mixed cultures were divided into eight overlapping half-life bins. GO over-representa-
tion analysis was performed for proteins in each half-life bin using the Gene List Analysis tool of the
Panther Classification System (Mi et al., 2013). All protein half-lives were used as reference data set.
Significantly over-represented GO terms (p<0.05; Bonferroni corrected) are shown in Figure 3B,C
and Figure 3—source data 2).
Analysis of protein complexesHalf-lives of proteins that belong to multi-protein complexes were extracted from the mixed culture
dataset and standard deviations (SD) between the half-lives of proteins belonging to the same com-
plex were calculated. Protein complex information were obtained from the CORUM database
(Ruepp et al. (2010); RRID:SCR_002254) and only complexes composed of �5 complex members,
for which � 3 half-lives were assigned, were used for analysis (Figure 5—source data 1). As compar-
ison, the SD was calculated between random half-lives sampled from the mixed culture dataset
(same number of groups and same group sizes as the complexes). Distribution of complex SD and
random SD was compared by Mann-Whitney test.
For more detailed analysis of selected complexes, the protein half-lives of the complex constitu-
ents were plotted onto the known structures of the spliceosome from Homo sapiens (pdb code
5O9Z), the ribosome from Sus Scrofa (pdb code 3J7R), the nuclear pore complex from Saccharomy-
ces cerevisiae and Chaetomium thermophilum (multiple pdbs merged into a full assembly as
described by Lin et al. (2016), including pdb codes: 5HAX, 5HAY, 5HAZ, 5HB4, 5HB5, 5HB6, 5HB7,
5HB6, 5HB7 and 5HB8) and the ATP synthase from Pichia angusta (pdb code 5LQX); see Figure 5B–
E. Proteins were matched to homologue chains in the pdb files using gene names when applicable,
and half-lives were visualized using a custom red-yellow-green color palette that ranges from 3 to 15
days as indicated in Figure 5F. Identical polypeptide chains in different locations in the complex
were counted as a single protein for histogram calculation. The protein complexes were plotted in
‘surface’ representation using PyMOL (RRID:SCR_000305). Subunits for which no half-life was deter-
mined are indicated in grey, RNA is plotted in ‘cartoon’ mode in light grey when applicable.
Analysis of protein turnover rates in different culture typesAll proteins for which half-lives were determined in the mixed and neuron-enriched culture as well as
in the mixed and glia-enriched culture were compared protein-wise in order to identify proteins that
display different turnover rates in different culture types (Figure 6B–C). Proteins which average %old
was always greater (or always smaller) at each time point (1d, 3d, 7d) in the cell-type enriched culture
Dorrbaum et al. eLife 2018;7:e34202. DOI: https://doi.org/10.7554/eLife.34202 18 of 24
Research article Cell Biology Neuroscience

compared to the mixed culture type, were used for statistical analysis. A t-test was performed for
each time point to compare %old values between each two different culture types (p<0.05; Bonfer-
roni correction for the total number of tests). A protein’s turnover is considered to be significantly
different between two cultures types, if %old values are significantly different for at least two of
three time points (Figure 6—source data 2).
To identify common properties/functions of proteins that showed a significantly faster or slower
turnover, respectively, in neuron-enriched cultures versus mixed cultures, we performed a GO over-
representation analysis using the Gene List Analysis tool of the Panther Classification System
(Figure 6D–H; [Mi et al., 2013]). As reference data set, all proteins were used for which a turnover
rate was determined in both, mixed and neuron-enriched cultures. All significantly over- and under-
represented GO terms (p<0.05; Bonferroni corrected) are given in Figure 6—source data 3).
Proteomic comparison of neuron-enriched sister cultures with andwithout conditioned mediumProtein results from MaxQuant search A were filtered to remove decoys and contaminants. LFQ
intensities were averaged across technical replicates and log2 transformed.
Comparison of protein turnover in neuron-enriched sister cultures withand without conditioned mediumPeptide results from MaxQuant search B were filtered for decoys and contaminants. The fractions of
remaining old peptides were calculated as described above. As a measure for protein turnover, the
relative decay of pre-existing peptides was calculated as the difference of pre-existing peptides at
time point t0 and 7 days. Peptides with resulting negative values were removed. A pair-wise t-test
(peptide level) was applied to compare the relative protein decay in neuron-enriched cultures with
and without conditioned medium. Proteins with significantly different turnover (p<0.05; Bonferroni
corrected) are reported in Figure 6I and Figure 6—source data 4.
Comparison of glia-enriched cultures prepared from cortex andhippocampusProtein results were filtered to remove decoys and contaminants. Protein intensities and LFQ values
were averaged across technical replicates and log2 transformed. Protein intensities were used to
compare the number of quantified proteins in each sample (Figure 6—figure supplement 4A) and
LFQ intensities were used for a protein-wise comparison of expression levels in the different samples
(Figure 6—figure supplement 4B).
FUNCAT-PLAFUNCAT-PLA experiments were performed as described by tom Dieck et al. (2015). After 18 days
in culture, cells were incubated in methionine-free Neurobasal-A (custom made by Invitrogen) sup-
plemented with 4 mM azidohomoalanine (AHA; in-house synthesized) for 2 hr. In methionine control
samples, the medium was supplemented with 4 mM methionine (Sigma) instead of AHA. After meta-
bolic labeling, cells were placed back into their original medium for different chase times (1–7 days
as indicated). Subsequently, cells were washed with PBS-MC (1 � PBS, pH 7.4, 1 mM MgCl2, 0.1
mM CaCl2; Gibco), fixed in PFA-sucrose (4% paraformaldehyde (Alfa Aesar), 4% sucrose in PBS-MC)
and stored in PBS at 4˚C until further sample processing. Cells were permeabilized with 0.5% Triton
X-100 in 1 � PBS (pH 7.4), blocked with blocking buffer (4% goat serum in 1 � PBS) and washed
with 1 � PBS (pH 7.8). For the click reaction, the cells were incubated with a click reaction mix (200
mM triazole ligand Tris((1-benzyl-1H-1,2,3-triazol-4-yl)methyl)amine (TBTA), 25 mM biotin alkyne tag,
500 mM TCEP and 200 mM CuSO4 in PBS (pH 7.8)) overnight at room temperature, protected from
light. The cells were washed with 0.5% Triton X-100 in 1 � PBS (pH 7.4) and PBS and then blocked
with blocking buffer. Cells were incubated with a mixture of primary antibodies diluted in blocking
buffer (90 min at room temperature). For Lamin-B1 experiment: rabbit-anti-lamin-B1 (1:800; abcam,
ref. no.: ab16048), mouse-anti-biotin (1:1,000; Life Technologies, ref. no.: 03–3700), and guinea pig-
anti-MAP2 (1:1,000; Synaptic Systems, ref. no.: 188004). For GM130 experiment: mouse-anti-GM130
(1:500; BD Transduction Laboratories, ref. no.: 610823), rabbit-anti-biotin (1:5,000; Cell signaling,
ref. no.: 5597) and guinea pig-anti-MAP2 (1:1,000). PLA probes (rabbit PLA-plus and mouse PLA-
Dorrbaum et al. eLife 2018;7:e34202. DOI: https://doi.org/10.7554/eLife.34202 19 of 24
Research article Cell Biology Neuroscience

minus; Sigma) were applied in 1:10 dilution in blocking buffer supplemented with goat-anti-guinea
pig secondary antibody coupled to Alexa Fluor 488 (1:500; Life Technologies) for 1 hr at 37˚C in a
wet chamber. Cells were then incubated with the ligation reaction mix (Duolink Detection reagents
Red, Sigma) for 30 min in a pre-warmed wet chamber at 37˚C. Amplification and label probe binding
was performed after three washes with wash buffer A with the amplification reaction mixture (Duo-
link Detection reagents Red, Sigma) in a pre-warmed wet chamber at 37˚C for 100 min. After amplifi-
cation was stopped by washes with wash buffer B (0.2 M Tris, 0.1 M NaCl, pH 7.5), cells were
incubated with of 40,6-diamidino-2-phenylindole (DAPI; 1:1000) for 2 min to stain nuclei. DAPI was
removed by washes with wash buffer B and cells were subsequently imaged in wash buffer B.
ImagingCells were selected based on the MAP2, DAPI and PLA signals. Criteria for choosing cells were
healthy appearance judged by MAP2 staining (no swelling of dendrites or fragmented pattern) and
homogeneous DAPI staining. As the PLA signal was very heterogeneous between different neurons,
for each time point the whole dish was inspected and the cells with the overall highest puncta num-
ber were selected for each time point. All images for one experiment were acquired within 12 hr
after the PLA procedure. Images were acquired with a LSM880 confocal microscope
(Zeiss, Oberkochen, Germany) using a 40�/1.4-NA oil objective (Plan Apochromat 40�/1.3 oil DIC
UV-IR M27) and a pinhole setting of 29 mm. The lasers were used at 0.8% (488 nm), 0.9% (561 nm)
and 2.8% (405 nm) power. Images were acquired in 12-bit mode as z stacks with 2,048 � 2,048–pixel
xy resolution through the entire thickness of the cell, pixel dwell times of 0.26 ms and the detector
gain in each channel adjusted to cover the full dynamic range but to avoid saturated pixels. Imaging
conditions were held constant within an experiment.
Image data processing and analysisThe number of puncta was assessed using custom built Matlab scripts (Tuchev, 2017; code available
at https://github.molgen.mpg.de/MPIBR/NeuroBits; copy archived at https://github.com/elifescien-
ces-publications/MPIBR-NeuroBits) and revised manually. Puncta were detected in neuronal somata
by finding local intensity maxima in the PLA channel. The mean puncta number per neuron was plot-
ted over time and fitted by a first order exponential function. This function was used to calculate the
protein half-life. Representative cell somata were cropped and the puncta channel was thresholded,
dilated once and smoothened to improve puncta visualization in figures. The threshold value was
kept constant for all images (Figure 2A). Puncta numbers for all analyzed neurons are presented in
Figure 2B and Figure 2—source data 1. Ln transformed mean puncta numbers were fit by a linear
function and the protein half-life was calculated as described above.
AcknowledgementsWe thank I Bartnik, N Fuerst, A Staab and C Thum for the preparation of primary cell cultures and F.
Rupprecht for MS maintenance and assistance with data acquisition. EMS is funded by the Max
Planck Society and DFG CRC 1080: Molecular and Cellular Mechanisms of Neural Homeostasis and
DFG CRC 902: Molecular Principles of RNA-based Regulation. This project has received funding
from the European Research Council (ERC) under the European Union’s Horizon 2020 research and
innovation programme (grant agreement No 743216).
Additional information
Funding
Funder Grant reference number Author
Horizon 2020 Framework Pro-gramme
743216 Erin M Schuman
Max-Planck-Gesellschaft Open-access funding Erin M Schuman
The funders had no role in study design, data collection and interpretation, or the
decision to submit the work for publication.
Dorrbaum et al. eLife 2018;7:e34202. DOI: https://doi.org/10.7554/eLife.34202 20 of 24
Research article Cell Biology Neuroscience

Author contributions
Aline R Dorrbaum, Data curation, Formal analysis, Visualization, Writing—review and editing; Lisa
Kochen, Formal analysis, Visualization, Writing—review and editing; Julian D Langer, Conceptualiza-
tion, Data curation, Formal analysis, Supervision, Writing—review and editing; Erin M Schuman, Con-
ceptualization, Supervision, Writing—original draft, Writing—review and editing
Author ORCIDs
Aline R Dorrbaum http://orcid.org/0000-0002-1178-7078
Julian D Langer http://orcid.org/0000-0002-5190-577X
Erin M Schuman http://orcid.org/0000-0002-7053-1005
Ethics
Animal experimentation: All experiments were carried out with the approval of the German animal
experiment authorities.
Decision letter and Author response
Decision letter https://doi.org/10.7554/eLife.34202.036
Author response https://doi.org/10.7554/eLife.34202.037
Additional files
Supplementary files. Supplementary file 1. Half-lives, rate constants, standard errors and coefficients of determination
for all proteins in all culture types.
DOI: https://doi.org/10.7554/eLife.34202.029
. Supplementary file 2. MS parameters.
DOI: https://doi.org/10.7554/eLife.34202.030
. Supplementary file 3. Sample tables and MaxQuant parameter sets.
DOI: https://doi.org/10.7554/eLife.34202.031
. Transparent reporting form
DOI: https://doi.org/10.7554/eLife.34202.032
Data availability
All proteomics data associated with this manuscript have been uploaded to the PRIDE online reposi-
tory (identifier: PXD008596).
The following previously published dataset was used:
Author(s) Year Dataset title Dataset URL
Database, license,and accessibilityinformation
Dorrbaum AR, Ko-chen L, Langer JD,Schuman EM
2018 Local and global influences onprotein turnover in neurons andglia.
https://www.ebi.ac.uk/pride/archive/projects/PXD008596
Publicly available atEBI PRIDE (accessionno. PXD008596)
ReferencesAakalu G, Smith WB, Nguyen N, Jiang C, Schuman EM. 2001. Dynamic visualization of local protein synthesis inhippocampal neurons. Neuron 30:489–502. DOI: https://doi.org/10.1016/S0896-6273(01)00295-1, PMID: 11395009
Adam-Vizi V, Chinopoulos C. 2006. Bioenergetics and the formation of mitochondrial reactive oxygen species.Trends in Pharmacological Sciences 27:639–645. DOI: https://doi.org/10.1016/j.tips.2006.10.005,PMID: 17056127
Ahmad K, Henikoff S. 2002. The histone variant H3.3 marks active chromatin by replication-independentnucleosome assembly. Molecular Cell 9:1191–1200. DOI: https://doi.org/10.1016/S1097-2765(02)00542-7,PMID: 12086617
Dorrbaum et al. eLife 2018;7:e34202. DOI: https://doi.org/10.7554/eLife.34202 21 of 24
Research article Cell Biology Neuroscience

Alvarez-Castelao B, Schanzenbacher CT, Hanus C, Glock C, Tom Dieck S, Dorrbaum AR, Bartnik I, Nassim-AssirB, Ciirdaeva E, Mueller A, Dieterich DC, Tirrell DA, Langer JD, Schuman EM. 2017. Cell-type-specific metaboliclabeling of nascent proteomes in vivo. Nature Biotechnology 35:1196–1201. DOI: https://doi.org/10.1038/nbt.4016, PMID: 29106408
Bachmair A, Finley D, Varshavsky A. 1986. In vivo half-life of a protein is a function of its amino-terminal residue.Science 234:179–186. DOI: https://doi.org/10.1126/science.3018930, PMID: 3018930
Beck M, Hurt E. 2017. The nuclear pore complex: understanding its function through structural insight. NatureReviews Molecular Cell Biology 18:73–89. DOI: https://doi.org/10.1038/nrm.2016.147, PMID: 27999437
Bertram K, Agafonov DE, Dybkov O, Haselbach D, Leelaram MN, Will CL, Urlaub H, Kastner B, Luhrmann R,Stark H. 2017. Cryo-EM Structure of a Pre-catalytic Human Spliceosome Primed for Activation. Cell 170:701–713. DOI: https://doi.org/10.1016/j.cell.2017.07.011, PMID: 28781166
Boisvert FM, Ahmad Y, Gierlinski M, Charriere F, Lamont D, Scott M, Barton G, Lamond AI. 2012. A quantitativespatial proteomics analysis of proteome turnover in human cells. Molecular & Cellular Proteomics 11:M111.011429. DOI: https://doi.org/10.1074/mcp.M111.011429, PMID: 21937730
Cagalinec M, Safiulina D, Liiv M, Liiv J, Choubey V, Wareski P, Veksler V, Kaasik A. 2013. Principles of themitochondrial fusion and fission cycle in neurons. Journal of Cell Science 126:2187–2197. DOI: https://doi.org/10.1242/jcs.118844, PMID: 23525002
Cambridge SB, Gnad F, Nguyen C, Bermejo JL, Kruger M, Mann M. 2011. Systems-wide proteomic analysis inmammalian cells reveals conserved, functional protein turnover. Journal of Proteome Research 10:5275–5284.DOI: https://doi.org/10.1021/pr101183k, PMID: 22050367
Cohen LD, Zuchman R, Sorokina O, Muller A, Dieterich DC, Armstrong JD, Ziv T, Ziv NE. 2013. Metabolicturnover of synaptic proteins: kinetics, interdependencies and implications for synaptic maintenance. PLoS One8:e63191. DOI: https://doi.org/10.1371/journal.pone.0063191, PMID: 23658807
Cox J, Mann M. 2008. MaxQuant enables high peptide identification rates, individualized p.p.b.-range massaccuracies and proteome-wide protein quantification. Nature Biotechnology 26:1367–1372. DOI: https://doi.org/10.1038/nbt.1511, PMID: 19029910
Daigle N, Beaudouin J, Hartnell L, Imreh G, Hallberg E, Lippincott-Schwartz J, Ellenberg J. 2001. Nuclear porecomplexes form immobile networks and have a very low turnover in live mammalian cells. The Journal of CellBiology 154:71–84. DOI: https://doi.org/10.1083/jcb.200101089, PMID: 11448991
Dieterich DC, Link AJ, Graumann J, Tirrell DA, Schuman EM. 2006. Selective identification of newly synthesizedproteins in mammalian cells using bioorthogonal noncanonical amino acid tagging (BONCAT). PNAS 103:9482–9487. DOI: https://doi.org/10.1073/pnas.0601637103
Ehlers MD. 2003. Activity level controls postsynaptic composition and signaling via the ubiquitin-proteasomesystem. Nature Neuroscience 6:231–242. DOI: https://doi.org/10.1038/nn1013, PMID: 12577062
Gibbs DJ, Bacardit J, Bachmair A, Holdsworth MJ. 2014. The eukaryotic N-end rule pathway: conservedmechanisms and diverse functions. Trends in Cell Biology 24:603–611. DOI: https://doi.org/10.1016/j.tcb.2014.05.001, PMID: 24874449
Goldberg T, Hecht M, Hamp T, Karl T, Yachdav G, Ahmed N, Altermann U, Angerer P, Ansorge S, Balasz K,Bernhofer M, Betz A, Cizmadija L, Do KT, Gerke J, Greil R, Joerdens V, Hastreiter M, Hembach K, Herzog M,et al. 2014. LocTree3 prediction of localization. Nucleic Acids Research 42:W350–W355. DOI: https://doi.org/10.1093/nar/gku396, PMID: 24848019
Gomes LC, Scorrano L. 2008. High levels of Fis1, a pro-fission mitochondrial protein, trigger autophagy.Biochimica et Biophysica Acta (BBA) - Bioenergetics 1777:860–866. DOI: https://doi.org/10.1016/j.bbabio.2008.05.442, PMID: 18515060
Holt CE, Schuman EM. 2013. The central dogma decentralized: new perspectives on RNA function and localtranslation in neurons. Neuron 80:648–657. DOI: https://doi.org/10.1016/j.neuron.2013.10.036, PMID: 24183017
Jin EJ, Kiral FR, Hiesinger PR. 2018. The where, what, and when of membrane protein degradation in neurons.Developmental Neurobiology 78:283–297. DOI: https://doi.org/10.1002/dneu.22534, PMID: 28884504
Kang H, Schuman EM. 1996. A requirement for local protein synthesis in neurotrophin-induced hippocampalsynaptic plasticity. Science 273:1402–1406. DOI: https://doi.org/10.1126/science.273.5280.1402, PMID: 8703078
Kucharczyk R, Zick M, Bietenhader M, Rak M, Couplan E, Blondel M, Caubet SD, di Rago JP. 2009.Mitochondrial ATP synthase disorders: molecular mechanisms and the quest for curative therapeuticapproaches. Biochimica Et Biophysica Acta (BBA) - Molecular Cell Research 1793:186–199. DOI: https://doi.org/10.1016/j.bbamcr.2008.06.012, PMID: 18620007
Lin DH, Stuwe T, Schilbach S, Rundlet EJ, Perriches T, Mobbs G, Fan Y, Thierbach K, Huber FM, Collins LN,Davenport AM, Jeon YE, Hoelz A. 2016. Architecture of the symmetric core of the nuclear pore. Science 352:aaf1015. DOI: https://doi.org/10.1126/science.aaf1015, PMID: 27081075
Magistretti PJ, Pellerin L. 1999. Astrocytes Couple Synaptic Activity to Glucose Utilization in the Brain.Physiology 14:177–182. DOI: https://doi.org/10.1152/physiologyonline.1999.14.5.177, PMID: 11390847
Martin-Perez M, Villen J. 2017. Determinants and regulation of protein turnover in yeast. Cell Systems 5:283–294. DOI: https://doi.org/10.1016/j.cels.2017.08.008, PMID: 28918244
Mason S. 2017. Lactate shuttles in Neuroenergetics-Homeostasis, allostasis and beyond. Frontiers inNeuroscience 11:43. DOI: https://doi.org/10.3389/fnins.2017.00043, PMID: 28210209
Mathieson T, Franken H, Kosinski J, Kurzawa N, Zinn N, Sweetman G, Poeckel D, Ratnu VS, Schramm M, BecherI, Steidel M, Noh KM, Bergamini G, Beck M, Bantscheff M, Savitski MM. 2018. Systematic analysis of protein
Dorrbaum et al. eLife 2018;7:e34202. DOI: https://doi.org/10.7554/eLife.34202 22 of 24
Research article Cell Biology Neuroscience

turnover in primary cells. Nature Communications 9:689. DOI: https://doi.org/10.1038/s41467-018-03106-1,PMID: 29449567
McShane E, Sin C, Zauber H, Wells JN, Donnelly N, Wang X, Hou J, Chen W, Storchova Z, Marsh JA, VallerianiA, Selbach M. 2016. Kinetic analysis of protein stability reveals age-dependent degradation. Cell 167:803–815.DOI: https://doi.org/10.1016/j.cell.2016.09.015, PMID: 27720452
Mi H, Muruganujan A, Casagrande JT, Thomas PD. 2013. Large-scale gene function analysis with the PANTHERclassification system. Nature Protocols 8:1551–1566. DOI: https://doi.org/10.1038/nprot.2013.092, PMID: 23868073
O’Shea JP, Chou MF, Quader SA, Ryan JK, Church GM, Schwartz D. 2013. pLogo: a probabilistic approach tovisualizing sequence motifs. Nature Methods 10:1211–1212. DOI: https://doi.org/10.1038/nmeth.2646,PMID: 24097270
Pena C, Hurt E, Panse VG. 2017. Eukaryotic ribosome assembly, transport and quality control. Nature Structural& Molecular Biology 24:689–699. DOI: https://doi.org/10.1038/nsmb.3454, PMID: 28880863
Price JC, Guan S, Burlingame A, Prusiner SB, Ghaemmaghami S. 2010. Analysis of proteome dynamics in themouse brain. PNAS 107:14508–14513. DOI: https://doi.org/10.1073/pnas.1006551107, PMID: 20699386
Pulk A, Liiv A, Peil L, Maivali U, Nierhaus K, Remme J. 2010. Ribosome reactivation by replacement of damagedproteins. Molecular Microbiology 75:801–814. DOI: https://doi.org/10.1111/j.1365-2958.2009.07002.x, PMID: 19968789
Purdy MD, Bennett BC, McIntire WE, Khan AK, Kasson PM, Yeager M. 2014. Function and dynamics ofmacromolecular complexes explored by integrative structural and computational biology. Current Opinion inStructural Biology 27:138–148. DOI: https://doi.org/10.1016/j.sbi.2014.08.006, PMID: 25238653
Rabut G, Doye V, Ellenberg J. 2004. Mapping the dynamic organization of the nuclear pore complex insidesingle living cells. Nature Cell Biology 6:1114–1121. DOI: https://doi.org/10.1038/ncb1184, PMID: 15502822
Rappsilber J, Mann M, Ishihama Y. 2007. Protocol for micro-purification, enrichment, pre-fractionation andstorage of peptides for proteomics using StageTips. Nature Protocols 2:1896–1906. DOI: https://doi.org/10.1038/nprot.2007.261, PMID: 17703201
Rosenberg T, Gal-Ben-Ari S, Dieterich DC, Kreutz MR, Ziv NE, Gundelfinger ED, Rosenblum K. 2014. The roles ofprotein expression in synaptic plasticity and memory consolidation. Frontiers in Molecular Neuroscience 7:86.DOI: https://doi.org/10.3389/fnmol.2014.00086, PMID: 25429258
Ruepp A, Waegele B, Lechner M, Brauner B, Dunger-Kaltenbach I, Fobo G, Frishman G, Montrone C, MewesHW. 2010. CORUM: the comprehensive resource of mammalian protein complexes–2009. Nucleic AcidsResearch 38:D497–D501. DOI: https://doi.org/10.1093/nar/gkp914, PMID: 19884131
Savas JN, Toyama BH, Xu T, Yates JR, Hetzer MW. 2012. Extremely long-lived nuclear pore proteins in the ratbrain. Science 335:942. DOI: https://doi.org/10.1126/science.1217421, PMID: 22300851
Schanzenbacher CT, Langer JD, Schuman EM. 2018. Time- and polarity-dependent proteomic changesassociated with homeostatic scaling at central synapses. eLife 7:e33322. DOI: https://doi.org/10.7554/eLife.33322, PMID: 29447110
Schanzenbacher CT, Sambandan S, Langer JD, Schuman EM. 2016. Nascent Proteome Remodeling followingHomeostatic Scaling at Hippocampal Synapses. Neuron 92:358–371. DOI: https://doi.org/10.1016/j.neuron.2016.09.058, PMID: 27764671
Schwartz BE, Ahmad K. 2005. Transcriptional activation triggers deposition and removal of the histone variantH3.3. Genes & Development 19:804–814. DOI: https://doi.org/10.1101/gad.1259805, PMID: 15774717
Sharma K, Schmitt S, Bergner CG, Tyanova S, Kannaiyan N, Manrique-Hoyos N, Kongi K, Cantuti L, Hanisch UK,Philips MA, Rossner MJ, Mann M, Simons M. 2015. Cell type- and brain region-resolved mouse brainproteome. Nature Neuroscience 18:1819–1831. DOI: https://doi.org/10.1038/nn.4160, PMID: 26523646
Sutton MA, Schuman EM. 2006. Dendritic protein synthesis, synaptic plasticity, and memory. Cell 127:49–58.DOI: https://doi.org/10.1016/j.cell.2006.09.014, PMID: 17018276
Tai HC, Schuman EM. 2008. Ubiquitin, the proteasome and protein degradation in neuronal function anddysfunction. Nature Reviews Neuroscience 9:826–838. DOI: https://doi.org/10.1038/nrn2499, PMID: 18931696
tom Dieck S, Kochen L, Hanus C, Heumuller M, Bartnik I, Nassim-Assir B, Merk K, Mosler T, Garg S, Bunse S,Tirrell DA, Schuman EM. 2015. Direct visualization of newly synthesized target proteins in situ. Nature Methods12:411–414. DOI: https://doi.org/10.1038/nmeth.3319, PMID: 25775042
Toyama BH, Savas JN, Park SK, Harris MS, Ingolia NT, Yates JR, Hetzer MW. 2013. Identification of long-livedproteins reveals exceptional stability of essential cellular structures. Cell 154:971–982. DOI: https://doi.org/10.1016/j.cell.2013.07.037, PMID: 23993091
Tuchev G. 2017. NeuroBits. GitHub. https://githubmolgenmpgde/MPIBR/NeuroBitsTyanova S, Temu T, Cox J. 2016a. The MaxQuant computational platform for mass spectrometry-based shotgunproteomics. Nature Protocols 11:2301–2319. DOI: https://doi.org/10.1038/nprot.2016.136, PMID: 27809316
Tyanova S, Temu T, Sinitcyn P, Carlson A, Hein MY, Geiger T, Mann M, Cox J. 2016b. The Perseuscomputational platform for comprehensive analysis of (prote)omics data. Nature Methods 13:731–740.DOI: https://doi.org/10.1038/nmeth.3901, PMID: 27348712
Vinothkumar KR, Montgomery MG, Liu S, Walker JE. 2016. Structure of the mitochondrial ATP synthase fromPichia angusta determined by electron cryo-microscopy. PNAS 113:12709–12714. DOI: https://doi.org/10.1073/pnas.1615902113, PMID: 27791192
Visscher M, De Henau S, Wildschut MHE, van Es RM, Dhondt I, Michels H, Kemmeren P, Nollen EA, BraeckmanBP, Burgering BMT, Vos HR, Dansen TB. 2016. Proteome-wide Changes in Protein Turnover Rates in C. elegans
Dorrbaum et al. eLife 2018;7:e34202. DOI: https://doi.org/10.7554/eLife.34202 23 of 24
Research article Cell Biology Neuroscience

Models of Longevity and Age-Related Disease. Cell Reports 16:3041–3051. DOI: https://doi.org/10.1016/j.celrep.2016.08.025, PMID: 27626671
Vizcaıno JA, Cote RG, Csordas A, Dianes JA, Fabregat A, Foster JM, Griss J, Alpi E, Birim M, Contell J, O’KellyG, Schoenegger A, Ovelleiro D, Perez-Riverol Y, Reisinger F, Rıos D, Wang R, Hermjakob H. 2013. ThePRoteomics IDEntifications (PRIDE) database and associated tools: status in 2013. Nucleic Acids Research 41:D1063–D1069. DOI: https://doi.org/10.1093/nar/gks1262, PMID: 23203882
Voorhees RM, Fernandez IS, Scheres SH, Hegde RS. 2014. Structure of the mammalian ribosome-Sec61 complexto 3.4 A resolution. Cell 157:1632–1643. DOI: https://doi.org/10.1016/j.cell.2014.05.024, PMID: 24930395
Warner JR, McIntosh KB. 2009. How common are extraribosomal functions of ribosomal proteins? Molecular Cell34:3–11. DOI: https://doi.org/10.1016/j.molcel.2009.03.006, PMID: 19362532
Wisniewski JR, Zougman A, Nagaraj N, Mann M. 2009. Universal sample preparation method for proteomeanalysis. Nature Methods 6:359–362. DOI: https://doi.org/10.1038/nmeth.1322, PMID: 19377485
Wohlgemuth I, Lenz C, Urlaub H. 2015. Studying macromolecular complex stoichiometries by peptide-basedmass spectrometry. Proteomics 15:862–879. DOI: https://doi.org/10.1002/pmic.201400466, PMID: 25546807
Wu RS, Tsai S, Bonner WM. 1982. Patterns of histone variant synthesis can distinguish G0 from G1 cells. Cell 31:367–374. DOI: https://doi.org/10.1016/0092-8674(82)90130-1, PMID: 7159927
Xue S, Barna M. 2012. Specialized ribosomes: a new frontier in gene regulation and organismal biology. NatureReviews Molecular Cell Biology 13:355–369. DOI: https://doi.org/10.1038/nrm3359, PMID: 22617470
Dorrbaum et al. eLife 2018;7:e34202. DOI: https://doi.org/10.7554/eLife.34202 24 of 24
Research article Cell Biology Neuroscience