local development area structure plans - gympie …...3 psa consulting (australia) in partnership...
TRANSCRIPT

Local Development Area Structure Plans
East Deep Creek, Victory Heights & Southside
Planning Report23 June 2016

2
This document has been prepared for:
Gympie Regional Council DisclaimerGympie Regional Council (Council) publishes the information in this report as a DRAFT ONLY for stakeholder engagement purposes.
Whilst every effort has been made to ensure the accuracy of information published, Council makes no representations and gives no warranties in relation to the information provided (including accuracy, reliability, completeness, quality, or suitability). The data (including 3rd party sourced data) that underpins the mapping in this draft report is subject to change without notice as additions, improvements and other edits are made.
Council disclaims all responsibility and all liability (including through negligence) for all expenses, losses, damages and costs you might incur as a result of the use of the information in this draft report.
Town Planning Information
The mapping in the draft report does not replace the formal planning scheme maps published on the Gympie Regional Council website and, to the extent of any inconsistency between the draft mapping in this report and the formal planning scheme maps, the formal planning scheme maps prevail. This report is a draft and is not intended to be used for official purposes such as property transactions or settlements. You should NOT rely upon this draft report to make any decisions, and not use this draft report as a basis to decide whether to purchase or finance property.
Contact: Planning Strategy and Major Projects 1300 307 800 29 Channon St, Gympie, QLD, 4570 [email protected].
This document has been prepared by:
3
PSA Consulting (Australia) in partnership with Lat27 and Foresight Partners, has been engaged by Gympie Regional Council, to prepare this Background Report as part of Structure Planning activities for three Local Development Areas (LDAs) within the greater Gympie area.
The LDAs of Southside, Victory Heights and East Deep Creek are identified in the Gympie Regional Council Planning Scheme 2013 (the Planning Scheme), as available for future residential purposes (Southside) and employment purposes (Victory Heights and East Deep Creek). The provisions of the Planning Scheme require an approved Structure Plan to be in place prior to any significant development occurring within each of these LDA Precincts. Development pressures within each of the LDAs, particularly Southside and East Deep Creek, has meant that Council is prioritising the structure planning exercise for each of these LDA Precincts to confirm their development potential.
In early 2016 a series of workshops were held with Council and State government officers to present and discuss the findings of the Draft Background Report. The outcome of these workshops was to revisit the Draft Background Report to incorporate additional areas in the analysis for the Southside and East Deep Creek LDA Precincts. These areas are currently not within the boundaries of the LDA Precincts but have been identified as requiring consideration as part of the structure planning process to ascertain if these areas have the capacity be included in the LDA Precincts. As a result a broader Study Area will be considered for these LDAs. The Study Area for the Victory Heights LDA Precinct remains unchanged and is defined by the LDA boundary.
This revision of the Draft Background Report has resulted in this Planning Report which is intended to establish constraints, opportunities and values for each of the Study Areas and lay the foundation for the remainder of the structure planning exercise. This Report also provides a high level assessment of the available infrastructure networks to provide direction for potential future development. Whilst there may be significant constraints and infrastructure challenges within these areas, some of these can potentially be overcome, particularly for Southside and to a more limited extent, for East Deep Creek. This Planning Report seeks to confirm the impacts of these constraints, so that Council can proceed to the next stages of structure planning with a degree of certainty and an initial understanding of the development potential of each of the Study Areas.
Executive Summary

Gympie Township
Southside Precinct
Southside Study AreaThe Southside Study Area is located west of Gympie CBD between the localities of Nahrunda, Southside and Jones Hill. The Precinct predominantly comprises large rural properties, although there are some localised areas of residential subdivision.
The Southside Study Area is largely bound by the existing urban edge of the suburb of Southside along the eastern boundary, following Eucalyptus Avenue, Watson Road, Koumala Road, Groundwater Road, and Pedersen Road. To the south, the Precinct is bound by roads in the rural landscape around Pie Creek, including Alpha Road, Silva Road and Lawson Road. The western boundary runs along Eel Creek Road and property boundaries in the vicinity of Eel Creek in the north of the Precinct.
The Southside Study Area has a number of discrete parcels of unconstrained land or land where the constraints can be potentially resolved and managed to allow for urban development. These parcels are highly disjointed and while this provides strong opportunity to create discrete residential development pockets that respond to the landform and preserve the natural features and values, it presents a challenge for the provision of infrastructure, particularly sewer and water supply. Areas that are largely unconstrained are generally already earmarked for residential development such as the Sigma development, ‘The Aspect’, which is currently selling on Woodland Drive.
The area around Glastonbury Road is affected by the Q100 flood level and is also understood to have barriers to being serviced by reticulated networks. Any future development in this area will need to respond to the flood risk and also be able to function independently of Council’s reticulated networks until such time as an infrastructure solution becomes available or an infrastructure agreement is adopted with future developers. Alternatively, on site provision of required water and sewer infrastructure may be considered on a case by case basis and where deemed appropriate to the type of residential development sought.
The area east of Groundwater Road and south of the electricity transmission line is heavily vegetated and legislative protection of this vegetation may preclude significant development in this area. While this area has been identified as being well placed for infrastructure provision, the combination of the slope over much of the land being 15% or greater and existing vegetation, may mean that it is not suitable for significant urban development; or that the planning scheme requires amendment to help facilitate suitable development on these lots.
Southside Study Area is considered to be appropriate for residential development and is recommended to progress to the structure planning exercise.

East Deep Creek Precinct
Victory Heights Precinct
Victory Heights Study AreaThe Victory Heights Study Area is the smallest industrial LDA Precinct comprising of approximately 112 hectares, and is of a roughly triangular shape. It is located east of the Gympie CBD in the locality of Victory Heights. The Precinct predominantly comprises large acreage properties, with the western portion of the Precinct (west of Ascot Road), free of development. The Victory Heights Study Area is bounded by Gympie Connection Road along the north and east boundaries, Tin Can Bay Road to the south and the Brisbane to Cairns railway line along the western boundary. Moody Creek traverses the site generally parallel to Ascot Road.
The Victory Heights Study Area has limited unconstrained land available for future development and significant work will be required to develop the unconstrained land within the Precinct, as it is fragmented by flood, vegetation and slope constraints.
Land to the west of Ascot Road is heavily constrained and is also subject to a degree of uncertainty with regard to the construction of the Gympie Bypass as part of the Cooroy to Curra Project. All of the land west of Ascot Road is owned by DTMR and little development is anticipated to occur on the site until the bypass road is constructed, which may not occur within a 10 year time horizon. However, consultation with DTMR may identify some development opportunities within this area.
Land to the east of Ascot Road is largely free of flood impacts and protected vegetation; however it is significantly affected by slope over 10%. As stated in Property Interests – Benchmarks for Queensland Planning Schemes prepared by the Property Council of Australia, land with a slope under 10% is generally sought for industrial development as it significantly limits the burden of cut and fill works on the overall cost of development.
Servicing of the Victory Heights Study Area is anticipated to be a significant challenge and may not occur within the life of the current Planning Scheme, or alternative servicing arrangements may need to be explored.
Victory Heights Study Area is not considered to provide opportunities for significant intensification of industrial uses given the applicable constraints and is not recommended to proceed to the structure planning exercise. Development applications consistent with the current zoning may continue to be considered on a case by case basis where it can be demonstrated that the appropriate infrastructure solutions can be provided.
East Deep Creek Study AreaThe East Deep Creek Study Area comprises an irregularly shaped area of approximately 440 hectares. It is located east of Gympie CBD in the locality of East Deep Creek, east of Monkland. The Study Area comprises densely vegetated areas and large rural properties, with cleared pasture along with established industrial and extractive uses.
The East Deep Creek Study Area is generally bounded by Randwick Road along the northern boundary, the unformed Spada Road along the eastern boundary, Noosa Road, Penny Road and Hall Road to the south and the unformed Fairview Road along the western boundary.
The East Deep Creek Study Area has some unconstrained land available for future development, however it is highly fragmented by flood impacts, protected vegetation, significant slope constraints and the highway corridor. The southern area of the Precinct, around Penny Road, is particularly slope constrained with slopes of greater than 15%.
The land north of East Deep Creek Road is extensively flood constrained and significant work would be required to provide an acceptable level of flood immunity. The established Nolan Meats landholdings are also flood affected, however as a currently operating use within the LDA Precinct, it is assumed that some flood management practices may be in place that mitigate the impact of flooding on their operations.
The largest unconstrained area is currently a tailings dam on the decommissioned mine site, however there may be land contamination matters to be addressed. There is potential for in-filling of this dam to provide relatively flat land for industrial development, however it is anticipated that the cost of in-filling and any rehabilitation works associated with the likely contamination of the Eldorado landholdings will be significant.
East Deep Creek Study Area is considered to be appropriate for industrial development, subject to the resolution of constraints, and is recommended to progress to the structure planning exercise.
6
EXECUTIVE SUMMARY � � � � � � � � � � � � � � � � � � � � � � � � � � 3
1�0 INTRODUCTION � � � � � � � � � � � � � � � � � � � � � � � � 12
1.1 PURPOSE . . . . . . . . . . . . . . . . . . . . . . . . . . . . . . 12
1.2 STUDY AREA AMENDMENTS . . . . . . . . . . . . . 13
2�0 BACKGROUND � � � � � � � � � � � � � � � � � � � � � � � � � 16
3�0 POLICY CONTEXT � � � � � � � � � � � � � � � � � � � � � � 20
3.1 STATE PLANNING POLICY . . . . . . . . . . . . . . . 20
3.2 WIDE BAY BURNETT REGIONAL PLAN 2011 21
3.3 GYMPIE REGIONAL COUNCIL PLANNING SCHEME 2013 . . . . . . . . . . . . . . . . . . . . . . . . . . 23
4�0 SITE ASSESSMENT – SOUTHSIDE PRECINCT 26
4.1 OVERVIEW. . . . . . . . . . . . . . . . . . . . . . . . . . . . . 26
4.2 SITE CHARACTER . . . . . . . . . . . . . . . . . . . . . . . 284.2.1 Topography and Elevation . . . . . . . . . . . . . . . . . 284.2.2 Views . . . . . . . . . . . . . . . . . . . . . . . . . . . . . . . . . . . 284.2.3 Waterways and Flood Risk . . . . . . . . . . . . . . . . . 304.2.4 Vegetation . . . . . . . . . . . . . . . . . . . . . . . . . . . . . . 324.2.5 Infrastructure . . . . . . . . . . . . . . . . . . . . . . . . . . . 324.2.6 Bushfire Hazard . . . . . . . . . . . . . . . . . . . . . . . . . 34
4.3 DEVELOPMENT ACTIVITY . . . . . . . . . . . . . . . . 36
4.4 TRANSPORT NETWORK ASSESSMENT . . . . . 384.4.1 Current State . . . . . . . . . . . . . . . . . . . . . . . . . . . . 384.4.2 Network Challenges . . . . . . . . . . . . . . . . . . . . . . 40
4.5 RETICULATED NETWORKS . . . . . . . . . . . . . . . 424.5.1 Water Supply Network Assessment . . . . . . . . . 424.5.1.1 Current State . . . . . . . . . . . . . . . . . . . . . . . . . . . . . . . . . . . . .424.5.1.2 Network Challenges . . . . . . . . . . . . . . . . . . . . . . . . . . . . . . . .42
4.5.2 Sewerage Network Assessment . . . . . . . . . . . . 434.5.2.1 Current State . . . . . . . . . . . . . . . . . . . . . . . . . . . . . . . . . . . . .434.5.2.2 Network Challenges . . . . . . . . . . . . . . . . . . . . . . . . . . . . . . . .43
4.5.3 Stormwater Network Assessment . . . . . . . . . . 434.5.3.1 Current State . . . . . . . . . . . . . . . . . . . . . . . . . . . . . . . . . . . . .434.5.3.2 Capacity Constraints . . . . . . . . . . . . . . . . . . . . . . . . . . . . . . .43
4.6 OPPORTUNITIES, CONSTRAINTS AND CHALLENGES . . . . . . . . . . . . . . . . . . . . . . . . . . 44
4.6.1 Opportunities . . . . . . . . . . . . . . . . . . . . . . . . . . . 444.6.2 Constraints . . . . . . . . . . . . . . . . . . . . . . . . . . . . . . 444.6.3 Challenges . . . . . . . . . . . . . . . . . . . . . . . . . . . . . . 44
4.7 POTENTIAL DEVELOPMENT AREA . . . . . . . . . 46
4.8 DEVELOPMENT OPTIONS AND CONSIDERATIONS . . . . . . . . . . . . . . . . . . . . . . 48
4.9 RECOMMENDATION . . . . . . . . . . . . . . . . . . . . 49
5�0 SITE ASSESSMENT – EAST DEEP CREEK PRECINCT � � � � � � � � � � � � � � � � � � 52
5.1 OVERVIEW. . . . . . . . . . . . . . . . . . . . . . . . . . . . . 52
5.2 SITE CHARACTER . . . . . . . . . . . . . . . . . . . . . . . 545.2.1 Topography and Elevation . . . . . . . . . . . . . . . . . 545.2.2 Views . . . . . . . . . . . . . . . . . . . . . . . . . . . . . . . . . . . 545.2.3 Waterways and Flood Risk . . . . . . . . . . . . . . . . . 565.2.4 Vegetation . . . . . . . . . . . . . . . . . . . . . . . . . . . . . . 565.2.5 Infrastructure . . . . . . . . . . . . . . . . . . . . . . . . . . . 585.2.6 Bushfire Hazard . . . . . . . . . . . . . . . . . . . . . . . . . 60
5.3 DEVELOPMENT ACTIVITY . . . . . . . . . . . . . . . . 62
5.4 TRANSPORT NETWORK ASSESSMENT . . . . . 645.4.1 Current State . . . . . . . . . . . . . . . . . . . . . . . . . . . . 645.4.2 Network Challenges . . . . . . . . . . . . . . . . . . . . . . 66
5.5 RETICULATED NETWORKS . . . . . . . . . . . . . . . 685.5.1 Water Supply Network Assessment . . . . . . . . . 685.5.1.1 Current State . . . . . . . . . . . . . . . . . . . . . . . . . . . . . . . . . . . . .685.5.1.2 Network Challenges . . . . . . . . . . . . . . . . . . . . . . . . . . . . . . . .68
5.5.2 Sewerage Network Assessment . . . . . . . . . . . . 695.5.2.1 Current State . . . . . . . . . . . . . . . . . . . . . . . . . . . . . . . . . . . . .695.5.2.2 Network Challenges . . . . . . . . . . . . . . . . . . . . . . . . . . . . . . . .69
Contents
Contents

7
GYMPIE REGIONAL COUNCIL – LOCAL DEVELOPMENT AREA STRUCTURE PLANS – PLANNING REPORT
5.5.3 Stormwater Network Assessment . . . . . . . . . . 695.5.3.1 Current State . . . . . . . . . . . . . . . . . . . . . . . . . . . . . . . . . . . . .695.5.3.2 Network Challenges . . . . . . . . . . . . . . . . . . . . . . . . . . . . . . . .69
5.6 OPPORTUNITIES, CONSTRAINTS AND CHALLENGES . . . . . . . . . . . . . . . . . . . . . . . . . . 70
5.6.1 Opportunities . . . . . . . . . . . . . . . . . . . . . . . . . . . 705.6.2 Constraints . . . . . . . . . . . . . . . . . . . . . . . . . . . . . . 705.6.3 Challenges . . . . . . . . . . . . . . . . . . . . . . . . . . . . . . 70
5.7 POTENTIAL DEVELOPMENT AREA . . . . . . . . . 72
5.8 DEVELOPMENT OPTIONS AND CONSIDERATIONS . . . . . . . . . . . . . . . . . . . . . . 74
5.9 RECOMMENDATIONS . . . . . . . . . . . . . . . . . . . 75
6�0 SITE ASSESSMENT – VICTORY HEIGHTS PRECINCT � � � � � � � � � � � � � � � � � � � � � 78
6.1 OVERVIEW. . . . . . . . . . . . . . . . . . . . . . . . . . . . . 78
6.2 SITE CHARACTER . . . . . . . . . . . . . . . . . . . . . . . 806.2.1 Topography and Elevation . . . . . . . . . . . . . . . . . 806.2.2 Views . . . . . . . . . . . . . . . . . . . . . . . . . . . . . . . . . . . 806.2.3 Waterways and Flood Risk . . . . . . . . . . . . . . . . . 816.2.4 Vegetation . . . . . . . . . . . . . . . . . . . . . . . . . . . . . . 816.2.5 Infrastructure . . . . . . . . . . . . . . . . . . . . . . . . . . . 826.2.6 Bushfire Hazard . . . . . . . . . . . . . . . . . . . . . . . . . 83
6.3 DEVELOPMENT ACTIVITY . . . . . . . . . . . . . . . . 84
6.4 TRANSPORT NETWORK ASSESSMENT . . . . . 856.4.1 Current State . . . . . . . . . . . . . . . . . . . . . . . . . . . . 856.4.2 Network Challenges . . . . . . . . . . . . . . . . . . . . . . 86
6.5 RETICULATED NETWORKS . . . . . . . . . . . . . . . 876.5.1 Water Supply Network Assessment . . . . . . . . . 876.5.1.1 Current State . . . . . . . . . . . . . . . . . . . . . . . . . . . . . . . . . . . . .876.5.1.2 Network Challenges . . . . . . . . . . . . . . . . . . . . . . . . . . . . . . . .87
6.5.2 Sewerage Network Assessment . . . . . . . . . . . . 876.5.2.1 Current State . . . . . . . . . . . . . . . . . . . . . . . . . . . . . . . . . . . . .876.5.2.2 Network Challenges . . . . . . . . . . . . . . . . . . . . . . . . . . . . . . . .87
6.5.3 Stormwater Network Assessment . . . . . . . . . . 876.5.3.1 Current State . . . . . . . . . . . . . . . . . . . . . . . . . . . . . . . . . . . . .876.5.3.2 Network Challenges . . . . . . . . . . . . . . . . . . . . . . . . . . . . . . . .88
6.6 OPPORTUNITIES, CONSTRAINTS AND CHALLENGES . . . . . . . . . . . . . . . . . . . . . . . . . . 88
6.6.1 Opportunities . . . . . . . . . . . . . . . . . . . . . . . . . . . 886.6.2 Constraints . . . . . . . . . . . . . . . . . . . . . . . . . . . . . . 886.6.3 Challenges . . . . . . . . . . . . . . . . . . . . . . . . . . . . . . 88
6.7 POTENTIAL DEVELOPMENT AREA . . . . . . . . . 89
6.8 DEVELOPMENT OPTIONS AND CONSIDERATIONS . . . . . . . . . . . . . . . . . . . . . . 91
6.9 RECOMMENDATION . . . . . . . . . . . . . . . . . . . . 91
7�0 ECONOMIC NEED CONSIDERATIONS � � � � � � 94
7.1 RESIDENTIAL . . . . . . . . . . . . . . . . . . . . . . . . . . 94
7.2 INDUSTRIAL . . . . . . . . . . . . . . . . . . . . . . . . . . . 957.2.1 East Deep Creek . . . . . . . . . . . . . . . . . . . . . . . . . 957.2.2 Victory Heights . . . . . . . . . . . . . . . . . . . . . . . . . . 95
8�0 URBAN DESIGN PRINCIPLES � � � � � � � � � � � � � 98
8.1 RESIDENTIAL DEVELOPMENT . . . . . . . . . . . . 988.1.1 Urban Structure and Land Use . . . . . . . . . . . . . 988.1.2 Neighbourhood Design and Structure . . . . . 1008.1.3 Mixed Use Centres, Employment and
Community Services . . . . . . . . . . . . . . . . . . . . . 1028.1.4 Street Movement . . . . . . . . . . . . . . . . . . . . . . . 1038.1.5 Public Transport . . . . . . . . . . . . . . . . . . . . . . . . 1038.1.6 Street Design . . . . . . . . . . . . . . . . . . . . . . . . . . . 1038.1.7 Pedestrian and Cycle Movement . . . . . . . . . . 1048.1.8 Parkland and Open Space . . . . . . . . . . . . . . . . 105
8.2 INDUSTRIAL DEVELOPMENT . . . . . . . . . . . . 1068.2.1 Strategic Objectives . . . . . . . . . . . . . . . . . . . . . 1068.2.2 Urban Structure and Land Use . . . . . . . . . . . . 1078.2.3 Lot Layouts . . . . . . . . . . . . . . . . . . . . . . . . . . . . . 1088.2.4 Employment . . . . . . . . . . . . . . . . . . . . . . . . . . . 1098.2.5 Community . . . . . . . . . . . . . . . . . . . . . . . . . . . . 1098.2.6 Street Movement . . . . . . . . . . . . . . . . . . . . . . . 1098.2.7 Street Types . . . . . . . . . . . . . . . . . . . . . . . . . . . . 1098.2.8 Pedestrian / Cycle Movement . . . . . . . . . . . . . 1098.2.9 Street Design . . . . . . . . . . . . . . . . . . . . . . . . . . . 1108.2.10 Open Space and Public Realm . . . . . . . . . . . . 1118.2.11 On-site Landscaping . . . . . . . . . . . . . . . . . . . . . 1118.2.12 Building Form and Performance . . . . . . . . . . 1118.2.13 Integrated Water Cycle Management . . . . . . 1118.2.14 Energy . . . . . . . . . . . . . . . . . . . . . . . . . . . . . . . . . 1138.2.15 Waste . . . . . . . . . . . . . . . . . . . . . . . . . . . . . . . . . 1138.2.16 Communal Area . . . . . . . . . . . . . . . . . . . . . . . . 113
9�0 RECOMMENDATIONS � � � � � � � � � � � � � � � � � � 117
9.1 SOUTHSIDE STUDY AREA . . . . . . . . . . . . . . . 117
9.2 EAST DEEP CREEK STUDY AREA . . . . . . . . . . 117
9.3 VICTORY HEIGHTS STUDY AREA . . . . . . . . . 117
10�0 NEXT STEPS � � � � � � � � � � � � � � � � � � � � � � � � � � 121
APPENDICES � � � � � � � � � � � � � � � � � � � � � � � � � � � � � � � � � 123
8
FiguresFigure 1: Excerpt from Zoning Map showing LDAs (Source: Gympie Regional Council) . . . . . . . . . . . . . . . . . . . . . . . . . . .16Figure 2: Policy Framework (Source: PSA Consulting) . . . . . . . . . . . . . . . . . . . . . . . . . . . . . . . . . . . . . . . . . . . . . . . . . . . . . . .20Figure 3: Excerpt from Strategic Plan Map 1 (Source: Gympie Regional Council Planning Scheme 2013) . . . . . . . . . . . .22Figure 4: Southside Study Area – Landform (Source: Lat27) . . . . . . . . . . . . . . . . . . . . . . . . . . . . . . . . . . . . . . . . . . . . . . . . . .29Figure 5: Southside Study Area – Natural Features (Source: Lat27) . . . . . . . . . . . . . . . . . . . . . . . . . . . . . . . . . . . . . . . . . . . .31Figure 6: Southside Study Area – Infrastructure (Source: Lat27) . . . . . . . . . . . . . . . . . . . . . . . . . . . . . . . . . . . . . . . . . . . . . .33Figure 7: Southside Study Area – Bushfire Hazard and Flood Hazard (Source: Lat27) . . . . . . . . . . . . . . . . . . . . . . . . . . . .35Figure 8: Southside Study Area – Significant Development Activity (Source: PSA Consulting) . . . . . . . . . . . . . . . . . . . . . .37Figure 9: Southside LDA – Transport Current State (Source: PSA Consulting) . . . . . . . . . . . . . . . . . . . . . . . . . . . . . . . . . . .39Figure 10: Southside LDA – Transport Network Challenges (Source: PSA Consulting) . . . . . . . . . . . . . . . . . . . . . . . . . . . . .41Figure 11: Southside LDA – Constraints (Source: Lat27) . . . . . . . . . . . . . . . . . . . . . . . . . . . . . . . . . . . . . . . . . . . . . . . . . . . . . .45Figure 12: Potential Development Area Southside LDA (Source: Lat27) . . . . . . . . . . . . . . . . . . . . . . . . . . . . . . . . . . . . . . . . .47Figure 13: East Deep Creek Study Area – Landform (Source: Lat27) . . . . . . . . . . . . . . . . . . . . . . . . . . . . . . . . . . . . . . . . . . . .55Figure 14: East Deep Creek Study Area – Natural Features (Source: Lat27) . . . . . . . . . . . . . . . . . . . . . . . . . . . . . . . . . . . . . .57Figure 15: East Deep Creek Study Area – Infrastructure (Source: Lat27) . . . . . . . . . . . . . . . . . . . . . . . . . . . . . . . . . . . . . . . . .59Figure 16: East Deep Creek Study Area – Bushfire Hazard and Flood Hazards (Source: Lat27) . . . . . . . . . . . . . . . . . . . . .61Figure 17: East Deep Creek Study Area – Significant Development Activity (Source: PSA Consulting) . . . . . . . . . . . . . . . .63Figure 18: East Deep Creek Study Area – Current Transport Network (Source: PSA Consulting) . . . . . . . . . . . . . . . . . . . .65Figure 19: East Deep Creek LDA – Transport Network Challenges (Source: PSA Consulting) . . . . . . . . . . . . . . . . . . . . . . .67Figure 20: East Deep Creek Study Area – Constraints (Source: Lat27) . . . . . . . . . . . . . . . . . . . . . . . . . . . . . . . . . . . . . . . . . . .71Figure 21: Potential Development Area East Deep Creek Study Area (Source: Lat27) . . . . . . . . . . . . . . . . . . . . . . . . . . . . .73Figure 22: Victory Heights Study Area - Landform (Source: Lat27) . . . . . . . . . . . . . . . . . . . . . . . . . . . . . . . . . . . . . . . . . . . . . .80Figure 23: Victory Heights Study Area – Natural Features (Source: Lat27) . . . . . . . . . . . . . . . . . . . . . . . . . . . . . . . . . . . . . . .81Figure 24: Victory Heights Study Area – Infrastructure (Source: Lat27) . . . . . . . . . . . . . . . . . . . . . . . . . . . . . . . . . . . . . . . . . .82Figure 25: Victory Heights Study Area – Bushfire Hazard and Flood Hazard (Source: Lat27) . . . . . . . . . . . . . . . . . . . . . . . .83Figure 26: Victory Heights Study Area – Existing Development Activity (Source: PSA Consulting) . . . . . . . . . . . . . . . . . . .84Figure 27: Victory Heights Study Area – Current Transport Network (Source: PSA Consulting) . . . . . . . . . . . . . . . . . . . . .85Figure 28: Victory Heights Study Area – Transport Network Challenges (Source: PSA Consulting) . . . . . . . . . . . . . . . . . . .86Figure 29: Victory Heights Study Area – Constraints (Source: Lat27) . . . . . . . . . . . . . . . . . . . . . . . . . . . . . . . . . . . . . . . . . . . .89Figure 30: Potential Development Area Victory Heights LDA (Source: Lat27) . . . . . . . . . . . . . . . . . . . . . . . . . . . . . . . . . . . . .90Figure 31: Residential Example - Urban Structure and Land Use (Source: Lat27) . . . . . . . . . . . . . . . . . . . . . . . . . . . . . . . . .99Figure 32: Residential Example – Neighbourhood Design and Structure (Source: Lat27) . . . . . . . . . . . . . . . . . . . . . . . . .101Figure 33: Residential Example – Mixed Use Centre, Employment and Community (Source: Lat27) . . . . . . . . . . . . . . . .102Figure 34: Residential Example – Movement and Connectivity (Source: Lat27) . . . . . . . . . . . . . . . . . . . . . . . . . . . . . . . . . .103Figure 35: Residential Example – Pedestrian and Cycle Movement (Source: Lat27) . . . . . . . . . . . . . . . . . . . . . . . . . . . . . .104Figure 36: Example of Residential – Parkland and Open Space . . . . . . . . . . . . . . . . . . . . . . . . . . . . . . . . . . . . . . . . . . . . . . .105Figure 37: Industrial Examples – Caloundra Industrial Park (Source: Lat27) . . . . . . . . . . . . . . . . . . . . . . . . . . . . . . . . . . . .107Figure 38: Industrial Examples – CitiSwitch (Source: Lat27) . . . . . . . . . . . . . . . . . . . . . . . . . . . . . . . . . . . . . . . . . . . . . . . . . .108Figure 39: Industrial Examples – Redlands Business Park (Source: Lat27) . . . . . . . . . . . . . . . . . . . . . . . . . . . . . . . . . . . . . .110Figure 40: Urban Design Demonstration – Mitchell Eco Industrial Estate (Source: Lat27) . . . . . . . . . . . . . . . . . . . . . . . . .112
List of Acronyms DTMR Department of Transport and Main RoadsLDA Local Development AreaLGIP Local Government Infrastructure Plan
PIA Priority Infrastructure AreaSPP State Planning PolicyWSUD Water Sensitive Urban Design

9
GYMPIE REGIONAL COUNCIL – LOCAL DEVELOPMENT AREA STRUCTURE PLANS – PLANNING REPORT


1.0Introduction
12
1.0 INTRODUCTIONPSA Consulting Australia, in partnership with Lat27 and Foresight Partners, has been engaged by Gympie Regional Council, to prepare this Planning Report as part of structure planning activities for three Local Development Areas (LDAs) within the greater Gympie area.
1.1 PURPOSEThe LDAs of Southside, Victory Heights and East Deep Creek are identified in the Gympie Regional Council Planning Scheme 2013 (the Planning Scheme), as available for future residential purposes (Southside) and employment purposes (Victory Heights and East Deep Creek). The provisions of the Planning Scheme require an approved Structure Plan to be in place prior to any significant development occurring within each of these LDA Precincts. Development pressures within each of the LDAs, particularly Southside and East Deep Creek, has meant that Council is prioritising the structure planning exercise for each of these LDA Precincts to confirm their development potential. Structure planning will ensure that future development in these emerging urban areas:
• appropriately addresses geographical constraints;
• protects environmental and cultural heritage values;
• integrates with existing or approved development in the surrounding area;
• provides appropriate road, cycleway, pedestrian or open space linkages with satisfactory internal connectivity and integration with surrounding development;
• provides for major stormwater flow paths through the site;
• protects floodplains and water quality;
• provides necessary physical infrastructure;
• achieves an appropriate level of amenity and safety for adjoining land uses; and
• achieves an appropriate hierarchy and distribution of industrial land uses.
This Planning Report is intended to establish constraints, opportunities and values for each of the LDAs to confirm the development potential for each LDA and lay the foundation for the remainder of the structure planning process. This Report also provides a high level assessment of the land use considerations and available infrastructure networks to provide direction for the structure planning exercise.
There are opportunities, constraints and challenges associated with all three of the LDAs. This Background Report seeks to confirm the impacts of these constraints, so that Council can proceed to the next stages of structure planning with a degree of certainty and an initial understanding of the development potential of each of the LDAs. The Report will also identify if it is appropriate for the LDA to proceed to the next stages of structure planning at this time.
Each LDA is a large broad-hectare area where the resolution of constraints and confirmation of servicing implications will provide a strong platform for Council and relevant State agencies to assess the appropriateness of each LDA for its intended development purpose. Preparation of a structure plan provides the ability to incorporate sustainable development principles, particularly in relation to infrastructure, and in promoting an orderly pattern for development. Through an effective structure planning process, Council will be able to ensure sustainability in terms of responsibly managing population and employment growth to respond to the identified opportunities and constraints of the LDAs, whilst protecting the key values of each LDA.
1.0 INTRODUCTION
13
GYMPIE REGIONAL COUNCIL – LOCAL DEVELOPMENT AREA STRUCTURE PLANS – PLANNING REPORT
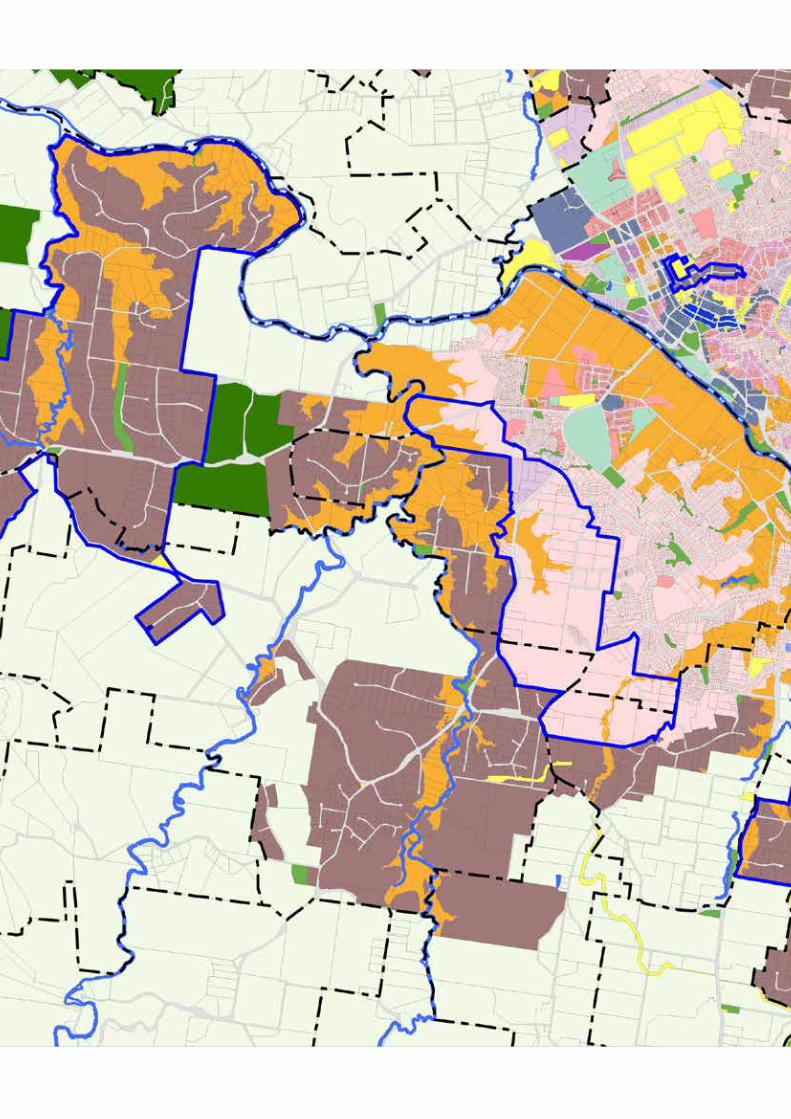
1.2 STUDY AREA AMENDMENTSAdditional areas, beyond the LDA boundaries, have been included in the analysis for the Southside and East Deep Creek LDA Precincts. These areas have been identified as requiring consideration as part of the structure planning process to ascertain if they have the capacity to be included in the LDA Precincts. As a result, Study Areas broader than the LDA boundaries for Southside and East Deep Creek will be considered for this Planning Report. The Study Area boundary for Southside incorporates a lot to the north of the LDA boundary, between Stumm Road and the lot boundary. The Study Area for East Deep incorporates lots to the south of the LDA straddling the North Coast Rail Line between Noosa Road and Hall Road / Langton Road. The Study Area for the Victory Heights LDA Precinct remains unchanged and is defined by the LDA boundary.
As a result of these boundary changes and comments from Council and State government officers, the Draft Background Report has been revisited and reissued as this Planning Report.


2.0Background

16
2.0 BACKGROUNDThe city of Gympie is located within the Gympie Regional Council local government area at the southern end of the Wide Bay Burnett Region. Gympie is recognised as a Major Regional Activity Centre in the Wide Bay Burnett Regional Plan 2011 and is the key regional centre for the southern part of the Wide Bay Burnett region and some northern-most areas of the South East Queensland Region. Gympie is bisected by the Mary River and the Bruce Highway which creates two distinct areas of urban settlement, Gympie (eastern side) and Southside. The eastern side is extensively developed for commercial, industrial and residential purposes and accommodates a majority of the key services for the area around the CBD. Contemporary housing estates supported by some smaller scale commercial activities are established in Southside.
The Gympie Regional Council area has an approximate area of 690,000 hectares and is located less than 150km north of Brisbane and is in close proximity to the Sunshine Coast. The estimated resident population of the area is 48,400 people as at June 2014 (QGSO).
There are three Precincts that this structure planning project is looking at. The East Deep Creek and Victory Heights LDA Precincts are designated as additional low, medium and/or high impact industry zoned land for the region. The Southside LDA Precinct is designated as additional residential land for the region with some low impact industry zoned land on and around Exhibition Road. These LDA Precincts are all identified in Figure 1.
Figure 1: Excerpt from Zoning Map showing LDAs (Source: Gympie Regional Council)
2.0 BACKGROUND

17
GYMPIE REGIONAL COUNCIL – LOCAL DEVELOPMENT AREA STRUCTURE PLANS – PLANNING REPORT
Gympie’s settlement pattern has developed as a consequence of the unique natural constraints of the local topography. Gympie is characterised by a number of industrial locations. Gympie is further characterised by a relatively low residential density. Gympie is an historic gold mining town, most lots are hilly and were mining homesteads. Most people live in houses on relatively large lots, with most recent development occurring in the suburb of Southside. Lots in the Southside LDA are generally around 2,000m² to allow for the inclusion of septic tanks on site. As a result, a culture has developed where people purchasing in Southside seek these larger lots. A range of living options are available, however further opportunities exist to establish a more compact settlement pattern, comprising a range of multiple dwellings and small lot housing, in close proximity to centres, services and infrastructure.
Urban expansion opportunities for residential and employment purposes were recognised in the Planning Scheme Study 2009 – Summary Report prepared for Gympie Regional Council by GHD and the raft of supporting studies informing the Report.
Urban expansion for residential uses were recognised in the Gympie Planning Study – Residential and Rural Residential Study prepared by Buckley Vann in February 2010. The Study recommended a number of options for urban expansion in Southside across a number of areas including land south of Glastonbury Road, bound by Watson Road and Eel Creek Road, surrounding Groundwater Road and bound by Silva Road. These areas were identified as being appropriate for low density residential development in the long term. The boundary of the Southside Precinct follows closely the collective boundary of the growth areas identified by the 2010 Residential and Rural Residential Study.
The Southside Local Development Area Precinct has the potential to accommodate significant future residential growth in the medium to longer term, however to ensure the viable and efficient use of the land, structure planning is required to be undertaken prior to any significant development occurring.
The Gympie Region Industrial Land Strategy – Final Report prepared by HRP in 2009, stated that Gympie city was facing a significant shortage of suitably zoned unconstrained industrial land. The Report outlined that between 33 and 62 hectares of additional industrial zoned land was required by 2016 to service the expected population and employment growth rates. The emerging concentration of larger scale and higher impact industry around Glanmire is logical from the perspective of geography and transport, so its expansion is facilitated, including a logical extension to the north, following the Bruce Highway bypass route. However, a need was established for further land to be provided to accommodate the growth in this sector and through the Gympie Regional Council Planning Scheme 2013, a number of properties were re- zoned as low, medium and high impact industry.
Land within the Victory Heights Local Development Area Precinct has the potential for low impact industrial uses to be located west of Ascot Road and medium impact industrial uses to the east. Land within the East Deep Creek Local Development Area Precinct has the potential for a mix of some low, but mainly medium and high impact industrial uses, subject to sufficient buffering of surrounding non-industrial land uses. Structure planning is required to be undertaken within these LDA precincts, prior to any significant industrial development occurring, to ensure the viable and efficient use of the land.


3.0Policy Context

20
3.0 POLICY CONTEXTThe LDAs are identified within the Gympie Regional Council Planning Scheme 2013 which sits within a policy context that has a line of sight to the State planning legislation as shown in Figure 2.
Figure 2: Policy Framework (Source: PSA Consulting)
3.1 STATE PLANNING POLICYThe State Planning Policy (SPP) is the leading statutory planning instrument in Queensland and defines the State Government’s policies about matters of State interest in land use planning and development. Prior to the commencement of the single State Planning Policy in 2013, State interests were represented in individual State Planning Policies.
The Gympie Regional Council Planning Scheme 2013 is identified as having appropriately reflected the now superseded SPPs listed below:
• TSPP2/12 Planning for prosperity;
• SPP5/10 Air, noise and hazardous materials;
• SPP3/10 Acceleration of compliance assessment;
• SPP2/07 Protection of extractive resources;
• SPP1/07 Housing and residential development;
• SPP2/02 Planning and managing development involving acid sulfate soils; and
• SPP1/03 Mitigating the adverse impacts of flood, bushfire and landslide (in relation to flood and bushfire only).
As a result, the Planning Scheme is generally considered to meet the broad principles of the current SPP. The investigation of the Study Areas as part of the structure planning exercise will be undertaken with consideration of the provisions of the current State Planning Policy, to ensure that the final structure plan and any subsequent development within each LDA generally meet the principles of the State Planning Policy.
The structure planning exercise will be undertaken having regard to the State interests that exist across the three LDAs.
3.0 POLICY CONTEXT
Sustainable Planning Act 2009
Gympie Regional Council Planning Scheme
Southside Precinct
East Deep Creek Precinct
Victory Heights Precinct
State Planning Policy Wide Bay Burnett Regional Plan

21
GYMPIE REGIONAL COUNCIL – LOCAL DEVELOPMENT AREA STRUCTURE PLANS – PLANNING REPORT
3.2 WIDE BAY BURNETT REGIONAL PLAN 2011The Wide Bay Burnett Regional Plan 2011 (the Regional Plan), is a statutory instrument under the Sustainable Planning Act 2009. It establishes a clear vision and direction for the Wide Bay Burnett Region and manages regional growth to promote development of the region in the most sustainable way.
Gympie is recognised as a Major Regional Activity Centre in the Regional Plan and is considered a key regional centre for the southern part of the region and far northern parts of South East Queensland. In the Regional Framework of the Regional Plan, East Deep Creek and Victory Heights are recognised as Opportunities for Development Areas for employment purposes, while Southside is recognised as an Opportunity for a Development Area for residential purposes. Under the Regional Plan, Development Areas are secured for delivering medium and long-term growth opportunities in employment and/or residential development. Development Areas are identified as being likely to require infrastructure augmentation to allow for servicing of the areas. Planning of the Development Areas can be initiated by Council, developers or the State government as appropriate. This initiation includes analysing the location and its context, considering local, State and federal government policies and requirements and examining infrastructure needs, staging and timing.
Under the Regional Plan, Southside is identified as a medium to long-term development opportunity to accommodate residential growth, pending comprehensive planning that considers the fragmented nature of the area, potential flooding, and topography constraints. Access across the Mary River is highlighted as a key consideration in the sequencing of development in Southside.
Both East Deep Creek and Victory Heights are recognised as growth areas for industrial activity with the opportunity to build on existing industry such as the Nolan Meats processing plant and the Gympie Eldorado Mine site. A key infrastructure challenge for both of these areas is providing an effective road network, with flood immunity, and connections for sewer in consultation with appropriate stakeholders.

Figure 3: Excerpt from Strategic Plan Map 1 (Source: Gympie Regional Council Planning Scheme 2013)

23
GYMPIE REGIONAL COUNCIL – LOCAL DEVELOPMENT AREA STRUCTURE PLANS – PLANNING REPORT
3.3 GYMPIE REGIONAL COUNCIL PLANNING SCHEME 2013Each of the LDAs are identified in the Strategic Framework of the Gympie Regional Council Planning Scheme 2013. The Local Development Areas are identified as being available either for future residential purposes (Southside), or employment purposes (Victory Heights and East Deep Creek). Each of the LDAs are identified as ‘new urban’ areas and are shown as red in Figure 3 left.
In the Planning Scheme, the Southside Local Development Area is identified as a standalone Precinct within the Residential Living Zone. The Victory Heights and East Deep Creek Local Development Areas are identified as Precincts under the Low Impact Industry Zone and the Medium Impact Industry Zone. East Deep Creek Local Development Area Precinct is also included in the High Impact Industry Zone. The Planning Scheme requires that structure planning for each LDA be undertaken prior to any significant development occurring, to ensure efficient use of the land.
This intent is reflected in the provisions of the applicable Zone Codes where it is recognised that development within the LDAs must be in accordance with a structure plan to ensure development occurs in an appropriate manner.
For the Residential Living Zone Code the following Overall Outcomes are applicable to the Southside Local Development Area Precinct:
a) Development is appropriately coordinated and sequenced in accordance with an approved structure plan to ensure the most effective use of land.
b) Interim development does not compromise the future development potential of the area for urban purposes and uses that are incompatible with residential uses are not established.
c) Development of land is based upon the provision of the full range of urban infrastructure and services, consideration of environmental constraints and desired development pattern for the area.
d) Development is supported by the necessary transport infrastructure which is designed to integrate with existing networks and promotes safe and efficient public transport use.
e) Emerging urban areas are developed in a sustainable manner to reflect the general form of the planning scheme area by integrating development sites, community infrastructure, open space and important natural features.
f) Emerging urban areas provide a mix of housing types to support the diverse and changing housing needs of the prospective community.
g) Significant historical, topographic, landscape and scenic values, as well as natural habitat areas, wildlife corridors, wetlands and waterway corridors are protected and enhanced.
Emerging urban areas provide a high level of residential amenity having regard to traffic, noise, dust, odour, lighting and other locally specific impacts including nearby industrial, agricultural or other incompatible uses.
For the Low Impact Industry Zone Code, the Medium Impact Industry Zone Code and the High Impact Industry Zone Code, the following Overall Outcomes are applicable to the Victory Heights Local Development Area Precinct and/or the East Deep Creek Local Development Area Precinct:
a) Development is appropriately coordinated and sequenced in accordance with an approved structure plan to ensure the most effective use of land.
b) Development of land is based upon the provision of the full range of urban infrastructure and services, consideration of environmental constraints and desired development pattern for the area.
c) Development is supported by the necessary transport infrastructure which is designed to integrate with existing networks and promotes safe and efficient public transport use.
d) Significant topographical and natural features are protected and enhanced.
e) Development provides an appropriate level of amenity having regard to traffic, noise, dust, odour, lighting and other locally specific impacts.

4.0Site Assessment
Southside Precinct
4.0 SITE ASSESSMENT – SOUTHSIDE PRECINCT
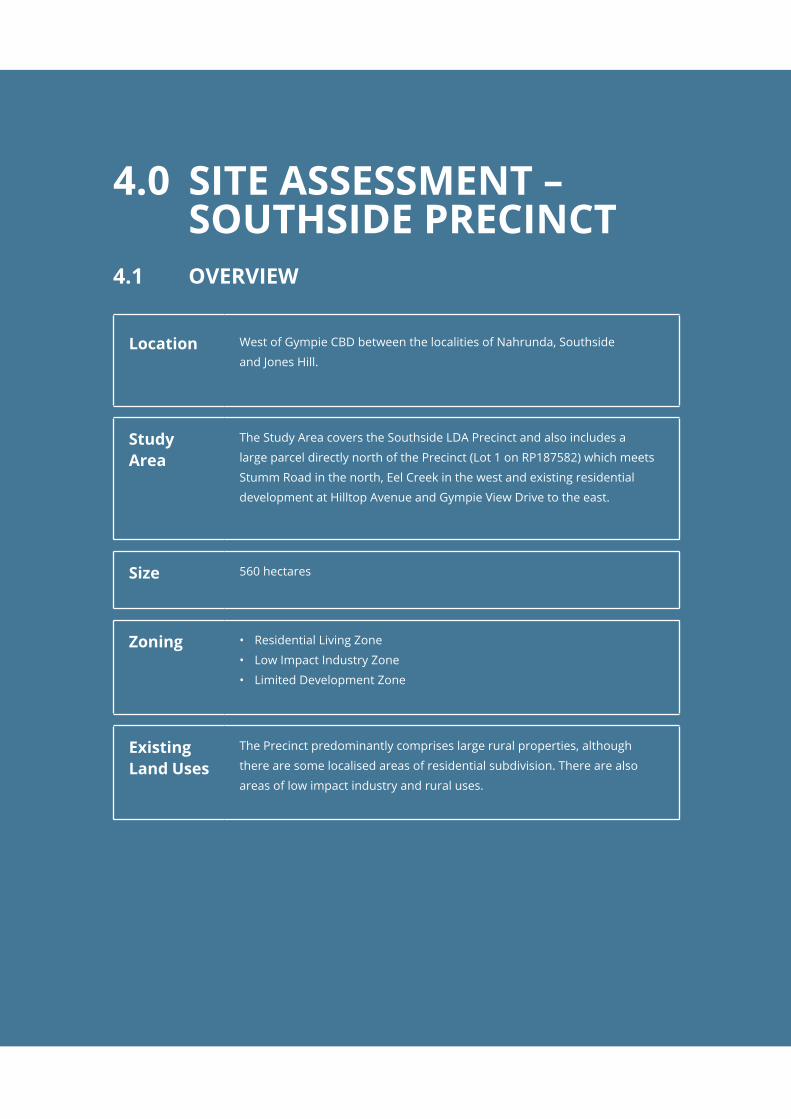
4.1 OVERVIEW
Location West of Gympie CBD between the localities of Nahrunda, Southside
and Jones Hill.
Study Area
The Study Area covers the Southside LDA Precinct and also includes a
large parcel directly north of the Precinct (Lot 1 on RP187582) which meets
Stumm Road in the north, Eel Creek in the west and existing residential
development at Hilltop Avenue and Gympie View Drive to the east.
Size 560 hectares
Zoning • Residential Living Zone
• Low Impact Industry Zone
• Limited Development Zone
Existing Land Uses
The Precinct predominantly comprises large rural properties, although
there are some localised areas of residential subdivision. There are also
areas of low impact industry and rural uses.


28
4.2 SITE CHARACTERThe Southside Study Area is largely bound by the existing urban edge of the suburb of Southside along the eastern boundary, following Eucalyptus Avenue, Watson Road, Koumala Road, Groundwater Road, and Pedersen Road. To the south, the Precinct is bound by roads in the rural landscape around Pie Creek, including Alpha Road, Silva Road and Lawson Road. The western boundary runs along Eel Creek Road and property boundaries in the vicinity of Eel Creek in the north of the Precinct. At the northernmost boundary the Study Area meets Stumm Road and is in proximity to the Mary River.
4.2.1 Topography and Elevation
The Southside Study Area is large, with undulating landforms interspersed by creek gullies and variable topography, ranging from approximately 40m AHD to 120m AHD. There are two significant gully systems with ridges located between these gully systems. A small area in the southernmost part of the Precinct slopes down to McIntosh Creek, which flows in a north-easterly direction to join the Mary River in Cornish Gully close to Monkland. The majority of the Precinct slopes down to an unnamed gully that flows in a north-westerly direction, joining Eel Creek in the north to join the Mary River close to Widgee Crossing. Figure 4 shows the ridgelines and gully systems.
Due to the undulating landform, few areas of the Study Area are flat, with much of the Study Area subject to significant slope. As shown in Figure 4, the sloping land is not confined to discrete areas and is interspersed throughout the Study Area, with the gradients of the sloping land frequently exceeding 10% and over 15% in some parts.
4.2.2 Views
Views from rural roads create a strong rural setting for Gympie and elevated parts of the site are likely to obtain panoramic views across the wider rural landscape. It is anticipated there may be sensitivities associated with rural views obtained from houses located on the urban edge to the east of the area.
4.0 SITE ASSESSMENT – SOUTHSIDE PRECINCT

Figure 4: Southside Study Area – Landform (Source: Lat27)

30
4.2.3 Waterways and Flood Risk
The Southside Study Area is interspersed by small creeks and their tributaries that flow to Pie Creek and Eel Creek which drain to the north and McIntosh Creek that drains to the east. An area in the west of the Study Area within the gully is susceptible to flooding as well as land in the north-east of the Study Area within the valley of Eel Creek. However, apart from these areas, the majority of the Precinct does not fall within the Q100. A network of smaller tributary creeks of Eel Creek further subdivide the landform and there are numerous small farm dams located in the creek valleys.
4.0 SITE ASSESSMENT – SOUTHSIDE PRECINCT

Figure 5: Southside Study Area – Natural Features (Source: Lat27)

32
4.2.4 Vegetation
The Southside Study Area is generally comprised of rural landscapes with considerable tree cover. Bushland is focused on slopes and within creek gullies, while scattered tree cover is found on pastoral lands elsewhere throughout the area. As shown in Figure 5, Areas of MSES Regulated and Significant vegetation are found across the Study Area, particularly around McIntosh Creek in the south-east of the Precinct and the southern part of Pie Creek.
It is noted from workshops with Council officers that the mapping is not a particularly fine grain and may require further ground-truthing through environmental studies.
4.2.5 Infrastructure
There is a regular network of roads throughout the Precinct which are located along the ridgelines such as Watson Road and Eel Creek Road. Watson Road and Eucalyptus Avenue generally define the existing urban edge. Other roads located on elevated cross-valley spurs include Groundwater Road and Lawson Road.
A water main is located along Groundwater Road and Eel Creek Road and serves the new subdivision on Woodland Drive, ‘The Aspect’. There is limited sewage infrastructure, with the only sewer main in the Precinct being associated with the new subdivision on Woodland Drive which is a temporary system and fully committed. An electricity transmission line crosses the site between Groundwater Road and Eel Creek Road, while an electricity distribution line crosses the northern portion of the Precinct from Eucalyptus Avenue.
4.0 SITE ASSESSMENT – SOUTHSIDE PRECINCT

Figure 6: Southside Study Area – Infrastructure (Source: Lat27)

34
4.2.6 Bushfire Hazard
The Southside Study Area includes a mixture of bushfire hazard zones with a range of intensities. The highest bushfire intensity hazard area is located in a small parcel to the east of the area adjacent to the urban edge. The remaining area of the Precinct is covered by a mix of Low and Medium Bushfire Risk as shown in Figure 7. The State government bushfire mapping also includes buffers to bushfire hazard areas which are expected to further impact the Study Area. Bushfire hazard is considered a challenging, yet manageable constraint for the purposes of the opportunities and constraints assessment.
4.0 SITE ASSESSMENT – SOUTHSIDE PRECINCT

Figure 7: Southside Study Area – Bushfire Hazard and Flood Hazard (Source: Lat27)

36
4.3 DEVELOPMENT ACTIVITYThe Southside Study Area is bordered by developed low density residential areas directly to the north and east. Current uses within the Study Area range from low density residential to low impact industry uses and rural uses such as grazing. As shown in Figure 8, an extension of these low density residential uses has occurred between Groundwater Road, Eel Creek Road and Lindsay Street as part of an approved residential subdivision along Woodland Drive, marketed by Sigma Developments Pty Ltd as ‘The Aspect’. The full development will have a yield of over 500 lots over the two landholdings. Stage One of the Aspect, which has 24 lots, has been completed. There are several smaller approved residential subdivisions adjacent to the existing low density residential areas at Farmborough Court and Koumala Road and off Lindsay Street and other smaller subdivisions may be located throughout the Study Area.
4.0 SITE ASSESSMENT – SOUTHSIDE PRECINCT

Figure 8: Southside Study Area – Significant Development Activity (Source: PSA Consulting)

38
4.4 TRANSPORT NETWORK ASSESSMENT
4.4.1 Current State
The Southside LDA has an established road network with a mix of rural and urban road types which connects directly to the urban road network of the suburb of Southside, as shown in Figure 9. A majority of the Study Area is located within the Urban Transport Catchment Boundary identified in Council’s Plans for Trunk Infrastructure (PFTI). Eel Creek Road and Groundwater Road are the key north-south road connections through the LDA providing access to Exhibition Road and Mary Valley Road which provide access to crossing points of the Mary River. Watson Road, Eucalyptus Avenue and Glastonbury Road are the key east-west connections through the Study Area and Stumm Road borders the area to the north.
Note: Gympie Regional Council has recently undertaken a review of the LGIP and as a result the road hierarchy shown in Figure 9 and Figure 10 is subject to change. The amendments to the LGIP are currently on public notification. Once notification is complete Council will continue with the process to amend the LGIP. Structure Planning activities will consider any changes to the LGIP as they are formalised.
4.0 SITE ASSESSMENT – SOUTHSIDE PRECINCT

Figure 9: Southside LDA – Transport Current State (Source: PSA Consulting)
40
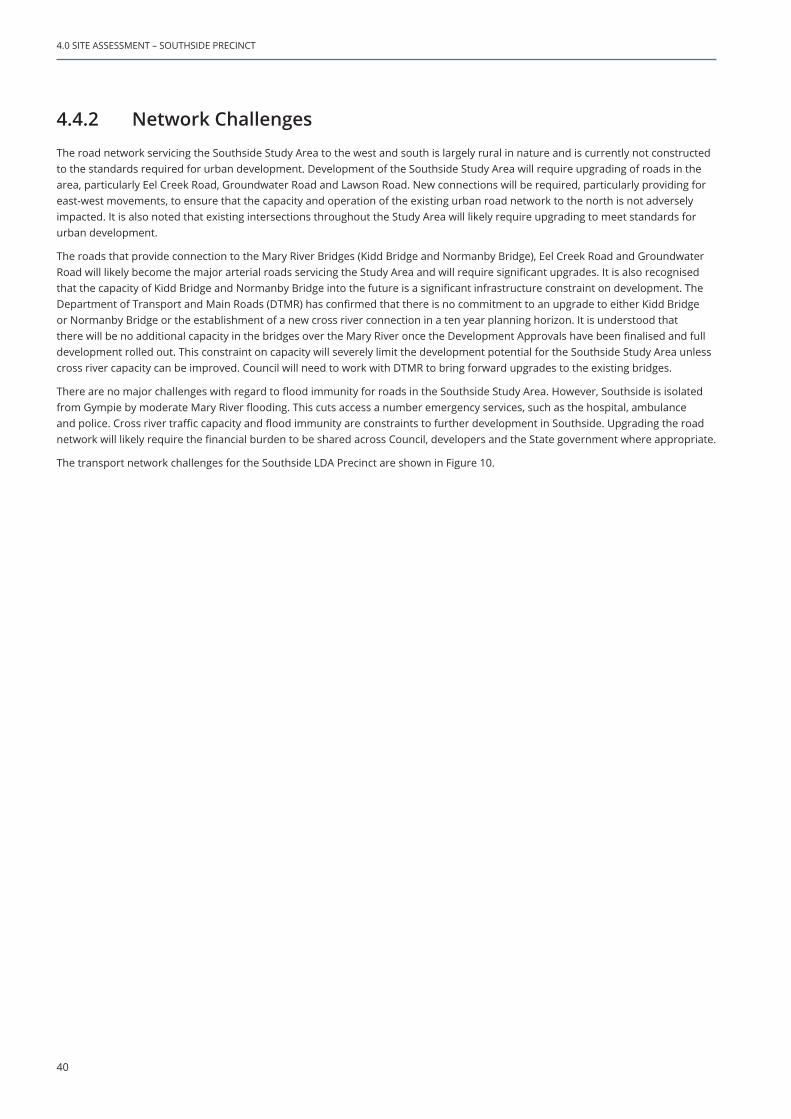
4.4.2 Network Challenges
The road network servicing the Southside Study Area to the west and south is largely rural in nature and is currently not constructed to the standards required for urban development. Development of the Southside Study Area will require upgrading of roads in the area, particularly Eel Creek Road, Groundwater Road and Lawson Road. New connections will be required, particularly providing for east-west movements, to ensure that the capacity and operation of the existing urban road network to the north is not adversely impacted. It is also noted that existing intersections throughout the Study Area will likely require upgrading to meet standards for urban development.
The roads that provide connection to the Mary River Bridges (Kidd Bridge and Normanby Bridge), Eel Creek Road and Groundwater Road will likely become the major arterial roads servicing the Study Area and will require significant upgrades. It is also recognised that the capacity of Kidd Bridge and Normanby Bridge into the future is a significant infrastructure constraint on development. The Department of Transport and Main Roads (DTMR) has confirmed that there is no commitment to an upgrade to either Kidd Bridge or Normanby Bridge or the establishment of a new cross river connection in a ten year planning horizon. It is understood that there will be no additional capacity in the bridges over the Mary River once the Development Approvals have been finalised and full development rolled out. This constraint on capacity will severely limit the development potential for the Southside Study Area unless cross river capacity can be improved. Council will need to work with DTMR to bring forward upgrades to the existing bridges.
There are no major challenges with regard to flood immunity for roads in the Southside Study Area. However, Southside is isolated from Gympie by moderate Mary River flooding. This cuts access a number emergency services, such as the hospital, ambulance and police. Cross river traffic capacity and flood immunity are constraints to further development in Southside. Upgrading the road network will likely require the financial burden to be shared across Council, developers and the State government where appropriate.
The transport network challenges for the Southside LDA Precinct are shown in Figure 10.
4.0 SITE ASSESSMENT – SOUTHSIDE PRECINCT
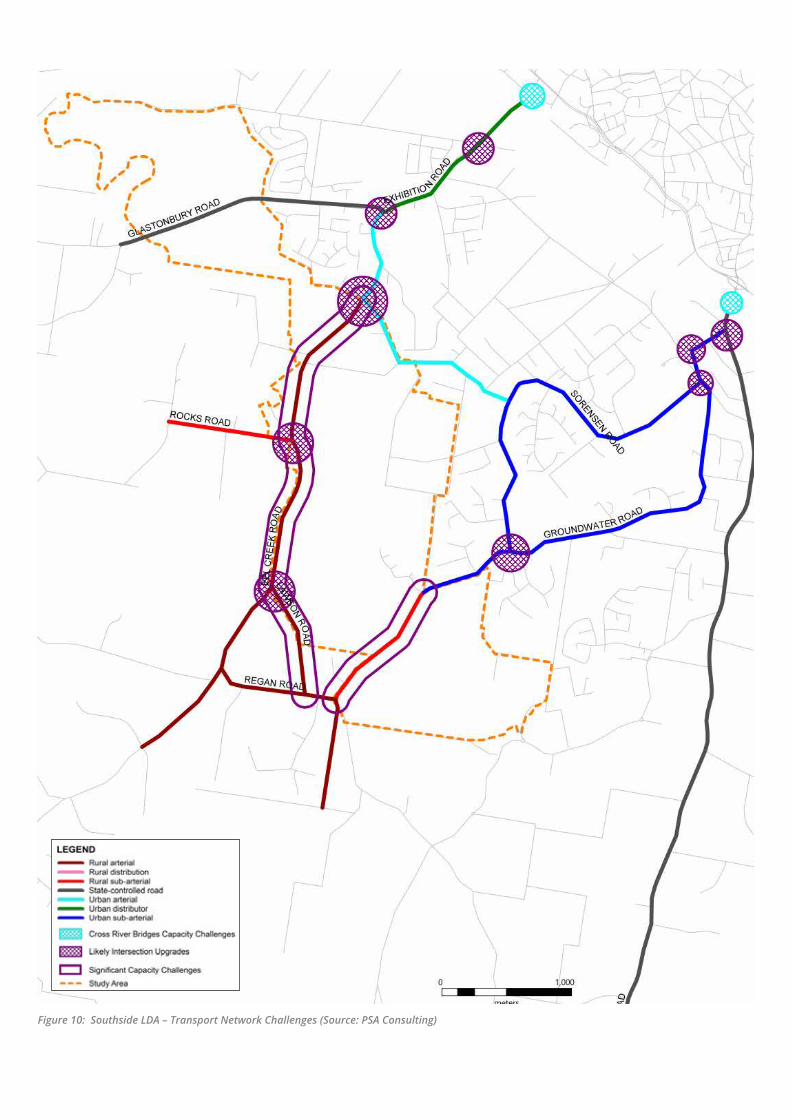
Figure 10: Southside LDA – Transport Network Challenges (Source: PSA Consulting)

42
4.5 RETICULATED NETWORKSThe Southside Study Area is currently serviced by a water main located along Groundwater Road and Eel Creek Road and there is limited sewage infrastructure, with the only sewer main in the Study Area being associated with the new subdivision on Woodland Drive which is a temporary system and fully committed. While the Study Area has limited servicing regarding reticulated networks, it is in proximity to the water supply and sewer networks that service the existing residential areas to the east and north.
The Southside Study Area is located outside of the Priority Infrastructure Area (PIA) and is not addressed in the infrastructure planning undertaken to inform Council’s Local Government Infrastructure Plan (LGIP). This means that servicing of the Study Area is intended to occur outside the life of the LGIP and Council’s Planning Scheme. However, there is a commitment to service the areas around Watson Road and Eucalyptus Avenue by 2024. Areas to the east of the Study Area around Australia Drive and Groundwater Road are anticipated to be serviced within the next 10 years and areas beyond that are anticipated to be serviced beyond 10 years.
4.5.1 Water Supply Network Assessment
4.5.1.1 Current State
The Southside Study Area directly adjoins the water service area and the Water Supply Catchment recognised in Council’s LGIP. Some areas of the Study Area, such as Koala Court, are included within the Water Supply Catchment. There is minimal water supply infrastructure within or in proximity to the Study Area which has any capacity to serve the Southside Study Area.
The area is fed from the Jones Hill Reservoir. It is recognised that there may be some capacity to service some expansion of the urban area. It should also be noted that the Sigma development site, ‘The Aspect’, is likely to draw from this reservoir as the 150mm main along Woodland Drive/Groundwater Road will connect to the reservoir.
4.5.1.2 Network Challenges
While there is some limited capacity in Groundwater Road mains, development of the Study Area will require the upgrade of the water supply network to ensure that reticulated water supply can be provided to any future urban uses. It is likely that a new reservoir will be required and Council is currently investigating a location near the intersection of Groundwater Road and Lawson Road.
The area around Glastonbury Road has similar challenges in terms of water supply. The mains servicing the adjoining urban uses are at the edge of the network. To provide reticulated water supply in this area, considerable work and investment will be required either by Council or negotiated through infrastructure agreements with future developers.
4.0 SITE ASSESSMENT – SOUTHSIDE PRECINCT

43
GYMPIE REGIONAL COUNCIL – LOCAL DEVELOPMENT AREA STRUCTURE PLANS – PLANNING REPORT
4.5.2 Sewerage Network Assessment
4.5.2.1 Current State
Much of the Southside Study Area is not serviced by reticulated sewer, with limited sewerage infrastructure located within the Study Area. The Study Area directly adjoins the Sewer Catchment Area to the north-east and a portion of the Sigma development site, ‘The Aspect’, is within the Catchment Area with a temporary connection.
The pump station located at Koumala Road and the temporary pump station north of ’The Aspect’ residential development on Lindsay Street has some capacity to support further urban development. It is understood that a portion of this spare capacity is earmarked to accommodate the remaining stages of ‘The Aspect’.
There is also a trunk sewer line in proximity to Piccadilly Drive which connects to the existing pump station on the corner of Heilbronn Road and Waldock Road. This trunk sewer has some capacity to service early stages of development in the area of the LDA south of Groundwater Road.
4.5.2.2 Network Challenges
While there is some limited capacity in the pump stations on Koumala Road as well as potential to connect to the trunk main in Piccadilly Drive, development of the Study Area will require significant upgrade of the sewer network to ensure that reticulated sewerage supply can be provided for any future urban uses within the Southside Study Area.
There is potential for a new pump station to be located around Eel Creek Road and Daphne road, similar to the reservoir.
4.5.3 Stormwater Network Assessment
4.5.3.1 Current State
The Southside Study Area is affected by Mary River backwater flooding, in particular the northernmost area of the LDA around Glastonbury Road and along the watercourses running perpendicular to Eel Creek Road between Daphne Street and Rocks Road. The Study Area is also subject to flooding from McIntosh Creek in the south.
Stormwater infrastructure in the Study Area is limited to the formed roads, where some have culvert treatments to mitigate flooding impacts, and ‘The Aspect’ at Woodlands Drive, which has kerb and channel and stormwater management and treatment devices.
4.5.3.2 Capacity Constraints
Significant new stormwater infrastructure will be required across the Study Area to meet standards for urban road construction. Additionally, due to the flood and overland flow impacts in part of the Southside Study Area, water sensitive urban design (WSUD) principles will need to be adopted for development to ensure that stormwater impacts are mitigated whilst providing for catchment wide management.

44
4.6 OPPORTUNITIES, CONSTRAINTS AND CHALLENGESThe opportunities, constraints and challenges for residential development within the Southside Study Area can be summarised as follows:
4.6.1 Opportunities• The majority (approximately 80%) of the site is elevated so should not be inundated by riverine flooding.
• Areas inundated by riverine flooding can contribute to the development of the Study Area for urban (residential) uses as these areas may be suitable for recreation uses.
• The existing road network provides accessibility and a good base for more local access roads.
• The existing road network within the Study Area can be effectively managed with regard to flood immunity.
• The undulating landscape is a positive attribute for sewerage, water supply and stormwater infrastructure.
• The Study Area is able to be serviced by reticulated sewer, water supply and stormwater networks.
• The combined presence of existing vegetation areas and landform provide opportunities to create defined neighbourhoods with a strong sense of place and a transition into rural residential zoned land.
• Residential development is a suitable neighbouring use for the land joining the existing western residential suburbs of Gympie.
• There is an ability to design to maximise views and develop landmarks to enhance visual character.
• The residential development will require supporting land uses such as a local centre which can service the local community.
• Overall, despite significant constraints across parts of the Southside LDA Precinct, there are numerous sizeable parcels of land that may be suitable for the development of residential lots.
4.6.2 Constraints• Some areas of the site are development constrained due to the presence of flood risk zones as shown in Figure 11.
• There is significant MSES zoned Regulated Vegetation areas indicating areas where biodiversity values are expected to exist and these may constrain development.
• Localised areas of land greater than 15% slope exist, where residential development is not supported.
• Constraints are often co-located e.g. steep/flood prone areas are often associated with Regulated Vegetation, making it challenging for these constraints to be resolved to enable the land to be developed in these areas (e.g. within creek corridors generally and in the south of the precinct associated with McIntosh Creek).
4.6.3 Challenges• Integrating WSUD and other stormwater management systems to avoid further encroachment of the flood zone.
• Providing appropriate opportunities to interface with flood constrained land and land that has significant vegetation, including koala habitat.
• Ensuring the interface with Good Quality Agricultural Land surrounding the Study Area is appropriate and provides suitable buffers as required.
• Managing and minimising bushfire hazard through planning and management.
• Ensuring design respects landform and topography to minimise the visual intrusion of excessive cut and fill.
• Managing existing residential views along the western edge of Gympie.
• Encouraging development within the LDA to occur in a sequence that enables effective and efficient delivery of infrastructure.
Figure 11 represents the overall constraints that have the potential to pose a challenge to further development of the Southside LDA Precinct.
4.0 SITE ASSESSMENT – SOUTHSIDE PRECINCT

Figure 11: Southside LDA – Constraints (Source: Lat27)
46
4.7 POTENTIAL DEVELOPMENT AREAA Potential Development Area, shown in Figure 12, has been prepared to provide an indication of land that may provide opportunity for future development as it is largely unconstrained and has challenges that can feasibly be resolved. The Potential Development Area has been calculated as a Net Development Area to provide a snapshot of the areas that can be taken forward into the structure planning exercise. The structure planning exercise will provide for a more detailed investigation of the opportunities for the Potential Development Area.
A Potential Development Area for the Southside Study Area has been identified based on a desktop assessment. The Potential Development Area is preliminary only and has been generated in response to:
• known constraints to future development including Q100 extent, significant and regulated vegetation;
• transmission corridors;
• expansive areas of slope greater than 15% (Southside Precinct);
• accessibility (i.e. potential to gain access via existing or future roads);
• capacity for servicing by reticulated networks (i.e. potential to be serviced by water supply and sewer networks);
• configuration suitable/appropriate for development (i.e. not too thin, no small isolated constraint free land is included); and
• the assumption that bushfire hazard areas are able to be addressed in detailed design and are not considered a constraint.
Please note that:
• all constraint mapping is preliminary only and subject to detailed survey;
• the extent of vegetation to be retained is subject to detailed flora/fauna/environmental assessments;
• the extent of Q100 is subject to detailed flood studies (particularly in the gullies); and
• buffers and setbacks from infrastructure corridors, environmental areas, bushfire hazard areas, overland flow corridors or waterways etc included in Potential Development Areas are subject to detailed site assessments and negotiations with local and state authorities.
4.0 SITE ASSESSMENT – SOUTHSIDE PRECINCT

Figure 12: Potential Development Area Southside LDA (Source: Lat27)

48
4.8 DEVELOPMENT OPTIONS AND CONSIDERATIONSAs shown in Figure 12 the Potential Development Area for the Southside Study Area is contained within two separate areas; one in the north-east of the Study Area around Glastonbury Road, the second larger area is east of Eel Creek Road, around Groundwater Road and north of Silva Road.
The Southside Study Area represents the largest available area for residential development in the Gympie urban area. A majority of the land within the Southside Study Area is in the Residential Living Zone and based on the assessment and analysis undertaken thus far, residential uses are generally considered appropriate in the Study Area. The Study Area has the capacity to accommodate significant additional population growth in a mix of lot sizes and housing types. Planning for this precinct should work to maximise yield to ensure that an appropriate level of urban development, supported by the necessary infrastructure can be supported. The structure planning process will focus on maximising housing yield.
Constraints on development, such as flood, bushfire, slope and regulated vegetation, may result in lower development yields, however Southside is still capable of accommodating significant residential growth.
With the establishment of residential communities within the Study Area additional retail, community and recreational facilities are likely to be required within or near the Study Area to ensure the new residential development has the social infrastructure required to support it. The location of community infrastructure such as schools, places of worship, health care services and aged care services will be considered on a broad scale during the structure planning exercise along with small scale retail uses that may be required to support the residential development. As recognised in the opportunities analysis, the large gully areas, whilst not appropriate for residential development, may be suitable for recreation uses such as passive recreation areas and sporting fields.
The Southside LDA Precinct has a number of discrete parcels of unconstrained land or land where the constraints can be potentially resolved and managed to allow for urban development. These parcels are highly disjointed and while this provides strong opportunity to create discrete residential development pockets that respond to the landform and preserve the natural features and values, it presents a challenge for the provision of infrastructure, particularly sewer and water supply. Areas that are largely unconstrained are generally already earmarked for residential development such as ‘The Aspect’ that is currently selling on Woodland Drive.
The area around Glastonbury Road is significantly affected by the Q100 flood level and there are understood to be some challenges in providing reticulated networks. Future development in this area will need to respond to the flood risk and also be able to function independently of Council’s reticulated networks until such time as an infrastructure solution becomes available. The area east of Groundwater Road and south of the electricity transmission line is heavily vegetated and legislative protection of this vegetation may preclude significant development in this area. While this area has been identified as being well placed for infrastructure provision, the combination of the slope over 15% and vegetation may mean that it is not suitable for significant urban development e.g. 500m2 residential lots.
The existing road network provides a good base for establishing new transport connections required to service the Study Area, with many of the roads likely to play a key role in the future transport network. There are a number of north-south routes through the large Potential Development Area east of Eel Creek Road which will form the base for the future transport network and the additional east-west connections that will be required will likely intersect with these roads.
Due to the large gully the east-west connections may be limited and the potential for a cul-de-sac style, consistent with surrounding residential subdivisions, will need to be considered. These cul-de-sacs may use Koumala Street, Lindsay Street, Australia Drive, Groundwater Road and Silva Road as spines.
The Potential Development Area around Glastonbury Road is accessible via Stumm Road and Glastonbury Road. Opportunity to access through the existing residential areas along Hilltop Avenue and Gympie View Drive is limited so transport connections to the Potential Development Area will need to feed from Stumm Road and Glastonbury Road in a cul-de-sac style of street layout, similar to that of the existing surrounding residential areas. The cul-de-sac road layout also allows for the establishment of discrete residential communities that are responsive to the vegetation and slope constraints.
4.0 SITE ASSESSMENT – SOUTHSIDE PRECINCT

49
GYMPIE REGIONAL COUNCIL – LOCAL DEVELOPMENT AREA STRUCTURE PLANS – PLANNING REPORT
4.9 RECOMMENDATIONIt is recommended that the Southside Study Area progress to the structure planning exercise.
The Southside Study Area represents the largest available area for residential development in the Gympie urban area. A majority of the land within the Southside Study Area is in the Residential Living Zone and based on the assessment and analysis undertaken thus far, residential uses are considered appropriate in the Study Area. Structure planning for the Southside Study Area should also focus on:
• Maximising housing yield to ensure that residential development can be adequately serviced;
• Establishing a base road network for a viable transport system;
• Identifying, at a high level, the reticulated networks required to support residential development in the Study Area;
• Identifying, at a high level, the retail/commercial and social infrastructure requirements and indicative locations for elements such as schools, recreation spaces and small scale retail.


5.0Site Assessment
East Deep Creek Precinct

5.0 SITE ASSESSMENT – EAST DEEP CREEK PRECINCT
5.1 OVERVIEW
Location Approximately 4.5 km south-east of the Gympie CBD and directly east of
Monkland.
Study Area
The Study Area covers the East Deep Creek LDA Precinct and also includes
a number of industrial zoned land parcels to the south of Noosa Road and
straddling the North Coast Rail Line.
Size 440 hectares
Zoning • Low Impact Industry
• Medium Impact Industry
• High Impact Industry
Existing Land Uses
The Study Area includes a range of existing industrial uses such as the
Nolan’s Meats processing plant and the Carter Holt Harvey particleboard
plant. The decommissioned Eldorado Mine site represents a significant
portion of the Study Area and is centrally located in the Study Area.


54
5.2 SITE CHARACTERThe East Deep Creek Study Area comprises an irregularly shaped area of 440 hectares. It is located south-east of Gympie CBD in the locality of East Deep Creek, east of Monkland. The Precinct comprises densely vegetated areas and large rural properties, with cleared pasture along with established industrial and extractive uses.
The East Deep Creek Study Area is generally bounded by Randwick Road along the northern boundary, the unformed Spada Road along the eastern boundary, Hall Road and Penny Road to the south and the partially sealed but largely unformed Fairview Road along the western boundary.
5.2.1 Topography and Elevation
The landform of the East Deep Creek Study Area is broadly undulating with the highest parts of the precinct up to 120m AHD in the south west along Penny Road and Noosa Road. Fairview Hill is located beyond the south-west boundary of the precinct.
The Study Area is divided by a number of low ridgelines with subtle ridges occurring in the south-west, south-east, eastern and northern parts of the precinct. Gullies are located between these ridges including a creek valley in the northern part of the precinct and Rogers Gully which follows the line of the tributary creek in the southwest.
There is a flat area in the centre of the Study Area associated with the large dam associated with the former Gympie Eldorado Gold Mine site. There are also flat areas at the Carter Holt Harvey and Nolan’s sites where large building pads for their plant have been established. Other than that, the majority of the Study Area is sloping, with much of it subject to a slope greater than 10% and a significant area of the Precinct having a slope greater than 15%. These areas particularly occur in the south-east of the LDA, associated with densely vegetated areas along Penny Road, however they occur elsewhere also, as shown in Figure 13.
5.2.2 Views
Rural views from key existing residential estates relate to the Noosa Road area of Monkland, adjacent to the south-west of the East Deep Creek Study Area. A small number of rural properties to the east of the site would also experience views towards the Study Area. There is potential for new gateway views from the bypass of Gympie as part of the Cooroy to Curra Project.
There are few residential properties located within the Precinct, so there are a limited number of potential viewers likely to be concerned by impacts on views.
5.0 SITE ASSESSMENT – EAST DEEP CREEK PRECINCT

Figure 13: East Deep Creek Study Area – Landform (Source: Lat27)

56
5.2.3 Waterways and Flood Risk
Tannery Creek flows east-west in the northern part of the Precinct, joining Deep Creek west of the Study Area boundary. The valley of Tannery Creek and Rogers Gully are susceptible to flooding and fall below the Q100 level.
There is a large existing dam in the centre of the Precinct which occupies a large area of land which has been constructed for the control of effluent from the former Gympie Eldorado Gold Mine and has no notable environmental value. Other drainage lines within the Study Area appear to be unnamed.
The land north of East Deep Creek is significantly flood constrained and work would be required to provide an acceptable level of flood immunity. The Nolan Meats landholding are also flood affected, however as a currently operating use, it is assumed that they have flood management practices in place that mitigate the impact of flooding on their operations.
5.2.4 Vegetation
Much of the East Deep Creek Study Area is covered with dense vegetation, most of which is not protected, however there is an area of MSES Regulated Vegetation and Significant Vegetation in the vicinity of Penny Road/ Spada Road in the southern part of the Precinct. This is reflected in Figure 14.
5.0 SITE ASSESSMENT – EAST DEEP CREEK PRECINCT

Figure 14: East Deep Creek Study Area – Natural Features (Source: Lat27)

58
5.2.5 Infrastructure
There are two main roads that traverse and subdivide the East Deep Creek Study Area. East Deep Creek Road and Noosa Road/Penny Road provide for east-west movement across the northern and southern portions of the Study Area and Flood Road is the key north-south connection which bisects the east and west of the Precinct. Smaller roads serving existing properties within the Study Area include Simpson Road and Randwick Road. The bypass of Gympie as part of the Bruce Highway Upgrade – Cooroy to Curra Project is proposed to pass in a north-south orientation through the site, close to the existing North Coast Rail Line. DTMR proposed an intersection on the future highway at Penny Road. DTMR proposed only north-facing ramps, which means there will be no connection to or from the south. Trips to and from the south will need to be via Penny Road, Noosa Road and Hall Road to the current Bruce Highway. The North Coast Rail Line traverses the western part of the precinct. As shown in Figure 15, an electricity distribution line traverses the southern part of the precinct.
5.0 SITE ASSESSMENT – EAST DEEP CREEK PRECINCT

Figure 15: East Deep Creek Study Area – Infrastructure (Source: Lat27)

60
5.2.6 Bushfire Hazard
Much of the site falls within the Bushfire Hazard Area, with the exception of the area around the large dam in the centre of the site and some cleared areas of pasture in the north and west of the railway line and surrounding existing industrial operations. As shown in Figure 16, a majority of this area is included within the Medium Bushfire Risk Area, while some pockets of land located in the vegetated landscape in the south-eastern portion of the Precinct are identified as High Bushfire Risk. Bushfire hazard is considered a challenging yet manageable constraint for the purposes of the opportunities and constraints assessment.
5.0 SITE ASSESSMENT – EAST DEEP CREEK PRECINCT

Figure 16: East Deep Creek Study Area – Bushfire Hazard and Flood Hazards (Source: Lat27)

62
5.3 DEVELOPMENT ACTIVITYThe East Deep Creek Study Area has a number of established industrial uses located throughout. Significant portions of the Study Area are under the ownership and operation of Nolan Meats and the former Gympie Eldorado Mining (now held by AusRocks), as shown in Figure 17. The Gympie Eldorado Mining landholdings cover the extent of the decommissioned gold mine, which closed in 2008. It represents a major site in the East Deep Creek Study Area and a strategic location to ensure the connectivity of the broader area in terms of infrastructure. Nolan Meats has a processing plant that processes over 2,500 cattle per week on a large landholding north of East Deep Creek Road. Nolan Meats is considered to be a long term occupant in the East Deep Creek Precinct with their purpose-built facility able to support their operations into the future. The Carter Holt Harvey particleboard factory is located in the south of the Study Area on Hall Road/Langton Road and like Nolan Meats is considered to be a long term occupant with a purpose built facility.
There are also a number of smaller industrial developments including transport and plant depots such as Corbet’s Group, McClintock’s Transport and Cooloola Heavy Haulage.
5.0 SITE ASSESSMENT – EAST DEEP CREEK PRECINCT

Figure 17: East Deep Creek Study Area – Significant Development Activity (Source: PSA Consulting)
64
5.4 TRANSPORT NETWORK ASSESSMENT
5.4.1 Current State
The East Deep Creek LDA has an established road network with a mix of rural and urban road types which connects directly to the urban road network to the west of the Precinct as shown in Figure 18.
East Deep Creek Road is the major east-west connection. It is a Rural Arterial which transitions into a Rural Sub-Arterial whilst passing through the Precinct. East Deep Creek Road connects to Tin Can Bay Road via Tyrell Road and Noosa Road and is the main route back into the Gympie CBD and current Bruce Highway. The other east-west connection for the site is Penny Road and Noosa Road which provides access to Hall Road and onto the current Bruce Highway. Hall Road is an Urban Sub-Arterial that connects Noosa Road and the Bruce Highway. The section of Penny Road to Flood Road is classed as a Rural-Sub-Arterial. Noosa Road is a Rural Sub-Arterial for some sections and an Urban Sub-Arterial as it draws closer to the Gympie CBD.
Flood Road is the main north-south route through the Precinct. It is a Rural Arterial connecting Penny Road/Noosa Road and East Deep Creek Road. Other potential north-south connections include Fairview Road which connects Noosa Road and East Deep Creek but is largely unformed, and Spada Road which is an unformed road along the eastern boundary of the Precinct. Randwick Road bounds the northern precinct boundary and is classed as a Rural Sub-Arterial Road. Penny Road has been recently sealed and provides for east-west movements and flood free access to the Gympie CBD and connection to the Bruce Highway.
Note: Gympie Regional Council has recently undertaken a review of the LGIP and as a result the road hierarchy shown in Figures 18 and 19 is subject to change. The amendments to the LGIP are currently on public notification. Once notification is complete Council will continue with the process to amend the LGIP. Structure Planning activities will consider any changes the LGIP as they are formalised.
5.0 SITE ASSESSMENT – EAST DEEP CREEK PRECINCT

Figure 18: East Deep Creek Study Area – Current Transport Network (Source: PSA Consulting)

66
5.4.2 Network Challenges
The road network servicing the East Deep Creek LDA Precinct is largely rural in nature and is not constructed to the standards required for urban development. The current standards of road are considered poor for industrial purposes. Key roads such as East Deep Creek Road, Noosa Road, Penny Road, Flood Road and Hall Road will require upgrading to facilitate industrial uses. Additionally, currently unformed roads such as Fairview Road and Spada Road may require construction. Ensuring the flood immunity of upgraded and new roads is an additional challenge as much of East Deep Creek Road is under Q100, in particular the intersection with Noosa Road onto Tin Can Bay Road. The bridge over the rail corridor on Hall Road presents a major constraint and is currently not able to accommodate B- Doubles.
The bypass of Gympie as part of the Bruce Highway Upgrade – Cooroy to Curra Project, passes directly through the Study Area. At latest planning DTMR is proposing an interchange at Penny Road, however the interchange will only provide northern access. Vehicles wishing to travel south will be required to access the Bruce Highway via Hall Road through the Gympie urban area. This route is not currently available for B-Doubles and will require upgrades, including replacement of the overpass of the North Coast Rail Line on Hall Road
External to the Precinct, the intersection of Tyrrell Road and Noosa Road provides a key constraint to increasing road traffic due to the geometry of the roads and the intersection and the proximity of urban residential development to both of these roads. The intersection of Noosa Road and Brisbane Road (state-controlled) is a significant challenge with high traffic volumes on Brisbane Road and marginal visibility (sight distance) causing delays and some vehicle collisions. The interface with urban residential development along Noosa Road will be a significant challenge moving forward.
Figure 19 indicates the transport network challenges of the East Deep Creek LDA Precinct.
5.0 SITE ASSESSMENT – EAST DEEP CREEK PRECINCT

Figure 19: East Deep Creek LDA – Transport Network Challenges (Source: PSA Consulting)

68
5.5 RETICULATED NETWORKSWithin the Study Area, only the land south of Noosa Road is included within the PIA of Council’s LGIP. The remaining land within the Study Area is not earmarked for infrastructure provision within the life of the LGIP or Council’s Planning Scheme. This presents a challenge in developing the Study Area for industrial purposes as industrial land uses are generally considered to have a high infrastructure load.
5.5.1 Water Supply Network Assessment
5.5.1.1 Current State
A significant majority of the Precinct is outside the Water Supply Catchment identified in Council’s Priority Infrastructure Plan and is largely unserviced by reticulated water supply.
Currently a small reservoir is located on Penny Road between the intersections with Noosa Road and Flood Road. This reservoir connects to a 100mm rising main along Noosa Road that services properties along Noosa Road. There is a limited capacity for mains along Noosa Road and Penny Road to take minimal increases in capacity.
An existing 150mm main runs along East Deep Creek Road to the Nolan Meats landholdings. Nolan’s have restricted access to the water main however it is understood that the main has some spare capacity that potentially could be used to service further industrial development
5.5.1.2 Network Challenges
The lack of water supply infrastructure in or in proximity to the Precinct means that a new network of water supply infrastructure will be required for the Precinct and significant upgrades to the existing network will be needed to create capacity. Council is currently investigating opportunities to locate a new reservoir in the Study Area, at present a location near the intersection of Penny Road and Spade Road is being considered.
5.0 SITE ASSESSMENT – EAST DEEP CREEK PRECINCT

69
GYMPIE REGIONAL COUNCIL – LOCAL DEVELOPMENT AREA STRUCTURE PLANS – PLANNING REPORT
5.5.2 Sewerage Network Assessment
5.5.2.1 Current State
The East Deep Creek Study Area is outside the Sewer Catchment Area identified in Council’s Priority Infrastructure Plan and is unserviced by reticulated sewerage.
The nearest connection point is at the Noosa Road/Brisbane Road intersection, however this is not trunk infrastructure and may not have spare capacity to support development of East Deep Creek. No pump station is currently accessible from the Precinct.
5.5.2.2 Network Challenges
The Study Area cannot utilise any existing sewer mains to allow development and the Precinct can largely not gravity feed to the existing network. As a result, it is likely that a new pump station will be required along with works to increase capacity. It is acknowledged that supply of sewerage infrastructure is a challenge, however if an additional sewerage plant is able to be constructed, a reticulated network that can service the Study Area could be designed.
5.5.3 Stormwater Network Assessment
5.5.3.1 Current State
There is currently no significant stormwater infrastructure within the East Deep Creek Study Area.
Much of Precinct is subject to backwater flooding of Deep Creek by the Mary River. East Deep Creek Road and Randwick Road are below Q100 level which means that significant work would be required to provide flood immunity for these roads. The feasibility of providing flood immunity for East Deep Creek will need to be further explored.
5.5.3.2 Network Challenges
Significant new stormwater infrastructure will be required across the Study Area to meet standards for urban road construction. Additionally, due to the flood and overland flow impacts in part of the Study Area, WSUD principles will need to be adopted for development to ensure that impacts are mitigated, whilst providing for catchment wide management.

70
5.6 OPPORTUNITIES, CONSTRAINTS AND CHALLENGESThe opportunities, constraints and challenges for industrial development within the East Deep Creek Study Area can be summarised as follows:
5.6.1 Opportunities• There is the potential for additional accessibility to the area east of the rail line from planned interchanges with the Gympie
Bypass road as part of the Cooroy to Curra Project.
• The undulating landscape is an advantage for the provision of new sewerage, water and stormwater infrastructure at the appropriate time, commensurate with the need and Council’s LGIP.
• There are opportunities for visual screening and integration created by existing vegetation and landform.
• Most of the LDA Precinct vegetation is not MSES Regulated/Significant.
• There is the opportunity to extend existing water mains and sewer lines to service the site. There is also potential to establish a new pump station to service the LDA.
5.6.2 Constraints• Considerable areas of the LDA Precinct have a slope steeper than 10% and parts are over 15%.
• There is a large parcel in the south-east of the Precinct that is development-constrained by the presence of MSES Regulated Vegetation.
• There is a large area in the north of the site and west of railway line that is constrained by flood risk.
• Key transport routes, such as East Deep Creek Road, do not have the required level of flood immunity to function as urban roads.
• Key transport routes pass through built up residential areas which may exacerbate reverse amenity concerns.
• The existing roads within the Study Area are not of an appropriate standard to accommodate industrial traffic.
• Unconstrained land is located on elevated ridgelines that are already developed and/or are sensitive to visual intrusion.
• Areas of lowest constraint are located in the north, south-west and centre of the precinct. Whilst the centre of the Precinct is currently occupied by the Eldorado Gold Mine dam, this could potentially be in-filled to yield developable land.
• Overall this is a constrained LDA Precinct for industrial development – very few parcels of land are unconstrained by a combination of flood zone/gradient over 10%/MSES Regulated Vegetation; and it is likely that the Eldorado Gold Mine site will require considerable rehabilitation to facilitate its re-use.
5.6.3 Challenges• There is a need to upgrade and expand the existing road network to enhance accessibility and provide flood immunity.
• There is a need to address visual integration and buffering of existing neighbouring properties in the Monkland area south-west of the site and rural properties to the east.
• Ensuring the interface with Good Quality Agricultural Land surrounding the Study Area is appropriate and provides suitable buffers as required.
• There is the difficulty of designing large-scale industrial buildings whilst respecting landform and minimising visual intrusion of excessive cut and fill.
• In-filling and treating the current tailings dam is likely to be a significant undertaking in terms of works and cost.
• The former Eldorado Mine Site may have contamination issues that need to be addressed prior to any development of the site.
• There will be a need to integrate WSUD and other stormwater management systems to avoid further encroachment of the flood zone.
• An appropriate interface with established residential uses along Noosa Road will need to be achieved to avoid impacts on residents. Alternatively, a new road link or links could be constructed to allow industrial traffic to bypass residential areas.
• Minimising bushfire hazard through appropriate planning and management (noting that for the purposes of this analysis, bushfire hazard is considered a challenging yet manageable constraint).
Figure 20 represents the overall constraints that have the potential to pose a challenge to further development of the East Deep Creek Study Area.
5.0 SITE ASSESSMENT – EAST DEEP CREEK PRECINCT
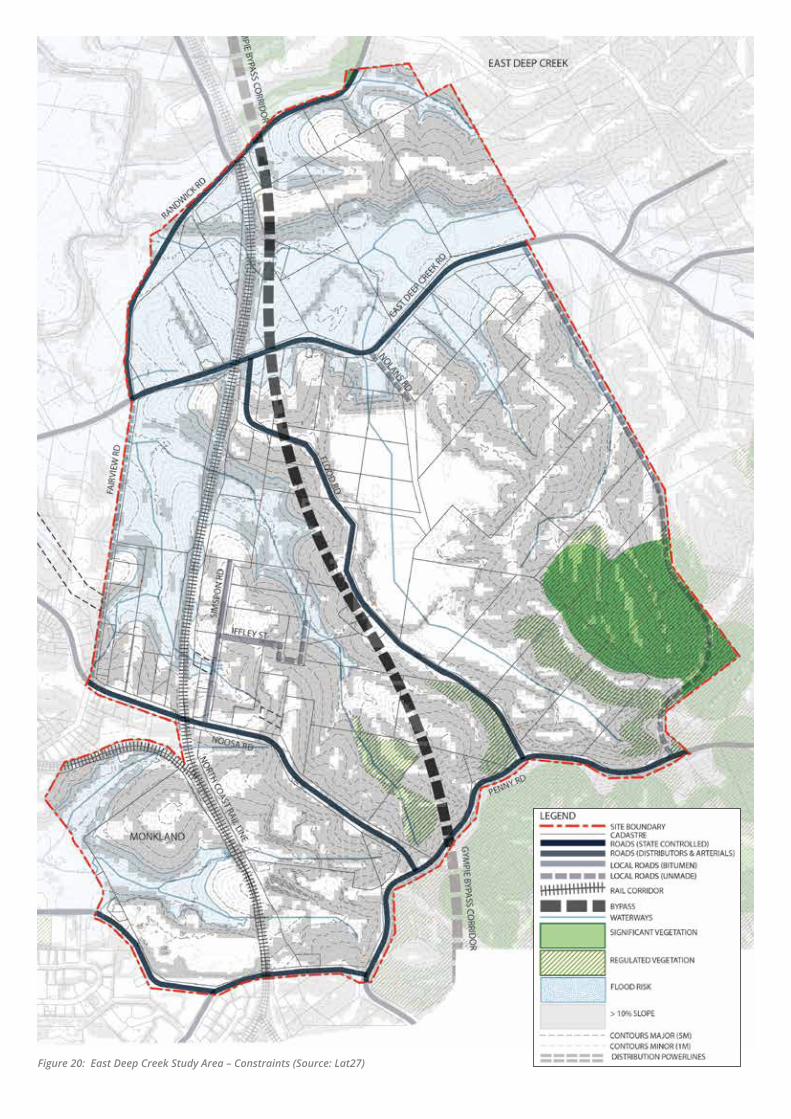
Figure 20: East Deep Creek Study Area – Constraints (Source: Lat27)

72
5.7 POTENTIAL DEVELOPMENT AREAA Potential Development Area, shown in Figure 21, has been prepared to provide an indication of land that may provide opportunity for future development as it is largely unconstrained and has challenges that can feasibly be resolved. The Potential Development Area has been calculated as a Net Development Area to provide a snapshot of the areas that can be taken forward into the structure planning exercise. The structure planning exercise will provide for a more detailed investigation of the opportunities for the Potential Development Area.
A Potential Development Area for the East Deep Creek Study has been identified based on a desktop assessment. The potential development area is preliminary only and has been generated in response to:
• known constraints to future development including Q100 extent, significant and regulated vegetation;
• transmission corridors;
• future Bruce Highway bypass infrastructure;
• accessibility (i.e. potential to gain access via existing or future roads);
• capacity for servicing by reticulated networks (i.e. potential to be serviced by water supply and sewer networks);
• configuration suitable/appropriate for development (i.e. not too thin, no small isolated constraint-free land is included);
• bushfire hazard areas are assumed to be addressed in detailed design and are not considered a constraint;
• given the general topographic conditions and the requirement for flat land, the extent of developable land can only be determined through detailed civil works investigations balanced against overall development economic viability; and
• the diagrams included show the extent of potential development area (based on the above) with the area of slope affected land (> 10% grade) highlighted.
Please note that:
• all constraint mapping is preliminary only and subject to detailed survey;
• the extent of vegetation to be retained is subject to detailed flora/fauna/environmental assessments;
• the extent of Q100 is subject to detailed flood studies; and
• buffers and setbacks from infrastructure corridors, environmental areas, overland flow corridors or waterways etc. included in Potential Development Areas are subject to detailed site assessments and negotiations with local and state authorities.
5.0 SITE ASSESSMENT – EAST DEEP CREEK PRECINCT

Figure 21: Potential Development Area East Deep Creek Study Area (Source: Lat27)
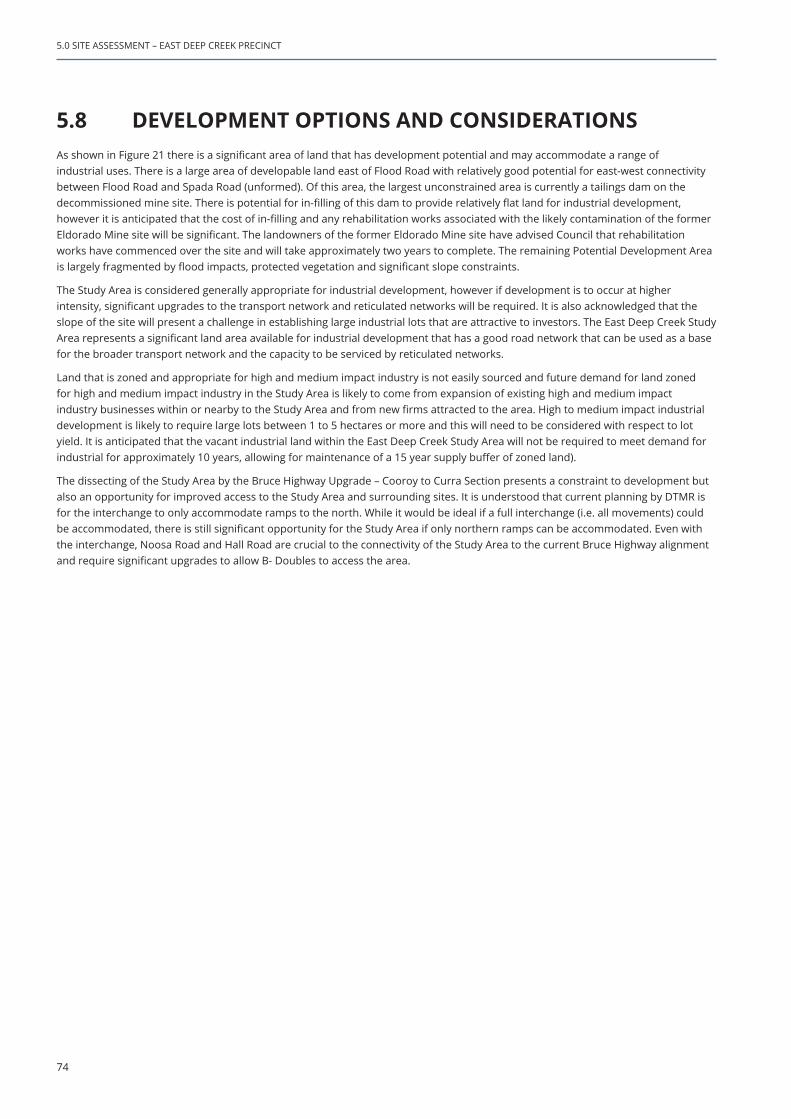
74
5.8 DEVELOPMENT OPTIONS AND CONSIDERATIONSAs shown in Figure 21 there is a significant area of land that has development potential and may accommodate a range of industrial uses. There is a large area of developable land east of Flood Road with relatively good potential for east-west connectivity between Flood Road and Spada Road (unformed). Of this area, the largest unconstrained area is currently a tailings dam on the decommissioned mine site. There is potential for in-filling of this dam to provide relatively flat land for industrial development, however it is anticipated that the cost of in-filling and any rehabilitation works associated with the likely contamination of the former Eldorado Mine site will be significant. The landowners of the former Eldorado Mine site have advised Council that rehabilitation works have commenced over the site and will take approximately two years to complete. The remaining Potential Development Area is largely fragmented by flood impacts, protected vegetation and significant slope constraints.
The Study Area is considered generally appropriate for industrial development, however if development is to occur at higher intensity, significant upgrades to the transport network and reticulated networks will be required. It is also acknowledged that the slope of the site will present a challenge in establishing large industrial lots that are attractive to investors. The East Deep Creek Study Area represents a significant land area available for industrial development that has a good road network that can be used as a base for the broader transport network and the capacity to be serviced by reticulated networks.
Land that is zoned and appropriate for high and medium impact industry is not easily sourced and future demand for land zoned for high and medium impact industry in the Study Area is likely to come from expansion of existing high and medium impact industry businesses within or nearby to the Study Area and from new firms attracted to the area. High to medium impact industrial development is likely to require large lots between 1 to 5 hectares or more and this will need to be considered with respect to lot yield. It is anticipated that the vacant industrial land within the East Deep Creek Study Area will not be required to meet demand for industrial for approximately 10 years, allowing for maintenance of a 15 year supply buffer of zoned land).
The dissecting of the Study Area by the Bruce Highway Upgrade – Cooroy to Curra Section presents a constraint to development but also an opportunity for improved access to the Study Area and surrounding sites. It is understood that current planning by DTMR is for the interchange to only accommodate ramps to the north. While it would be ideal if a full interchange (i.e. all movements) could be accommodated, there is still significant opportunity for the Study Area if only northern ramps can be accommodated. Even with the interchange, Noosa Road and Hall Road are crucial to the connectivity of the Study Area to the current Bruce Highway alignment and require significant upgrades to allow B- Doubles to access the area.
5.0 SITE ASSESSMENT – EAST DEEP CREEK PRECINCT

75
GYMPIE REGIONAL COUNCIL – LOCAL DEVELOPMENT AREA STRUCTURE PLANS – PLANNING REPORT
5.9 RECOMMENDATIONSIt is recommended that the East Deep Creek Study Area progress to the structure planning exercise.
The East Deep Creek Study Area represents a significant area of land available for industrial uses in the Gympie urban area. A majority of the land within the East Deep Creek Study Area is in the High Impact Industry or Medium Impact Industry zone and based on the assessment and analysis undertaken thus far, industrial uses are considered appropriate in the Study Area. The East Deep Creek Study Area represents a significant land area available for industrial development that has a good road network that can be used as a base for the broader transport network and the capacity to be serviced by reticulated networks. Acknowledging the significant challenges servicing the Study Area with roads that have an effective level of flood immunity and reticulated networks that can support industrial development, it is considered that the East Deep Creek Study Area has potential to accommodate industrial growth in Gympie into the future if these challenges can be resolved. Structure planning for the East Deep Creek Study Area will focus on:
• Maximising yield of industrial lots;
• Establishing a base road network for a viable and well connected transport system to integrate developable areas of the Study Area; and
• Identifying, at a high level, the reticulated networks required to support industrial development in the Study Area.
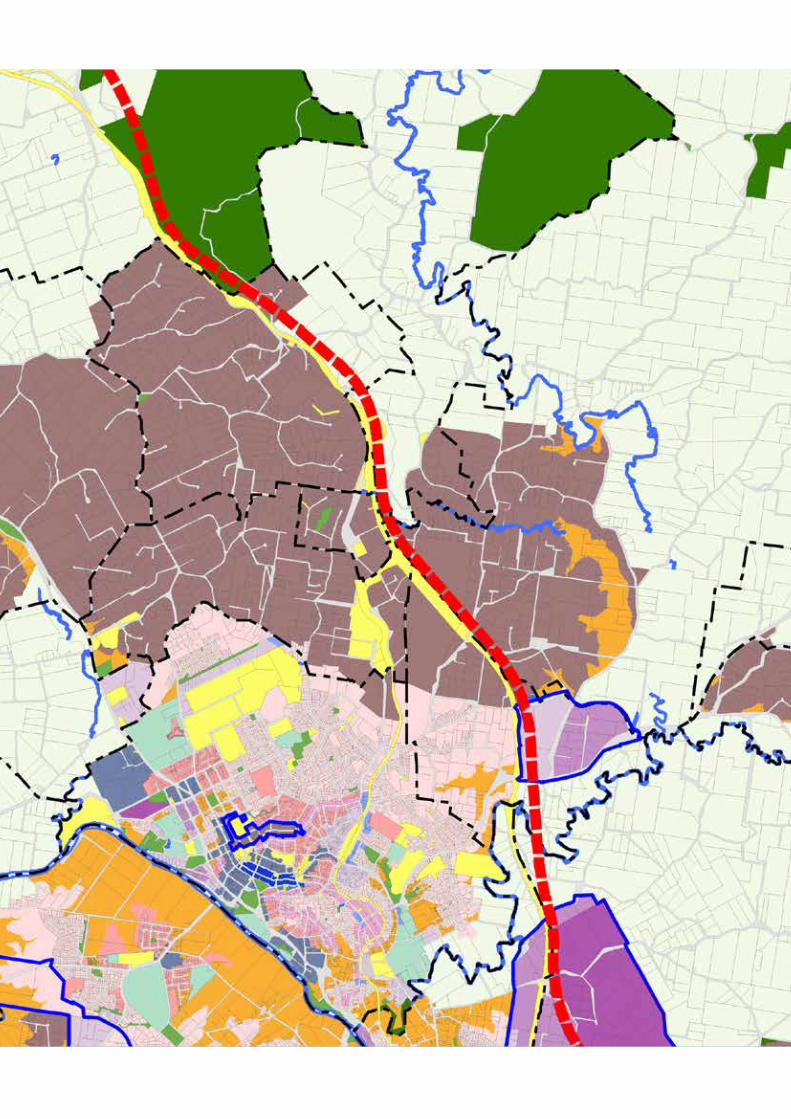

6.0Site Assessment
Victory Heights Precinct

6.0 SITE ASSESSMENT – VICTORY HEIGHTS PRECINCT
6.1 OVERVIEW
Location 3.6km East of the Gympie CBD, directly to the east of the North Coast Rail
Line
Study Area
The Study Area follows the boundary of the Victory Heights LDA Precinct
Size 112 hectares
Zoning • Medium Impact Industry Zone
• Low Impact Industry Zone
Existing Land Uses
The area to the east of Ascot Road is largely undeveloped with a number of
residential, low impact industry and rural uses throughout. The land west
of Ascot Road is vacant land of which a significant area is earmarked for the
Bruce Highway Bypass – Cooroy to Current Section.

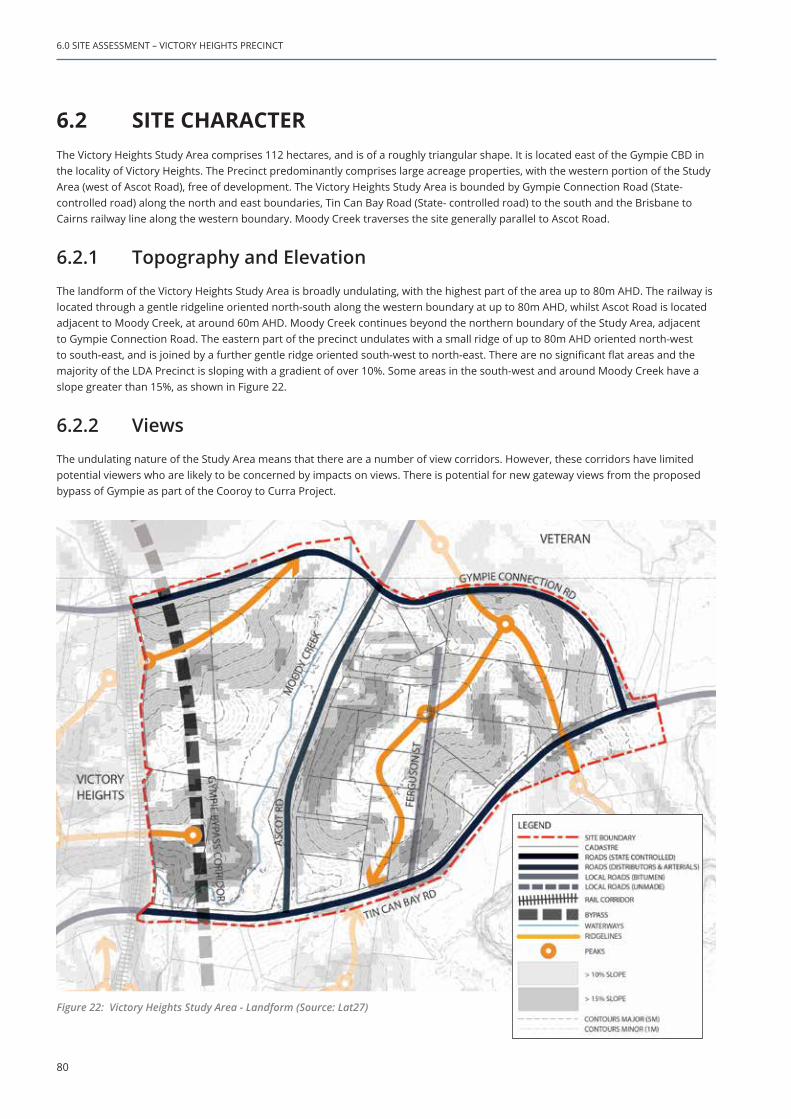
80
6.2 SITE CHARACTERThe Victory Heights Study Area comprises 112 hectares, and is of a roughly triangular shape. It is located east of the Gympie CBD in the locality of Victory Heights. The Precinct predominantly comprises large acreage properties, with the western portion of the Study Area (west of Ascot Road), free of development. The Victory Heights Study Area is bounded by Gympie Connection Road (State-controlled road) along the north and east boundaries, Tin Can Bay Road (State- controlled road) to the south and the Brisbane to Cairns railway line along the western boundary. Moody Creek traverses the site generally parallel to Ascot Road.
6.2.1 Topography and Elevation
The landform of the Victory Heights Study Area is broadly undulating, with the highest part of the area up to 80m AHD. The railway is located through a gentle ridgeline oriented north-south along the western boundary at up to 80m AHD, whilst Ascot Road is located adjacent to Moody Creek, at around 60m AHD. Moody Creek continues beyond the northern boundary of the Study Area, adjacent to Gympie Connection Road. The eastern part of the precinct undulates with a small ridge of up to 80m AHD oriented north-west to south-east, and is joined by a further gentle ridge oriented south-west to north-east. There are no significant flat areas and the majority of the LDA Precinct is sloping with a gradient of over 10%. Some areas in the south-west and around Moody Creek have a slope greater than 15%, as shown in Figure 22.
6.2.2 Views
The undulating nature of the Study Area means that there are a number of view corridors. However, these corridors have limited potential viewers who are likely to be concerned by impacts on views. There is potential for new gateway views from the proposed bypass of Gympie as part of the Cooroy to Curra Project.
Figure 22: Victory Heights Study Area - Landform (Source: Lat27)
6.0 SITE ASSESSMENT – VICTORY HEIGHTS PRECINCT

81
GYMPIE REGIONAL COUNCIL – LOCAL DEVELOPMENT AREA STRUCTURE PLANS – PLANNING REPORT
6.2.3 Waterways and Flood Risk
The main waterway in the area is Deep Creek, which is located largely beyond the southern boundary of the Study Area and runs east-west south of the Study Area before turning westwards south of the site to flow towards the Mary River valley. Moody Creek flows north-south to the west of Ascot Road through the centre of the area, ultimately joining Deep Creek beyond the precinct boundaries, as shown in Figure 23. The Moody Creek and Deep Creek valleys are susceptible to Mary River backwater flooding and a large area of the Study Area falls within a flood zone.
6.2.4 Vegetation
The Study Area has a largely rural landscape with a high level of tree cover in an interconnected network. Bushland is primarily located within creek gullies and alongside roads and in some elevated areas within the acreage estates.
Scattered trees are found on pastoral lands elsewhere throughout the area. Significant Vegetation is located in the Moody Creek valley and extending onto the ridges in the west and north-west of the area, as shown in Figure 23. MSES Regulated Vegetation occurs within the Study Area, predominantly in the western part of the site associated with the Moody Creek corridor.
Figure 23: Victory Heights Study Area – Natural Features (Source: Lat27)

82
6.2.5 Infrastructure
Roads are generally confined to the edges of the Study Area, with the exception of Ascot Road which bisects the Study Area. Ferguson Street is an unmaintained road located in the eastern part of the area, providing north-south access to properties on the western side of Ascot Road. The Brisbane to Cairns railway line forms the western boundary of the Study Area and is constructed along a ridgeline. Both the Gympie Connection Road (along the north and east boundaries) and Tin Can Bay Road (to the south), are State-controlled roads managed by DTMR.
The proposed bypass of Gympie as part of the Cooroy to Curra Project is located parallel with the railway within the western part of the Study Area, as shown in Figure 24.
Figure 24: Victory Heights Study Area – Infrastructure (Source: Lat27)
6.0 SITE ASSESSMENT – VICTORY HEIGHTS PRECINCT

83
GYMPIE REGIONAL COUNCIL – LOCAL DEVELOPMENT AREA STRUCTURE PLANS – PLANNING REPORT
6.2.6 Bushfire Hazard
Significant portions of the Study Area particularly the vegetated areas, falls within the bushfire hazard area. As shown in Figure 25, the site is largely covered by Medium Bushfire Risk with some small areas included in the Low Bushfire Risk area. Bushfire hazard is considered a challenging yet manageable constraint for the purposes of the opportunities and constraints assessment.
Figure 25: Victory Heights Study Area – Bushfire Hazard and Flood Hazard (Source: Lat27)

84
6.3 DEVELOPMENT ACTIVITYThere are several existing industrial uses in the Victory Heights Study Area. These uses are generally low impact industry uses such as workshops and depots. Figure 26 shows that some of these uses are grouped around the Ferguson Street intersection with Tin Can Bay Road. The remaining lots in the Study Area are generally occupied by residential uses, particularly around the Ferguson Street area.
Figure 26: Victory Heights Study Area – Existing Development Activity (Source: PSA Consulting)
6.0 SITE ASSESSMENT – VICTORY HEIGHTS PRECINCT

85
GYMPIE REGIONAL COUNCIL – LOCAL DEVELOPMENT AREA STRUCTURE PLANS – PLANNING REPORT
6.4 TRANSPORT NETWORK ASSESSMENT
6.4.1 Current State
The Study Area has a limited road network dominated by the State-controlled roads, Gympie Connection Road and Tin Can Bay Road. Ascot Road is a Rural Distributor and intersects with Tin Can Bay Road at the southern point and Gympie Connection Road at the northern point. North of Gympie Connection Road, Ascot Road continues into Old Goomboorian Road, which is a Rural Sub-Arterial. Ascot Road is currently subject to flooding in a Q100 event and does not have adequate flood immunity.
The Gympie Bypass Corridor as part of the Cooroy to Curra Project runs parallel to the rail line in the western portion of the Study Area. The bypass when constructed will significantly impact the geometry of the immediately surrounding areas and may impact the geometry of Ascot Road.
The current transport network for the Victory Heights Study Area is shown in Figure 27.
Figure 27: Victory Heights Study Area – Current Transport Network (Source: PSA Consulting)

86
6.4.2 Network Challenges
Ascot Road is largely rural in nature and is not constructed to the standards required for urban development. As a key north-south spine through the Precinct, it will need to be upgraded to accommodate any significant increase in traffic for industrial purposes. The upgrade of Ascot Road is considered to be largely unviable as significant works would be required to achieve an acceptable level of flood immunity on the road as it is understood that the Ascot Road currently floods by 8 metres. Ferguson Street is unformed and will require construction to service any future development. There are also issues with sight distances on Tin Can Bay Road that are unlikely to be able to be resolved through an intersection upgrade.
The intersections of Ascot Road with Gympie Connection Road and Tin Can Bay Road are currently built to a rural standard. If the nature of Ascot Road changes with the potential redevelopment of the Precinct, the intersections will need to be upgraded to urban standards. This presents a challenge as both intersections are geometrically constrained and unlikely to be able to accommodate the required upgrades.
DTMR currently owns the land to the west of Ascot Road for the Bruce Highway Bypass – Cooroy to Curra Section. Planning is currently underway for this section of the Bypass with recent planning allowing for an interchange at Victory Heights. The interchange configuration has not been finalised and is subject to detailed planning. The interchange with the realigned Bruce Highway presents a significant opportunity for the Study Area. However, until the interchange configuration is confirmed a definitive plan for the surrounding area cannot be finalised. Figure 28 indicates the transport network challenges for the Victory Heights LDA Precinct.
Figure 28: Victory Heights Study Area – Transport Network Challenges (Source: PSA Consulting)
6.0 SITE ASSESSMENT – VICTORY HEIGHTS PRECINCT

87
GYMPIE REGIONAL COUNCIL – LOCAL DEVELOPMENT AREA STRUCTURE PLANS – PLANNING REPORT
6.5 RETICULATED NETWORKSThe Victory Heights Study Area is not located within the PIA of Council’s LGIP nor is servicing of the area supported in the current planning horizon for Council’s Planning Scheme. Due to the isolation of the Study Area from current reticulated networks and the relatively small Study Area servicing of the area with reticulated networks is not likely to be feasible.
In discussions with Council’s engineering team it has been confirmed that Victory Heights is currently unserviced and the significant cost required to service the LDA does not match the limited benefit that can be achieved in terms of developable land. As a result it is highly unlikely that the Victory Heights Study Area has the capacity to accommodate industrial development on a large scale. Therefore servicing of the Victory Heights Study Area is unlikely to be supported within the planning horizon for Council’s Planning Scheme.
6.5.1 Water Supply Network Assessment
6.5.1.1 Current State
The Study Area is outside the Water Supply Catchment recognised in Council’s Priority Infrastructure Plan and is unserviced by the reticulated water network.
The nearest water mains are over 1km away on the corner of Bath Terrace and Old Wolvi Road on Gympie Connection Road and at Cootharaba Road near Lillis Road intersection with Tin Can Bay Road. These mains are currently 100mm in diameter and are not looped back to the reticulated network. The likely friction losses and reduced pressures mean that further extensions of these mains cannot be considered.
6.5.1.2 Network Challenges
The lack of water supply infrastructure in or in proximity to the Victory Heights Study Area means that a new network of water supply infrastructure will be required for the Precinct and significant upgrades to the existing network will be required to create capacity.
6.5.2 Sewerage Network Assessment
6.5.2.1 Current State
The Victory Heights Study Area is outside the Sewer Catchment Area recognised in Council’s Priority Infrastructure Plan and is unserviced by reticulated sewerage.
The nearby gravity fed systems do not have capacity to accommodate providing reticulated sewer to the Victory Heights Study Area. Additionally, the nearest Pump Stations at Brown Road (existing) and Lillis Road (existing), have no capacity for increased in-flows other than those in the existing catchment and both are due for upgrading. These pump stations are approximately 1.5km away from the Study Area and connect, via gravity systems, to the major pump stations at Elworthy Street and One Mile School (Brisbane Road).
6.5.2.2 Network Challenges
The lack of sewer infrastructure in or in proximity to the Victory Heights Study Area means that significant upgrades to the existing network will be required to create capacity to provide reticulated sewer in the Precinct.
It is highly likely that a Pump Station will be required to service the Study Area in addition to new mains, to ensure that the existing gravity fed systems that feed back to the major Pump Stations and Treatment Plant are not adversely impacted.
6.5.3 Stormwater Network Assessment
6.5.3.1 Current State
The Victory Heights Study Area is outside of the Stormwater Catchment boundary identified in Council’s Priority Infrastructure Plan and there is no current stormwater infrastructure within the Precinct. Moody Creek has a catchment area of approximately 320 hectares and the site is affected by backwater flooding from Mary River

88
6.5.3.2 Network Challenges
The management of Moody Creek is going to be a major consideration moving forward. With a significant catchment, Moody Creek is a High Impact Waterway and significant work will be required to manage stormwater for the Victory Heights LDA Precinct and create flood immunity for Ascot Road. It is understood that Ascot Road can flood by approximately 8 metres so upgrading to achieve flood immunity may not be feasible.
6.6 OPPORTUNITIES, CONSTRAINTS AND CHALLENGESThe opportunities, constraints and challenges for industrial development within the Victory Heights LDA Precinct can be summarised as follows:
6.6.1 Opportunities• The existing road network provides a good level of accessibility.
• There is potential additional accessibility from planned interchanges with the bypass road as part of the Cooroy to Curra Project.
• The undulating landscape is a positive attribute for sewerage, water and stormwater infrastructure.
• Existing vegetation areas and landform create opportunities for visual screening and integration.
• Few neighbouring properties would be affected by redevelopment.
6.6.2 Constraints• The Precinct is unserviced by Council’s reticulated networks and is isolated from the reticulated service areas meaning there is
limited capacity to service the site.
• The existing road network is affected by flooding. Ascot Road, Tin Can Bay Road and Gympie Connection Road in particular have a low level of flood immunity.
• Very few parcels of land are unconstrained by a combination of flood zone/gradient over 10%/MSES Regulated Vegetation.
• Potential difficulty of accessing land between the railway and the bypass route as part of the Cooroy to Curra Project.
• Unconstrained land located on elevated ridgelines that are already developed and/or are sensitive to visual intrusion.
• Overall, the Victory Heights LDA Precinct appears to be highly constrained for industrial development.
6.6.3 Challenges• Difficulty of designing large scale industrial buildings whilst respecting landform and minimising visual intrusion and cost of
excessive cut and fill.
• Steep slopes present a significant challenge in providing viable industrial lots.
• Ensuring the interface with Good Quality Agricultural Land surrounding the Study Area is appropriate and provides suitable buffers as required.
• Potential developable parcels are not consolidated so will be a challenge to integrate servicing.
• Integrating WSUD and other stormwater management systems to avoid further encroachment of the flood zone.
• Minimising bushfire hazard through planning and management.
• Management of Moody Creek.
• Accommodating large scale industrial buildings in elevated areas with respect for views and visual character.
• Consultation will be required with DTMR to ensure these roads and intersections are upgraded to reflect the standards expected for industrial zoned land.
Figure 29 represents the overall constraints that have the potential to pose a challenge to further development of the Victory Heights LDA Precinct.
6.0 SITE ASSESSMENT – VICTORY HEIGHTS PRECINCT

89
GYMPIE REGIONAL COUNCIL – LOCAL DEVELOPMENT AREA STRUCTURE PLANS – PLANNING REPORT
Figure 29: Victory Heights Study Area – Constraints (Source: Lat27)
6.7 POTENTIAL DEVELOPMENT AREAA Potential Development Area, shown in Figure 30, has been prepared to provide an indication of land that is largely unconstrained and may provide opportunity for future development. The Concepts will also provide a snapshot of the major considerations that will need to be taken forward into the next stage of the structure planning process, being the initial stakeholder engagement and EBD. The EBD exercise will provide for a more detailed investigation of the opportunities for the unconstrained land.
A Potential Development Area for the Victory Heights LDA has been identified based on a desktop assessment. The potential development area is preliminary only and has been generated in response to:
• known constraints to future development including Q100 extent, significant and regulated vegetation;
• transmission corridors;
• future bypass infrastructure;
• accessibility (i.e. potential to gain access via existing or future roads);
• configuration suitable/appropriate for development (i.e. not too thin, no small isolated constraint free land is included);
• bushfire hazard areas are assumed to be addressed in detailed design and are not considered a constraint;
• given the general topographic conditions and the requirement for flat land, the extent of developable land can only be determined through detailed civil works investigations balanced against overall development economic viability; and
• the diagrams included show the extent of potential development area (based on the above) with the area of slope affected land (> 10% grade) highlighted.
90
Please note that:
• all constraint mapping is preliminary only and subject to detailed survey;
• the extent of vegetation to be retained is subject to detailed flora/fauna/environmental assessments;
• the extent of Q100 is subject to detailed flood studies; and
• buffers and setbacks from infrastructure corridors, environmental areas, overland flow corridors or waterways etc included in Potential Development Areas, are subject to detailed site assessments and negotiations with local and state authorities.
Figure 30: Potential Development Area Victory Heights LDA (Source: Lat27)
6.0 SITE ASSESSMENT – VICTORY HEIGHTS PRECINCT

91
GYMPIE REGIONAL COUNCIL – LOCAL DEVELOPMENT AREA STRUCTURE PLANS – PLANNING REPORT
6.8 DEVELOPMENT OPTIONS AND CONSIDERATIONSThe Victory Heights Study Area has limited unconstrained land available for future development and significant work will be required to develop the unconstrained land within the Study Area as it is fragmented by flood, vegetation and slope constraints.
Land to the west of Ascot Road is heavily constrained and is also subject to a significant degree of uncertainty with regard to the construction of the Bruce Highway Bypass as part of the Cooroy to Curra Project. All of the land west of Ascot Road is owned by DTMR and little development is expected to occur on the site until the bypass road is constructed, which is not anticipated to occur within a 10 year time horizon.
The uncertainty with regard to the construction of an interchange with the Bruce Highway Bypass also impacts the development potential of the Study Area as it is not known what the extent of an interchange will be or if there is opportunity to address flood immunity issues with respect to Ascot Road as part of the interchange project. The uncertainty of the impact of the Bruce Highway Bypass on the Study Area is an important consideration and a valid reason not to undertake structure planning in the Victory Heights Study Area at this time.
Land to the east of Ascot Road is largely free of flood impacts and protected vegetation; however it is significantly affected by slope over 10%. Land with a slope under 10% is generally sought for industrial development as it significantly limits the burden of cut and fill works on the overall cost of development.
The land east of Ascot Road is also heavily reliant on the north-south connection that the currently unformed Ferguson Street provides. As part of future development of the Study Area, Ferguson Street is likely to require construction, which is an expensive exercise. Advice from Council and DTMR officers is that the Ferguson Street intersection with Tin Can Bay Road is highly unlikely to meet sight distance requirements without significant upgrade to the intersection and potential realignment of Tin Can Bay Road. These potential construction works are considered a barrier to the feasibility of development within the Victory Heights Precinct at this time. Finally, the other key north-south link, Ascot Road, is severely flood affected (it is understood that the road floods by 8m) and would require significant and expansive upgrades to have an acceptable level of flood immunity. The scale and likely costs associated with establishing a road network of an acceptable standard are considered prohibitive in relation to the potential development yield that can be achieved at this time. This is another valid reason not to undertake structure planning in the Study Area at this time.
Finally, as described previously, servicing the Victory Heights Study Area with reticulated networks capable of accommodating the load from industrial uses is not considered to be feasible in the medium term and is not likely to occur within the life of the current Planning Scheme.
While significant development of the Victory Heights Study Area is not considered appropriate at this time, it is acknowledged that the Study Area may provide a number of opportunities for specialist industrial development in the future such as:
• An area of flood free land in proximity to major transport routes;
• Proximity to an interchange with the realigned Bruce Highway (once planning for the corridor is confirmed); and
• Good road access to Gympie (once flood immunity issues are resolved).
6.9 RECOMMENDATIONIt is recommended that the Victory Heights Study Area not progress to the structure planning exercise.
Based on the assessment undertaken as part of the Planning Report, it is considered that a structure planning exercise for Victory Heights will not be effective at this point in time due to the limited Potential Development Area and significant challenges in servicing the Study Area. It is considered that the limited Potential Development Area that is largely free of constraints is not large enough to achieve a critical mass that justifies the infrastructure investments that would be required to develop the Study Area for industrial purposes at this time.
This does not preclude industrial development from occurring in the Victory Heights Study Area if the infrastructure challenges can be appropriately addressed by an Applicant seeking to develop the area.
It is recommended that Council allow for minor amendments to the Gympie Regional Council Planning Scheme 2013 to ensure that any development sought in the Victory Heights LDA Precinct is able to be self-sustainable from an infrastructure perspective, until such time as Council deems it appropriate to service the Victory Heights Area. Development applications consistent with the current zoning may continue to be considered on a case by case basis. This will allow for self-contained low impact industrial uses to continue to operate and expand in the Study Area and for new uses to establish where appropriate.


7.0Economic Need Considerations

94
7.0 ECONOMIC NEED CONSIDERATIONS
In addition to the site assessments undertaken for each of the three LDA precincts above, it is also important to consider the economic needs analysis, to determine whether the development of each LDA precinct for its intended purpose is viable. A summary of the key findings of the Economic Needs Assessment for each of the LDA precincts prepared by Foresight Partners is provided below. The Economic Needs Assessment can be found attached as Appendix 2.
7.1 RESIDENTIALGympie Regional Council’s estimated resident population is 48,400 at June 2014, up from 42,500 at the 2006 Census and 46,900 at the 2011 Census. Since 2006, the estimated resident population has increased by 13.9%, which equates to approximately 5,900 persons. Between 2006 and 2014, the largest population increase of approximately 3,200 persons (54.2%) was experienced in the Gympie urban area, which is comprised of the SA2s of Gympie-North and Gympie-South.
Under the most recent State Government projections the Gympie LGA is projected to increase by around 15,600 persons between 2014 and 2036. A significant percentage of this growth (40.4% – equating to 6,300 persons), will be accommodated within the Gympie urban area.
The Southside LDA Precinct represents the Gympie urban area’s largest area available for residential development. With some 374ha of land zoned for Residential Living, it has the capacity to accommodate significant additional population growth in a mix of lot sizes and housing types. The precinct should have the capacity to accommodate the forecast demand for an additional 1,200 dwellings to house the 2,950 increase in population projected for the whole of the Gympie-South SA2 by 2036. Gympie has a relatively older age profile, with 18% of the population aged over 65 years.
This is projected to increase to 28.7% by 2036. As a result, a combination of family and retirement housing on a variety of lot sizes will be required to meet Gympie’s projected population growth and trends by 2036. In order to service this forecasted residential population, additional retail, community and recreational facilities are likely to be required within or near the defined precinct.
Development constraints may result in lower development yields within the Southside LDA Precinct and not all land owners within the precinct may seek to subdivide their land to accommodate higher residential densities. However, as only 120-150 hectares of land is needed to accommodate the 1,200 additional dwellings, other areas in the Gympie-South SA2 may potentially be capable of accommodating future residential growth.
Notwithstanding this, the Southside LDA Precinct will still be capable of accommodating significant residential development and planning for this precinct should focus on maximising housing yield and providing a variety of housing types and lot sizes.
The demand for additional dwellings in Gympie-South SA2 will average about 55 per annum between 2016 and 2036. Potential staging to meet this forecast demand is:
• Around 300 new dwellings between 2016 and 2021, which equates to 30-40 hectares of land based on 8-10 dwellings per hectare or 20 hectares assuming an average yield of 14 dwellings per hectare;
• A further 250 new dwellings by 2026, requiring 25-30 hectares or 18 hectares at the higher yield; and
• An additional 550 dwellings by 2036, requiring 55-70 hectares or 40 hectares at a higher yield.
Due to the size and potential yield of the Southside LDA, the area is likely to require additional retail, community and recreational facilities to service the future residents. The projected population growth is likely to support one to two local centres anchored by a small independent supermarket or convenience store and a small number of convenience retail speciality shops. These local centres typically range in size from 600 – 1,000m² up to 2,500m² of lettable area. They require frontage to or visibility from a main road to trade successfully.
7.0 ECONOMIC NEED CONSIDERATIONS

95
GYMPIE REGIONAL COUNCIL – LOCAL DEVELOPMENT AREA STRUCTURE PLANS – PLANNING REPORT
7.2 INDUSTRIALThe current land stock represents potentially a 60 year supply of industrial land for the LGA based on historic take-up rates of 5 hectares per annum. If all land is developable, the vacant land within the East Deep Creek and Victory Heights LDA Precincts represents a potential 36 year supply, with vacant industrial land elsewhere in the Gympie urban area representing a potential 25 year supply.
If the vacant land is all ‘good quality’ industrial land and available for development, the vacant industrial land within the LDAs would not be required to be serviced and developed for at least 10 years (allowing for maintenance of a 15 year supply buffer of zoned land). If it is assumed that only 50% of the vacant land within the two industrial LDAs can be developed for industrial purposes, the potential supply falls to 30 years. Given the constraints facing much of the industrial zoned land in the Gympie urban area and in the absence of detailed constraints analysis of all vacant industrial land, this is considered a reasonable assumption. In this scenario, the need to service and develop the East Deep Creek and Victory Heights LDA Precincts could arise in the next 5 to 10 years.
7.2.1 East Deep Creek
The East Deep Creek LDA Precinct currently supports a small number of high impact industries as well as medium and lower impact industry businesses. Future demand for high and medium impact industry zoned land in the precinct is likely to come from expansion of existing high and medium impact industry businesses in (or adjacent to), the East Deep Creek Precinct, and from new firms attracted to the area, especially once the Gympie Bypass is in place.
The East Deep Creek LDA Precinct can continue to fulfil its role in accommodating firms requiring (relatively scarce) high and medium impact industry land for their operations, but the quantity of useable land is likely to be significantly less than suggested by its current overall size. High and medium impact industries are likely to require larger lot sizes (one to five hectares or more), which is also likely to affect the number of firms that can be accommodated.
The take-up rate for high impact industrial land is likely to be quite different to that of land for low and medium impact industrial, as there are a relatively smaller number of future businesses or business expansions taking up larger areas.
The economic realities for each of the LDAs will need to be considered moving forward. The anticipated take up rates and the need for a mix of lot sizes and development types should direct the pattern of development to ensure that the LDAs are providing a product that will meet the needs of the community and the broader residential and industrial markets.
There is a significant relationship between the identified constraints and the economic need which will influence the pattern and staging of development in each of the LDAs.
It has been confirmed by the economic needs analysis that any future development will need to offer a high quality built environment that is fit for purpose. The urban design principles listed in section 8 provide a blueprint for high quality development outcomes.
7.2.2 Victory Heights
The Victory Heights LDA Precinct is close to the urban centre and is well-positioned to accommodate smaller industrial uses serving the Gympie region, and a number of such businesses are currently operating in this area.
Despite the positive locational attributes of the Victory Heights LDA Precinct, the combination of constraints, its small size and relative isolation from services severely compromise its ability to accommodate a viable industrial precinct. It may attract a few more individual businesses on existing lots, such as the few transport depot and workshops currently operating, particularly as home-based businesses, but its ultimate usable area may not meet Gympie’s future needs for light and medium Industry land.
The precinct’s 28 hectares of vacant land supply (excluding a nominal 10 hectares for the bypass corridor) collectively represent approximately 12 years’ land supply.
8.0Urban Design
Principles
98
8.0 URBAN DESIGN PRINCIPLESIn light of the above analysis, the next stage of the structure planning process for the LDA Precincts that have been selected to progress, will see initial stakeholder engagement and an EBD exercise undertaken that will provide a more detailed investigation of the opportunities for the unconstrained parcels of land. As part of this EBD exercise, urban design principles will be used to guide development of the Structure Plans for each selected LDA Precinct. This will ensure that sustainable development principles are embedded in the Structure Plans, as well as sound design principles to guide urban form. This will ensure potential development is responsive to the natural environmental context and maximises the values of each Precinct.
Below outlines the recommended urban design principles for both industrial and residential development, when initiating the upcoming EBD exercise.
8.1 RESIDENTIAL DEVELOPMENT
8.1.1 Urban Structure and Land Use• Facilitate a sustainable approach to urban development by reducing car dependence, encouraging greater local self-containment
of suburbs, and protecting key natural, cultural and economic assets;
• Develop a coherent urban system of compact walkable neighbourhoods which cluster to form a suburb with a relatively intense, mixed-use centre with sufficient catchment to be capable of catalysing a broad range of commercial, employment and social opportunities;
• Design safe, convenient and attractive neighbourhoods that meet the diverse and changing needs of the community and offer a wide choice of housing and leisure opportunities;
• Ensure a site-responsive approach to urban development that supports and enhances the context, strengthens local character and identity and promotes a sense of community;
• Establish a movement network based on a highly-interconnected street network that clearly distinguishes between arterial routes and local streets, establishes good internal and external access for residents, maximises safety, encourages walking and cycling and minimises the impact of through traffic;
• Structure the movement network and arrangement of centres and neighbourhoods to enable public transport systems to provide a viable and convenient alternative to private cars and facilitates progressive increases in public transport use;
• Provide a network of well-distributed parks and recreation areas that offer a variety of accessible, safe and attractive public open spaces, with a focus on maximizing the use of high quality district level parks;
• Ensure that development incorporates best-practice urban water management techniques relating to stormwater quality and quantity, waterway health and ongoing management;
• Protect valuable environmental and ecological assets and where possible connect these assets to surrounding land with conservation significance;
• Consider appropriate lots sizes that respond to constraints and reflect the intended character;
• Equitably provide public utilities in a timely, cost-efficient and effective manner; and
• Integrate new development with established suburbs and emerging communities through appropriate connections and development interfaces.
8.0 URBAN DESIGN PRINCIPLES

Figure 31: Residential Example - Urban Structure and Land Use (Source: Lat27)
Neighbourhood Structure Diagram
Local Centre
5 minute walk
District Centre
Corner Shop
Community Facilities
Low Density Residential
Medium Density
ResidentialSchool
Park
Centres and Employment Areas
Greater Housing Choice
Schools Parkland Natural Waterways
Commercial and retail centres are located on busy roads with high levels of access and
public transport service
Higher density housing is supported by convenient access
to a higher level of commercial, community
and transport service
Locate near centres for public transport
access. Collocate with sport and recreation
facilities to encourage shared use.
All residents should be within a five minute walk of a local park
Integrate natural waterways as
characterising elements of neighbourhoods and
include district cycle/pedestrian pathways
Natural Waterways
100
8.1.2 Neighbourhood Design and Structure• Establish the neighbourhood unit as the fundamental building block of new communities and based on a 5 minute walk from
centre to edge to provide all residents ease of access to open spaces, public transport, services and facilities;
• Plan interconnected street networks that spread traffic, facilitate walking and cycling but discourage through traffic;
• Provide parks that cater for local residents’ recreational needs and connect with pathway networks to provide walking and cycling opportunities;
• Provide a neighbourhood structure that affords a wide choice of housing to suit a range of household types;
• Aim to deliver residential densities in accordance with the long term level of amenity and access to commercial and community services within neighbourhoods;
• Phase development to maximise opportunities for higher density residential living to locate around centres and transit stops and adjacent to higher amenity areas such as parks;
• Maximise opportunities for energy efficient housing design through block structures that support optimal solar orientations and access to prevailing breezes;
• Arrange street and block patterns so lots front streets and parkland such that development enhances personal safety, traffic safety, property safety and security; and contributes to streetscape and park quality;
• Establish a distinctive tropical character through streetscape and open space design;
• Integrate urban water management strategies into the design and layout of open space, streets and buildings; and
• Accommodate and integrate the natural landform, views, and local environmental features to achieve a distinctive design outcome.
8.0 URBAN DESIGN PRINCIPLES

Figure 32: Residential Example – Neighbourhood Design and Structure (Source: Lat27)
Neighbourhood Typologies Based on Density and Amenity
Local Park and Bus Stop
Corner Store
Convenience Centre
Neighbourhood/District Centre
Scale Structure Placemaking Intensity and Density
Neighbourhood scale should be based on a 5 minute walk
from centre to edge to provide ease of access to parks,
transport, and community services.
Neighbourhoods should be designed with robust street
and block structures that facilitate movement and allow growth and change over time
Design distinctive neighbourhoods that respond
to natural features, provide interesting parks and streets
and deliver quality public realm in centres
Maximise residential densities based on long term access to commercial and community
services, public transport and recreational opportunities

102
8.1.3 Mixed Use Centres, Employment and Community Services• Offer a wide choice of district and local community, education, commercial and leisure facilities that meet the diverse and
changing needs of the community and support local employment opportunities;
• Plan a hierarchy of well-located centres that provide the community with convenient access to daily needs, establish focal points and community meeting places and promote a distinctive local character;
• Facilitate activity centres that are structured as mixed-use centres in a predominantly main street based format, and are detailed to provide a high quality public realm supportive of public transport, walking and cycling in addition to good car and service vehicle access;
• Support more diverse and higher density housing options near centres that support transit oriented design initiatives and affordability strategies;
• Encourage high quality built form and public realm design in centres to ensure they are memorable, comfortable and enjoyable places to visit;
• Support the use of public transport, walking and cycling in addition to good car and service vehicle access and parking in centres;
• Create distinctively tropical centres with streetscapes characterised by awnings, shade trees and appropriate building materials and finishes;
• Provide adequate areas for low intensity industrial development and car-dependent service businesses in locations that are appropriate in terms of heavy vehicle access, client exposure, compatibility with surrounding uses, and that are not in core public transport nodes or in the walkable catchment of a neighbourhood;
• Encourage civic, cultural and community facilities to be located in centres, and are designed as well-integrated, land-efficient urban buildings, rather than in campus layouts; and
• Recognise that centres and employment areas often develop later than their surrounding residential areas, and to put in place mechanisms to facilitate appropriate interim uses, together with a strategy that easily facilitates gradual intensification over time.
Figure 33: Residential Example – Mixed Use Centre, Employment and Community (Source: Lat27)
Greater Lifestyle Choice
Higher density housing is located to take advantage
of convenient access to commercial, community and
transport services
Development Phasing
Strategic areas adjacent the centre are land-banked to
ensure maximum development potential is reached as the
community matures
High Street
Retail and commercial development is design to
deliver a traditional high street as a focus of community activity and interaction
Large Format Retail
Supermarkets are sleeved by smaller retail outlets that
address and activate the street
Public Realm Quality
High quality public realm design ensures the centre is
an enjoyable and recognisable heart of the local community.
8.0 URBAN DESIGN PRINCIPLES

103
GYMPIE REGIONAL COUNCIL – LOCAL DEVELOPMENT AREA STRUCTURE PLANS – PLANNING REPORT
Public Transport
The collector road network is a grid structured around
walkable scale neighbourhoods to supports public transport
access
Placemaking
Feature streetscapes around centres and community focal
points establish character and interest
Streetscape Design
Streetscapes are designed to reflect their role and clearly distinguish their function.
All streets are addressed by housing frontage
Interconnected Grids
Grid networks spread traffic and support pedestrian and
cycle movement
8.1.4 Street Movement• Provide an interconnected grid network of streets with clear physical distinctions between arterial routes and local streets based
on function, legibility, convenience, traffic volume, vehicle speed, public safety and amenity;
• Provide acceptable levels of safety and convenience for all street users in residential areas, while ensuring acceptable levels of amenity and minimising negative effects of through traffic; and
• Deliver street and open space networks which together establish convenient linkages to activity centres and local facilities.
8.1.5 Public Transport• Accommodate a comprehensive public transit network that is efficient to operate, comfortable to travel on, and with bus stops
that are conveniently and safely accessible by foot from most dwellings; and
• Design all urban areas to facilitate increased use of public transport even if current public transport patronage is minimal.
8.1.6 Street Design• Provide attractive streetscapes which reinforce the functions of a street as important and valuable public places that add value to
the amenity of adjacent housing and developments;
• Enable roads and verges to perform their designated functions in the street network, recognising that streets that are too wide to encourage higher vehicle speeds;
• In centres, deliver higher quality streetscape design outcomes that establish a distinctive character and support active public life and community interaction; and
• Deliver development and buildings that address and overlook streets wherever possible.
Figure 34: Residential Example – Movement and Connectivity (Source: Lat27)
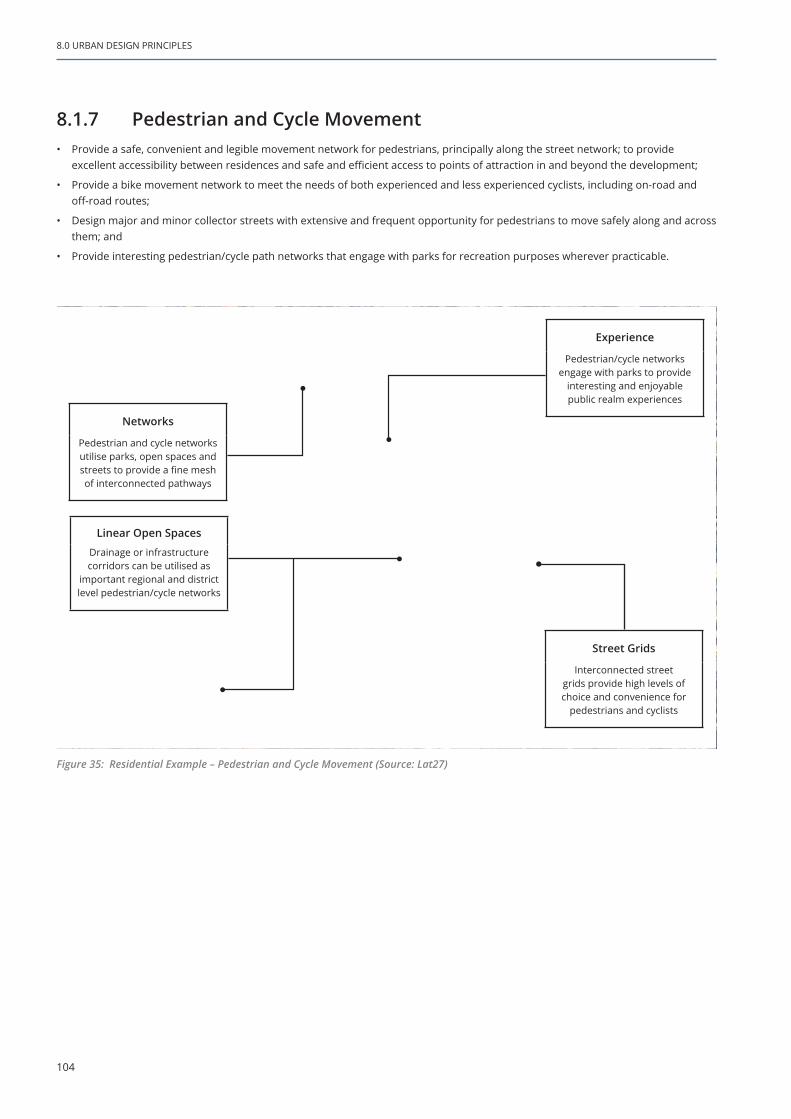
104
8.1.7 Pedestrian and Cycle Movement• Provide a safe, convenient and legible movement network for pedestrians, principally along the street network; to provide
excellent accessibility between residences and safe and efficient access to points of attraction in and beyond the development;
• Provide a bike movement network to meet the needs of both experienced and less experienced cyclists, including on-road and off-road routes;
• Design major and minor collector streets with extensive and frequent opportunity for pedestrians to move safely along and across them; and
• Provide interesting pedestrian/cycle path networks that engage with parks for recreation purposes wherever practicable.
Figure 35: Residential Example – Pedestrian and Cycle Movement (Source: Lat27)
Experience
Pedestrian/cycle networks engage with parks to provide
interesting and enjoyable public realm experiences
Linear Open Spaces
Drainage or infrastructure corridors can be utilised as
important regional and district level pedestrian/cycle networks
Street Grids
Interconnected street grids provide high levels of choice and convenience for
pedestrians and cyclists
Networks
Pedestrian and cycle networks utilise parks, open spaces and streets to provide a fine mesh of interconnected pathways
8.0 URBAN DESIGN PRINCIPLES

105
GYMPIE REGIONAL COUNCIL – LOCAL DEVELOPMENT AREA STRUCTURE PLANS – PLANNING REPORT
Integrated Waterways
Natural waterways and stormwater corridors are
integrated as valuable open spaces for pedestrian cycle
movement and for their visual relief from the urban
environment
Local Parks
Local parks are the focus and heart of neighbourhoods and are located and designed to support local recreational
needs and community identity
Convenient Connections
Open space provides direct links to encourage walking and
cycling
8.1.8 Parkland and Open Space• Deliver a comprehensive and highly accessible network of parks, open spaces and stormwater management corridors as an
integrated and characterising structural element of the Southside LDA Precinct Structure Plan;
• Ensure that a hierarchy of well distributed open spaces, including local parks, sports facilities and urban spaces, of appropriate quality and quantity is provided in a timely manner to contribute towards the recreational and social needs of the community;
• Establish existing local parks as the activity focus of all neighbourhoods and ensure that the majority of residents are within a short walking distance of recreation opportunities;
• Deliver open space as a connected network to support pedestrian and cyclist movement;
• Facilitate the provision of land for community facilities where appropriate, as part of land ceded for public open space;
• Encourage high quality landscape design in parks and open spaces to respond to the tropical climate and contribute towards the character and liveability of the suburb;
• Ensure all open spaces have strong visual relationships with surrounding development in a manner that maximises personal safety day and night;
• Locate and integrate appropriate urban water management requirements in a manner that contributes to urban quality and are balanced against broader strategic outcomes; and
• Design major stormwater management corridors, detention basins and water quality measures to positively contribute towards the character and function of the suburb.
Figure 36: Example of Residential – Parkland and Open Space

106
8.2 INDUSTRIAL DEVELOPMENT
8.2.1 Strategic Objectives
The overarching objectives for the planning and form of industrial estates and precincts are:
• Respond to the natural environmental context and character through site-responsive design which integrates, protects and where appropriate rehabilitates important landscapes, landform, natural areas and hydrological systems;
• Wherever possible, support the minimisation of energy use and greenhouse gas emissions by reducing the need for bulk earthworks, delivering comprehensive transport networks, optimising block orientation and retaining shade trees and vegetation;
• Maximise opportunities for efficient use, reuse and recycling of water resources and ensure appropriate management of stormwater quality and quantity;
• Promote use of renewable resources for energy generation and construction of infrastructure;
• Maximise opportunities for efficient storage, reuse and recycling of waste;
• Incorporate technological capability, efficiency and pollution prevention into the provision of services and infrastructure; and
• Develop strategies to build relationships between the industrial area and the surrounding community, including product and by-product demand and supply chains, as well as social and employment networks.
8.0 URBAN DESIGN PRINCIPLES

107
GYMPIE REGIONAL COUNCIL – LOCAL DEVELOPMENT AREA STRUCTURE PLANS – PLANNING REPORT
Figure 37: Industrial Examples – Caloundra Industrial Park (Source: Lat27)
8.2.2 Urban Structure and Land Use• Where precincts are appropriately scaled or located, investigate the inclusion of a service core of supporting retail and commercial
activities that establish a centre or service core for the wider area;
• Locate service cores on a major road adjacent to the main entry and with good access by public transport;
• Higher intensity uses and uses with high employment ratios should cluster around centres;
• Ensure industrial vehicle access and movements, particularly heavy vehicles, do not detrimentally impact or pass through residential areas;
• Main entries should provide a legible and attractive entry statement and identity;
• Higher impact uses are generally located centrally within industrial precincts to provide maximum separation from surrounding (potentially more sensitive) uses;
• The intensity of uses and scale of built form should generally reduce towards the edge of the area, particularly where adjoining sensitive uses; and
• Industrial lots generally have access from the internal street network only.
Sensitive Interface
Building scale and boundary treatments are sensitive to
adjacent land uses. Vegetation buffer of variable width
provides seperation between the development and the
adjacent existing land uses to the east of the site.
Local Business Centre
Strategically located for the establishment of a local mixed
use retail and commercial centre to provide for the needs
of works and visitors.
Converstation Area
83ha of land provides buffer, fire management and
stormwater management purposes.
Stormwater Management
Development underpinned by WSUD principles and integrated water cycle
management to manage stormwater flows, water
quality and sustainable water use.
Movement & Connectivity
Future extension of arterial road.

108
8.2.3 Lot Layouts• Lots should be regular in shape and capable of accommodating a wide range of uses;
• Include a variety of lot sizes to maximise the efficient use of the land, encourage diversity of uses and maximise opportunities for co-location of synergistic uses;
• Design lot layouts with inbuilt long term flexibility, including some large lots to facilitate future reconfigurations to meet emerging demands; and
• Smaller lots preferably cluster near a service centre, main access points or are located to establish buffers between higher impact activities and surrounding areas.
Figure 38: Industrial Examples – CitiSwitch (Source: Lat27)
Freight Accessibility
Excellent location for transport operators positioned at the crossroads of three national highways. Direct connection to the Brisbane Airport, Port,
north and south Gateway arterials and the TradeCoast
Precinct.
Regular Lot Layout
Variety of lot sizes ranging from 2000sqm to 200 000sqm
with a uniform shape to accommodate a range of industrial uses. Flexible
with ability to subdivide or consolidate lots.
Worker Accessibility
Readily accessibly via public / active transport. Situated 25mins from the Brisbane
CBD.
Ebbw Vale Station
Dinmore Station
8.0 URBAN DESIGN PRINCIPLES

109
GYMPIE REGIONAL COUNCIL – LOCAL DEVELOPMENT AREA STRUCTURE PLANS – PLANNING REPORT
8.2.4 Employment• Identify opportunities for shared facilities and services and locate these facilities in an accessible location; and
• Design and stage new development to flexibly allow for shared facilities or service centres to be incorporated later as a critical mass of businesses are achieved.
8.2.5 Community• Generally there is limited scope for industrial development to contribute to community or social outcomes. Depending on the
nature of development, urban context and relationships to surrounding areas there may be significant benefits to existing communities and workers through balanced consideration of heritage, amenity, social needs and wellbeing, community access and facilities, safety and security as part of the design of an industrial development. Responses may include:
– Provision of public open space for passive and active recreational activities;
– Minimise negative visual impacts in areas of high amenity or high landscape quality and ensure high amenity of the development through requirements for landscape, parking, fencing, signage and built form;
– Plan for passive surveillance of the public domain to address the safety of users; and
– Clearly differentiate between areas of private and public domain, including shared facilities, and ensure appropriate landscaping and management of both.
8.2.6 Street Movement• Establish highly connected, legible and permeable street networks that support safe movements and provide direct pedestrian
and cyclist access to the service core.
8.2.7 Street Types• Streets should be designed to service a wide range of industrial activities and accommodate a wide range of vehicle types; and
• Streets should be designed to accommodate other required functions such as bus stops, cycle lanes, on-street parking and emergency vehicle access.
8.2.8 Pedestrian / Cycle Movement• Integrate and plan public transport routes, as well as safe and connected dual-use pathways, footpaths and bicycle facilities.

110
8.2.9 Street Design• Provide streetscapes that respond to the particular characteristics of the site and area; and
• Ensure streetscapes are durable and require minimal maintenance.
Figure 39: Industrial Examples – Redlands Business Park (Source: Lat27)
Carbrook Wetlands Conservation Park
Future Development
Freight Accessibility
Located adjacent to Cleveland-Redland Bay Rd that connects
the site to the Gateway Motorway.
Worker Accessibility
Bus stop located at entrance to site. Connected to local bicycle and active transport networks.
Legibility
Attractive and inviting entrance feature.
Stormwater Management
Development underpinned by WSUD principles and integrated water cycle
management stormwater flows, water quality and
sustainable water use. Off site stormwater treatment areas.
Open Space
Regeneration of over 9ha of bushland to optimise natural
site values. Establishment of 105 000 drought tolerant plants reflecting the regions
natural flora and fauna.
8.0 URBAN DESIGN PRINCIPLES

111
GYMPIE REGIONAL COUNCIL – LOCAL DEVELOPMENT AREA STRUCTURE PLANS – PLANNING REPORT
8.2.10 Open Space and Public Realm• Wherever appropriate, seek opportunities to provide open spaces, pocket parks or plaza spaces associated with a service core
that provide opportunities for employees to actively or passively use;
• Ensure new developments provide suitable activation and passive surveillance of existing and new open space areas;
• Significant waterways or other natural features should be protected and retained as a feature of the area and connected to the broader open space network including any cycle or pedestrian networks; and
• Provide street trees wherever possible at the rate of a minimum of 1 per 20 metres of road length.
8.2.11 On-site Landscaping• Landscape all open areas not used for buildings, driveways, parking, recreational facilities or pedestrian amenities;
• Wherever practicable, retain mature and healthy vegetation and trees when developing the site, especially native species;
• Facilitate sustainable water use by using automated, weather-based watering systems and drip irrigation to water landscaped areas; and
• Facilitate stormwater capture, retention, and infiltration, and prevent runoff by using permeable or porous paving materials in lieu of concrete or asphalt. Collect, store, and reuse stormwater for landscape irrigation.
8.2.12 Building Form and Performance
Industrial estates should:
• Ensure the built form maximises the efficient use of resources and land and is climate responsive;
• Reduce on-going operational costs to improve economic sustainability of the development through the adoption of resource efficiencies and adaptable building design;
• Ensure the development reflects local heritage and identity and provides a safe and accessible environment; and
• Ensure the development adopts best practice measures to minimise impacts on the surrounding environment, particularly in areas of pollution control.
8.2.13 Integrated Water Cycle Management• Maximise opportunities for efficient use, reuse and recycling of water resources and ensure appropriate management of
stormwater quality and quantity;
• Strategies to improve the management of water resources include:
– Infiltrate minor rainfall events as close to the source as possible i.e. install soakage systems in road reserves and verges;
– Treat stormwater flows prior to them entering the receiving environments via bioretention systems incorporated into road reserves and verges;
– Manage flooding and water logging appropriately;
– Minimise impervious areas by using pervious paving and direct stormwater from pervious areas to vegetated garden areas;
– Install rainwater tanks and collection systems to supply water for non-potable uses;
– Investigate the viability of using recycled water to assist in meeting the demand, particularly for toilet flushing, external uses and suitable industrial processes;
– Consider the proximity of available alternative sources (i.e. wastewater treatment plants), available infrastructure (i.e. third pipe networks) and availability of other sources (i.e. groundwater);
– Seek opportunities to provide recycled water from sources within the industrial development, through industrial networking. Co-locate industry types that are able to supply and use recycled water;
– Establish water efficient landscaping in public areas and promote the use of drought resistant, local vegetation; and
– Identify monitoring requirements for the assessment of water use (supply) and any impact of the industrial development on the water resources of the area (ground and surface water including any wetlands and drainage).

112
Figure 40: Urban Design Demonstration – Mitchell Eco Industrial Estate (Source: Lat27)
Energy
Solar powered street lighting, water pumps and security
system / extensive insulation of sheds / energy efficient
lighting.
Site Responsive Design
Protection and enhancement of landform, natural
environments and hydrology. Existing dam and vegetation
retained.
Freight Accessibility
Direct access along Stapylton-Jacobs Well Rd to the Pacific
Motorway.
Integrated Water Management
100% reduction in potable water use.
3 x 45000L underground tanks to capture road storm water
and roof water (potable).Rainwater tanks.
Gross pollutant traps.Semi-permeable paving.
Subsurface irrigation itilising rainwater.
Open Space & Public Realm
Recreation area for employees with gazebo and barbecue
facilities.
8.0 URBAN DESIGN PRINCIPLES

113
GYMPIE REGIONAL COUNCIL – LOCAL DEVELOPMENT AREA STRUCTURE PLANS – PLANNING REPORT
8.2.14 Energy
Industrial developments should investigate strategies to:
• Reduce the amount of energy used;
• Improve the efficiency of use;
• Increase the use of renewable sources.
• Strategies to improve the management and use of energy resources include:
– Retention of landform as far as practicable to minimise cut to fill needs and the transport and supply of fill;
– Ensure appropriate layout and orientation of blocks so that premises can maximise passive solar lighting, thermal conditions and cross ventilation;
– Investigate renewable sources of energy (consider a system of decentralised power generation such as cogeneration) or provide infrastructure to facilitate connection of the development to a renewable power generation and distribution system;
– Investigate opportunities for energy recovery through industrial networking within the estate;
– Design a safe, equitable and feasible road layout with a clearly defined access hierarchy to facilitate the traffic flow of heavy goods delivery vehicles as well as commuter and visitor traffic; and
– Develop a traffic management strategy which addresses access to industrial developments including noise management and parking needs and encourages increased public transport use, walking and cycling to maximise the use of land and minimise emissions from transport sources.
8.2.15 Waste
Investigate coordinated precinct-wide waste management strategies that:
• Ensure access to recycling facilities by incorporating a resource recovery facility or recycling facility within the development to reduce waste outputs; and
• Identify and categorise areas for the stockpiling or storage of wastes to achieve optimal exchange of products and by-products.
8.2.16 Communal Area
Investigate strategies for management of common areas that:
• Provide for effective maintenance;
• Ensure common areas are largely free of rubbish; and
• Establish responsibilities with regard to the management of communal areas.
9.0Recommendations

Gympie Township
Southside Precinct
East Deep Creek Precinct
Victory Heights Precinct
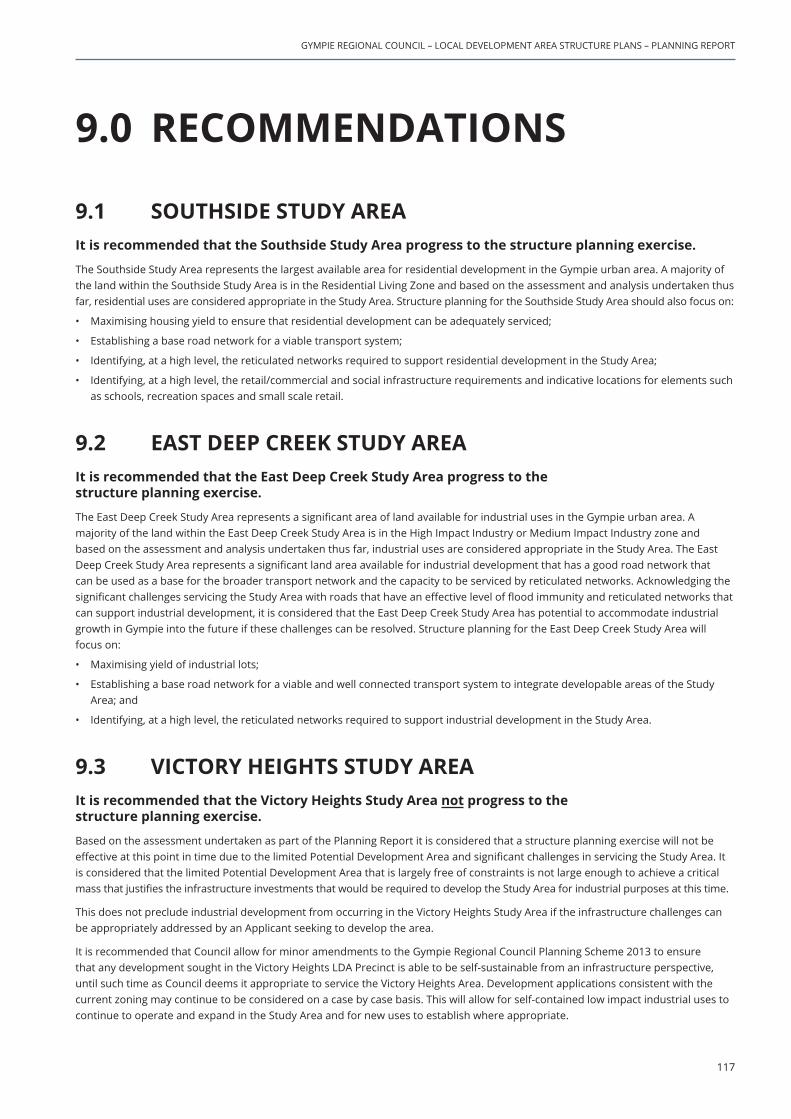
117
GYMPIE REGIONAL COUNCIL – LOCAL DEVELOPMENT AREA STRUCTURE PLANS – PLANNING REPORT
9.0 RECOMMENDATIONS
9.1 SOUTHSIDE STUDY AREAIt is recommended that the Southside Study Area progress to the structure planning exercise.
The Southside Study Area represents the largest available area for residential development in the Gympie urban area. A majority of the land within the Southside Study Area is in the Residential Living Zone and based on the assessment and analysis undertaken thus far, residential uses are considered appropriate in the Study Area. Structure planning for the Southside Study Area should also focus on:
• Maximising housing yield to ensure that residential development can be adequately serviced;
• Establishing a base road network for a viable transport system;
• Identifying, at a high level, the reticulated networks required to support residential development in the Study Area;
• Identifying, at a high level, the retail/commercial and social infrastructure requirements and indicative locations for elements such as schools, recreation spaces and small scale retail.
9.2 EAST DEEP CREEK STUDY AREAIt is recommended that the East Deep Creek Study Area progress to the structure planning exercise.
The East Deep Creek Study Area represents a significant area of land available for industrial uses in the Gympie urban area. A majority of the land within the East Deep Creek Study Area is in the High Impact Industry or Medium Impact Industry zone and based on the assessment and analysis undertaken thus far, industrial uses are considered appropriate in the Study Area. The East Deep Creek Study Area represents a significant land area available for industrial development that has a good road network that can be used as a base for the broader transport network and the capacity to be serviced by reticulated networks. Acknowledging the significant challenges servicing the Study Area with roads that have an effective level of flood immunity and reticulated networks that can support industrial development, it is considered that the East Deep Creek Study Area has potential to accommodate industrial growth in Gympie into the future if these challenges can be resolved. Structure planning for the East Deep Creek Study Area will focus on:
• Maximising yield of industrial lots;
• Establishing a base road network for a viable and well connected transport system to integrate developable areas of the Study Area; and
• Identifying, at a high level, the reticulated networks required to support industrial development in the Study Area.
9.3 VICTORY HEIGHTS STUDY AREAIt is recommended that the Victory Heights Study Area not progress to the structure planning exercise.
Based on the assessment undertaken as part of the Planning Report it is considered that a structure planning exercise will not be effective at this point in time due to the limited Potential Development Area and significant challenges in servicing the Study Area. It is considered that the limited Potential Development Area that is largely free of constraints is not large enough to achieve a critical mass that justifies the infrastructure investments that would be required to develop the Study Area for industrial purposes at this time.
This does not preclude industrial development from occurring in the Victory Heights Study Area if the infrastructure challenges can be appropriately addressed by an Applicant seeking to develop the area.
It is recommended that Council allow for minor amendments to the Gympie Regional Council Planning Scheme 2013 to ensure that any development sought in the Victory Heights LDA Precinct is able to be self-sustainable from an infrastructure perspective, until such time as Council deems it appropriate to service the Victory Heights Area. Development applications consistent with the current zoning may continue to be considered on a case by case basis. This will allow for self-contained low impact industrial uses to continue to operate and expand in the Study Area and for new uses to establish where appropriate.
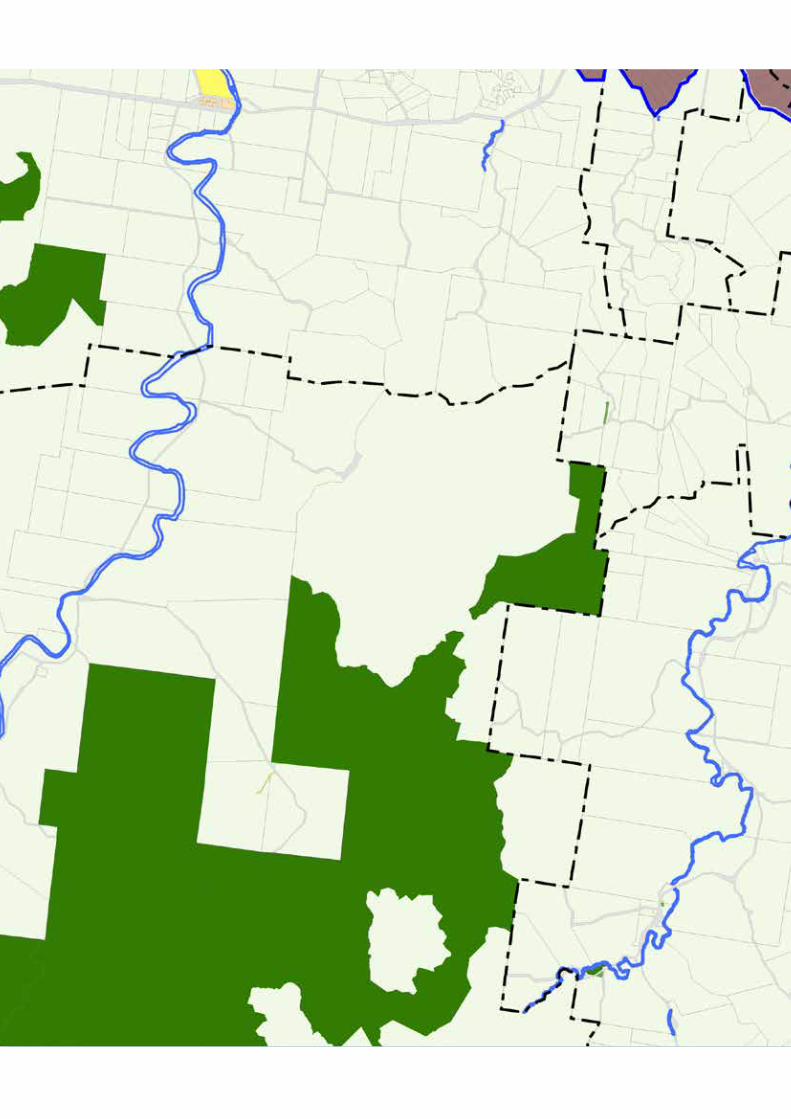

10.0Next Steps
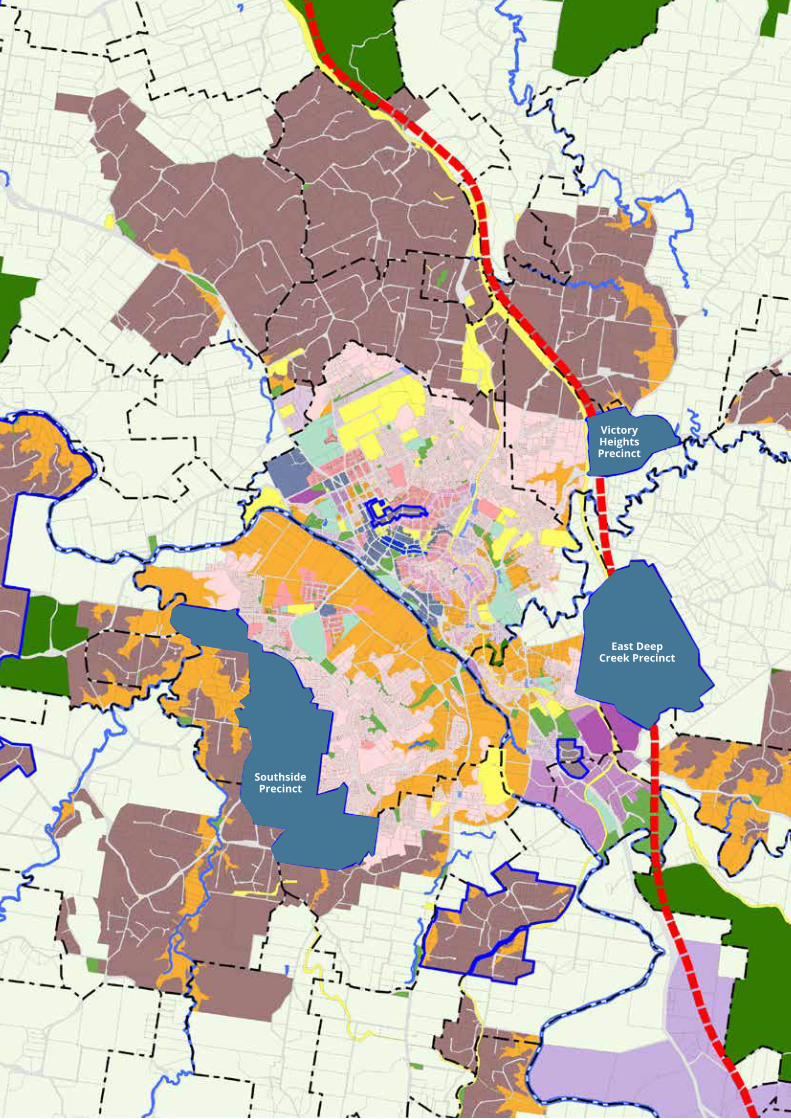
East Deep Creek Precinct
Victory Heights Precinct
Southside Precinct

121
GYMPIE REGIONAL COUNCIL – LOCAL DEVELOPMENT AREA STRUCTURE PLANS – PLANNING REPORT
10.0 NEXT STEPSThis Planning Report has confirmed the constraints, opportunities, challenges and key values to be retained for each of the Study Areas. The Report has confirmed the appropriateness of each Study Area in the context of the structure planning exercise and has laid the foundation for structure planning by providing direction with regard to the potential developable land within each Study Area and the appropriateness (or otherwise), of each Study Area to proceed to structure planning. The Report also establishes of urban design principles to guide further discussions.
It has been recommended that the Southside and East Deep Creek Study Areas proceed to structure planning. Victory Heights has not been recommended for structure planning at this stage, due to a number of factors that limit the effectiveness of structure planning.
It has been determined that there are significant constraints over each of the LDA Precincts and as a result, more detailed investigations will need to be undertaken to confirm the actual development opportunities in each of the Precincts. This analysis will largely be undertaken as part of the structure planning exercise for Southside and East Deep Creek, which will work to ultimately resolve the constraints where possible and provide a clearer picture of the development potential of Southside and East Deep Creek Study Areas.
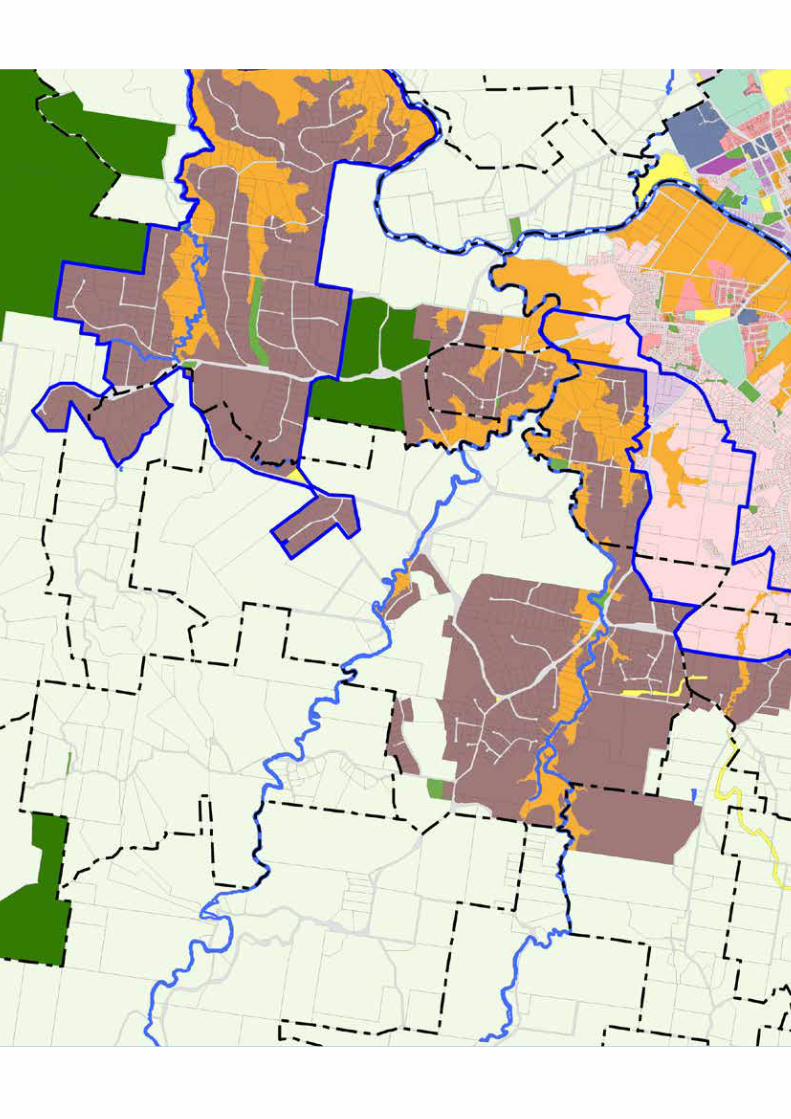

Appendicies

Appendix OneEconomic Need
Assessment

Industrial & Residential Needs Analyses
Gympie LDA Plans
Prepared for
Gympie Regional Council
December 2015
15019

CONTENTS
SUMMARY ....................................................................................1
1. INTRODUCTION ....................................................................6
1.1 Purpose of Report and Methodology ........................................... 6
2. GYMPIE POPULATION AND EMPLOYMENT GROWTH ......8
2.1 Estimated Resident Population .................................................... 8
2.1.1 Historic Estimated Resident Population ........................................ 8
2.1.2 Projected Estimated Resident Population ................................... 11
2.2 Usual Resident and Household Projections ............................. 12
2.2.1 Age Profiles .................................................................................... 13
2.3 Implications for Southside Precinct ........................................... 14
2.4 Gympie Region Employment Profile .......................................... 15
2.4.1 Population-based industrial land demand ................................... 16
2.4.2 Other sources of industrial land demand .................................... 18
3. GYMPIE URBAN AREA INDUSTRIAL MARKETS .............. 20
3.1 Context .......................................................................................... 20
3.2 Gympie Zoning Designation ....................................................... 20
3.3 Industrial Land Supply in Gympie Urban Area ......................... 20
3.4 Lot Size and Occupancy .............................................................. 24
3.5 Key Changes in Industrial Land Provision ................................ 25
4. GYMPIE INDUSTRIAL ACTIVITIES ..................................... 27
4.1 Broad Industry Structure in Gympie LGA.................................. 27
4.1.1 Key Changes in Broad Industry Structure, Gympie LGA ............ 28
4.2 Gympie Urban Area Industrial Structure ................................... 29
4.2.1 Retail Trade ................................................................................. 31
4.2.2 Manufacturing .............................................................................. 32
4.2.3 Other Services ............................................................................. 32
4.2.4 Other Prominent Industry Sectors ............................................... 32
ABN 59 111 542 673
Suite 31, Level 4 50-56 Sanders Street UPPER MT GRAVATT, QLD, 4122
P: (07) 3422 2011 [email protected]
www.foresightpartners.com.au

Disclaimer
The sole purpose of this report is to
provide. Gympie Regional Council
(the Client) with information in
accordance with Foresight Partners
Pty Ltd’s scope of services set out
in its proposal to the Client.
Foresight Partners has relied upon
information relevant to this report
provided by government agencies,
the Client and others. Except as
otherwise stated in the report,
Foresight Partners has not
attempted to verify the accuracy or
completeness of such information.
The assumptions underlying the
findings, observations, forecasts
and conclusions presented in this
report are subject to significant
uncertainties and contingencies.
Therefore, actual results may differ
significantly from forecast results.
Foresight Partners do not make or
imply any warranty or guarantee
with respect to the data reported or
to the findings, observations,
forecasts and conclusions
expressed in this report. Foresight
Partners cannot confirm or
guarantee achievement of any
forecast growth or performance, as
future events, by nature, are not
amenable to independent
confirmation or substantiation.
4.3 Changes in Urban Area Industrial Structure ............................. 33
5. LOCAL DEVELOPMENT AREAS ........................................ 35
5.1 East Deep Creek ........................................................................... 36
5.2 Victory Heights ............................................................................. 39
5.3 Southside ...................................................................................... 40
5.4 Need and Demand for Precinct Areas ........................................ 43
5.4.1 Southside Precinct ...................................................................... 43
5.4.2 East Deep Creek Precinct ........................................................... 44
5.4.3 Victory Heights ............................................................................ 45
5.4.4 Comments ...................................................................................... 45
Appendix A1 - ANZSIC Division, Subdivision and Group of Gympie
Businesses, 2015 .................................................................................. 48
Appendix A2 - Businesses in the Gympie Regional Council LGA by
Number of Employees and Industry Division, June 2014 ................. 48
Appendix A3 - Businesses in the Gympie Region by Number of
Employees and Industry Division, June 2007 .................................... 48
Appendix A4 - Change in Businesses in the Gympie Regional
Council LGA by Number of Employees and Industry Division, June
2007 – June 2014 ................................................................................... 48
Appendix A5 - ANZSIC Division of Industrial Businesses, Gympie
Urban Area 2008 - 2015 ......................................................................... 48

LIST OF FIGURES Figure 2.1: Gympie Urban Area (SA2s) and Local Development Areas 9
Figure 2.2: Estimated Resident Population Increase, 2006 to 2014, Gympie Regional Council 10
Figure 2.3: Projected Estimated Resident Population Increase by SA2, 2014 to 2036 11
Figure 2.4: Projected Age-Sex Structure of Gympie LGA and Queensland, 2011 and 2036 13
Figure 3.1: Occupied, Underdeveloped, and Vacant Land, Gympie Urban Area, September 2015 23
Figure 4.1: Number of Businesses in the Current Gympie Regional Council Area, 2007-2014 29
Figure 4.2: Industrial Activity in Gympie Urban Area 2015 (299 Businesses) 31
Figure 4.3: Industrial Activity in Gympie Urban Area 2008 (208 Businesses) 31
Figure 4.4: Change Industrial Businesses in Gympie Urban Area, 2008 - 2015 33
Figure 5.1: Occupied, Underdeveloped, and Vacant Land, East Deep Creek Precinct, September 2015 38
Figure 5.2: Occupied, Underdeveloped, and Vacant Land, Victory Heights LDA Precinct, September 2015 39
Figure 5.3: Zoning Designation Southside Precinct, Gympie Regional Planning Scheme 2013 42
LIST OF TABLES Table 2.1: Estimated Resident Population by SA2s (rounded to the
nearest hundred), 2006-2014 10
Table 2.2: Estimated Resident Population Projections by SA2, 2014 to 2036 11
Table 2.3: Forecast Usual Resident Population and Household Growth by SA2, 2014 to 2036 12
Table 2.4: Employment per Hectare by Industry Sector 16
Table 2.5: Historic and Forecast Employment Distribution by Industrial Sector, Gympie LGA, 2001 to 2036 17
Table 2.6: Indicative Additional Land Demand Generated by Employment Growth in Main Industry Sectors between 2011 and 2036, Gympie LGA (Gross hectares) 18
Table 3.1: Designated Industrial Land (ha), Gympie Urban Area 2015 21
Table 3.2: Former Zoning by Current Industrial Land Designation (ha), Gympie Urban Area 2015 21
Table 3.3: Supply of Designated Industrial Land (ha), Gympie Urban Area, 2015 22
Table 3.4: Designated Industrial Land by Lot Size (ha), Gympie, 2015 24
Table 4.1: Businesses in the Gympie LGA by Number of Employees, June 2014 28
Table 4.2: ANZSIC Division of Businesses, Gympie Urban Area 2015 30
Table 5.1: Current Zoning Designation and Area (ha) of Select LDA Areas Gympie 35
Table 5.2: Former Zoning Designation and Area (ha) of Select LDA Areas Gympie 35
Table 5.3: Observed East Deep Creek Precinct Businesses September 2015 36
Table 5.4: East Deep Creek Precinct Lot Size and Status, 2015 36
Table 5.5: Victory Heights Precinct Lot Size and Status, 2015 40
Table 5.6: Observed Victory Height Business Inventory 40
Table 5.7: Southside Precinct Lot Size and Status, 2015 41

1
Gympie LDA Structure Plans - Needs
15019 Rev 1
7 December 2015
SUMMARY
Gympie Regional Council (GRC) is preparing Structure Plans for three Local Development
Areas: two industrial areas at East Deep Creek and Victory Heights, and a residential area
at Southside to identify future development outcomes and encourage development to
accommodate future employment and residential growth. The structure planning study for
these areas is being undertaken on behalf of GRC by PSA Consulting, in association with
Lat27 and Foresight Partners.
Population Growth and Housing
Gympie Regional Council’s estimated resident population is 48,400 as at June 2014,
increasing from 46,900 at the 2011 Census. The Gympie LGA is projected to increase by
around 15,600 persons between 2014 and 2036, of which 6,300 (40.4%) is projected to
occur within Gympie’s Urban Area.
Between 2014 and 2036 the Gympie LGA will need to accommodate an additional 6,400
households (dwellings). Gympie’s Urban Area, comprising the Gympie-North and
Gympie-South Statistical Areas 2 (SA2) should experience significant growth in dwelling
demand, with an additional 2,550 households needed over the 22 year period. Of this,
some 1,350 dwellings will be needed in the Gympie-North SA2 and 1,200 dwellings in the
Gympie-South SA2. At typical suburban yields of eight to ten dwellings per hectare of
land, this implies 120 to 150ha of land required in the Gympie South SA2, in which the
Southside Precinct lies, but higher average yields may be achieved and require less land.
Industrial employment
Between 2011 and 2036, Gympie LGA’s employment base is forecast to increase by
nearly 6,600 workers, of which about 2,080 are expected to be employed within industrial
sectors. The three industry sectors of manufacturing, wholesale trade, and transport,
postal and warehousing account for 1,545 additional jobs, or 74.3% of the forecast
industrial employment increase by 2036. The percentage of people working in industrial
sectors within the Gympie Region is forecast to increase only slightly by 2036, to 30.8% of
the employed population, up from 30.5% as at the 2011 Census.
Employment based estimates of future demand suggest an additional 42ha to 66ha of
gross industrial land will be needed by 2036 for these three main industry sectors
(manufacturing, wholesale trade, and transport, postal and warehousing). This equates to
an annual demand of 1.7ha to 2.6ha over the 25 year period between 2011 and 2036.
The transport, postal and warehousing sector is expected to require the most amount of
land, however, the demand is expected to be fairly evenly distributed across the three
sectors. Although these land demand estimates are based on the population of the whole
of the Gympie LGA, most of the demand for this land is expected to be met within the
Gympie Urban Area.

2
Gympie LDA Structure Plans - Needs
15019 Rev 1
7 December 2015
Industrial Land Provision and Occupancy
At present the Gympie Urban Area has a total of 769.3ha of industrial zoned land.
Although zone changes in the current planning scheme make direct comparisons
problematic the provision of industrial land has increase significantly since 2008 when
191.9ha of industrial land was present. Of the current 769.3ha, 186.2ha (24.2%) are Low
Impact Industry, 320.7ha (42.7%) are Medium Impact Industry, and 262.5ha (34.1%) are
High Impact Industry. Of this 262.5ha of High Impact Industry land, 120.0ha (45.7%) is
occupied by the mining lease ML3772 which comprises the Gympie El Dorado Gold Mine.
Excluding the Gympie El Dorado Gold Mine Area, there is presently a total 649.2ha of
zoned industrial land of which:
• 236.6ha or 36.4% is occupied (260 lots);
• 304.2ha or 46.9% is vacant (125 lots); and
• 108.3ha or 16.7% (245 lots) is under-developed and predominantly occupied by
residential dwellings.
Although the Gympie Urban Area has a significant supply of vacant industrial land, much
of it is subject to environmental limitations such as flood risk and steep slopes.
The majority of occupied land is held in lots ranging between one and five hectares, with
34 lots accounting for 67.1ha or 28.3% of occupied land, however, the vast majority of
lots are under one hectare, with about half (128 lots or 49.2%) less than 2,000m2 in size.
Vacant land is predominantly held in lots between five and ten hectares, totalling 18 lots
and 136.2ha. Smaller vacant lots (under one hectare) are more numerous (66 lots) but
represent less than 8% (23.9ha) of the urban area’s vacant land. Vacant lots were
scattered on the outskirts of industrial precincts, and often lack important infrastructure
such as sealed roads.
A large Industry Investigation Area is located approximately two kilometres south of the
Gympie Urban Area. This designated area covers 1,796.1 ha of land and is well-
positioned to the Gympie Airport and the future Bruce Highway Bypass. Subject to future
detailed planning investigations to determine its suitability for industrial uses, this area
could provide Gympie with a sizable potential land bank to meet longer term industrial
land demand.
Gympie Industrial Activities
Australian Bureau of Statistics’ Business Count data at 2014 shows the Gympie LGA’s
economic structure indicates that of the 4,313 businesses counted, 1,268 or 29% fall
within an industrial classification. About 65% of all registered businesses, and nearly 60%
of all industrial businesses, are non-employing, with the large number of non-employing
firms suggest that most would not occupy ‘formal’ industrial land and premises, but would
be home-based (e.g. construction and trades), in rural properties or in small offices and
premises. Of the 510 industrial businesses who do employ people, 390 or three quarters
3
Gympie LDA Structure Plans - Needs
15019 Rev 1
7 December 2015
of them employ fewer than five persons, and only 23 industrial business employ more
than 20 people.
There has been a net increase of 107 businesses operating in the Gympie LGA between
2007 and 2014, with 59 or 55% of these new businesses falling in industrial sectors.
Growth was strongest amongst Construction and Transport, Postal and Warehousing.
Our September 2015 field inspection in the Gympie Urban Area identified a total of 299
active industrial businesses on industrial zoned land, which were classified by ANZSIC
categories. Three industry sectors Retail Trade, Manufacturing and Other Services
account for 59.5% of total activity in the area. A second tier of industries (Wholesale
Trade, Construction and Transport, Postal and Warehousing) form an important industrial
presence and account for 25.1% of businesses.
When compared to Foresight Partners’ 2008 inventory for the Gympie Urban Area, a total
of 106 new businesses were identified. The largest increase of businesses was in Retail
Trade (on industrial zoned land) which grew by 33 businesses. The Other Services
division (which mainly comprises automotive repairs and maintenance) increased by 17
businesses, and the number of observed Construction businesses also increased
significantly from nine to 22 over this period.
Need and Demand for Precinct Areas
Southside Local Development Area
The Southside Precinct represents the Gympie Urban Area’s largest area available for
residential development. With some 374ha of land zoned for Residential Living, it has the
capacity to accommodate significant additional population growth in a mix of lot sizes and
housing types. The precinct should have more than sufficient capacity to accommodate
all of the forecast demand for an additional 1,200 dwellings to house the 2,950 increase in
population projected for the whole of the Gympie-South SA2 by 2036.
The area is likely to continue to attract family households, indicating a need for detached
dwellings on a variety of lot sizes. However, Gympie’s older age profile as at the 2011
Census and as projected at 2036, also indicates retirement facilities will be required as
part of the Southside Precinct’s housing mix. The area is also likely to require additional
retail, community and recreational facilities to service future populations within and near
the defined precinct.
East Deep Creek Local Development Area
The 82 lots comprising the East Deep Creek area total to 344.8ha of which 91.1ha or
26.4% is occupied. Occupied lots are large with sizes between one and five hectares
being the most commonly held. There are 21 vacant lots which accounted for 95.0ha or
27.5% of the precincts land. A total of 22 lots covering 120.0ha (34.8% of the precinct) is
mine affected and falls under the Gympie El Dorado Gold Mine lease (ML37772) to the
northeast of Flood Road Gold Mine.
The East Deep Creek Precinct currently supports a small number of high impact industries
as well as medium and lower impact businesses. High Impact zoned land in or close to

4
Gympie LDA Structure Plans - Needs
15019 Rev 1
7 December 2015
most urban areas is comparatively scarce, although such scarcity is not generally
reflected in higher land prices. Future demand for High and Medium Impact zoned land in
the precinct is likely to come from expansion of existing High and Medium Impact
businesses in (or adjacent to) the East Deep Precinct, and from new firms attracted to the
area, especially once the Gympie Bypass is in place. However the precinct, although
large (344.9ha including 120ha of mine lease area), has constraints that will also limit its
ability to accommodate future industries.
The East Deep Creek Precinct can continue to fulfil its role in accommodating firms
requiring (relatively scarce) High and Medium Impact industry land for their operations, but
the quantity of useable land is likely to be significantly less than suggested by its overall
size.
Although it might be possible to reclaim and rehabilitate the large area occupied by the
Gympie Eldorado Gold Mine dam area to create to useable industrial land, the costs to do
so would have to be weighed by potential users. Coupled with steep slope, flood risk and
areas of regulated vegetation, the amount of useable land would also need to be weighed
against the potential infrastructure investment necessary to improve road accessibility and
flood immunity. Consequently, the East Deep Creek Precinct may prove insufficient to
cater to longer term demand for Medium and High Impact industrial land.
Victory Heights Local Development Area
The Local Development Area consists of 25 lots totaling 86.9ha of Medium and Low
Impact Industry land. At present there is minimal development in the area, and there are
no structures in the area west of Ascot Road—an area of 40.8ha owned by the
Department of Main Roads and Transport. The precinct is predominantly vacant and
contains a number of residential dwellings (classified as underdeveloped). Only two lots
appear occupied by active businesses with occupied land representing only 4.0ha or 4.6%
of the precinct area.
The Bypass will have an interchange at the precinct’s northern border which is also the
main route (Tin Can Bay Road) to the region’s popular coastal holiday and residential
areas which would enhance the precinct’s attraction for smaller, population-serving
industry activities. The Victory Heights Precinct is close to the urban centre and is well-
positioned to accommodate smaller industrial uses serving the Gympie region, and a
number of such businesses are currently operating in this area.
Despite the positive locational attributes of the Victory Heights Precinct the combination of
constraints, its small size and relative isolation from services may compromise its ability to
accommodate a viable industrial precinct. It may attract a few more individual businesses
on existing lots, such as the few transport depot and workshops currently operating,
particularly as home-based businesses, but its ultimate usable area may not meet
Gympie’s future need for Light and Medium Industry land.
Comments
In 2009, the Gympie Urban area was facing an immediate and pressing need for
additional zoned and useable industrial land, with only 47ha of vacant land available. The

5
Gympie LDA Structure Plans - Needs
15019 Rev 1
7 December 2015
amount of zoned industrial land in the Gympie Urban area more than tripled from less
than 200ha in 2009 to 649ha in 2015 with vacant zoned land increasing six-fold to
304.2ha. This was achieved mainly by the rezoning of the East Deep Creek and Victory
Heights precincts for industry use.
At face value, the current vacant land stock represents potentially a 60 year supply based
on historic take-up rates of 5ha per annum. The 180ha of vacant land within the LDAs
represents a potential 36 year supply, with the 124ha of vacant industrial land elsewhere
in the Gympie Urban area representing a potential 25 year supply, if all land could be
used.
Thus, if all vacant land were “good quality” industrial land and equally available for
development, the need to service and develop the vacant industrial land within the three
LDAs need not arise for at least ten years (allowing for the maintenance of a 15 year
supply buffer of zoned land).
If it is assumed that only 50% the 304.2ha of “raw” vacant land can be developed as gross
supply, the potential supply in hand reduces to 30 years. Given the constraints facing
much of Gympie’s vacant industrial land and in the absence of detailed constraints
analysis of all vacant industrial land, this is probably a reasonable assumption. Under this
scenario, the need to service and develop the East Deep Creek and Victory Heights
precincts could arise within the next five to ten years.

6
Gympie LDA Structure Plans - Needs
15019 Rev 1
7 December 2015
1. INTRODUCTION
Gympie Regional Council (GRC) is preparing Structure Plans for three Local Development
Areas; two industrial areas at East Deep Creek and Victory Heights, and a residential area
at Southside to identify future development outcomes and encourage development to
accommodate future employment and residential growth. The structure planning study for
these areas is being undertaken on behalf of GRC by PSA Consulting, in association with
Lat27 and Foresight Partners.
1.1 Purpose of Report and Methodology
The purpose of this report is to provide an up-to-date market overview and assessment of
the need for the industrial and residential precincts as input into the structure planning
process to ensure the planning outcomes are soundly based.
In January 2009 Foresight Partners completed the Industrial Land Demand Study on
behalf of Gympie Regional Council for the whole of the local government area, which
included a comprehensive industrial inventory and supply-demand analysis and
evaluation of need for additional land to meet demand. Although this present report will
not replicate this earlier work, it does enable a solid base from which to identify and
highlight key changes and trends in Gympie’s industrial market evident over the past six to
seven years.
Tasks undertaken as part of this report include:
• a desktop analysis of industrial zoned land stocks as at 2008 and 2015, by
comparing the current Gympie Regional Council Planning Scheme and earlier
Planning Schemes;
• an update of vacant industrial land supply since 2008, through field inspections
and an analysis of land uptake over the past seven years;
• an update of business activities mainly (but not exclusively) on industrial zoned
land to highland any structural changes evident (by ANZSIC1 categories) over
this period;
• analysis of relevant council approvals, development proposals, major projects
and other economic activities impacting upon the current supply of future
industrial land requirements to meet future growth;
• an overview of previous population projections and residential and rural
residential housing needs for Gympie undertaken on behalf of Council;
1 Australian and New Zealand Standard Industrial Classification. (2006 Edition).

7
Gympie LDA Structure Plans - Needs
15019 Rev 1
7 December 2015
• revisitation of future housing needs based upon current projections and its
implications for future residential housing demand and land requirements over
time; and
• identification of local centre provision in light of revised population projections.
Section 2 of this report briefly summarises population growth projections to 2036, its
equivalent housing demand and broad implications for residential land. The current and
future employment profiles of the Gympie Local Government area are also presented,
together with estimates of industrial land demand likely to be generated by population and
employment growth.
Section 3 provides an overview of industrial land supply in Gympie’s Urban Area noting
the amount of occupied, vacant and underutilised industrial land.
Section 4 examines Gympie’s business and industry structure at the Local Government
Area level using Australian Bureau of Statistics data noting changes between 2007 and
2014 and changes at the Gympie Urban Area using Foresight Partners’ land use
inventories undertaken in June 2008 and again at September 2015.
Section 5 examines the three Local Development Areas with respect to current land use
mixes and areas available for future development. It then provides an assessment of need
for these areas and their role in servicing Gympie’s future population and industry growth.

8
Gympie LDA Structure Plans - Needs
15019 Rev 1
7 December 2015
2. GYMPIE POPULATION AND EMPLOYMENT GROWTH
The February 2010 Gympie Planning Study–Residential and Rural Residential Study,
which was prepared to inform Gympie Regional Council’s 2013 Planning Scheme,
determined the quantity of residential and rural residential land needed and where new
residential development should occur to accommodate projected population growth over a
20 year time frame to 2031.
That study, and the work it relied upon2, were prepared well before the 2011 Census and
the Queensland State Government Statistician’s (QGSO) preparation of new population
projections (to 2036). Projections in the 2010 study show Gympie’s population increasing
by 15,344 between 2009 and 2031, reaching 66,943, and that an additional 6,035
dwellings would be needed to house this population increase (pages 23-24). It also
indicated that 3,078 of these dwellings would be needed in the Gympie Urban area.
Given the passage of time, it is prudent revisit broad implications for housing demand in
light of more recent data. Although this section does not attempt to replicate these earlier
and more detailed works, it does provide a more up-to-date background for future housing
demand prospects and assessing the Southside Precinct’s potential role in meeting at
least part of this demand.
2.1 Estimated Resident Population
The Australian Bureau of Statistics produces Estimated Resident Population (ERP)
figures for intercensal years, the latest of which is for June 2014. The QGSO’s most
recent population (and housing) projections (2013 edition) provide population growth
scenarios to 2036.
2.1.1 Historic Estimated Resident Population
Gympie Regional Council’s estimated resident population is 48,400 at June 2014, up from
42,500 at the 2006 Census, and 46,900 at the 2011 Census. Since 2006, its population
has increased by around 5,900 (13.9%). Figure 2.1 shows the Gympie Urban Area, which
consists of the Gympie-North and Gympie-South Statistical Areas 2 (SA2).
Table 2.1 and Figure 2.2 show the distribution of Gympie’s growth for each SA2
comprising Gympie Local Government Area (LGA).3
2 GHD, 2009. Report Demographic Profile, Gympie Regional Council; Economic Associates, 2010. Gympie
Planning Scheme Review – Commercial Study.
3 Please note that there is a small variance between the SA2 boundaries comprising Gympie LGA and the
LGA boundary. The resulting variation in population numbers is however minimal, and for the purposes of this
report Gympie LGA’s total population is the sum of the SA2s comprising the LGA.

0 1
kilometres
EE
L C
RE
EK
RD
EE
L C
RE
EK
RD
EE
L C
RE
EK
RD
EE
L C
RE
EK
RD
EE
L C
RE
EK
RD
EE
L C
RE
EK
RD
EE
L C
RE
EK
RD
EE
L C
RE
EK
RD
EE
L C
RE
EK
RD
Pie
Cre
ek
Pie
Cre
ek
Pie
Cre
ek
Pie
Cre
ek
Pie
Cre
ek
Pie
Cre
ek
Pie
Cre
ek
Pie
Cre
ek
Pie
Cre
ek
2
BR
UC
E H
WY
(A1)
BR
UC
E H
WY
(A1)
BR
UC
E H
WY
(A1)
BR
UC
E H
WY
(A1)
BR
UC
E H
WY
(A1)
BR
UC
E H
WY
(A1)
BR
UC
E H
WY
(A1)
BR
UC
E H
WY
(A1)
BR
UC
E H
WY
(A1)
GYMPIE - WOOLOOGA RD
GYMPIE - WOOLOOGA RD
GYMPIE - WOOLOOGA RD
GYMPIE - WOOLOOGA RD
GYMPIE - WOOLOOGA RD
GYMPIE - WOOLOOGA RD
GYMPIE - WOOLOOGA RD
GYMPIE - WOOLOOGA RD
GYMPIE - WOOLOOGA RD
CO
RE
LLA
RD
CO
RE
LLA
RD
CO
RE
LLA
RD
CO
RE
LLA
RD
CO
RE
LLA
RD
CO
RE
LLA
RD
CO
RE
LLA
RD
CO
RE
LLA
RD
CO
RE
LLA
RD
OLD MARYBOROUGH RD
OLD MARYBOROUGH RD
OLD MARYBOROUGH RD
OLD MARYBOROUGH RD
OLD MARYBOROUGH RD
OLD MARYBOROUGH RD
OLD MARYBOROUGH RD
OLD MARYBOROUGH RD
OLD MARYBOROUGH RD
Gympie Bypass (Proposed)
Gympie Bypass (Proposed)
Gympie Bypass (Proposed)
Gympie Bypass (Proposed)
Gympie Bypass (Proposed)
Gympie Bypass (Proposed)
Gympie Bypass (Proposed)
Gympie Bypass (Proposed)
Gympie Bypass (Proposed)
GYMPIE CONNECTION RD
GYMPIE CONNECTION RD
GYMPIE CONNECTION RD
GYMPIE CONNECTION RD
GYMPIE CONNECTION RD
GYMPIE CONNECTION RD
GYMPIE CONNECTION RD
GYMPIE CONNECTION RD
GYMPIE CONNECTION RD
Victory HeightsVictory HeightsVictory HeightsVictory HeightsVictory HeightsVictory HeightsVictory HeightsVictory HeightsVictory Heights
LDA PrecinctLDA PrecinctLDA PrecinctLDA PrecinctLDA PrecinctLDA PrecinctLDA PrecinctLDA PrecinctLDA Precinct
GYMPIEGYMPIEGYMPIEGYMPIEGYMPIEGYMPIEGYMPIEGYMPIEGYMPIE
NORTHNORTHNORTHNORTHNORTHNORTHNORTHNORTHNORTH
SA2SA2SA2SA2SA2SA2SA2SA2SA2
GYMPIEGYMPIEGYMPIEGYMPIEGYMPIEGYMPIEGYMPIEGYMPIEGYMPIE
SOUTHSOUTHSOUTHSOUTHSOUTHSOUTHSOUTHSOUTHSOUTH
SA2SA2SA2SA2SA2SA2SA2SA2SA2
Deep Creek
Deep Creek
Deep Creek
Deep Creek
Deep Creek
Deep Creek
Deep Creek
Deep Creek
Deep CreekPO
WER RD
POW
ER RD
POW
ER RD
POW
ER RD
POW
ER RD
POW
ER RD
POW
ER RD
POW
ER RD
POW
ER RD
Southside Southside Southside Southside Southside Southside Southside Southside Southside
LDALDALDALDALDALDALDALDALDA
PrecinctPrecinctPrecinctPrecinctPrecinctPrecinctPrecinctPrecinctPrecinct
East DeepEast DeepEast DeepEast DeepEast DeepEast DeepEast DeepEast DeepEast Deep
Creek LDACreek LDACreek LDACreek LDACreek LDACreek LDACreek LDACreek LDACreek LDA
PrecinctPrecinctPrecinctPrecinctPrecinctPrecinctPrecinctPrecinctPrecinct
GY
MP
IE -
BR
OO
LO
O R
D
GY
MP
IE -
BR
OO
LO
O R
D
GY
MP
IE -
BR
OO
LO
O R
D
GY
MP
IE -
BR
OO
LO
O R
D
GY
MP
IE -
BR
OO
LO
O R
D
GY
MP
IE -
BR
OO
LO
O R
D
GY
MP
IE -
BR
OO
LO
O R
D
GY
MP
IE -
BR
OO
LO
O R
D
GY
MP
IE -
BR
OO
LO
O R
D
NOOSA RD
NOOSA RD
NOOSA RD
NOOSA RD
NOOSA RD
NOOSA RD
NOOSA RD
NOOSA RD
NOOSA RD
Gym
pie
Byp
ass (P
ropose
d)
Gym
pie
Byp
ass (P
ropose
d)
Gym
pie
Byp
ass (P
ropose
d)
Gym
pie
Byp
ass (P
ropose
d)
Gym
pie
Byp
ass (P
ropose
d)
Gym
pie
Byp
ass (P
ropose
d)
Gym
pie
Byp
ass (P
ropose
d)
Gym
pie
Byp
ass (P
ropose
d)
Gym
pie
Byp
ass (P
ropose
d)
North
Coast R
ail Line
North
Coast R
ail Line
North
Coast R
ail Line
North
Coast R
ail Line
North
Coast R
ail Line
North
Coast R
ail Line
North
Coast R
ail Line
North
Coast R
ail Line
North
Coast R
ail Line
Mary River
Mary River
Mary River
Mary River
Mary River
Mary River
Mary River
Mary River
Mary River
EAST DEEP CREEK RD
EAST DEEP CREEK RD
EAST DEEP CREEK RD
EAST DEEP CREEK RD
EAST DEEP CREEK RD
EAST DEEP CREEK RD
EAST DEEP CREEK RD
EAST DEEP CREEK RD
EAST DEEP CREEK RD
TIN
CA
N B
AY
RD
TIN
CA
N B
AY
RD
TIN
CA
N B
AY
RD
TIN
CA
N B
AY
RD
TIN
CA
N B
AY
RD
TIN
CA
N B
AY
RD
TIN
CA
N B
AY
RD
TIN
CA
N B
AY
RD
TIN
CA
N B
AY
RD
Figure 2.1: Gympie Urban Area (SA2s) and Local Development Areas

10
Gympie LDA Structure Plans - Needs
15019 Rev 1
7 December 2015
Gympie’s Urban Area, which comprises the SA2s of Gympie-North and Gympie-South,
experienced the largest population increase, of around 3,200 persons. Gympie’s Urban
Area accounted for more than half (54.2%) of Gympie LGA’s total population increase
over the 2006-2014 period.
The Gympie Region, which surrounds the urban area, accounted for 1,500 (or 25.4%) of
the LGA’s population increase to 2014.
Table 2.1: Estimated Resident Population by SA2s (rounded to the nearest hundred), 2006-2014
2006 2011 2014 Change 2006-2014 % of Total Gympie LGA
Growth ERP ERP ERP Persons %
Gympie - North 12,400 13,500 13,900 1,500 12.1% 25.4%
Gympie - South 5,200 6,500 6,900 1,700 32.7% 28.8%
Gympie Region 16,400 17,300 17,900 1,500 9.1% 25.4%
Cooloola 5,100 5,900 6,000 900 17.6% 15.3%
Kilkivan 3,400 3,600 3,700 300 8.8% 5.1%
Gympie LGA Total 42,500 46,800 48,400 5,900 13.9% 100.0%
Source: QGSO ERP by SA2.
Figure 2.2: Estimated Resident Population Increase, 2006 to 2014, Gympie Regional Council
Source: QGSO ERP by SA2.
Actual population growth for the Gympie LGA have lagged historic projections
underpinning previous background studies to the Planning Scheme. For example, the
GRC’s 2011 population was expected to reach about 49,300 by 2011 in those studies, but
Census data for 2011 indicate an estimated resident population of about 46,800 (about a
5% difference).
0
500
1,000
1,500
2,000
2,500
3,000
3,500
Gympie Urban Area Gympie Region Cooloola Kilkivan
Popula
tion I
ncre
ase 2
006-1
4
Statistical Area 2
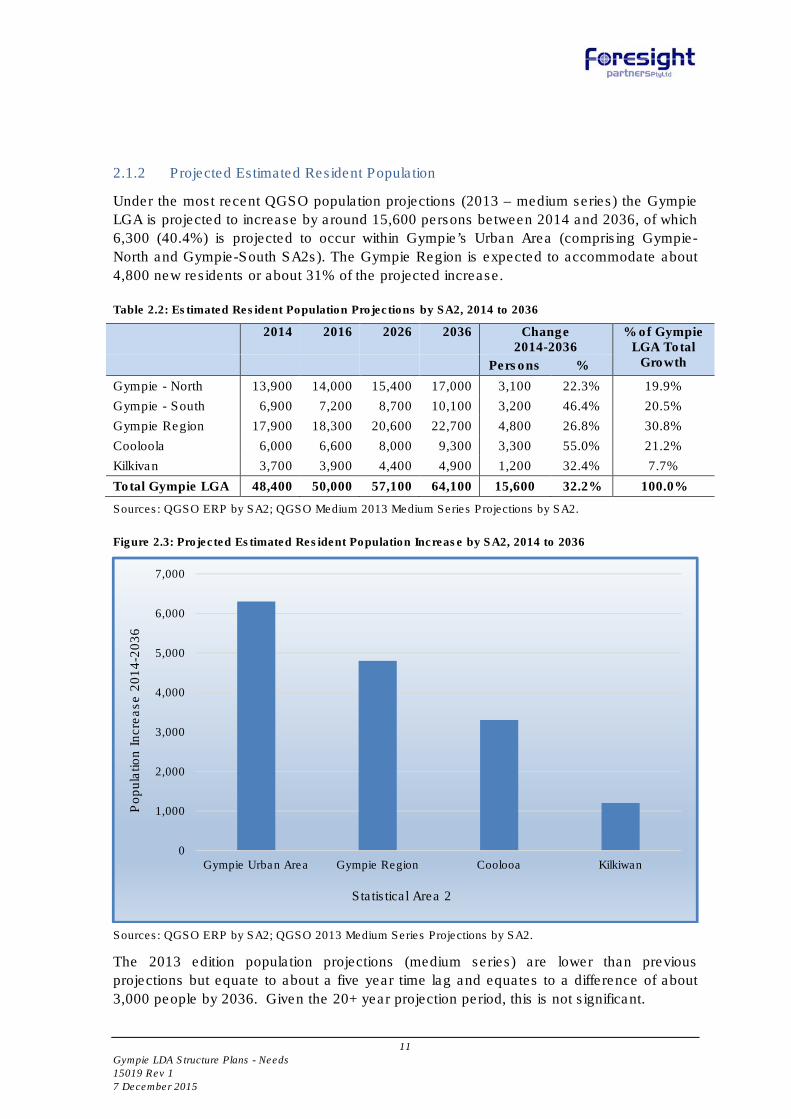
11
Gympie LDA Structure Plans - Needs
15019 Rev 1
7 December 2015
2.1.2 Projected Estimated Resident Population
Under the most recent QGSO population projections (2013 – medium series) the Gympie
LGA is projected to increase by around 15,600 persons between 2014 and 2036, of which
6,300 (40.4%) is projected to occur within Gympie’s Urban Area (comprising Gympie-
North and Gympie-South SA2s). The Gympie Region is expected to accommodate about
4,800 new residents or about 31% of the projected increase.
Table 2.2: Estimated Resident Population Projections by SA2, 2014 to 2036
2014 2016 2026 2036 Change
2014-2036 % of Gympie
LGA Total Growth Persons %
Gympie - North 13,900 14,000 15,400 17,000 3,100 22.3% 19.9%
Gympie - South 6,900 7,200 8,700 10,100 3,200 46.4% 20.5%
Gympie Region 17,900 18,300 20,600 22,700 4,800 26.8% 30.8%
Cooloola 6,000 6,600 8,000 9,300 3,300 55.0% 21.2%
Kilkivan 3,700 3,900 4,400 4,900 1,200 32.4% 7.7%
Total Gympie LGA 48,400 50,000 57,100 64,100 15,600 32.2% 100.0%
Sources: QGSO ERP by SA2; QGSO Medium 2013 Medium Series Projections by SA2.
Figure 2.3: Projected Estimated Resident Population Increase by SA2, 2014 to 2036
Sources: QGSO ERP by SA2; QGSO 2013 Medium Series Projections by SA2.
The 2013 edition population projections (medium series) are lower than previous
projections but equate to about a five year time lag and equates to a difference of about
3,000 people by 2036. Given the 20+ year projection period, this is not significant.
0
1,000
2,000
3,000
4,000
5,000
6,000
7,000
Gympie Urban Area Gympie Region Coolooa Kilkiwan
Popula
tion I
ncre
ase 2
014-2
036
Statistical Area 2

12
Gympie LDA Structure Plans - Needs
15019 Rev 1
7 December 2015
2.2 Usual Resident and Household Projections
Projected population growth over a 22 year period to 2036 will determine housing needs
within Gympie LGA. In order to forecast the need for additional dwellings, the number of
persons residing in private dwellings (usual residents) and dwelling occupancy rates
(persons per dwelling) as at the 2011 Census have been used as the base. It is assumed
that the number of usual residents will increase in line with projected increase in the ERP.
The occupancy rate is expected to change in line with the occupancy rate projections for
Gympie LGA.
Please note that the number of usual residents is smaller than the ERP, as the usual
resident figure does not include persons living in non-private accommodation such as
nursing homes, hostels, hotels, staff quarters and prisons.
Table 2.3 sets out the forecast increase in usual residents and households between 2014
and 2036 for each SA2 and the Gympie LGA total. These forecasts are more conservative
than QGSO’s LGA household projections, which are based on ERP figures and include
vacant as well as occupied private dwellings.
Table 2.3: Forecast Usual Resident Population and Household Growth by SA2, 2014 to 2036
Change
2014-2036
2014 2016 2021 2026 2031 2036 No. %
Gympie - North
Usual Residents 12,600 12,750 13,350 14,000 14,700 15,450 2,850 22.6%
Households 5,400 5,500 5,800 6,100 6,450 6,750 1,350 25.0%
Occupancy Rate 2.34 2.33 2.31 2.30 2.29 2.29
Gympie - South
Usual Residents 6,250 6,550 7,250 7,950 8,600 9,200 2,950 47.2%
Households 2,450 2,550 2,850 3,100 3,400 3,650 1,200 49.0%
Occupancy Rate 2.58 2.57 2.55 2.54 2.53 2.53
Gympie Region
Usual Residents 16,400 16,800 17,850 18,850 19,850 20,850 4,450 27.1%
Households 6,450 6,650 7,100 7,550 7,950 8,350 1,900 29.5%
Occupancy Rate 2.55 2.54 2.52 2.51 2.50 2.50
Cooloola
Usual Residents 5,300 5,750 6,400 7,000 7,600 8,200 2,900 54.7%
Households 2,450 2,700 3,000 3,300 3,600 3,900 1,450 59.2%
Occupancy Rate 2.16 2.15 2.13 2.12 2.11 2.11
Kilkivan
Usual Residents 3,300 3,450 3,700 3,900 4,100 4,350 1,050 31.8%
Households 1,350 1,450 1,550 1,650 1,750 1,850 500 37.0%
Occupancy Rate 2.40 2.39 2.37 2.36 2.35 2.35
Gympie LGA
Usual Residents 43,850 45,300 48,550 51,700 54,850 58,050 14,200 32.4%
Households 18,100 18,850 20,300 21,700 23,150 24,500 6,400 35.4%
Occupancy Rate 2.42 2.40 2.39 2.38 2.37 2.37
Sources: ABS 2011 Census; QGSO 2013 Medium Series Household and Populations Projections by LGA and
SA2.
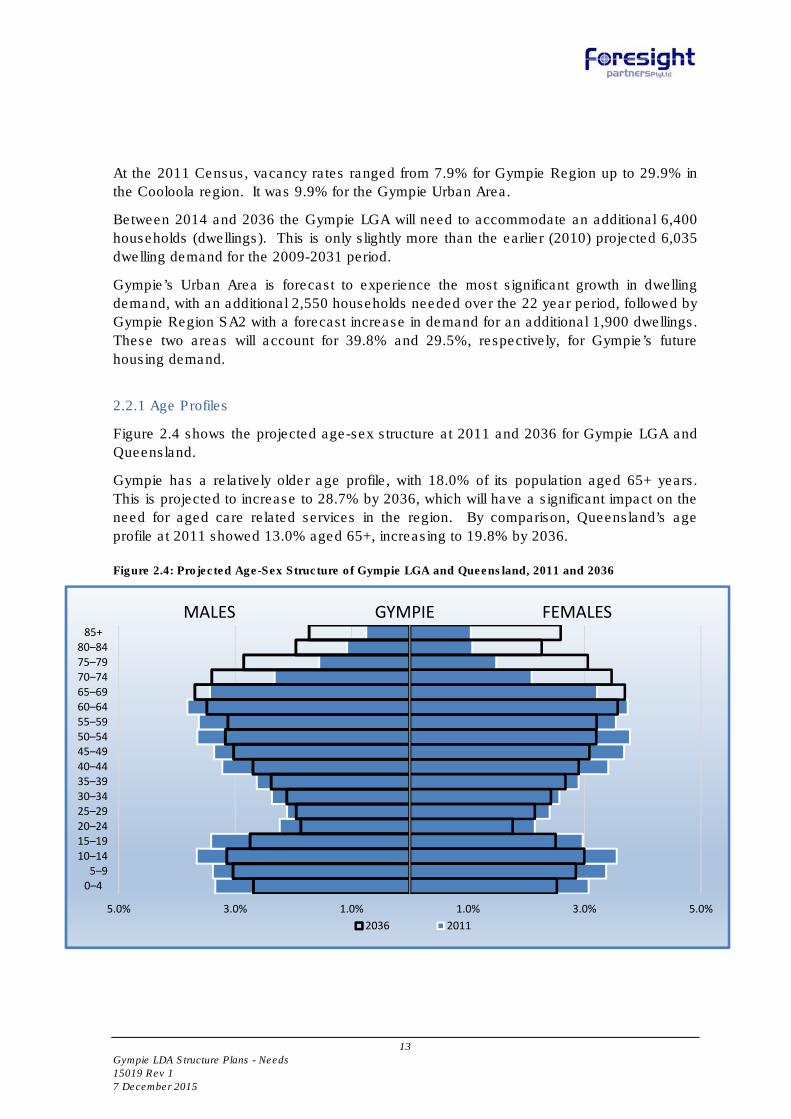
13
Gympie LDA Structure Plans - Needs
15019 Rev 1
7 December 2015
At the 2011 Census, vacancy rates ranged from 7.9% for Gympie Region up to 29.9% in
the Cooloola region. It was 9.9% for the Gympie Urban Area.
Between 2014 and 2036 the Gympie LGA will need to accommodate an additional 6,400
households (dwellings). This is only slightly more than the earlier (2010) projected 6,035
dwelling demand for the 2009-2031 period.
Gympie’s Urban Area is forecast to experience the most significant growth in dwelling
demand, with an additional 2,550 households needed over the 22 year period, followed by
Gympie Region SA2 with a forecast increase in demand for an additional 1,900 dwellings.
These two areas will account for 39.8% and 29.5%, respectively, for Gympie’s future
housing demand.
2.2.1 Age Profiles
Figure 2.4 shows the projected age-sex structure at 2011 and 2036 for Gympie LGA and
Queensland.
Gympie has a relatively older age profile, with 18.0% of its population aged 65+ years.
This is projected to increase to 28.7% by 2036, which will have a significant impact on the
need for aged care related services in the region. By comparison, Queensland’s age
profile at 2011 showed 13.0% aged 65+, increasing to 19.8% by 2036.
Figure 2.4: Projected Age-Sex Structure of Gympie LGA and Queensland, 2011 and 2036
5.0% 3.0% 1.0% 1.0% 3.0% 5.0%
0–4
5–9
10–14
15–19
20–24
25–29
30–34
35–39
40–44
45–49
50–54
55–59
60–64
65–69
70–74
75–79
80–84
85+
MALES GYMPIE FEMALES
2036 2011

14
Gympie LDA Structure Plans - Needs
15019 Rev 1
7 December 2015
Sources: ABS 2011 Census; QGSO Population Projections by Age and Sex, 2013 Series.
2.3 Implications for Southside Precinct
As noted earlier the 2010 Residential and Rural Residential Study the Gympie LGA would
require an additional 6,035 dwellings between 2009 and 2031, of which 3,078 would be
needed in the Gympie Urban area over this 22 year period.
Using more recent QGSO projections, our forecasts over the 22 year period 2014 to 2036
suggest a need for an additional 6,400 dwellings, of which 2,550 would be needed in the
Gympie Urban Area, with 1,350 dwellings in the Gympie-North SA2 and 1,200 dwellings in
the Gympie-South SA2. This is only slightly more than was projected in the 2010 study
and, in effect, represents about a five year time lag. That is, the dwelling demand
originally forecast for 2031 is now likely to be needed by 2036.
At a typical suburban dwelling yield of eight to ten per hectare, this implies 120-150ha of
land would be required in the Gympie South SA2, in which the Southside Precinct lies.
Using the 14 dwelling yield per hectare assumed for Residential Zoned land nominated in
the 2010 report (page 22), only 86ha of land would be required. The actual yield
achievable will be determined by the amount of unconstrained land available for
development. The higher implied land estimate is probably the more realistic for
infrastructure provision.
However the Gympie-North/South distinction is somewhat artificial as the pattern of future
residential growth within the Gympie Urban Area will be strongly driven by land availability
5.0% 4.0% 3.0% 2.0% 1.0% 0.0% 1.0% 2.0% 3.0% 4.0% 5.0%
0–4
5–9
10–14
15–19
20–24
25–29
30–34
35–39
40–44
45–49
50–54
55–59
60–64
65–69
70–74
75–79
80–84
85+
MALES QLD FEMALES
2036 2011
15
Gympie LDA Structure Plans - Needs
15019 Rev 1
7 December 2015
(and price). The indicated 1,200 additional dwellings for the Gympie-South SA2 is
indicative rather than prescriptive.
The Southside Precinct is quite large at 457.6ha, with over 370ha of land zoned
Residential Living (refer Table 5.7 in Section 5). As only 120-150ha of land would be
needed to accommodate the 1,200 additional dwellings forecast for the whole of the
Gympie-South SA2, the Southside Precinct alone should capable of accommodating this
future demand. Theoretically, if the whole of the 370ha of land zoned Residential Living
within the precinct were capable of development, it could accommodate at least 3,000
dwellings (or 5,180 at 14 dwellings per hectare)—which is more than is forecast for the
whole of the Gympie Urban area by 2036.
However, despite its theoretical potential to accommodate future growth well beyond that
forecast for Gympie-South SA2, the Southside Precinct is unlikely to capture all indicated
future residential demand. Development constraints may well result in lower development
yields and not all precinct land owners may seek to subdivide their land to accommodate
higher residential densities. As well, other areas within the Gympie-South SA2 may also
be capable of accommodating future residential growth.
Nevertheless, the Southside Precinct should still be capable of accommodating significant
housing development. Planning for this precinct should focus on maximising housing
yield and providing a variety of housing choices and lot sizes, although most will be single
dwellings.
Retirement facilities should form part of its future housing mix, providing independent
living units and (for larger facilities) serviced units. As noted earlier, Gympie LGA’s age-
sex structure at 2036 indicates the over 70s age group will form a larger proportion of its
population than as at 2011.
2.4 Gympie Region Employment Profile
Table 2.4 sets out the number and distribution of industrial employees as at the 2001 and
2011 Census and provides estimates of future industrial employment based on population
growth up to 2036. Industrial sectors which are assumed to contain businesses that
typically locate on industrial zoned land are:
• mining;
• manufacturing;
• electricity, gas and water supply;
• construction;
• wholesale trade; and
• transport, postal and manufacturing.
The forecasts are based on a number of assumptions, including a constant population
employment level and an industry distribution change in line with distribution changes
between 2001 and 2011. Some further adjustments have been made to reflect likely shifts

16
Gympie LDA Structure Plans - Needs
15019 Rev 1
7 December 2015
in industry structure, such as a greater proportion employed in wholesale trade,
manufacturing and transport, postal and warehousing, and a lesser proportion employed
in mining and construction.
Between 2011 and 2036, Gympie LGA’s employment base is forecast to increase by
nearly 6,600 workers, of which about 2,080 are expected to be employed within the six
industry sectors shown in Table 2.4. The percentage of people working in industrial
sectors within the Gympie Region is forecast to increase only slightly by 2036, to 30.8% of
the employed population, up from 30.5% as at the 2011 Census.
2.4.1 Population-based industrial land demand
Industry employment forecasts provide a useful, if only partial, indicator of likely future
industrial land requirements. A broad estimate of the industrial land needed to
accommodate the forecast increase in industrial employment by 2036 can be calculated
by applying industrial employment densities per hectare to the increase in employment.
Some sectors, such as mining, electricity, gas, water and waste services, and to a large
extent, construction, do not require significant land or premises in typical industrial estates
or areas. Consequently, only employment gains expected in manufacturing, wholesale
trade, and transport, postal and warehousing are used to estimate future industrial land
demand.
The employment densities applied to the three industry sectors are summarised in Table
2.5 and are based on Foresight Partners’ previous industrial land studies and the then
Queensland Department of Business Industry and Regional Development (DBIRD)
benchmarks.
Table 2.4: Employment per Hectare by Industry Sector
Industry Employment/ Gross Hectare
Manufacturing 30-50
Wholesale Trade 20-30
Transport, Postal and Warehousing 20-30
Sources: Department of Business, Industry and Regional Development, 1995, Establishing Future Business
and Industry Land Requirements and Identifying Strategically Important Sites; Foresight Partners estimates.
The three industry sectors of manufacturing, wholesale trade, and transport, postal and
warehousing account for 1,545 additional jobs, or 74.3% of the forecast industrial
employment increase by 2036.

17
Gympie LDA Structure Plans - Needs
15019 Rev 1
7 December 2015
Table 2.5: Historic and Forecast Employment Distribution by Industrial Sector, Gympie LGA, 2001 to 2036
Census Forecast Increase 2011-2036
2001 2011 2016 2026 2036
(No.) (%) (No.) (%) (No.) (%) (No.) (%) (No.) (%) (No.)
Mining 175 4.2% 258 4.9% 263 4.7% 274 4.2% 286 3.9% 28
Manufacturing 1,789 43.1% 1,972 37.8% 2,123 37.6% 2,404 37.1% 2,669 36.6% 697
Elec, Gas & Water Supply 92 2.2% 154 2.9% 171 3.0% 205 3.2% 241 3.3% 87
Construction 845 20.4% 1,525 29.2% 1,598 28.3% 1,757 27.2% 1,944 26.6% 419
Wholesale Trade 635 15.3% 525 10.1% 609 10.8% 762 11.8% 899 12.3% 374
Transport, Postal and Warehousing
614 14.8% 787 15.1% 883 15.6% 1,071 16.5% 1,260 17.3% 473
Total Industrial 4,150 100.0% 5,221 100.0% 5,646 100.0% 6,473 100.0% 7,300 100.0% 2,079
Population 38,062 46,837 49,992 57,051 64,056 17,219
Population Employed 13,937 36.6% 17,111 36.5% 18,504 37.0% 21,117 37.0% 23,709 37.0% 6,598
% Employed in Industrial Sector 4,150 29.8% 5,221 30.5% 5,646 30.5% 6,473 30.7% 7,300 30.8% 2,079
Sources: QGSO ERP by LGA 2013 Medium Series, ABS 2001, 2006 and 2011 Censuses; Foresight Partners estimates.

18
Gympie LDA Structure Plans - Needs
15019 Rev 1
7 December 2015
Table 2.6 sets out an indicative estimate of future land required by these three industry
sectors by 2036, based on the range of employment densities outlined above. These
range from 42ha to 66ha of gross land.
“Gross” land includes areas for roads, easements and any open space requirements. It
does not allow for potential constraints, such as water courses, steep topography, flooding
and protected vegetation. For planning purposes, the amount of gross land indicated is
doubled to allow for potential constraints. Thus, the “raw” land requirement is likely to be
in the order of 84ha to 132ha. Where “good quality” industrial land is available, the raw
and gross land requirements may be the same or similar.
Table 2.6: Indicative Additional Land Demand Generated by Employment Growth in Main Industry
Sectors between 2011 and 2036, Gympie LGA (Gross hectares)
Additional
Employment Higher Density
Employment Lower Density
Employment Distribution of Demand
(No.) (Ha) (Ha) (%)
Manufacturing 697 13.9 23.2 35.4%
Wholesale Trade 374 12.5 18.7 28.5%
Transport, Postal and Warehousing
473 15.8 23.7 36.1%
Total Industrial 1,545 42.2 65.6 100.0%
Note: 30-50 employees per hectare used for manufacturing and 20-30 employees used for wholesale trade
and transport, postal and warehousing to generate higher and lower density equivalent land demand.
Sources: Queensland DBIRD (1995), Foresight Partners.
Employment based estimates of future demand suggest an additional 42ha to 66ha of
gross industrial land will be needed by 2036 for these three main industry sectors. This
equates to an annual demand of 1.7ha to 2.6ha over the 25 year period between 2011
and 2036. The transport, postal and warehousing sector is expected to require the most
amount of land, however, the demand is expected to be fairly evenly distributed across
the three sectors.
Although these land demand estimates are based on the population of the whole of the
Gympie LGA, most of the demand for this land is expected to be met within the Gympie
Urban area.
2.4.2 Other sources of industrial land demand
Employment based estimates of future land demand are likely to under-estimate likely
total demand. As noted in the 2009 Industrial Land Demand Study, Gympie’s industrial
structure is not limited to local markets and “punches above its weight” with respect to the
size and scale of some of its industries and market reach (page 45).
Other sources of demand are likely to come from larger enterprises seeking large sites,
especially for heavier industries, which are often hard to locate. These opportunities, by
nature, are somewhat serendipitous and difficult to anticipate, but can bring major benefits

19
Gympie LDA Structure Plans - Needs
15019 Rev 1
7 December 2015
with respect to employment and training, as well as contributing to the regional, state and
national economies.
Land demand from one large enterprise could absorb the equivalent of several years of
industrial land demand generated by population growth alone. As indicated in the 2009
study, it is important for relatively small industrial markets such as Gympie to have ample
land set aside in reserve to take advantage of opportunities when they arise, especially
when firms seeking larger sites (e.g. five hectares or more) for heavier industries and land
consumptive activities.
Gympie Regional Council has, in fact, done this by significantly increasing the amount of
zoned industrial land via East Deep Creek and Victory Heights, but is also looking further
into the future by establishing a large Industry Investigation Area south of town near the
airport. Although this Industry Investigation land may one day play an important role in
meeting future supply, subject to future detailed planning investigations, it should not
detract from the Victory Heights and East Deep Creek Local Development Areas within
the life of the current Gympie Regional Council Planning Scheme 2013.

20
Gympie LDA Structure Plans - Needs
15019 Rev 1
7 December 2015
3. GYMPIE URBAN AREA INDUSTRIAL MARKETS
This section focuses more closely on Gympie’s designated industrial land and the urban
areas current industrial land supply. This section will also present the occupancy status of
industrial land as either occupied, underdeveloped or vacant, in order to assess land take
up in the township.
3.1 Context
Gympie forms a part of the Wide Bay-Burnett region, but its location at the northern fringe
of South East Queensland and its proximity to the Sunshine Coast suggest that it is likely
to share significant synergies and commonalities with these southern industrial markets.
Our previous 2009 study revealed that the major industrial areas that have developed in
the SEQ region are strongly influenced by proximity to major infrastructure such as the
Port of Brisbane and Brisbane Airport, and the major transport network, including the
Pacific, Gateway, Logan and Ipswich Motorways.
Access to major infrastructure has been important to the development of SEQ’s industrial
estates and areas, as it allows them to effectively interact with the region, the state, the
country and the world.
3.2 Gympie Zoning Designation
The adoption of the Gympie Regional Council Planning Scheme 2013 was in line with the
standardised zoning designations as required by the Queensland Planning Provision 3.0
(QPP). This has resulted in distinct separate industry zone categories; namely low,
medium, and high impact industry, special industry, and industry investigation areas.
Previous to this a single broad ‘industry’ zone was used in the former Cooloola Shire
Council Planning Scheme 2005.
The zoning designations of Specialised Centre and Industry Investigation area are also
shown in Table 3.1 for comparison.
3.3 Industrial Land Supply in Gympie Urban Area
Under the current Gympie Regional Council Planning Scheme 2013, a total of 769.3ha of
land has an industrial zoning designation. Of these 769.3ha, 186.2ha (24.2%) are Low
Impact Industry, 320.7ha (42.7%) are Medium Impact Industry, and 262.5ha (34.1%) are
High Impact Industry. Of this 262.5ha of land with High Impact Industry Designation,
120.0ha (45.7%) is occupied by the mining lease ML3772 which comprises the Gympie El
Dorado Gold Mine.
A total of 30.4 ha of land carries a Specialised Centre designation. This land occurs in two
distinct areas the Gympie Medical Precinct just north of the Gympie Town Centre, and the

21
Gympie LDA Structure Plans - Needs
15019 Rev 1
7 December 2015
Monkland Showroom Precinct around Edwin Campion Drive to the south of the urban
area.
The Kybong Industry Investigation Area is a large tract of land generally extending from
Traveston-Cooran Road in the south to approximately two kilometres south of the Gympie
Urban area. The large size of this area, proximity to the Gympie township and airport, as
well positioning in relation to the future Bruce Highway bypass could contribute to it
fulfilling a crucial role in meeting future industrial land supply in the long term, subject to
further more detailed planning beyond the life of the current Gympie Regional Council
Planning Scheme 2013.
Table 3.1: Designated Industrial Land (ha), Gympie Urban Area 2015
Gympie Kybong
High Impact Industry 262.5* -
Medium Impact Industry 320.7 -
Low Impact Industry 186.2 -
Total Industrial Zoned Land 769.3
Specialised Centre 30.4 -
Industry Investigation Area - 1,796.1
Total 799.8 1,796.1
Source: Gympie Regional Council Planning Scheme 2013, Foresight Partners Estimates.
* This includes land occupied by the Gympie El Dorado mining lease (ML3772) covering an area of 120.0 ha.
For comparison, the previous zoning designation for the identical areas under the former
Cooloola Shire Council Planning Scheme is shown in Table 3.2.
Table 3.2: Former Zoning by Current Industrial Land Designation (ha), Gympie Urban Area 2015
High Impact
Industry
Medium Impact
Industry
Low Impact
Industry
Industry Investigation
Area Specialised
Centre Total
Industry 51.9 58.1 47.3 - 10.1 167.4
Rural 199.3* 166.2 70.9 1,796.1 8.1 2,240.5
Community 11.3 48.2 7.2 - 0.4 67.1
Housing - 2.6 16.5 - 11.9 31.0
Rural Residential - 41.2 40.8 - - 82.0
Commercial - 4.4 0.6 - - 5.0
Residential Living - - 2.9 - - 2.9
Total 262.5 320.7 186.2 1,796.1 30.4 2,595.9
Source: Gympie Regional Council Planning Scheme 2013, Cooloola Shire Council Planning Scheme 2005,
Foresight Partners Estimates.
* This includes land occupied by the Gympie El Dorado mining lease (ML3772) covering an area of 120.0 ha.
Combining cadastral lot data with field inspections and September 2014 aerial imagery
the occupancy status of land was determined for land with a zoning designation of High,
Medium, and Low Impact Industry in the Gympie urban area.

22
Gympie LDA Structure Plans - Needs
15019 Rev 1
7 December 2015
To assist in determining land occupancy a set of decision rules were used to differentiate
the classification of vacant and underdeveloped land: Vacant Industrial Land comprises:
• land that is clear of buildings or sheds and appears available for development
activity;
• lots that are being used for temporary activities, such as the storage of pipes and
equipment during road and other infrastructure construction, but which are
nonetheless vacant and available for development once temporary activities
terminate;
• vacant zoned land, if affected by constraints, is included in this category.
Underdeveloped Industrial Land includes:
• lots with a dwelling on site; and
• lots being marginally utilised (typically under 20% of the site area, taking into
account hardstand areas) and mainly used for open storage of materials and
older equipment.
Table 3.3: Supply of Designated Industrial Land (ha), Gympie Urban Area, 2015
Occupied Vacant Under-
developed Total %
Vacant % Under-developed
High Impact Industry 111.7* 14.5 16.1 142.4 10.2% 11.3%
Medium Impact Industry 84.1 180.2 56.4 320.7 56.2% 17.6%
Low Impact Industry 40.8 109.5 35.8 186.2 58.8% 19.3%
Total 236.6 304.2 108.3 649.2 46.9% 16.7%
Source: Gympie Regional Council Planning Scheme 2013, Foresight Partners Estimates.
* This excludes land occupied by the Gympie El Dorado mining lease (ML3772) covering an area of 120.0 ha.
A total 649.2ha of land carries an industrial zoning designation. Of this land, 236.6ha or
36.4% is currently occupied by a business and 304.2 ha (46.9%) of industrial designated
land remains vacant (Figure 3.1).
Although Gympie urban area has a significant supply of vacant industrial land, much is
subject to environmental limitations such as flood risk and steep slopes, ruling out many
industrial uses. Underdeveloped land accounts for 108.3ha (16.7%), and is predominantly
occupied by residential dwellings.
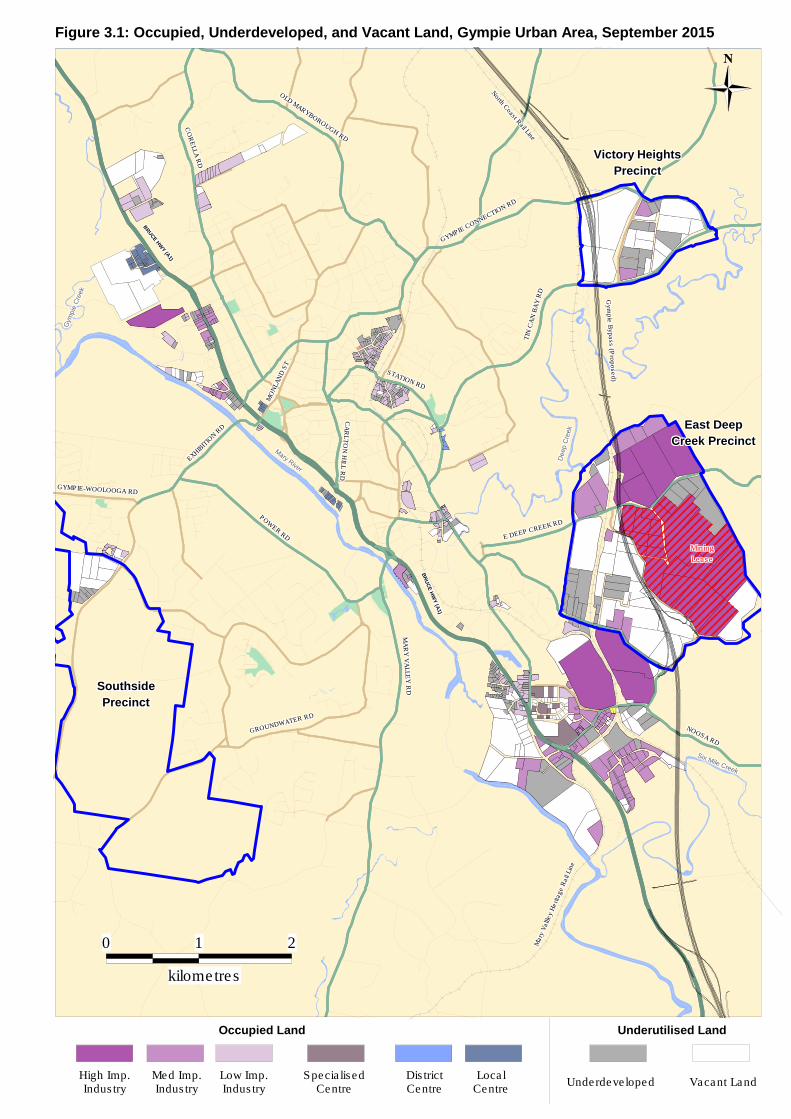
NOOSA RD
NOOSA RD
NOOSA RD
NOOSA RD
NOOSA RD
NOOSA RD
NOOSA RD
NOOSA RD
NOOSA RD
Six Mile Creek
Six Mile Creek
Six Mile Creek
Six Mile Creek
Six Mile Creek
Six Mile Creek
Six Mile Creek
Six Mile Creek
Six Mile Creek
Mary
Valll
ey
Herita
ge R
ail
Lin
e
Mary
Valll
ey
Herita
ge R
ail
Lin
e
Mary
Valll
ey
Herita
ge R
ail
Lin
e
Mary
Valll
ey
Herita
ge R
ail
Lin
e
Mary
Valll
ey
Herita
ge R
ail
Lin
e
Mary
Valll
ey
Herita
ge R
ail
Lin
e
Mary
Valll
ey
Herita
ge R
ail
Lin
e
Mary
Valll
ey
Herita
ge R
ail
Lin
e
Mary
Valll
ey
Herita
ge R
ail
Lin
e
E DEEP CREEK RD
E DEEP CREEK RD
E DEEP CREEK RD
E DEEP CREEK RD
E DEEP CREEK RD
E DEEP CREEK RD
E DEEP CREEK RD
E DEEP CREEK RD
E DEEP CREEK RD
North C
oast Rail Line
North C
oast Rail Line
North C
oast Rail Line
North C
oast Rail Line
North C
oast Rail Line
North C
oast Rail Line
North C
oast Rail Line
North C
oast Rail Line
North C
oast Rail Line
TIN
CA
N B
AY
RD
TIN
CA
N B
AY
RD
TIN
CA
N B
AY
RD
TIN
CA
N B
AY
RD
TIN
CA
N B
AY
RD
TIN
CA
N B
AY
RD
TIN
CA
N B
AY
RD
TIN
CA
N B
AY
RD
TIN
CA
N B
AY
RD
Gym
pie
Bypass (P
ropo
sed)
Gym
pie
Bypass (P
ropo
sed)
Gym
pie
Bypass (P
ropo
sed)
Gym
pie
Bypass (P
ropo
sed)
Gym
pie
Bypass (P
ropo
sed)
Gym
pie
Bypass (P
ropo
sed)
Gym
pie
Bypass (P
ropo
sed)
Gym
pie
Bypass (P
ropo
sed)
Gym
pie
Bypass (P
ropo
sed)
Deep C
reek
Deep C
reek
Deep C
reek
Deep C
reek
Deep C
reek
Deep C
reek
Deep C
reek
Deep C
reek
Deep C
reek
GYMPIE CONNECTION RD
GYMPIE CONNECTION RD
GYMPIE CONNECTION RD
GYMPIE CONNECTION RD
GYMPIE CONNECTION RD
GYMPIE CONNECTION RD
GYMPIE CONNECTION RD
GYMPIE CONNECTION RD
GYMPIE CONNECTION RD
STATION RD
STATION RD
STATION RD
STATION RD
STATION RD
STATION RD
STATION RD
STATION RD
STATION RD
BR
UC
E H
WY
(A1)
BR
UC
E H
WY
(A1)
BR
UC
E H
WY
(A1)
BR
UC
E H
WY
(A1)
BR
UC
E H
WY
(A1)
BR
UC
E H
WY
(A1)
BR
UC
E H
WY
(A1)
BR
UC
E H
WY
(A1)
BR
UC
E H
WY
(A1)
2
MA
RY
VA
LLE
Y R
DM
AR
Y V
ALLE
Y R
DM
AR
Y V
ALLE
Y R
DM
AR
Y V
ALLE
Y R
DM
AR
Y V
ALLE
Y R
DM
AR
Y V
ALLE
Y R
DM
AR
Y V
ALLE
Y R
DM
AR
Y V
ALLE
Y R
DM
AR
Y V
ALLE
Y R
D
GROUNDWATER RD
GROUNDWATER RD
GROUNDWATER RD
GROUNDWATER RD
GROUNDWATER RD
GROUNDWATER RD
GROUNDWATER RD
GROUNDWATER RD
GROUNDWATER RD
kilometres
1
CO
RE
LLA
RD
CO
RE
LLA
RD
CO
RE
LLA
RD
CO
RE
LLA
RD
CO
RE
LLA
RD
CO
RE
LLA
RD
CO
RE
LLA
RD
CO
RE
LLA
RD
CO
RE
LLA
RD
OLD MARYBOROUGH RD
OLD MARYBOROUGH RD
OLD MARYBOROUGH RD
OLD MARYBOROUGH RD
OLD MARYBOROUGH RD
OLD MARYBOROUGH RD
OLD MARYBOROUGH RD
OLD MARYBOROUGH RD
OLD MARYBOROUGH RD
BRU
CE H
WY (A
1)
BRU
CE H
WY (A
1)
BRU
CE H
WY (A
1)
BRU
CE H
WY (A
1)
BRU
CE H
WY (A
1)
BRU
CE H
WY (A
1)
BRU
CE H
WY (A
1)
BRU
CE H
WY (A
1)
BRU
CE H
WY (A
1)
Gym
pie
Cre
ek
Gym
pie
Cre
ek
Gym
pie
Cre
ek
Gym
pie
Cre
ek
Gym
pie
Cre
ek
Gym
pie
Cre
ek
Gym
pie
Cre
ek
Gym
pie
Cre
ek
Gym
pie
Cre
ek
GYMPIE-WOOLOOGA RDGYMPIE-WOOLOOGA RDGYMPIE-WOOLOOGA RDGYMPIE-WOOLOOGA RDGYMPIE-WOOLOOGA RDGYMPIE-WOOLOOGA RDGYMPIE-WOOLOOGA RDGYMPIE-WOOLOOGA RDGYMPIE-WOOLOOGA RD
MO
NLA
ND
ST
MO
NLA
ND
ST
MO
NLA
ND
ST
MO
NLA
ND
ST
MO
NLA
ND
ST
MO
NLA
ND
ST
MO
NLA
ND
ST
MO
NLA
ND
ST
MO
NLA
ND
ST
CA
RLT
ON
HIL
L R
DC
AR
LT
ON
HIL
L R
DC
AR
LT
ON
HIL
L R
DC
AR
LT
ON
HIL
L R
DC
AR
LT
ON
HIL
L R
DC
AR
LT
ON
HIL
L R
DC
AR
LT
ON
HIL
L R
DC
AR
LT
ON
HIL
L R
DC
AR
LT
ON
HIL
L R
D
POW
ER RD
POW
ER RD
POW
ER RD
POW
ER RD
POW
ER RD
POW
ER RD
POW
ER RD
POW
ER RD
POW
ER RD
EXHIB
ITIO
N R
D
EXHIB
ITIO
N R
D
EXHIB
ITIO
N R
D
EXHIB
ITIO
N R
D
EXHIB
ITIO
N R
D
EXHIB
ITIO
N R
D
EXHIB
ITIO
N R
D
EXHIB
ITIO
N R
D
EXHIB
ITIO
N R
D
Mary River
Mary River
Mary River
Mary River
Mary River
Mary River
Mary River
Mary River
Mary River
0
Occupied Land
High Imp.Industry
Med Imp.Industry
Low Imp.Industry
SpecialisedCentre
DistrictCentre
LocalCentre
Underdeveloped Vacant Land
Underutilised Land
SouthsideSouthsideSouthsideSouthsideSouthsideSouthsideSouthsideSouthsideSouthside
PrecinctPrecinctPrecinctPrecinctPrecinctPrecinctPrecinctPrecinctPrecinct
East DeepEast DeepEast DeepEast DeepEast DeepEast DeepEast DeepEast DeepEast Deep
Creek PrecinctCreek PrecinctCreek PrecinctCreek PrecinctCreek PrecinctCreek PrecinctCreek PrecinctCreek PrecinctCreek Precinct
Victory HeightsVictory HeightsVictory HeightsVictory HeightsVictory HeightsVictory HeightsVictory HeightsVictory HeightsVictory Heights
PrecinctPrecinctPrecinctPrecinctPrecinctPrecinctPrecinctPrecinctPrecinct
MiningMiningMiningMiningMiningMiningMiningMiningMining
LeaseLeaseLeaseLeaseLeaseLeaseLeaseLeaseLease
Figure 3.1: Occupied, Underdeveloped, and Vacant Land, Gympie Urban Area, September 2015

24
Gympie LDA Structure Plans - Needs
15019 Rev 1
7 December 2015
Of the 649.2ha of industrial zoned land in the Gympie Urban Area 317.2ha or 48.9%
occurs within the three Local Development Areas (LDAs) of Victory Heights, East Deep
Creek and Southside (excluding the 120.0ha of high impact industry zoned land currently
occupied by the Gympie El Dorado Mining Lease). With respect to vacant land, the three
LDAs:
• account for 180.3ha (59.7%) of the 304.2ha of vacant industrial zoned land in the
Gympie Urban Area; and
• of this, 57.2ha consists of low impact industry, 109.9ha of medium impact
industry and 13.2ha of high impact industry.
The composition and characteristics of the LDA areas are discussed in Section 5.
3.4 Lot Size and Occupancy
Table 3.4: Designated Industrial Land by Lot Size (ha), Gympie, 2015
Lot Size Occupied Vacant Underdeveloped Total
Count Area (ha) Count
Area (ha) Count
Area (ha) Count
Area (ha)
Under 2,000m2 128 13.5 23 2.2 163 15.3 314 31.1
2,000m2 to 4,000m
2 44 12.6 12 3.6 26 6.7 82 22.9
4,000m2 to 1 ha 45 27.4 31 18.1 32 19.6 108 65.1
Between 1.01 and 4.99ha 34 67.1 37 83.7 22 45.7 93 196.5
Between 5 and 9.99ha 4 29.8 18 136.2 1 8.1 23 174.1
Between 10 and 19.99ha 4 59.2 4 60.4 1 12.9 9 132.6
Over 20ha 1 27.1 - - - - 1 27.1
Total 260 236.8 125 304.2 245 108.3 630 649.3
Source: Gympie Regional Council Cadastral Data, Foresight Partners Estimates.
* This excludes land occupied by the Gympie El Dorado mining lease (ML3772) covering an area of 120.0 ha.
Occupied industrial land in Gympie is well distributed by lot size. The majority of occupied
land is held in lots ranging between one and five hectares, with 34 lots accounting for
67.1ha or 28.3% of occupied land. The vast majority of lots are under one hectare, with
about half (128 lots or 49.2%) less than 2,000m2 in size. A further 89 lots are between
2,000m2 and one hectare accounting for a further 34.2%.
Occupied industrial land was fragmented in many different precincts around the city, some
of which were isolated and small in size (less than one hectare). The largest concentration
of industry was the well-established Gympie Industrial estate in the southern suburb of
Glanmire which was tightly held.
Vacant land is predominantly held in lots between five and ten hectares, totalling 18 lots
and 136.2ha. Smaller vacant lots (under one hectare) are more numerous (66 lots) but
represent less than 8% (23.9ha) of the urban area’s vacant land. Vacant lots were
scattered on the outskirts of industrial precincts, and often lacked important infrastructure
such as sealed roads. As shown in Figure 3.1, a significant concentration of vacant
25
Gympie LDA Structure Plans - Needs
15019 Rev 1
7 December 2015
industrial land located between the Mary River and the Bruce Highway in the vicinity of
Old Imbil Road is flood affected and may be unsuitable for some industrial uses.
The majority of underdeveloped lots (221 lots or 90.2%) had an area of less than one
hectare. This is the result of residential dwellings occupying industrial zoned land.
Residential dwellings generally preceded the land’s industrial designation and are now
mixed amongst industrial uses. This was most notable in the suburban industrial zones
around Berrie Street and Bent Street in Gympie’s east.
3.5 Key Changes in Industrial Land Provision
Calculation of meaningful industrial land take-up rates since completion of the 2009
Industrial Land Demand Study has not been practical. Major changes and additions to
industrial zoned land incorporated in the Gympie Regional Council Planning Scheme 2013
have increased zoned industrial land to nearly 650ha, of which 304ha (46.9%) is vacant.
In 2008, the Gympie Urban Area had only 191.9ha of industrial zoned land with a total of
47.4ha vacant (24.7%). Large parts of this vacant land have since changed zoning and
still remain vacant.
For example the 10.1ha Edwin Campion Drive area was zoned Industry under the former
planning scheme and in 2008 just 0.5ha of this land was occupied. Under the current
planning scheme the same area is now zoned Specialised Centre and 4.4ha of the area is
occupied, while 5.7ha still remains vacant. In addition, the Specialised Centre zoning now
extends further south to include two large lots totaling 8.1ha, one of which is occupied by
Bunnings Warehouse (4.7ha) and the other which is for sale as ‘development land’
(3.4ha).
A similar situation has occurred around the Pinewood Avenue area. Three large lots
totaling 32.2ha are currently vacant and carry a District Centre Zoning designation. These
lots were zoned Industry in 2008. At that time a homemaker centre on a 12.9ha lot was
approved but was not built.
The 2009 Industrial Land Demand Study (page 47) found that historic take-up rates for the
whole of the Gympie local government area averaged about ten hectare per annum over
the ten year period 1998-2007, and five hectares per annum over the period 2003 to
20074. In the post-Global Financial Crisis, the likely take-up since 2007 has probably
been considerably less than five hectares per annum but, as the economy continues to
adjust to the post-mining boom environment, Gympie’s industrial markets (and land
demand) should improve over time. These historic take-up rates incorporated growth in
demand generated by population (employment) growth as well as by external or
exogenous demand and reflect mainly demand for Low and Medium Impact industrial
land.
4 Take-up refers to gross land area which does not allow for constraints, as discussed in section
2.4.1.

26
Gympie LDA Structure Plans - Needs
15019 Rev 1
7 December 2015
At face value, Gympie’s 304ha of vacant industrial land would represent the equivalent of
30 years’ supply under its longer term historic take-up pattern, or 60 years’ supply under
the shorter term take-up rate evident between 2003 and 2007. Of this, the three LDAs
180.3ha of vacant industrial land would represent the equivalent of between 18 and 36
years’ supply. If only potential demand generated by Gympie’s population growth is
considered (1.7ha to 2.6ha per annum) the Gympie urban area would have over one
hundred years’ supply of vacant industrial land.
However, not all vacant land is unconstrained and suitable for development and the
realistic potential supply is likely to be considerably less.
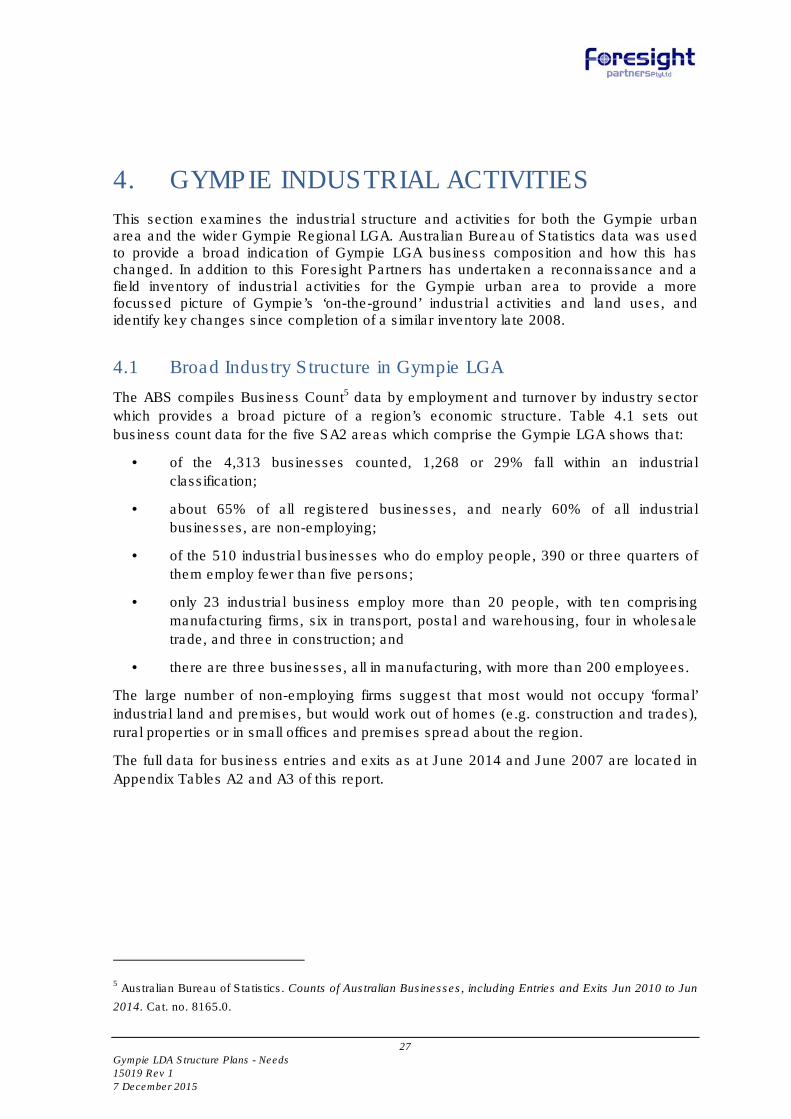
27
Gympie LDA Structure Plans - Needs
15019 Rev 1
7 December 2015
4. GYMPIE INDUSTRIAL ACTIVITIES
This section examines the industrial structure and activities for both the Gympie urban area and the wider Gympie Regional LGA. Australian Bureau of Statistics data was used to provide a broad indication of Gympie LGA business composition and how this has changed. In addition to this Foresight Partners has undertaken a reconnaissance and a field inventory of industrial activities for the Gympie urban area to provide a more focussed picture of Gympie’s ‘on-the-ground’ industrial activities and land uses, and identify key changes since completion of a similar inventory late 2008.
4.1 Broad Industry Structure in Gympie LGA
The ABS compiles Business Count5 data by employment and turnover by industry sector
which provides a broad picture of a region’s economic structure. Table 4.1 sets out
business count data for the five SA2 areas which comprise the Gympie LGA shows that:
• of the 4,313 businesses counted, 1,268 or 29% fall within an industrial
classification;
• about 65% of all registered businesses, and nearly 60% of all industrial
businesses, are non-employing;
• of the 510 industrial businesses who do employ people, 390 or three quarters of
them employ fewer than five persons;
• only 23 industrial business employ more than 20 people, with ten comprising
manufacturing firms, six in transport, postal and warehousing, four in wholesale
trade, and three in construction; and
• there are three businesses, all in manufacturing, with more than 200 employees.
The large number of non-employing firms suggest that most would not occupy ‘formal’
industrial land and premises, but would work out of homes (e.g. construction and trades),
rural properties or in small offices and premises spread about the region.
The full data for business entries and exits as at June 2014 and June 2007 are located in
Appendix Tables A2 and A3 of this report.
5 Australian Bureau of Statistics. Counts of Australian Businesses, including Entries and Exits Jun 2010 to Jun
2014. Cat. no. 8165.0.

28
Gympie LDA Structure Plans - Needs
15019 Rev 1
7 December 2015
Table 4.1: Businesses in the Gympie LGA by Number of Employees, June 2014
ANZSIC Industry
Non employing 1-4 5-19 20-199 200+ Total
B Mining 9 8 - - - 17
C Manufacturing 79 37 32 7 3 158
D Electricity, Gas, Water and Waste Services 7 3 - - - 10
E Construction 455 228 32 3 - 718
F Wholesale Trade 51 26 13 4 - 94
I Transport, Postal and Warehousing 157 88 20 6 - 271
Sub-total industrial activities 758 390 97 20 3 1,268
A Agriculture, Forestry and Fishing 949 154 48 5 - 1,156
G Retail Trade 113 110 73 12 - 308
H Accommodation and Food Services 41 45 61 11 - 158
J Information Media and Telecommunications 15 3 - - - 18
K Financial and Insurance Services 140 27 4 - - 171
L Rental, Hiring and Real Estate Services 362 41 22 - - 425
M Professional, Scientific and Technical Services 126 86 16 7 - 235
N Administrative and Support Services 51 38 18 - - 107
O Public Administration and Safety 9 - - - - 9
P Education and Training 25 9 6 - - 40
Q Health Care and Social Assistance 55 45 20 10 - 130
R Arts and Recreation Services 20 7 6 - - 33
S Other Services 92 85 24 - - 201
X Unknown 38 13 3 - - 54
Total 2,794 1,053 398 65 3 4,313
Source: ABS Counts of Australian Businesses including Entries and Exits by SA2 (Cooloola, Kilkivan, Gympie
North, Gympie South, and Gympie Region), Jun 2010 to Jun 2014.
4.1.1 Key Changes in Broad Industry Structure, Gympie LGA
There has been a net increase of 107 businesses operating in the Gympie LGA between
2007 and 2014, with 59 or 55% of these new businesses falling in industrial sectors.
Growth was strongest amongst Construction (115 new businesses) and Transport, Postal
and Warehousing (73 new businesses). Changes for industrial sectors are shown in
Figure 4.3.
Non-employing businesses were the largest source of growth increasing by 208
businesses, of which 161 were in industrial sectors (Appendix Table A4). The number of

29
Gympie LDA Structure Plans - Needs
15019 Rev 1
7 December 2015
small businesses with between one and four employees increased by 75 across the LGA;
however the industrial sector had a net decrease of 21 small businesses.
A loss of medium and larger industrial businesses were noted, with a net total of 56 fewer
businesses reporting between five and 19 employees in the Gympie LGA between 2007
and 2015, and a further 28 fewer industrial businesses reporting between 20 and 199
employees.
Figure 4.1: Number of Businesses in the Current Gympie Regional Council Area, 2007-2014
Source: Source: ABS Counts of Australian Businesses including Entries and Exits by SA2. Appendix Table
A4.
4.2 Gympie Urban Area Industrial Structure
In September 2015 Foresight Partners conducted a field inventory of all business located
on land which currently carries an industrial zoning designation (high, medium, and low
impact industry). The inventory also attempted to identify industrial businesses located
outside of industrial zoned land. The inventory covered the Gympie urban area and
includes the suburbs of Gympie, Two Mile, Victory Heights, Southside, Monkland,
Glanmire, and East Deep Creek. In addition, Curra and Kybong were also visited and
inventoried. This inventory replicated the inventory undertaken in late 2008 as part of the
2008 Industrial Land Demand Study.
-
100
200
300
400
500
600
700
800
Mining Manufacturing Electricity, Gas,
Water and Waste
Services
Construction Wholesale Trade Transport, Postal
and Warehousing
No
. o
f B
usin
esse
s
2007 2015

30
Gympie LDA Structure Plans - Needs
15019 Rev 1
7 December 2015
A total of 299 active industrial businesses were identified, as well as an additional stock of
20 establishments which were either for sale of lease. Whilst all industrial zoned land was
inventoried as part of this exercise and every attempt to capture out of zone industry was
made, it is important to note industrial businesses located outside of this zoned land may
have been missed. Although it is difficult to ascertain the extent to which out of zone
industry occurs, we estimate that around 20% of the region’s industrial businesses are
located outside of industrial zoned land. An example of this is the Robertson Brothers
Sawmill, a large industrial business operating on Residential Living zoned land at Old
Wolvi Rd in Gympie’s northeast. Field observation indicate that, on the whole, these
businesses generally tend to be smaller and less intensive industrial operations, primarily
associated with automotive repairs, parts and services.
Of the 299 businesses observed and classified (to a three digit ANZSIC category), three
industry sectors (Retail Trade, Manufacturing and Other Services) account for 59.5% of
total industrial activity in the area. A second tier of industries (Wholesale Trade,
Construction and Transport, Postal and Warehousing) form an important industrial
presence and account for 25.1% of businesses. A full breakdown of ANZSIC industry
presence is shown in Table 4.2, as well as in Appendix Tables A1 and A5 which also
shows data for 2008.
Table 4.2: ANZSIC Division of Businesses, Gympie Urban Area 2015
ANZSIC Division No. of
Businesses % of
Businesses
A Agriculture, Forestry and Fishing 3 1.0%
B Mining 5 1.7%
C Manufacturing 55 18.4%
D Electricity, Gas, Water and Waste Services 3 1.0%
E Construction 22 7.4%
F Wholesale Trade 29 9.7%
G Retail Trade 70 23.4%
H Accommodation and Food Services 5 1.7%
I Transport, Postal and Warehousing 25 8.4%
J Information Media and Telecommunications 2 0.7%
L Rental, Hiring and Real Estate Services 9 3.0%
M Professional, Scientific and Technical Services 5 1.7%
N Administrative and Support Services 3 1.0%
O Public Administration and Safety 2 0.7%
P Education and Training 3 1.0%
Q Health Care and Social Assistance 1 0.3%
R Arts and Recreation Services 5 1.7%
S Other Services 52 17.4%
Unclassified 0 0.0%
Total Businesses 299 100.0%
Vacant premises and/or for Lease 20 6.3%
All Property Types 319 100.0%
Source: Foresight Partners field Inventory 2015.
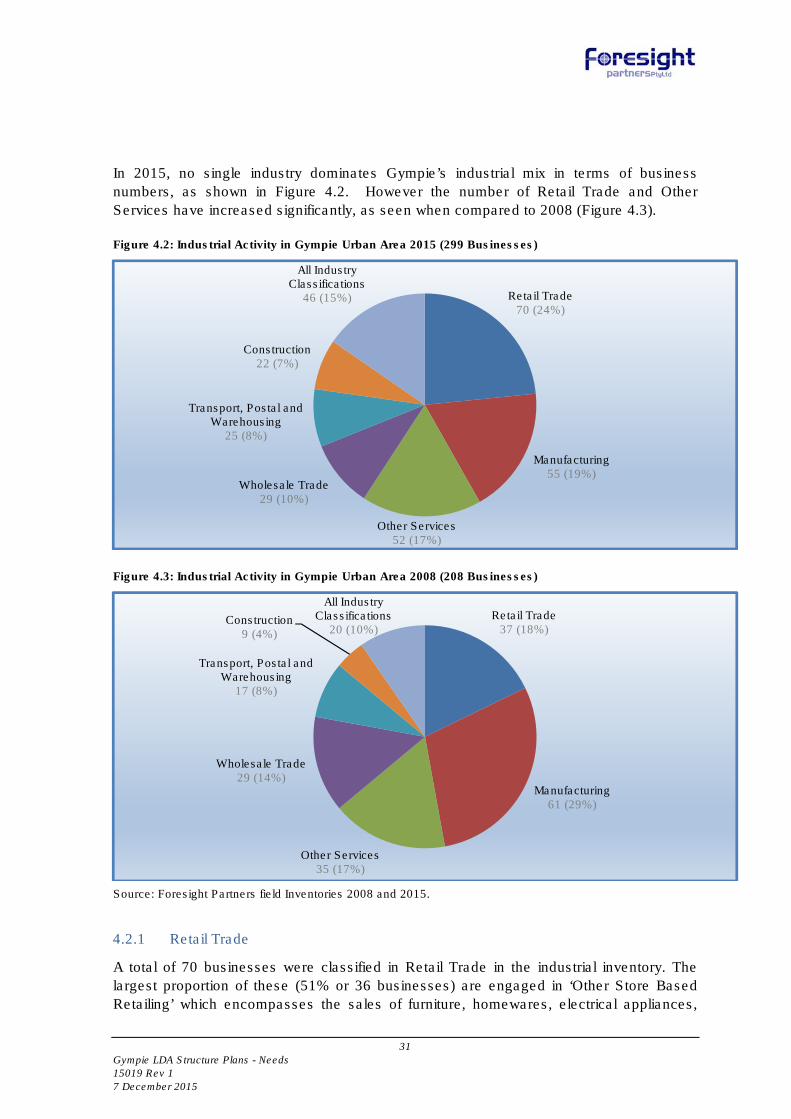
31
Gympie LDA Structure Plans - Needs
15019 Rev 1
7 December 2015
In 2015, no single industry dominates Gympie’s industrial mix in terms of business
numbers, as shown in Figure 4.2. However the number of Retail Trade and Other
Services have increased significantly, as seen when compared to 2008 (Figure 4.3).
Figure 4.2: Industrial Activity in Gympie Urban Area 2015 (299 Businesses)
Figure 4.3: Industrial Activity in Gympie Urban Area 2008 (208 Businesses)
Source: Foresight Partners field Inventories 2008 and 2015.
4.2.1 Retail Trade
A total of 70 businesses were classified in Retail Trade in the industrial inventory. The
largest proportion of these (51% or 36 businesses) are engaged in ‘Other Store Based
Retailing’ which encompasses the sales of furniture, homewares, electrical appliances,
Retail Trade70 (24%)
Manufacturing55 (19%)
Other Services52 (17%)
Wholesale Trade29 (10%)
Transport, Postal and Warehousing
25 (8%)
Construction22 (7%)
All Industry Classifications
46 (15%)
Retail Trade37 (18%)
Manufacturing61 (29%)
Other Services35 (17%)
Wholesale Trade29 (14%)
Transport, Postal and Warehousing
17 (8%)
Construction9 (4%)
All Industry Classifications
20 (10%)

32
Gympie LDA Structure Plans - Needs
15019 Rev 1
7 December 2015
hardware, building and garden supplies, clothing and pharmaceuticals. ‘Motor Vehicle and
Motor Vehicle Parts Retailing’ which includes the sale of tires, was the second most
common form of retail accounting for a further 22 (31%) businesses. ‘Fuel Retailing’
accounted for a total of eight (11%) businesses, however a number of these outlets were
unmanned and other than card-operated fuel bowsers, have no retail products, services,
toilets or other amenities.
4.2.2 Manufacturing
A total of 56 businesses were engaged in manufacturing activities. The most common of
these activities was ‘Fabricated Metal Product Manufacturing’ with 18 (32%) businesses.
Other than this the manufacturing sector was relatively diverse with food, wood, cement,
and furniture manufacturing, with more than half of Gympie manufacturing occurring in:
• food products are each manufactured by eight businesses (14% of manufacturing
firms);
• wood products are manufactured by eight businesses (14% of manufacturing
firms);
• non-metallic mineral products (cement and bricks) are manufactured by seven
businesses (13% of manufacturing firms);
• furniture and other manufacturing account for six businesses (11% of
manufacturing firms);
4.2.3 Other Services
Automotive Repair and Maintenance dominates the Other Services sector, with 45 or 87%
of the businesses. In addition to general repairs and maintenance this sub-division also
contains a wide range of auto services such as transmissions, filters, customisations and
conversions. A further three businesses are present in the similar category of ‘Machinery
and Equipment Repair and Maintenance’, which focus on heavy machinery.
4.2.4 Other Prominent Industry Sectors
Wholesale Trade
The industrial areas of the region have 29 businesses engaged in wholesaling activities.
Eight of these businesses (28%) operate in ‘Timber and Hardware Goods Wholesaling’,
and a further seven (24%) in ‘Other Machinery and Equipment Wholesaling’.
Transport, Postal and Warehousing
The sector of Transport, Postal and Warehousing is significant for the region with 24
businesses engaged in these activities. A total of 11 (46%) ‘Road Freight Transport’
businesses were recorded. In addition to this seven (29%) ‘Warehousing and Storage
Services’ were identified; this is a disproportionally high figure for a town of Gympie’s size.

33
Gympie LDA Structure Plans - Needs
15019 Rev 1
7 December 2015
Construction
22 businesses engaged in Construction were recorded in the inventory area. Ten of these
businesses (42%) were engaged in ‘Building Installation Services’. A further six (25%)
were classified as ‘Heavy and Civil Engineering Construction’ businesses.
4.3 Changes in Urban Area Industrial Structure
In comparing the 2008 and 2015 inventories for the Gympie Urban Area and the industrial
field inventory a total of 106 new businesses were identified. The largest increase of
industrial businesses was in Retail Trade which grew by 33 businesses. The Other
Services division, which mainly comprises automotive repairs and maintenance, increased
by 17 businesses. The number of observed Construction businesses also increased
significantly from nine to 22 over this period.
Figure 4.4: Change Industrial Businesses in Gympie Urban Area, 2008 - 2015
Source: Foresight Partners field Inventories 2008 and 2015.
Only in the Agriculture, Forestry and Fishing and Manufacturing sectors were net losses
observed, decreasing by four and six businesses respectively. These losses were offset
by growth in all other sectors, particularly in Retail Trade which increased from 37
businesses in 2008 to 70 business in 2015.
The presence of retail uses in industrial areas can deter industrial uses from establishing
or even contribute to their displacement. Although it is common for some industrial firms,
such as furniture manufacturers, automotive parts or trades suppliers to also sell direct to
the public, these uses do not generate significant customer traffic. However, with more
mainstream retailers which function as destination shops generating significant customer
0
10
20
30
40
50
60
70
80
Retail Trade Manufacturing Other Services Wholesale
Trade
Transport,
Postal and
Warehousing
Construction All Other
Industry
Classifications
No
. o
f B
usin
esse
s
2008 2015

34
Gympie LDA Structure Plans - Needs
15019 Rev 1
7 December 2015
traffic, this can cause conflicts with truck and other industrial movements, as well as
parking. As retailers can almost always pay higher rents than industrial uses, they can
ultimately displace value-adding industrial activities, especially in the Gympie Urban Area
where flood-free land for both industrial and retail/commercial uses is constrained.
For example, the establishment of destination retailers such as Lincraft, Harvey Norman,
BCF and Chemist Warehouse on land previously zoned for industrial uses on Edwin
Campion Drive effectively constrains the range of industrial activities that would have also
found the area attractive, such as larger warehousing, transport and manufacturing
businesses. As noted earlier this former industrial area is now designated as Specialised
Centre, and has been expanded to Hall Road, where a Bunnings has recently established.
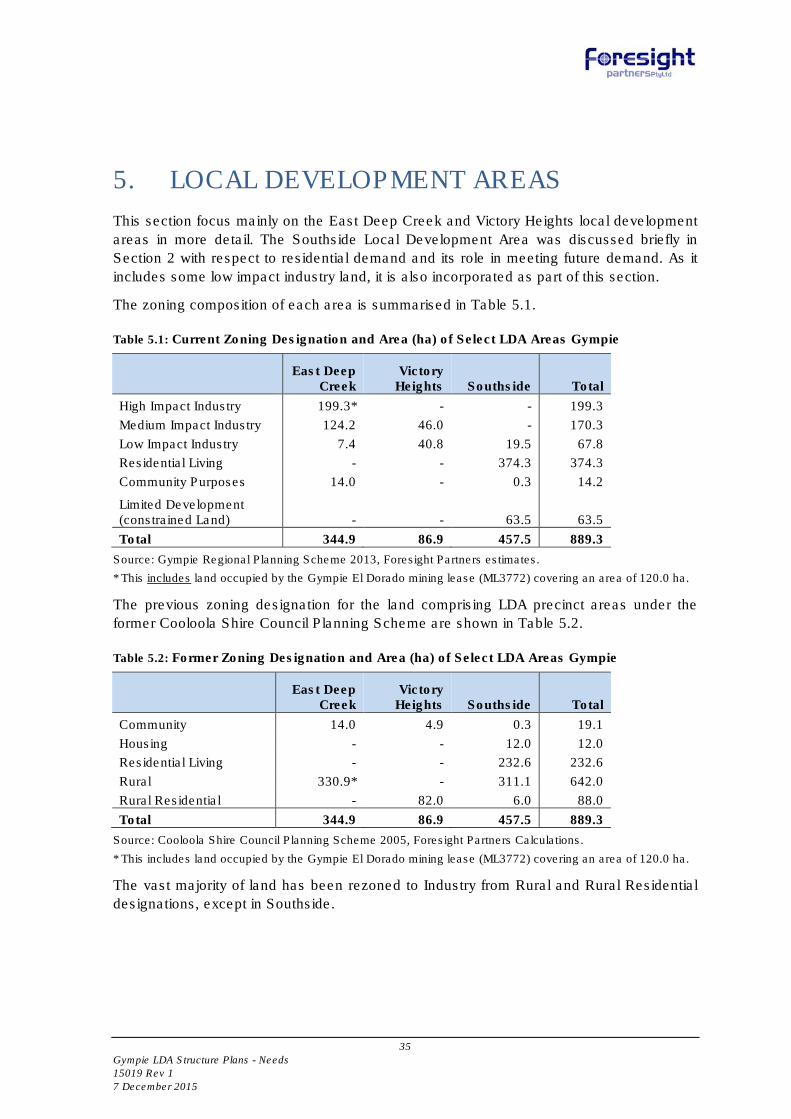
35
Gympie LDA Structure Plans - Needs
15019 Rev 1
7 December 2015
5. LOCAL DEVELOPMENT AREAS
This section focus mainly on the East Deep Creek and Victory Heights local development
areas in more detail. The Southside Local Development Area was discussed briefly in
Section 2 with respect to residential demand and its role in meeting future demand. As it
includes some low impact industry land, it is also incorporated as part of this section.
The zoning composition of each area is summarised in Table 5.1.
Table 5.1: Current Zoning Designation and Area (ha) of Select LDA Areas Gympie
East Deep
Creek Victory
Heights Southside Total
High Impact Industry 199.3* - - 199.3
Medium Impact Industry 124.2 46.0 - 170.3
Low Impact Industry 7.4 40.8 19.5 67.8
Residential Living - - 374.3 374.3
Community Purposes 14.0 - 0.3 14.2
Limited Development (constrained Land) - - 63.5 63.5
Total 344.9 86.9 457.5 889.3
Source: Gympie Regional Planning Scheme 2013, Foresight Partners estimates.
* This includes land occupied by the Gympie El Dorado mining lease (ML3772) covering an area of 120.0 ha.
The previous zoning designation for the land comprising LDA precinct areas under the
former Cooloola Shire Council Planning Scheme are shown in Table 5.2.
Table 5.2: Former Zoning Designation and Area (ha) of Select LDA Areas Gympie
East Deep
Creek Victory
Heights Southside Total
Community 14.0 4.9 0.3 19.1
Housing - - 12.0 12.0
Residential Living - - 232.6 232.6
Rural 330.9* - 311.1 642.0
Rural Residential - 82.0 6.0 88.0
Total 344.9 86.9 457.5 889.3
Source: Cooloola Shire Council Planning Scheme 2005, Foresight Partners Calculations.
* This includes land occupied by the Gympie El Dorado mining lease (ML3772) covering an area of 120.0 ha.
The vast majority of land has been rezoned to Industry from Rural and Rural Residential
designations, except in Southside.

36
Gympie LDA Structure Plans - Needs
15019 Rev 1
7 December 2015
5.1 East Deep Creek
Seven businesses were observed as operating within the East Deep Creek precinct.
Although small in number they represent a diverse mix of industries across six ANZSIC
divisions, and seven unique sub-divisions.
Table 5.3: Observed East Deep Creek Precinct Businesses September 2015
Name Division Sub-Division Group
Gympie El Dorado Mine Mining Metal Ore Mining Metal Ore Mining
Nolan Meats Manufacturing Food Product
Manufacturing
Meat and Meat Product
Manufacturing
Corbets Manufacturing Non-Metallic Mineral
Product Manufacturing
Cement, Lime, Plaster
and Concrete Product
Manufacturing
Cooloola Scrap Metal &
Heavy Haulage
Wholesale Trade Basic Material
Wholesaling
Mineral, Metal and
Chemical Wholesaling
Golden City Brick and
Landscape Nursery
Retail Trade Other Store-Based
Retailing
Hardware, Building and
Garden Supplies
Retailing
McLintocks Transport Transport, Postal and
Warehousing
Road Transport Road Freight Transport
Tony's Truck Repairs
and Spares
Other Services Repair and Maintenance Automotive Repair and
Maintenance
Source: Foresight Partners field Inventory, September 2015.
East Deep Creek has total area of 344.8ha of which 91.1ha or 26.4% is occupied.
Occupied lots are large with sizes between one and five hectares being the most
commonly held. There are 21 vacant lots which accounted for 95.0ha or 27.5% of the
precincts land (Figure 5.1).
Table 5.4: East Deep Creek Precinct Lot Size and Status, 2015
Lot Size (ha) Occupied Vacant Under-
developed Mine
Affected* Total
No. Area No. Area No. Area No. Area No. Area
Under 0.2 - - 1 0.1 1 0.1 1 0.1 3 0.2
Between 0.2 and 0.4 - - - - - - - - - -
Between 0.4 and 1 1 0.9 3 1.7 11 7.3 1 1.0 16 10.9
Between 1.01 and 4.99 7 21.9 10 26.3 11 23.1 9 21.7 37 93.1
Between 5 and 9.99 5 36.1 5 40.8 1 8.1 10 80.7 21 165.6
Between 10 and 19.99 2 32.2 2 26.1 - - 1 16.6 5 74.9
Over 20 - - - - - - - - - -
Total 15 91.1 21 95.0 24 38.7 22 120.0 82 344.8
Source: Foresight Partners field Inventory.
*Mine Affected represents the Gympie El Dorado mining lease area (ML3772).

37
Gympie LDA Structure Plans - Needs
15019 Rev 1
7 December 2015
Mine affected land was added as a fourth category to differentiate this land. A total of 22
lots covering 120.0ha (34.8% of the precinct) is mine affected and falls under the Gympie
El Dorado Gold Mine lease (ML37772) to the northeast of Flood Road.
The East Deep Creek Precinct encompasses a number of constraints likely to affect future
development. The most prominent constraint is the dam and large pond associated with
the Gympie El Dorado Gold Mine. Mining related tailings dams can pose significant
environmental hazards and their remediation are often costly. More detailed discussions
of potential physical constraints of the LDA can be found in PSA’s Background
Investigation Report.
The future Bruce Highway realignment will run through the East Deep Creek precinct and
the corridor will occupy some of the better quality land available for future development. A
northbound highway entrance interchange will be located at the intersection of Noosa and
Penny Road, and southbound highway traffic will be able to depart near the intersection of
Flood and Penny Road.
The precinct’s future connectivity to the Bruce Highway will enhance its attraction for
industrial uses, especially for Transport, Postal and Warehousing activities. However,
these uses are only likely to locate on the relatively unconstrained areas within the
precinct.
The East Deep Creek Precinct is in close proximity to a number of large high impact
industries to its immediate south such as Carter Holt Harvey particle board factory and a
southern operation of the Gympie El Dorado mine, which operates outside of the LDA.
Although these businesses are not located within the precinct they are also located on
adjacent high impact industrial land and, in effect, form part of the East Deep Creek
industrial area.

NOOSA RDNOOSA RDNOOSA RDNOOSA RDNOOSA RDNOOSA RDNOOSA RDNOOSA RDNOOSA RD
Six
Mile
Cre
ek
Six
Mile
Cre
ek
Six
Mile
Cre
ek
Six
Mile
Cre
ek
Six
Mile
Cre
ek
Six
Mile
Cre
ek
Six
Mile
Cre
ek
Six
Mile
Cre
ek
Six
Mile
Cre
ek
PENNY RDPENNY RDPENNY RDPENNY RDPENNY RDPENNY RDPENNY RDPENNY RDPENNY RD
FLOOD RD
FLOOD RD
FLOOD RD
FLOOD RD
FLOOD RD
FLOOD RD
FLOOD RD
FLOOD RD
FLOOD RD
BR
UC
E H
WY
(A1)
BR
UC
E H
WY
(A1)
BR
UC
E H
WY
(A1)
BR
UC
E H
WY
(A1)
BR
UC
E H
WY
(A1)
BR
UC
E H
WY
(A1)
BR
UC
E H
WY
(A1)
BR
UC
E H
WY
(A1)
BR
UC
E H
WY
(A1)
Deep C
reek
Deep C
reek
Deep C
reek
Deep C
reek
Deep C
reek
Deep C
reek
Deep C
reek
Deep C
reek
Deep C
reek
RAN
DW
ICK R
D
RAN
DW
ICK R
D
RAN
DW
ICK R
D
RAN
DW
ICK R
D
RAN
DW
ICK R
D
RAN
DW
ICK R
D
RAN
DW
ICK R
D
RAN
DW
ICK R
D
RAN
DW
ICK R
D
NOOSA RD
NOOSA RD
NOOSA RD
NOOSA RD
NOOSA RD
NOOSA RD
NOOSA RD
NOOSA RD
NOOSA RD
Nort
h C
oast R
ail
Lin
e
Nort
h C
oast R
ail
Lin
e
Nort
h C
oast R
ail
Lin
e
Nort
h C
oast R
ail
Lin
e
Nort
h C
oast R
ail
Lin
e
Nort
h C
oast R
ail
Lin
e
Nort
h C
oast R
ail
Lin
e
Nort
h C
oast R
ail
Lin
e
Nort
h C
oast R
ail
Lin
e
E DEEP CREEK RD
E DEEP CREEK RD
E DEEP CREEK RD
E DEEP CREEK RD
E DEEP CREEK RD
E DEEP CREEK RD
E DEEP CREEK RD
E DEEP CREEK RD
E DEEP CREEK RD
1
Mary R
iver
Mary R
iver
Mary R
iver
Mary R
iver
Mary R
iver
Mary R
iver
Mary R
iver
Mary R
iver
Mary R
iver
HALL
RD
HALL
RD
HALL
RD
HALL
RD
HALL
RD
HALL
RD
HALL
RD
HALL
RD
HALL
RD
TIN
CAN
BAY R
D
TIN
CAN
BAY R
D
TIN
CAN
BAY R
D
TIN
CAN
BAY R
D
TIN
CAN
BAY R
D
TIN
CAN
BAY R
D
TIN
CAN
BAY R
D
TIN
CAN
BAY R
D
TIN
CAN
BAY R
D
Lake AlfordLake AlfordLake AlfordLake AlfordLake AlfordLake AlfordLake AlfordLake AlfordLake Alford
ParkParkParkParkParkParkParkParkPark
Mary Valley Heritage Rail LineMary Valley Heritage Rail LineMary Valley Heritage Rail LineMary Valley Heritage Rail LineMary Valley Heritage Rail LineMary Valley Heritage Rail LineMary Valley Heritage Rail LineMary Valley Heritage Rail LineMary Valley Heritage Rail Line
0.5
kilometres
0
BRUCE HWY (A1)
BRUCE HWY (A1)
BRUCE HWY (A1)
BRUCE HWY (A1)
BRUCE HWY (A1)
BRUCE HWY (A1)
BRUCE HWY (A1)
BRUCE HWY (A1)
BRUCE HWY (A1)
Occupied Land
High Imp.Industry
Med Imp.Industry
Low Imp.Industry
SpecialisedCentre
DistrictCentre
CommunityFacilites Underdeveloped Vacant Land
Underutilised Land
East DeepEast DeepEast DeepEast DeepEast DeepEast DeepEast DeepEast DeepEast Deep
Creek PrecinctCreek PrecinctCreek PrecinctCreek PrecinctCreek PrecinctCreek PrecinctCreek PrecinctCreek PrecinctCreek Precinct
MiningMiningMiningMiningMiningMiningMiningMiningMining
LeaseLeaseLeaseLeaseLeaseLeaseLeaseLeaseLease
Figure 5.1: Occupied, Underdeveloped, and Vacant Land, East Deep Creek Precint, September 2015
Gym
pie
Byp
ass (P
rop
ose
d)
Gym
pie
Byp
ass (P
rop
ose
d)
Gym
pie
Byp
ass (P
rop
ose
d)
Gym
pie
Byp
ass (P
rop
ose
d)
Gym
pie
Byp
ass (P
rop
ose
d)
Gym
pie
Byp
ass (P
rop
ose
d)
Gym
pie
Byp
ass (P
rop
ose
d)
Gym
pie
Byp
ass (P
rop
ose
d)
Gym
pie
Byp
ass (P
rop
ose
d)
GympieEl Dorado
Mine
CarterHolt
Harvey
NolanMeats
GympieEl Dorado
Mine

39
Gympie LDA Structure Plans - Needs
15019 Rev 1
7 December 2015
5.2 Victory Heights
Victory Heights is located to the east of the North Coast Rail Line, and lies between
Gympie Connection Road and Tin Can Bay Road. The proposed Bruce Highway
realignment will extend through the precinct running parallel to the existing rail line.
At present there is minimal development in the area, and there are no structures in the
area west of Ascot Road. As shown in Table 5.5 and Figure 5.2 the precinct is
predominantly vacant, and contains a number of residential dwellings (classified as
underdeveloped).
Figure 5.2: Occupied, Underdeveloped, and Vacant Land, Victory Heights LDA Precinct, September 2015
The proposed Bruce Highway will be a major factor in the future development of the
Victory Heights Precinct. An interchange is planned for the Gympie Connection Road
intersection which would allow for both northbound and southbound access.

40
Gympie LDA Structure Plans - Needs
15019 Rev 1
7 December 2015
Table 5.5: Victory Heights Precinct Lot Size and Status, 2015
Lot Size Occupied Vacant Underdeveloped Total
No. Area No. Area No. Area No. Area
0 - 2,000m2 - - - - - - - -
2,000m2 - 4,000m
2 - - - - 1 0.4 1 0.4
4,000m2 - 1ha - - - - 2 1.2 2 1.2
Between 5 and 9.99ha 2 4.0 8 14.5 6 12.5 16 31.0
Between 10 and 19.99ha - - 5 35.8 - - 5 35.8
Over 20ha - - 1 18.6 - - 1 18.6
0 - 2,000m2 - - - - - - - -
Total 2 4.0 14 68.8 9 14.1 25 86.9
Source: Foresight Partners September 2015 field inventory.
At present only two lots appear occupied by active businesses with occupied land
representing only 4.0ha or 4.6% of the precinct area. This area was not included as part of
Foresight Partners 2008 inventory however all three of the businesses present appear to
be well established. Vacant land accounts for 68.8ha or 79.2% of the precinct area. This
vacant land appears subject to some constraints and the amount of developable land is
likely to be less (refer to PSA’s Background Investigation Report for a more detailed
constraints assessment).
Table 5.6: Observed Victory Height Business Inventory
Name Division Sub-Division Group
Cooloola Tractors and
Machinery
Wholesale Trade Machinery and
Equipment Wholesaling
Specialised Industrial
Machinery and
Equipment Wholesaling
Eddy Smith Engineering Other Services Repair and Maintenance Machinery and
Equipment Repair and
Maintenance
Lang’s Panel Beaters Other Services Repair and Maintenance Automotive Repair and
Maintenance
Source: Foresight Partners field inventory, September 2015.
5.3 Southside
The Southside area is predominantly residential with over three quarters of the area
zoned Residential Living. As a result of the significant flood risk in the area 57.5 (17%) of
the precinct is zoned Limited Development (Constrained Land). Due to the lack of
industrial businesses Southside has been classified using lot size and zoning, shown in
Table 5.7.

41
Gympie LDA Structure Plans - Needs
15019 Rev 1
7 December 2015
Table 5.7: Southside Precinct Lot Size and Status, 2015
Lot Size Low Impact
Industry Residential
Living Community Purposes
Limited Development (constrained
Land) Total No. Area No. Area No. Area No. Area No. Area
0 - 2,000m2 - - 36 3.2 - - 19 1.7 55 4.9
2,000m2 - 4,000m
2 3 0.8 16 3.5 1 0.3 3 0.8 23 5.4
4,000m2 - 1ha 5 2.4 4 3.0 - - 4 2.2 13 7.6
Between 1.01 and 4.99ha 5 10.6 41 110.8 - - 6 12.0 52 133.3
Between 5 and 9.99ha 1 5.7 2 11.0 - - 2 15.2 5 32.0
Between 10 and 19.99ha - - 8 120.6 - - 2 31.5 10 152.2
Over 20ha - - 4 122.2 - - - - 4 122.2
Total 14 19.5 93 374.3 1 0.3 36 63.5 162 457.5
Source: Gympie Regional Council Planning Scheme 2013, Foresight Partners field Inventory.
The sole business operating in the Southside LDA Precinct area was the Paw Play Pet
Motel, located at 124 Eel Creek Road. This business is located immediately south of the
LDA’s industrial zoned land, on a Low Density Residential zoned lot. A small industrial
park is present nearby in Du Reitz Court, which is adjacent to the precinct’s northern
border along Eucalyptus Avenue. Fourteen Low Impact Industry designated lots are
present within the Southside Precinct; however the land is heavily vegetated and contains
a number of residential dwellings. Of the 19.5ha of Low Impact Industry land within the
LDA 16.3ha is vacant, and the remaining 3.2ha of this Low Impact Industry zoned land is
occupied by residential dwellings, which have been classified as underdeveloped
according to the rules set out in Section 3.3.

POW
ER R
D
POW
ER R
D
POW
ER R
D
POW
ER R
D
POW
ER R
D
POW
ER R
D
POW
ER R
D
POW
ER R
D
POW
ER R
DS
OR
EN
SE
N R
D
SO
RE
NS
EN
RD
SO
RE
NS
EN
RD
SO
RE
NS
EN
RD
SO
RE
NS
EN
RD
SO
RE
NS
EN
RD
SO
RE
NS
EN
RD
SO
RE
NS
EN
RD
SO
RE
NS
EN
RD
KO
UM
AL
A R
DK
OU
MA
LA
RD
KO
UM
AL
A R
DK
OU
MA
LA
RD
KO
UM
AL
A R
DK
OU
MA
LA
RD
KO
UM
AL
A R
DK
OU
MA
LA
RD
KO
UM
AL
A R
D
WA
TS
ON
RD
WA
TS
ON
RD
WA
TS
ON
RD
WA
TS
ON
RD
WA
TS
ON
RD
WA
TS
ON
RD
WA
TS
ON
RD
WA
TS
ON
RD
WA
TS
ON
RD
EXHIBITION RD
EXHIBITION RD
EXHIBITION RD
EXHIBITION RD
EXHIBITION RD
EXHIBITION RD
EXHIBITION RD
EXHIBITION RD
EXHIBITION RD
GympieGympieGympieGympieGympieGympieGympieGympieGympie
RacecourseRacecourseRacecourseRacecourseRacecourseRacecourseRacecourseRacecourseRacecourse
& Showgrounds& Showgrounds& Showgrounds& Showgrounds& Showgrounds& Showgrounds& Showgrounds& Showgrounds& Showgrounds
GROUNDWATER RD
GROUNDWATER RD
GROUNDWATER RD
GROUNDWATER RD
GROUNDWATER RD
GROUNDWATER RD
GROUNDWATER RD
GROUNDWATER RD
GROUNDWATER RD
Pie Creek
Pie Creek
Pie Creek
Pie Creek
Pie Creek
Pie Creek
Pie Creek
Pie Creek
Pie Creek
DU REITZ CTDU REITZ CTDU REITZ CTDU REITZ CTDU REITZ CTDU REITZ CTDU REITZ CTDU REITZ CTDU REITZ CT
EE
L C
RE
EK
RD
EE
L C
RE
EK
RD
EE
L C
RE
EK
RD
EE
L C
RE
EK
RD
EE
L C
RE
EK
RD
EE
L C
RE
EK
RD
EE
L C
RE
EK
RD
EE
L C
RE
EK
RD
EE
L C
RE
EK
RD
REGEN RDREGEN RDREGEN RDREGEN RDREGEN RDREGEN RDREGEN RDREGEN RDREGEN RD
LA
WS
ON
RD
LA
WS
ON
RD
LA
WS
ON
RD
LA
WS
ON
RD
LA
WS
ON
RD
LA
WS
ON
RD
LA
WS
ON
RD
LA
WS
ON
RD
LA
WS
ON
RD
DAPHNE STDAPHNE STDAPHNE ST
DAPHNE STDAPHNE ST
DAPHNE STDAPHNE STDAPHNE ST
DAPHNE ST
ROCKS RDROCKS RDROCKS RDROCKS RDROCKS RDROCKS RDROCKS RDROCKS RDROCKS RD
GLASTONBURY RD
GLASTONBURY RD
GLASTONBURY RD
GLASTONBURY RD
GLASTONBURY RD
GLASTONBURY RD
GLASTONBURY RD
GLASTONBURY RD
GLASTONBURY RD
0 0.5
kilometres
1
Residential ChoiceResidential Living Rural Residential District Centre Low Impact Industry
Limited Development (Contrained Land)
CommunityPurposes
Sport andRecreation
OpenSpace
PrecinctBoundary
Rural
Figure 5.3: Zoning Designation Southside Precinct, Gympie Regional Planning Scheme 2013

43
Gympie LDA Structure Plans - Needs
15019 Rev 1
7 December 2015
5.4 Need and Demand for Precinct Areas
The following summarises the key findings of our investigations and their implications for
planning for the future development of the three Local Development Areas.
5.4.1 Southside Precinct
The Southside Precinct represents the Gympie Urban Area’s largest area available for
residential development. With some 374ha of land zoned for Residential Living, it has the
capacity to accommodate significant additional population growth in a mix of lot sizes and
housing types. The precinct should have the capacity to accommodate the forecast
demand for an additional 1,200 dwellings to house the 2,950 increase in population
projected for the whole of the Gympie-South SA2 by 2036.
Between 2016 and 2036, the equivalent demand for additional dwellings averages about
55 per annum. Potential staging to meet forecast demand is:
• between 2016 and 2021 around 300 new dwellings would be needed, which would
require 30-40ha of land based on eight to ten dwellings per hectare (or about 20ha
assuming an average yield of 14 dwellings per hectare);
• a further 250 dwellings would be needed by 2026 requiring 25-30ha (18ha at the
higher yield); and
• another 550 dwellings by 2036, requiring 55-70ha (40ha at the higher yield).
The area is likely to continue to attract family households, indicating a need for detached
dwellings on a variety of lot sizes. However, Gympie’s older age profile as at the 2011
Census and as projected at 2036, also indicates retirement facilities will be required as
part of the Southside Precinct’s housing mix.
The area is also likely to require additional retail, community and recreational facilities to
service future populations within and near the defined precinct.
The projected population increase for Gympie-South of 2,950 people between 2014 and
2036 is not sufficient to support another district centre offering a full-line supermarket,
such as the Woolworths anchored Southside Town Centre (approximately 6,600m²).
Such supermarkets (and centres) typically require 8,000-10,000 people within their main
catchment. Gympie-South’s projected population at 2036 is 9,200 people.
However, the existing population, and population growth within and near the area is likely
to support at least one (and possibly two) local centres anchored by a small independent
supermarket or convenience store and a small number of convenience specialty shops.
The elongated shape of the Southside LDA means that it cannot be treated as a single
retail catchment. Adjoining existing residential areas, particularly along the LDA’s south-
eastern boundaries, will also contribute to the support of future retail opportunities in the
area.

44
Gympie LDA Structure Plans - Needs
15019 Rev 1
7 December 2015
These smaller centres typically range in size from 600–1,000m² up to 2,500m² of lettable
area. Although small, they generally require main road exposure and access to trade
successfully, and locational choices will be determined by the future road network
servicing the Southside Precinct’s residential development. Thus
As a guide, Foresight Partners’ previous work has found that a local retail centre of
1,000m² requires a population of about 3,000 (about 1,200 households) within its main
catchment although this is strongly influenced by access to passing trade (main road
access/visibility). Such a centre would typically be anchored by an independent
supermarket of about 600-800m². A smaller centre of 500m² (the maximum size
nominated for Local Centres under the 2013 Planning Scheme) generally needs about
half the number of households (500-600) and is usually anchored by an independent
supermarket of about 300m².
It is not possible to nominate a specific site or size for a future local centre (or centres) as
the future road network will be a major determinant of future centre options and
opportunities. However, they can be expected to seek intersection locations along the
main roads serving the precinct area and locations next or near to schools or other trip
generators.
Southside Precinct’s small amount of vacant Low Impact industrial land (16.3ha) is the
equivalent of about five years’ land supply at a five hectare per annum take up rate.
5.4.2 East Deep Creek Precinct
The East Deep Creek Precinct currently supports a small number of high impact industries
as well as medium and lower impact businesses. Most businesses requiring High Impact
zoned land generally serve regional, national or international markets (e.g. Carter Holt
Harvey, Gympie El Dorado Mine) rather than local populations and require larger lots.
High Impact zoned land in or close to most urban areas is comparatively scarce, although
such scarcity is not generally reflected in higher land prices.
Future demand for High and Medium Impact zoned land in the precinct is likely to come
from expansion of existing High and Medium Impact businesses in (or adjacent to) the
East Deep Precinct, and from new firms attracted to the area, especially once the Gympie
Bypass is in place. Although large (344.9ha including 120ha of mine lease area), the
whole of the precinct may not be fully usable due to potential constraints.
The East Deep Creek Precinct will continue to fulfil its role in accommodating firms
requiring (relatively scarce) High and Medium Impact industry land for their operations, but
the quantity of useable land may be less than suggested by its overall size. High and
Medium Impact industries are likely to require larger lot sizes (one to five hectares or
more) which is also likely to affect the number of firms that can be accommodated.
Although it might be possible to reclaim and rehabilitate the large area occupied by the
Gympie Eldorado Gold Mine dam area to create to useable industrial land, the costs to do
so would have to be weighed by potential users. Coupled with steep slope, flood risk and
areas of regulated vegetation, the amount of useable land would also need to be weighed
45
Gympie LDA Structure Plans - Needs
15019 Rev 1
7 December 2015
against the potential infrastructure investment necessary to improve road accessibility and
flood immunity. Consequently, the East Deep Creek Precinct may prove insufficient to
cater to longer term demand for Medium and High Impact industrial land.
If all 95ha of vacant land in the East Deep Creek LDA were capable of development, this
would represent the equivalent of 19 years land supply at a 5ha per annum take-up rate.
However, given the apparent nature and extent of constraints affecting this area, it is likely
to represent a considerably lower potential future supply. In practice, the take-up rate for
High Impact land is likely to be quite different to that of Low and Medium Impact land, with
a relatively small number of future businesses (or business expansions) taking up larger
areas.
5.4.3 Victory Heights
Lots comprising the Victory Heights Precinct is considerably smaller (86.9ha) and consists
of Medium and Low Impact industry zones. It is also subject to constraints (flood risk,
steep topography, regulated vegetation). The Department of Main Roads and Transport
owns the 40.8ha west of Ascot Road through which the Gympie Bypass will be routed,
and it is uncertain whether residual lands would be available for industrial development.
For example, assuming an 80 metre road corridor along the length of the future Bypass,
this would take up roughly 10ha, leaving 30ha potentially available for Low Impact
industrial uses. Even so, the western portion of the remaining site area between the
Bypass and the railway could be too narrow and difficult to access for practical use.
The Bypass will have an interchange at the precinct’s northern border, which is also the
main route (Tin Can Bay Road) to the region’s popular coastal holiday and residential
areas which would enhance the precinct’s attraction for smaller, population-serving
industry activities. The Victory Heights Precinct is close to the urban centre and is well-
positioned to accommodate smaller industrial uses serving the Gympie region, and a
number of such businesses are currently operating in this area.
Despite the positive locational attributes of the Victory Heights Precinct the combination of
constraints, small size and relative isolation from services may compromise its ability to
accommodate a viable industrial precinct. It may attract additional individual businesses
on existing lots, such as the transport depot and workshops currently operating,
particularly as home-based businesses, but its ultimate usable area may not meet
Gympie’s future need for Light and Medium Industry land.
This precinct’s 28ha of vacant Medium Impact and 30ha of Low Impact (excluding a
nominal ten hectares for the Bypass corridor) collectively represent the equivalent of
about 12 years’ land supply.
5.4.4 Comments
In 2009, the Gympie Urban area was facing an immediate and pressing need for
additional zoned and useable industrial land, with only 47ha of vacant land available.
Council, in preparing its new planning scheme, subsequently designated significant

46
Gympie LDA Structure Plans - Needs
15019 Rev 1
7 December 2015
additional lands for industrial purposes. The amount of zoned industrial land in the
Gympie Urban area more than tripled from less than 200ha in 2009 to 649ha in 2015 with
vacant zoned land increasing six-fold to 304.2ha. This was achieved mainly by the
rezoning of the East Deep Creek and Victory Heights precincts for industry use.
At face value, the current vacant land stock represents potentially a 60 year supply. The
180ha of vacant land within the LDAs represents a potential 36 year supply, with the
124ha of vacant industrial land elsewhere in the Gympie Urban area representing a
potential 25 year supply, if all land could be used.
Thus, if all vacant land were “good quality” industrial land and equally available for
development, the need to service and develop the vacant industrial land within the three
LDAs need not arise for at least ten years, allowing for the maintenance of a 15 year
supply buffer of zoned land6.
If it is assumed that only 50% the 304.2ha of “raw” vacant land can be developed as gross
supply, the potential supply in hand reduces to 30 years. Given the constraints facing
much of Gympie’s vacant industrial land and in the absence of detailed constraints
analysis of all vacant land, this is probably a reasonable assumption. Under this scenario,
the need to service and develop the East Deep Creek and Victory Heights precincts could
arise within the next five to ten years.
6 This is based on the Victorian Government’s benchmark of an identified 15 year supply of
industrial land across the major industrial nodes in Melbourne, of which at least ten years should be
zoned to permit development. (From 2009 Industrial Land Demand Study, page 7).

47
Gympie LDA Structure Plans - Needs
15019 Rev 1
7 December 2015
5.4.1
Appendix

48
Gympie LDA Structure Plans - Needs
15019 Rev 1
7 December 2015
Appendix A1 - ANZSIC Division, Subdivision and Group of Gympie Businesses, 2015
Appendix A2 - Businesses in the Gympie Regional Council LGA by Number of Employees and Industry Division, June 2014
Appendix A3 - Businesses in the Gympie Region by Number of Employees and Industry Division, June 2007
Appendix A4 - Change in Businesses in the Gympie Regional Council LGA by Number of Employees and Industry Division, June 2007 – June 2014
Appendix A5 - ANZSIC Division of Industrial Businesses, Gympie Urban Area 2008 - 2015

49
Gympie LDA Structure Plans - Needs
15019 Rev 1
7 December 2015
Table A1: ANZSIC Division, Subdivision and Group of Gympie Businesses, 2015
ANZSIC Division No. of
Businesses % of
Businesses
A Agriculture, Forestry and Fishing 3 1.0%
05 Agriculture, Forestry and Fishing Support Services 3 1.0%
052 Agriculture and Fishing Support Services 3 1.0%
B Mining 5 1.7%
08 Metal Ore Mining 2 0.7%
080 Metal Ore Mining 2 0.7%
91 Construction Material Mining 1 0.3%
091 Construction Material Mining 1 0.3%
10 Exploration and Other Mining Support Services 2 0.7%
101 Exploration 2 0.7%
C Manufacturing 56 18.7%
11 Food Product Manufacturing 8 2.7%
111 Meat and Meat Product Manufacturing 1 0.3%
114 Fruit and Vegetable Processing 3 1.0%
117 Bakery Product Manufacturing 2 0.7%
119 Other Food Product Manufacturing 2 0.7%
12
Beverage and Tobacco Product Manufacturing 1 0.3%
121 Beverage Manufacturing 1 0.3%
13
Textile, Leather, Clothing and Footwear Manufacturing 1 0.3%
133 Textile Product Manufacturing 1 0.3%
14
Wood Product Manufacturing 8 2.7%
141 Log Sawmilling and Timber Dressing 1 0.3%
149 Other Wood Product Manufacturing 7 2.3%
16
Printing (including the Reproduction of Recorded Media) 1 0.3%
161 Printing and Printing Support Services 1 0.3%
18
Basic Chemical and Chemical Product Manufacturing 3 1.0%

50
Gympie LDA Structure Plans - Needs
15019 Rev 1
7 December 2015
181 Basic Chemical Manufacturing 2 0.7%
183 Fertiliser and Pesticide Manufacturing 1 0.3%
20
Non-Metallic Mineral Product Manufacturing 7 2.3%
202 Ceramic Product Manufacturing 1 0.3%
203 Cement, Lime, Plaster and Concrete Product
Manufacturing 6 2.0%
22
Fabricated Metal Product Manufacturing 18 6.0%
221 Iron and Steel Forging 1 0.3%
222 Structural Metal Product Manufacturing 12 4.0%
223 Metal Container Manufacturing 1 0.3%
224 Sheet Metal Product Manufacturing (except Metal
Structural and Container Products) 2 0.7%
229 Other Fabricated Metal Product Manufacturing 2 0.7%
23
Transport Equipment Manufacturing 3 1.0%
231 Motor Vehicle and Motor Vehicle Part Manufacturing 3 1.0%
25
Furniture and Other Manufacturing 6 2.0%
251 Furniture Manufacturing 4 1.3%
259 Other Manufacturing 2 0.7%
D Electricity, Gas, Water and Waste Services 3 1.0%
29 Waste Collection, Treatment and Disposal Services 3 1.0%
292 Waste Treatment, Disposal and Remediation Services 3 1.0%
E Construction 22 7.4%
30 Building Construction 1 0.3%
301 Residential Building Construction 1 0.3%
31
Heavy and Civil Engineering Construction 6 2.0%
310 Heavy and Civil Engineering Construction 6 2.0%
32
Construction Services 15 5.0%
322 Building Structure Services 1 0.3%
323 Building Installation Services 10 3.3%
329 Other Construction Services 4 1.3%
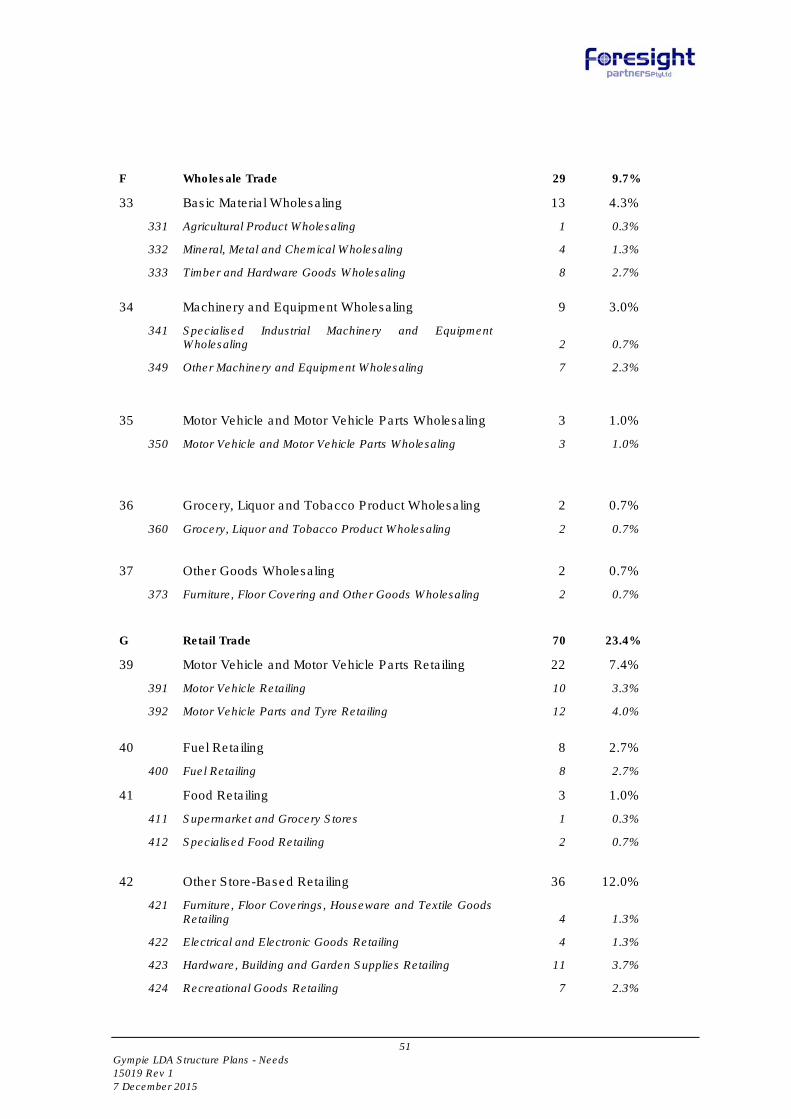
51
Gympie LDA Structure Plans - Needs
15019 Rev 1
7 December 2015
F Wholesale Trade 29 9.7%
33 Basic Material Wholesaling 13 4.3%
331 Agricultural Product Wholesaling 1 0.3%
332 Mineral, Metal and Chemical Wholesaling 4 1.3%
333 Timber and Hardware Goods Wholesaling 8 2.7%
34
Machinery and Equipment Wholesaling 9 3.0%
341 Specialised Industrial Machinery and Equipment
Wholesaling 2 0.7%
349 Other Machinery and Equipment Wholesaling 7 2.3%
35
Motor Vehicle and Motor Vehicle Parts Wholesaling 3 1.0%
350 Motor Vehicle and Motor Vehicle Parts Wholesaling 3 1.0%
36
Grocery, Liquor and Tobacco Product Wholesaling 2 0.7%
360 Grocery, Liquor and Tobacco Product Wholesaling 2 0.7%
37
Other Goods Wholesaling 2 0.7%
373 Furniture, Floor Covering and Other Goods Wholesaling 2 0.7%
G Retail Trade 70 23.4%
39 Motor Vehicle and Motor Vehicle Parts Retailing 22 7.4%
391 Motor Vehicle Retailing 10 3.3%
392 Motor Vehicle Parts and Tyre Retailing 12 4.0%
40
Fuel Retailing 8 2.7%
400 Fuel Retailing 8 2.7%
41 Food Retailing 3 1.0%
411 Supermarket and Grocery Stores 1 0.3%
412 Specialised Food Retailing 2 0.7%
42
Other Store-Based Retailing 36 12.0%
421 Furniture, Floor Coverings, Houseware and Textile Goods
Retailing 4 1.3%
422 Electrical and Electronic Goods Retailing 4 1.3%
423 Hardware, Building and Garden Supplies Retailing 11 3.7%
424 Recreational Goods Retailing 7 2.3%

52
Gympie LDA Structure Plans - Needs
15019 Rev 1
7 December 2015
425 Clothing, Footwear and Personal Accessory Retailing 1 0.3%
427 Pharmaceutical and Other Store-Based Retailing 9 3.0%
43
Non-Store Retailing and Retail Commission-Based Buying and/or Selling 1 0.3%
431 Non-Store Retailing 1 0.3%
H Accommodation and Food Services 5 1.7%
44 Accommodation 2 0.7%
440 Accommodation 2 0.7%
45
Food and Beverage Services 3 1.0%
451 Cafes, Restaurants and Takeaway Food Services 2 0.7%
452 Pubs, Taverns and Bars 1 0.3%
I Transport, Postal and Warehousing 24 8.0%
46 Road Transport 12 4.0%
461 Road Freight Transport 11 3.7%
462 Road Passenger Transport 1 0.3%
51
Postal and Courier Pick-up and Delivery Services 3 1.0%
510 Postal and Courier Pick-up and Delivery Services 3 1.0%
52
Transport Support Services 2 0.7%
521 Water Transport Support Services 1 0.3%
529 Other Transport Support Services 1 0.3%
53
Warehousing and Storage Services 7 2.3%
530 Warehousing and Storage Services 7 2.3%
J Information Media and Telecommunications 2 0.7%
55 Motion Picture and Sound Recording Activities 1 0.3%
552 Sound Recording and Music Publishing 1 0.3%
56
Broadcasting (except Internet) 1 0.3%
561 Radio Broadcasting 1 0.3%
L Rental, Hiring and Real Estate Services 9 3.0%

53
Gympie LDA Structure Plans - Needs
15019 Rev 1
7 December 2015
66 Rental and Hiring Services (except Real Estate) 7 2.3%
663 Other Goods and Equipment Rental and Hiring 7 2.3%
67
Property Operators and Real Estate Services 2 0.7%
671 Property Operators 1 0.3%
672 Real Estate Services 1 0.3%
M Professional, Scientific and Technical Services 5 1.7%
69
Professional, Scientific and Technical Services (Except Computer System Design and Related Services) 5 1.7%
692 Architectural, Engineering and Technical Services 3 1.0%
697 Veterinary Services 1 0.3%
699 Other Professional, Scientific and Technical Services 1 0.3%
N Administrative and Support Services 3 1.0%
72 Administrative Services 1 0.3%
729 Other Administrative Services 1 0.3%
73
Building Cleaning, Pest Control and Other Support Services 2 0.7%
731 Building Cleaning, Pest Control and Gardening Services 2 0.7%
O Public Administration and Safety 2 0.7%
75 Public Administration 1 0.3%
752 State Government Administration 1 0.3%
77
Public Order, Safety and Regulatory Services 1 0.3%
771 Public Order and Safety Services 1 0.3%
P Education and Training 3 1.0%
82 Adult, Community and Other Education 3 1.0%
821 Adult, Community and Other Education 3 1.0%
Q Health Care and Social Assistance 1 0.3%
87 Social Assistance Services 1 0.3%
871 Child Care Services 1 0.3%

54
Gympie LDA Structure Plans - Needs
15019 Rev 1
7 December 2015
R Arts and Recreation Services 5 1.7%
91 Sports and Recreation Activities 5 1.7%
911 Sports and Physical Recreation Activities 3 1.0%
913 Amusement and Other Recreation Activities 2 0.7%
S Other Services 52 17.4%
94 Repair and Maintenance 48 16.1%
941 Automotive Repair and Maintenance 45 15.1%
942 Machinery and Equipment Repair and Maintenance 3 1.0%
95
Personal and Other Services 4 1.3%
951 Personal Care Services 2 0.7%
954 Religious Services 1 0.3%
955 Civic, Professional and Other Interest Group Services 1 0.3%
Total Businesses 299 100.0%
For Sale and Lease 20 6.3%
All Property Type 319 100.0%

55
Gympie LDA Structure Plans - Needs
15019 Rev 1
7 December 2015
Table A2: Businesses in the Gympie Regional Council LGA by Number of Employees and Industry Division, June 2014
Industry Division
Non employing % 1-4 % 5-19 % 20-199 % 200+ % Total %
B Mining 9 0.2% 8 0.2% - 0.0% - - - - 17 0.4%
C Manufacturing 79 1.8% 37 0.9% 32 0.7% 7 0.2% 3 0.1% 158 3.7%
D Electricity, Gas, Water and Waste Services 7 0.2% 3 0.1% - 0.0% - - - - 10 0.2%
E Construction 455 10.5% 228 5.3% 32 0.7% 3 0.1% - - 718 16.6%
F Wholesale Trade 51 1.2% 26 0.6% 13 0.3% 4 0.1% - - 94 2.2%
I Transport, Postal and Warehousing 157 3.6% 88 2.0% 20 0.5% 6 0.1% - - 271 6.3%
Sub-total industrial activities 758 17.6% 390 9.0% 97 2.2% 20 0.5% 3 0.1% 1,268 29.4%
A Agriculture, Forestry and Fishing 949 22.0% 154 3.6% 48 1.1% 5 0.1% - - 1,156 26.8%
G Retail Trade 113 2.6% 110 2.6% 73 1.7% 12 0.3% - - 308 7.1%
H Accommodation and Food Services 41 1.0% 45 1.0% 61 1.4% 11 0.3% - - 158 3.7%
J Information Media and Telecommunications 15 0.3% 3 0.1% - 0.0% - - - - 18 0.4%
K Financial and Insurance Services 140 3.2% 27 0.6% 4 0.1% - - - - 171 4.0%
L Rental, Hiring and Real Estate Services 362 8.4% 41 1.0% 22 0.5% - - - - 425 9.9%
M Professional, Scientific and Technical Services 126 2.9% 86 2.0% 16 0.4% 7 0.2% - - 235 5.4%
N Administrative and Support Services 51 1.2% 38 0.9% 18 0.4% - - - - 107 2.5%
O Public Administration and Safety 9 0.2% - - - 0.0% - - - - 9 0.2%
P Education and Training 25 0.6% 9 0.2% 6 0.1% - - - - 40 0.9%
Q Health Care and Social Assistance 55 1.3% 45 1.0% 20 0.5% 10 0.2% - - 130 3.0%
R Arts and Recreation Services 20 0.5% 7 0.2% 6 0.1% - - - - 33 0.8%
S Other Services 92 2.1% 85 2.0% 24 0.6% - - - - 201 4.7%
X Unknown 38 0.9% 13 0.3% 3 0.1% - - - - 54 1.3%
Total 2,794 64.8% 1,053 24.4% 398 9.2% 65 1.5% 3 0.1% 4,313 100.0%
Source: ABS Counts of Australian Businesses including Entries and Exits by SA2 (Cooloola, Kilkivan, Gympie North, Gympie South, and Gympie Region), Jun 2010 to Jun 2014.

56
Gympie LDA Structure Plans - Needs
15019 Rev 1
7 December 2015
Table A3: Businesses in the Gympie Region by Number of Employees and Industry Division, June 2007
Industry Division Non
employing % 1-4 % 5-19 % 20-199 % 200+ % Total %
B Mining 9 0.2% 3 0.1% - 0.0% - 0.0% - - 12 0.3%
C Manufacturing 90 2.1% 57 1.4% 39 0.9% 15 0.4% - - 201 4.8%
D Electricity Gas and Water Supply 21 0.5% 21 0.5% - 0.0% 3 0.1% - - 45 1.1%
E Construction 294 7.0% 228 5.4% 69 1.6% 12 0.3% - - 603 14.3%
F Wholesale Trade 72 1.7% 39 0.9% 27 0.6% 12 0.3% - - 150 3.6%
I Transport and Storage 111 2.6% 63 1.5% 18 0.4% 6 0.1% - - 198 4.7%
Sub-total industrial activities 597 14.2% 411 9.8% 153 3.6% 48 1.1% - - 1,209 28.7%
A Agriculture Forestry and Fishing 978 23.3% 147 3.5% 93 2.2% 33 0.8% - - 1,251 29.7%
G Retail Trade 201 4.8% 192 4.6% 99 2.4% 21 0.5% - - 513 12.2%
H Accommodation Cafes and Restaurants 30 0.7% 18 0.4% 33 0.8% 18 0.4% - - 99 2.4%
J Communication Services 27 0.6% 18 0.4% - 0.0% - 0.0% - - 45 1.1%
K Finance and Insurance 93 2.2% 15 0.4% 6 0.1% 3 0.1% - - 117 2.8%
L Property and Business Services 498 11.8% 93 2.2% 66 1.6% 21 0.5% - - 678 16.1%
N Education 9 0.2% 3 0.1% - 0.0% - 0.0% - - 12 0.3%
O Health and Community Services 51 1.2% 36 0.9% 15 0.4% 12 0.3% - - 114 2.7%
P Culture and Recreation Services 45 1.1% 24 0.6% 3 0.1% 3 0.1% - - 75 1.8%
Q Personal and Other Services 57 1.4% 21 0.5% 15 0.4% - 0.0% - - 93 2.2%
Total 2,586 61.5% 978 23.3% 483 11.5% 159 3.8% - - 4,206 100.0%
Source: ABS Counts of Australian Businesses including Entries and Exits, June 2003 to June 2007.
Note: In 2007 Industry Division was classified using a previous version of the ANZSIC classification. The differences between these two versions are mostly minor with some
alterations to division titles and the addition of a Unknown category division in 2014. The most substantial alteration is to the previous Division L ‘Property and Business
Services’, which has been split into four new divisions, namely ‘L – Rental Hiring, and Real Estate Services’, ‘M – Professional, Scientific and Technical Services’, ‘N –
Administrative and Support Services’, and ‘O – Public Administration and Safety’.

57
Gympie LDA Structure Plans - Needs
15019 Rev 1
7 December 2015
Table A4: Change in Businesses in the Gympie Regional Council LGA by Number of Employees and Industry Division, June 2007 – June 2014
Industry Non
employing % 1-4 % 5-19 % 20-199 % 200+ % Total %
B Mining 0 0.0% 5 0.1% 0 0.0% 0 0.0% 0 0.0% 5 0.1%
C Manufacturing -11 -0.3% -20 -0.5% -7 -0.2% -8 -0.2% 3 0.1% -43 -1.1%
D Electricity, Gas, Water and Waste Services -14 -0.3% -18 -0.4% 0 0.0% -3 -0.1% 0 0.0% -35 -0.8%
E Construction 161 3.6% 0 -0.1% -37 -0.9% -9 -0.2% 0 0.0% 115 2.3%
F Wholesale Trade -21 -0.5% -13 -0.3% -14 -0.3% -8 -0.2% 0 0.0% -56 -1.4%
I Transport, Postal and Warehousing 46 1.0% 25 0.5% 2 0.0% 0 0.0% 0 0.0% 73 1.6%
Sub-total industrial activities 161 3.4% -21 -0.7% -56 -1.4% -28 -0.7% 3 0.1% 59 0.7%
A Agriculture, Forestry and Fishing -29 -1.2% 7 0.1% -45 -1.1% -28 -0.7% 0 0.0% -95 -2.9%
G Retail Trade -88 -2.2% -82 -2.0% -26 -0.7% -9 -0.2% 0 0.0% -205 -5.1%
H Accommodation and Food Services 11 0.2% 27 0.6% 28 0.6% -7 -0.2% 0 0.0% 59 1.3%
J Information Media and Telecommunications -12 -0.3% -15 -0.4% 0 0.0% 0 0.0% 0 0.0% -27 -0.7%
K Financial and Insurance Services 47 1.0% 12 0.3% -2 0.0% -3 -0.1% 0 0.0% 54 1.2%
L, M, N, O Property and Business Services* 50 0.9% 72 1.6% -10 -0.3% -14 -0.3% 0 0.0% 98 1.9%
P Education and Training 16 0.4% 6 0.1% 6 0.1% 0 0.0% 0 0.0% 28 0.6%
Q Health Care and Social Assistance 4 0.1% 9 0.2% 5 0.1% -2 -0.1% 0 0.0% 16 0.3%
R Arts and Recreation Services -25 -0.6% -17 -0.4% 3 0.1% -3 -0.1% 0 0.0% -42 -1.0%
S Other Services 35 0.8% 64 1.5% 9 0.2% 0 0.0% 0 0.0% 108 2.4%
X Unknown 38 0.9% 13 0.3% 3 0.1% 0 0.0% 0 0.0% 54 1.3%
Total 208 3.3% 75 1.2% -85 -2.3% -94 -2.3% 3 0.1% 107 0.0%
Source: Source: ABS Counts of Australian Businesses including Entries and Exits, June 2003 to June 2007 & June 2010 to June 2014.
* Note: In order to best compare 2007 and 2014 data the 2014 ANZSIC Divisions of ‘L – Rental Hiring, and Real Estate Services’, ‘M – Professional, Scientific and Technical
Services’, ‘N – Administrative and Support Services’, and ‘O – Public Administration and Safety’ were combined and compared against the 2007 Division ‘L – Property and
Business Services’.
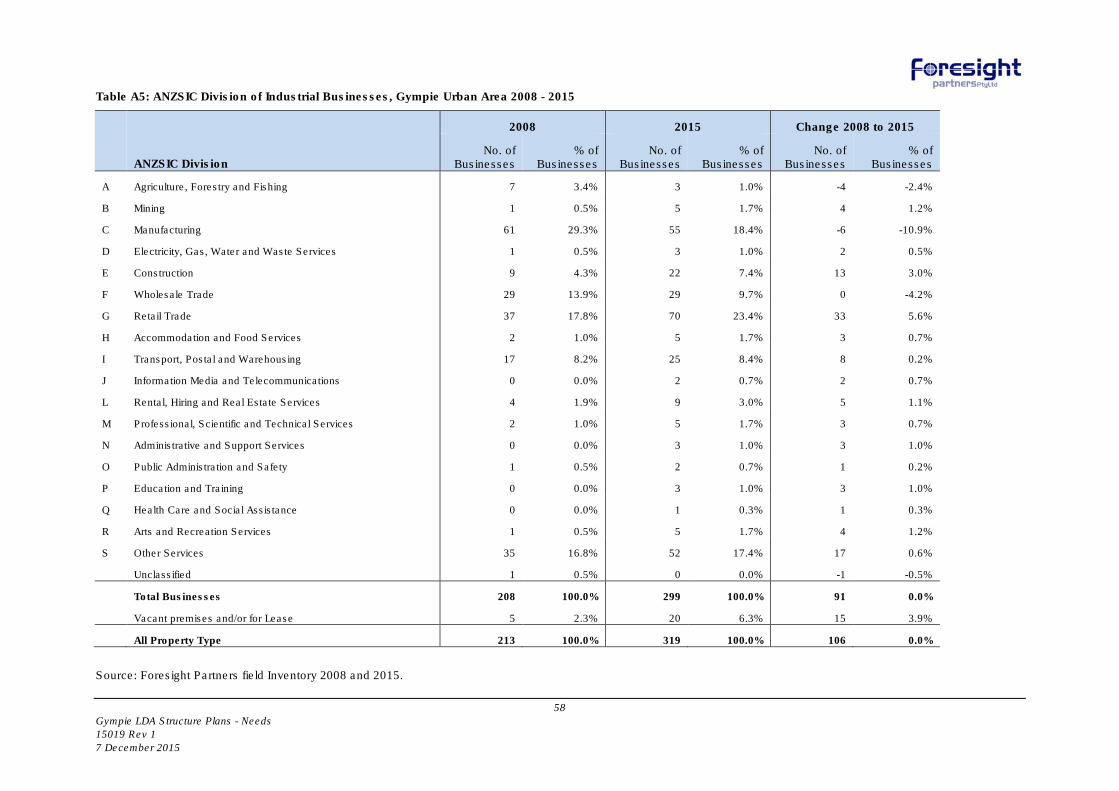
58
Gympie LDA Structure Plans - Needs
15019 Rev 1
7 December 2015
Table A5: ANZSIC Division of Industrial Businesses, Gympie Urban Area 2008 - 2015
ANZSIC Division
2008 2015 Change 2008 to 2015
No. of Businesses
% of Businesses
No. of Businesses
% of Businesses
No. of Businesses
% of Businesses
A Agriculture, Forestry and Fishing 7 3.4% 3 1.0% -4 -2.4%
B Mining 1 0.5% 5 1.7% 4 1.2%
C Manufacturing 61 29.3% 55 18.4% -6 -10.9%
D Electricity, Gas, Water and Waste Services 1 0.5% 3 1.0% 2 0.5%
E Construction 9 4.3% 22 7.4% 13 3.0%
F Wholesale Trade 29 13.9% 29 9.7% 0 -4.2%
G Retail Trade 37 17.8% 70 23.4% 33 5.6%
H Accommodation and Food Services 2 1.0% 5 1.7% 3 0.7%
I Transport, Postal and Warehousing 17 8.2% 25 8.4% 8 0.2%
J Information Media and Telecommunications 0 0.0% 2 0.7% 2 0.7%
L Rental, Hiring and Real Estate Services 4 1.9% 9 3.0% 5 1.1%
M Professional, Scientific and Technical Services 2 1.0% 5 1.7% 3 0.7%
N Administrative and Support Services 0 0.0% 3 1.0% 3 1.0%
O Public Administration and Safety 1 0.5% 2 0.7% 1 0.2%
P Education and Training 0 0.0% 3 1.0% 3 1.0%
Q Health Care and Social Assistance 0 0.0% 1 0.3% 1 0.3%
R Arts and Recreation Services 1 0.5% 5 1.7% 4 1.2%
S Other Services 35 16.8% 52 17.4% 17 0.6%
Unclassified 1 0.5% 0 0.0% -1 -0.5%
Total Businesses 208 100.0% 299 100.0% 91 0.0%
Vacant premises and/or for Lease 5 2.3% 20 6.3% 15 3.9%
All Property Type 213 100.0% 319 100.0% 106 0.0%
Source: Foresight Partners field Inventory 2008 and 2015.
