local government finance act 1992 - orkney … and statistics/revenue... · 3-year budget strategy...
TRANSCRIPT

LOCAL GOVERNMENT FINANCE ACT 1992
REVENUE ESTIMATES 2005/2006 to 2007/08
&
CAPITAL PROGRAMME 2005/06 to 2007/08


REVENUE ESTIMATES
CONTENTS Page
Foreword by Director of Finance and Housing 1
1 General Fund Budget Strategy & Assumptions 5
3-Year Budget Strategy 7
Council Tax Calculation 2005/06 9
Council Tax Comparison 2005/06 10
Summary of Approved Growth 11
2 General Fund Service Budgets 15
Service Summary 17
Central Administration 21
Education 24
Recreation and Cultural Services 28
Community Social Services 33
Law, Order and Protective Services 37
Roads 38
Transportation 40
Environmental Services 42
Other Housing 45
Economic Development 47
Planning 48
Other Services 50
Sources of Funding 53
3 Housing Revenue Account 55
Housing Revenue Account 57
4 Harbour Accounts 59
Scapa Flow Oil Port 61
Miscellaneous Piers and Harbours 63
REVENUE ESTIMATES
CONTENTS Page
5 General Fund Capital 65
Service Summary 67
Housing (Non-HRA) 68
Community Social Services 68
Education 69
Roads 69
Recreation and Cultural Services 70
Administration Services 70
Corporate Property Maintenance 70
Environmental Services 71
Transportation 71
6 Non-General Fund Capital 73
Service Summary 75
Housing (HRA) 76
Strategic Reserve Fund 76
Non-Transportation (Harbours) 77
Harbours 77

FOREWORD BY THE DIRECTOR OF FINANCE AND HOUSING
Introduction The Local Government Finance Act 1992 is the legislative basis for the current system of local taxation, namely Council Tax. The Council is required to set a balanced budget by the 11th March in the financial year preceding that for which it is set. The revenue budget for the financial year 2005/06, commencing 1 April 2005, was agreed on 10 February 2005 and a Council Tax of £973 was set. This represented a 3.5% increase from the previous year.
Level of Expenditure The net revenue budget set for 2005/06 stands at £61,739,000, representing an increase from the previous year of 8.1%. Contained within individual service budgets is £1,722,000 of additional growth and further details of this can be found on Page 15. This level of increase is only possible through a budget strategy which spans a 3-year period and draws heavily on the Relevant Services Contingency Fund. The budgeted contribution from this fund is £3,061,000 during 2005/06, however, the approved budget strategy (Page 7) is for the level of contribution to fall to a maximum level of £1,500,000 in 2006/07 and continuing at this level thereafter.
Document Structure The opening chapter deals with the 3-year budget strategy as agreed by the Council on 10 February 2005, and the underlying assumptions used in arriving at the approved budget for 2005/06. This includes a statement of the Strategy itself, Council Tax calculation and the approved growth awarded to each Service Area.
Chapter 2 then details the General Fund Revenue Estimates, beginning with a Service Area summary, which includes a summary by Service Function. More detailed Service Area budgets by Subjective Group then follows.
Chapter 3 deals with the Housing Revenue Account.
Chapter 4 deals with the Harbour Accounts : Scapa Flow Oil Port and Miscellaneous Piers and Harbours.
Finally, Chapters 5 and 6 deal with the Capital Programmes for the General Fund and Non-General Fund respectively.
Definition of Key Terms The estimates have been prepared using the format of the Council’s financial ledger system, which reflects the standard classification of local authority income and expenditure as recommended by the Chartered Institute of Public Finance and Accountancy (CIPFA) and the Local Authorities (Scotland) Accountancy Advisory Committee (LASAAC).
Alongside the revenue estimates 2005/06, the probable outturn and revenue estimates for the financial year 2004/05 are presented. These detail the full year costs of providing General Fund, Harbour Authority and Housing Revenue Account services.
Probable Outturn 2004/05 Estimated spending/income to 31 March 2005. As per the Provisional Outturn Budget Estimate (POBE) 2005.
Approved Budget 2004/05 Approved budget to 31 March 2005. As per initial budget of £56,460,000 plus Redetermination of Revenue Support Grant of £635,600 (March 2005).
Approved Budget 2005/06 Approved budget to 31 March 2006. As approved by Council, 10 February 2005.
Provisional Estimate 2006/07 Budget estimate to 31 March 2007. Indicative Council Tax increase of 3.5%.
Provisional Estimate 2007/08 Budget estimate to 31 March 2008.
Budget Book 2005-06 to 2007-08 1

Assumed Council Tax increase of 2.5%.
The following terms are used throughout the estimates with the undernoted definitions:
Service Area Specific area within a Service Committee e.g. Community Social Services, Planning etc.
Service Function Specific function within a service area e.g. Childcare, Elderly Residential, etc.
Subjective Group Expenditure & Income Grouping e.g. Staff, Property, Fees & Charges etc.
More detailed descriptions of each element within each of the Subjective Groups now follow:
Subjective Group (Expenditure)
Staff Costs Salaries, Wages, Pension Contributions, National Insurance, Interview Expenses and Removal Costs.
Property Costs Rent, Rates, Insurance, Heat, Light and Power, Repairs and Maintenance and Cleaning.
Supplies and Services Purchases of Supplies, Materials, Equipment, Contract Services (except Cleaning), Consultants and IT Costs of Hardware and Software.
Transport Costs Vehicle and Plant Costs, Transport, Fares and Car Allowances.
Administration Costs Office Stationery, Photocopying, Telephones, Postage, Printing, Subsistence, Training Expenses and Non Property Insurance’s.
Apportioned Costs The cost of Central Support Service Departments - Chief Executive, Administration, Legal, Finance, Technical Services - recharged to Services.
Third Party Payments Payments for the provision of services on an Agency basis by external bodies, such as Other Local Authorities, Voluntary Organisations, Direct Service Organisations and Private Contractors.
Transfer Payments Payments to individuals for which no goods or services are received, such as Student Bursaries, Housing Benefits and other Grant payments
Miscellaneous Expenditure Other Expenditure
Finance Charges The cost of financing the Capital Programme either by way of repayment of loans with interest or by a direct charge to the Revenue Account. Payments made in respect of Finance Leases.
Budget Book 2005-06 to 2007-08 2

Subjective Group (Income)
Government Grants Scottish Executive Grants.
Other Grants, Reimbursements & Contributions Health Authority, Other Agencies and Voluntary Organisations.
Rent & Lettings Hire of Equipment, Lettings and Rents.
Sales Sale of equipment and materials, Canteen/ Refectory and School Meals.
Interest & Loans Interest on Revenue Balances and Loans.
Fees & Charges Licences, Admission Charges, Harbour Dues and Telephones.
Apportioned Income Central Support Service Departments Recharge to Other Departments.
Miscellaneous Income Other Income.
Corporate Resource Plan Additional to this Revenue Estimates publication, a Corporate Resource Plan (CRP) has been produced for Members and Senior Management by the Policy Unit . This CRP is supplementary to the Revenue Estimates and provides a link between the financial resources and planned service activities of the Council.
Albert Tait Director of Finance and Housing July 2005
Budget Book 2005-06 to 2007-08 3

Budget Book 2005-06 to 2007-08 4

GENERAL FUND
STRATEGY AND
ASSUMPTIONS
Budget Book 2005-06 to 2007-08 5

Budget Book 2005-06 to 2007-08 6
3-YEAR BUDGET STRATEGY
Core Objective Taking all the factors mentioned into account it would seem appropriate to adopt a budget strategy for the next 3 years which uses the good settlement in 2006/07 in conjunction with increasing and then reducing the contribution from the Relevant Services Contingency Fund (RSCF), so that the problems/shortfalls in 2005/06 and 2007/08 are eased without the need to implement reductions in one year which might be re-instated the following year. Such a strategy would protect existing core services as well as taking on board the highest priority areas of spending as determined by the Council.
Recycling This will still leave a substantial amount of unmet need as identified in the CRP bids arising from service pressures and potential growth in services. Integral to the budget strategy would also be the ability for the Council to agree at the budget setting stage (and subsequently as required) certain priority areas of new or additional spending identified in the CRP bids that could on recommendation by a Committee be accommodated by recycling of resources within the Committees area of responsibility.
Corporate Provisions A further feature of the strategy would be to adopt arrangements which allowed certain types of demand led expenditure (such as placements outwith Orkney) to be set at a limit within a service committees budget and to establish a centrally held contingency sum to meet demands in excess of the base budget(s). Appropriate control and monitoring arrangements would require to be put in place to underpin such a facility. Within the CRP bids there is also one area of expenditure pressure which has been identified by a number of Directors, the cost of which cannot be accurately identified at this time. This is the requirement to undertake Strategic Environmental Assessments. This again is a matter which should perhaps be dealt with by means of establishing a central contingency sum. Such a sum would be held and controlled centrally thereby maintaining the ability to clearly identify the eventual direct cost to the Council for complying with this requirement.
Voluntary Sector A further factor has been the need for the voluntary sector to secure longer term certainty in grant funding from the Council. The proposals in this paper would allow the ability to make a 3 year commitment based on the figures in this presentation. During the course of the year work could also commence on creating a corporate budget for grants to the voluntary sector and possibly establishing a central point of contact. The voluntary sector corporate budget would be established from transferring resources from existing service budgets minus sums which are provided to the voluntary sector for services.
Training Needs It is also clear that more funding requires to be put aside (at least in the short term) to meet training needs brought about by various legislative and best value requirements. An additional provision held centrally (to supplement the £100K presently provided) requires to be established with appropriate arrangements put in place to determine the use and distribution of these funds.
Budget Book 2005-06 to 2007-08 7

3-YEAR BUDGET STRATEGY
Overspends Existing budgets are under significant pressure with overspends forecast in specific service areas. Allocating scarce resources to new spending pressures without ensuring that existing core services are adequately funded is not sustainable. The BSG and Chairmen/Vice Chairmen along with relevant service directors should meet shortly after the end of the financial year to review the reasons underlying any overspending. Any recommendations arising from such a review would be reported to the Policy and Resources Committee.
Fairer Grant Settlement The medium to longer term objective should be to continue to lobby for a fairer grant settlement from the Scottish Executive and to reduce the reliance on the RSCF to fund the Councils core services.
Strategic Reserve Fund The total sum to be set aside from the interest earned by the Strategic Reserve Fund and how it should be allocated over service committees requires to be established for the 3 year period 2005/06 to 2007/08. The 2005/06 figure would be fixed with the 2006/07 and 2007/08 being provisional and confirmed or otherwise on a yearly basis in line with the 3 year budgeting arrangement for general fund revenue spending.
Budget Book 2005-06 to 2007-08 8

COUNCIL TAX CALCULATION 2005/06
Base Budget 2005/06
Revised £000
61,739
Add Specific Grants
Less Transfer from Balances
2,800 64,539 -3,061
Less Finance Settlement 61,478
-54,836
Expenditure to be met by Council Tax 6,642
Band D Properties Forecast Assumed Collection rate No. of Band D Equivelant Tax Payers
7,037 97%
6,826
Band D Council Tax 2005/06 973
Band Property Value (£) Proportion Tax (£)
A B C D E F G H
up to 27,000 over 27,000-35,000 over 35,000-45,000 over 45,000-58,000 over 58,000-80,000 over 80,000-106,000 over 106,000-212,000 above 212,000
6/9 7/9 8/9 9/9
11/9 13/9 15/9 18/9
649 757 865 973
1,189 1,405 1,622 1,946
Budget Book 2005-06 to 2007-08 9
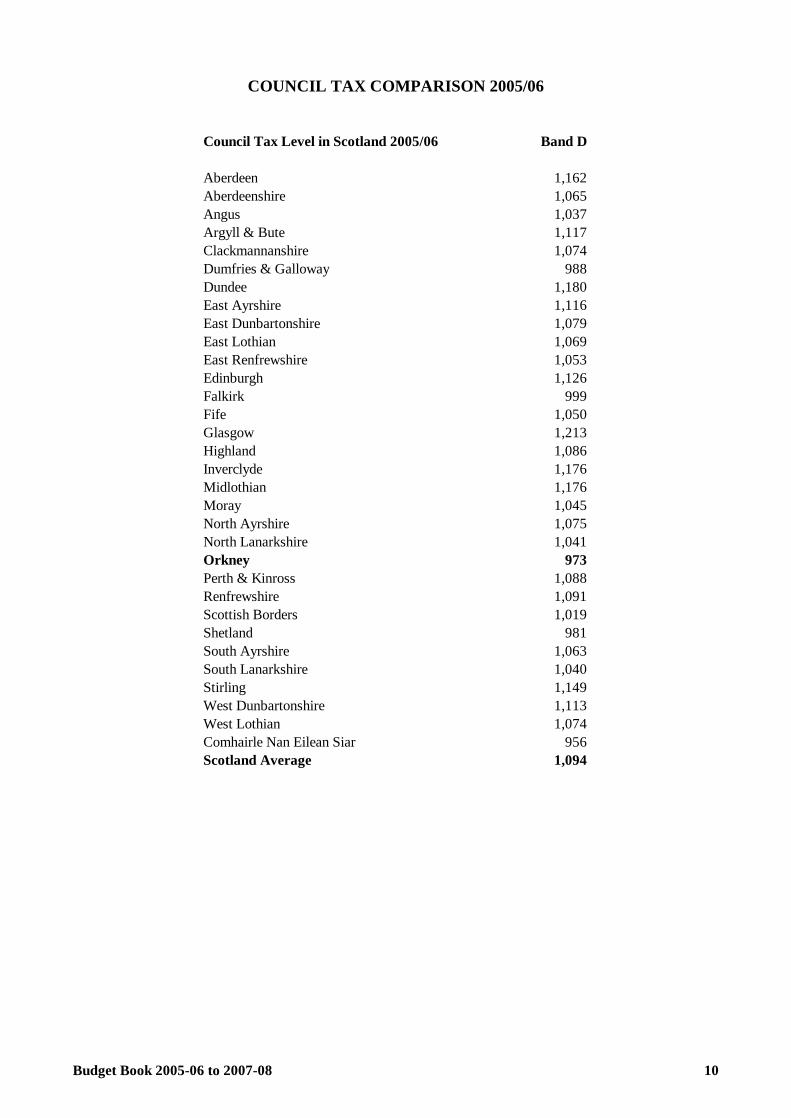
COUNCIL TAX COMPARISON 2005/06
Council Tax Level in Scotland 2005/06 Band D
Aberdeen 1,162 Aberdeenshire 1,065 Angus 1,037 Argyll & Bute 1,117 Clackmannanshire 1,074 Dumfries & Galloway 988 Dundee 1,180 East Ayrshire 1,116 East Dunbartonshire 1,079 East Lothian 1,069 East Renfrewshire 1,053 Edinburgh 1,126 Falkirk 999 Fife 1,050 Glasgow 1,213 Highland 1,086 Inverclyde 1,176 Midlothian 1,176 Moray 1,045 North Ayrshire 1,075 North Lanarkshire 1,041 Orkney 973 Perth & Kinross 1,088 Renfrewshire 1,091 Scottish Borders 1,019 Shetland 981 South Ayrshire 1,063 South Lanarkshire 1,040 Stirling 1,149 West Dunbartonshire 1,113 West Lothian 1,074 Comhairle Nan Eilean Siar 956 Scotland Average 1,094
Budget Book 2005-06 to 2007-08 10

SUMMARY OF APPROVED GROWTH 2005/06
BY SERVICE AREA
Service Area Code
Specific Funding in Settlement
£000
Inescapable/ Priority
£000
Quality of Life
£000
Total Approved
Growth £000
Central Administration CA 205.0 75.2 25.0 305.2 Education ED 0.0 201.2 0.0 201.2 Recreation & Cultural Services RC 0.0 0.0 44.1 44.1 Community Social Services SW 53.0 110.8 0.0 163.8 Law, Order and Protective Services LO 467.0 0.0 0.0 467.0 Transportation TR 0.0 126.0 303.0 429.0 Environmental Services ES 8.0 39.6 10.0 57.6 Planning PL 0.0 24.2 29.9 54.1
BY GROWTH ITEM
733.0 577.0 412.0 1,722.0
Money Advice CA 80.0 80.0 Increased Specific Grant CA 125.0 125.0 Freedom of Information Compliance CA 11.0 11.0 Community Network Infrastructure CA 31.3 31.3 Payroll Data Security/Training CA 10.1 10.1 Payroll Interface Rewrite CA 13.1 13.1 Fixed Asset System CA 9.7 9.7 Youth Dialogue CA 25.0 25.0 School Transport Contracts ED 130.2 130.2 Nursery Nurse Salaries ED 52.1 52.1 Care Commission - Papdale Halls ED 18.9 18.9 Dataloggers Purchases RC 5.1 5.1 Park & Play Areas RC 8.2 8.2 Youth Work Staff RC 3.9 3.9 Provision of Evening Classes RC 6.0 6.0 Admin Secretarial Support RC 9.1 9.1 Shortfall for Cultural Co-ordinator RC 3.8 3.8 Shortfall for Island Archaeologist RC 8.0 8.0 Supp Young People Leaving Care SW 8.0 8.0 DWP Transfer of Res Allowance SW 14.0 14.0 Supporting People SW 31.0 31.0 Assessment and Care Mgt Staffing SW 86.5 86.5 Direct Payments - New Service SW 24.3 24.3 Police Requisition LO 200.0 200.0 Fire Requisition LO 16.0 16.0 Fire Transitional Funding LO 251.0 251.0 Inter-Island Ferry Service TR 126.0 250.0 376.0 Inter-Island Air Service TR 8.0 8.0 Uplift in Airfields Budget TR 45.0 45.0 Increased Waste Handling ES 8.0 27.1 35.1 Health Improvement Staffing ES 12.5 12.5 Landfill ES 10.0 10.0 Building Control Staffing PL 24.2 24.2 Extend Biodiversity Post PL 22.0 22.0 3-yr Access Assistant PL 7.9 7.9
733.0 577.0 412.0 1,722.0
Budget Book 2005-06 to 2007-08 11

SUMMARY OF APPROVED GROWTH 2006/07
BY SERVICE AREA
Service Area Code
Specific Funding in Settlement
£000
Inescapable/ Priority
£000
Quality of Life
£000
Total Approved
Growth £000
Central Administration CA 205.0 45.7 25.0 275.7 Education ED 0.0 255.9 0.0 255.9 Recreation & Cultural Services RC 0.0 0.0 39.0 39.0 Community Social Services SW 53.0 146.3 0.0 199.3 Law, Order and Protective Services LO 467.0 0.0 0.0 467.0 Transportation TR 0.0 413.0 199.1 612.1 Environmental Services ES 8.0 44.0 10.0 62.0 Planning PL 0.0 18.4 29.9 48.3
BY GROWTH ITEM
733.0 923.3 303.0 1,959.3
Money Advice CA 80.0 80.0 Increased Specific Grant CA 125.0 125.0 Freedom of Information Compliance CA 12.0 12.0 Community Network Infrastructure CA 32.6 32.6 Payroll Interface Rewrite CA 1.1 1.1 Youth Dialogue CA 25.0 25.0 School Transport Contracts ED 131.9 131.9 Nursery Nurse Salaries ED 56.6 56.6 Care Commission - Papdale Halls ED 19.1 19.1 Support for Learning Assistants ED 48.3 48.3 Park & Play Areas RC 8.2 8.2 Youth Work Staff RC 3.9 3.9 Provision of Evening Classes RC 6.0 6.0 Admin Secretarial Support RC 9.1 9.1 Shortfall for Cultural Co-ordinator RC 3.8 3.8 Shortfall for Island Archaeologist RC 8.0 8.0 Supp Young People Leaving Care SW 8.0 8.0 DWP Transfer of Res Allowance SW 14.0 14.0 Supporting People SW 31.0 31.0 Assessment and Care Mgt Staffing SW 71.4 71.4 Direct Payments - New Service SW 74.9 74.9 Police Requisition LO 200.0 200.0 Fire Requisition LO 16.0 16.0 Fire Transitional Funding LO 251.0 251.0 Inter-Island Ferry Service TR 413.0 146.1 559.1 Inter-Island Air Service TR 8.0 8.0 Uplift in Airfields Budget TR 45.0 45.0 Increased Waste Handling ES 8.0 28.0 36.0 Health Improvement Staffing ES 16.0 16.0 Landfill ES 10.0 10.0 Building Control Staffing PL 18.4 18.4 Extend Biodiversity Post PL 22.0 22.0 3-yr Access Assistant PL 7.9 7.9
733.0 923.3 303.0 1,959.3
Budget Book 2005-06 to 2007-08 12

SUMMARY OF APPROVED GROWTH 2007/08
BY SERVICE AREA
Service Area Code
Specific Funding in Settlement
£000
Inescapable/ Priority
£000
Quality of Life
£000
Total Approved
Growth £000
Central Administration CA 205.0 45.7 25.0 275.7 Education ED 0.0 255.9 0.0 255.9 Recreation & Cultural Services RC 0.0 0.0 39.0 39.0 Community Social Services SW 53.0 146.3 0.0 199.3 Law, Order and Protective Services LO 467.0 0.0 0.0 467.0 Transportation TR 0.0 413.0 199.1 612.1 Environmental Services ES 8.0 44.0 10.0 62.0 Planning PL 0.0 18.4 29.9 48.3
BY GROWTH ITEM
733.0 923.3 303.0 1,959.3
Money Advice CA 80.0 80.0 Increased Specific Grant CA 125.0 125.0 Freedom of Information Compliance CA 13.0 13.0 Community Network Infrastructure CA 33.8 33.8 Payroll Interface Rewrite CA 1.1 1.1 Youth Dialogue CA 25.0 25.0 School Transport Contracts ED 133.6 133.6 Nursery Nurse Salaries ED 59.9 59.9 Care Commission - Papdale Halls ED 19.3 19.3 Support for Learning Assistants ED 49.1 49.1 Park & Play Areas RC 8.2 8.2 Youth Work Staff RC 3.9 3.9 Provision of Evening Classes RC 6.0 6.0 Admin Secretarial Support RC 9.1 9.1 Shortfall for Cultural Co-ordinator RC 3.8 3.8 Shortfall for Island Archaeologist RC 8.0 8.0 Supp Young People Leaving Care SW 8.0 8.0 DWP Transfer of Res Allowance SW 14.0 14.0 Supporting People SW 31.0 31.0 Assessment and Care Mgt Staffing SW 75.8 75.8 Direct Payments - New Service SW 114.9 114.9 Police Requisition LO 200.0 200.0 Fire Requisition LO 16.0 16.0 Fire Transitional Funding LO 251.0 251.0 Inter-Island Ferry Service TR 683.0 146.1 829.1 Inter-Island Air Service TR 8.0 8.0 Uplift in Airfields Budget TR 45.0 45.0 Increased Waste Handling ES 8.0 29.0 37.0 Health Improvement Staffing ES 17.0 17.0 Landfill ES 10.0 10.0 Building Control Staffing PL 21.3 21.3 Extend Biodiversity Post PL 22.0 22.0 3-yr Access Assistant PL 7.9 7.9
733.0 1,250.8 303.0 2,286.8
Budget Book 2005-06 to 2007-08 13

Budget Book 2005-06 to 2007-08 14

GENERAL FUND
SERVICE BUDGETS
Budget Book 2005-06 to 2007-08 15

Budget Book 2005-06 to 2007-08 16

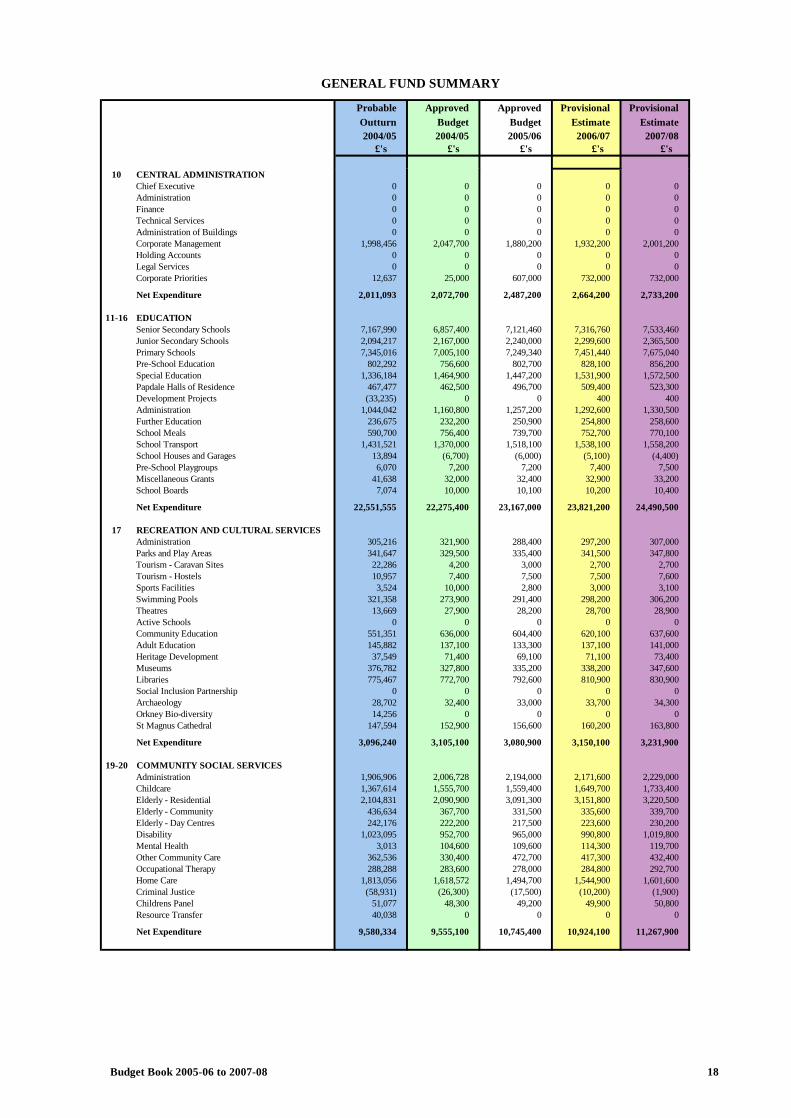
GENERAL FUND SUMMARY
BY SERVICE AREA
Probable Outturn 2004/05
£'s
Approved Budget 2004/05
£'s
Approved Budget 2005/06
£'s
Provisional Estimate 2006/07
£'s
Provisional Estimate 2007/08
£'s
Central Administration 2,011,093 2,072,700 2,487,200 2,664,200 2,733,200 Education 22,551,555 22,275,400 23,167,000 23,821,200 24,490,500 Recreation & Cultural Services 3,096,240 3,105,100 3,080,900 3,150,100 3,231,900 Community Social Services 9,580,334 9,555,100 10,745,400 10,924,100 11,267,900 Law, Order and Protective Services 2,758,447 2,933,300 3,141,200 3,180,200 3,219,900 Roads 3,738,432 4,194,600 4,294,600 4,394,500 4,503,400 Transportation 5,696,354 5,648,300 6,247,200 6,511,100 6,863,100 Environmental Services 3,166,964 3,334,800 3,182,800 3,257,300 3,334,500 Other Housing 212,187 209,900 187,300 197,500 207,800 Economic Development 608,095 558,000 580,900 598,900 619,400 Planning 419,682 601,000 614,300 623,700 643,800 Other Services 2,556,776 2,607,400 4,010,200 4,030,100 4,050,500
TOTALS 56,396,158 57,095,600 61,739,000 63,352,900 65,165,900
BY SUBJECTIVE GROUP Staff Costs 35,099,314 34,875,200 38,069,400 38,974,900 40,185,700 Other Staff Costs 694,067 335,800 545,000 525,300 529,500 Property Costs 4,563,971 4,417,700 4,514,200 4,579,100 4,652,700 Supplies and Services 2,841,622 2,779,300 3,386,700 3,382,600 3,375,100 Transport Costs 3,350,567 2,983,900 3,185,000 3,223,400 3,264,500 Administration Costs 2,624,124 2,123,300 2,378,200 2,476,000 2,503,400 Apportioned Costs 4,193,600 4,193,600 4,341,200 4,457,800 4,616,100 Third Party Payments 19,664,486 20,378,782 20,662,100 21,243,600 21,905,500 Transfer Payments 3,588,319 3,691,560 4,562,600 4,659,000 4,747,600 Loan Charges 2,105,000 2,135,000 3,135,000 3,135,000 3,135,000 Miscellaneous Expenditure 103,247 91,800 92,000 93,500 94,400
Total Expenditure 78,828,317 78,005,942 84,871,400 86,750,200 89,009,500 Government Grants (6,072,574) (5,671,942) (6,887,500) (6,862,800) (6,973,500) Other Grants & Reimbursements (4,411,141) (3,620,916) (4,150,200) (4,184,800) (4,206,600) Rents & Lettings (410,024) (430,000) (429,900) (429,900) (429,900) Sales (711,488) (673,900) (695,700) (716,300) (736,800) Interest & Loans (182,486) (177,000) (177,000) (177,000) (177,000) Fees & Charges (3,338,631) (2,909,100) (3,155,600) (3,232,900) (3,310,500) Apportioned Income (6,786,185) (6,980,784) (7,098,200) (7,254,300) (7,469,100) Miscellaneous Income (519,630) (446,700) (538,300) (539,300) (540,200)
Total Income (22,432,159) (20,910,342) (23,132,400) (23,397,300) (23,843,600)
Net Expenditure 56,396,158 57,095,600 61,739,000 63,352,900 65,165,900
SOURCES OF FUNDING Non Domestic Rates (7,205,000) (7,205,000) (7,243,000) (7,424,000) (7,610,000) Council Tax (6,367,000) (6,367,000) (6,642,000) (6,874,000) (7,046,000) Revenue Support Grant (42,684,000) (43,314,600) (44,793,000) (47,823,000) (48,695,000) Relevant Services Fund Contribution (140,158) (209,000) (3,061,000) (1,231,900) (1,814,900)
Total Income (56,396,158) (57,095,600) (61,739,000) (63,352,900) (65,165,900)
Budget Book 2005-06 to 2007-08 17
GENERAL FUND SUMMARY
10 CENTRAL ADMINISTRATION
Probable Outturn 2004/05
£'s
Approved Budget 2004/05
£'s
Approved Budget 2005/06
£'s
Provisional Estimate 2006/07
£'s
Provisional Estimate 2007/08
£'s
Chief Executive 0 0 0 0 0 Administration 0 0 0 0 0 Finance 0 0 0 0 0 Technical Services 0 0 0 0 0 Administration of Buildings 0 0 0 0 0 Corporate Management 1,998,456 2,047,700 1,880,200 1,932,200 2,001,200 Holding Accounts 0 0 0 0 0 Legal Services 0 0 0 0 0 Corporate Priorities 12,637 25,000 607,000 732,000 732,000
Net Expenditure
11-16 EDUCATION
2,011,093 2,072,700 2,487,200 2,664,200 2,733,200
Senior Secondary Schools 7,167,990 6,857,400 7,121,460 7,316,760 7,533,460 Junior Secondary Schools 2,094,217 2,167,000 2,240,000 2,299,600 2,365,500 Primary Schools 7,345,016 7,005,100 7,249,340 7,451,440 7,675,040 Pre-School Education 802,292 756,600 802,700 828,100 856,200 Special Education 1,336,184 1,464,900 1,447,200 1,531,900 1,572,500 Papdale Halls of Residence 467,477 462,500 496,700 509,400 523,300 Development Projects (33,235) 0 0 400 400 Administration 1,044,042 1,160,800 1,257,200 1,292,600 1,330,500 Further Education 236,675 232,200 250,900 254,800 258,600 School Meals 590,700 756,400 739,700 752,700 770,100 School Transport 1,431,521 1,370,000 1,518,100 1,538,100 1,558,200 School Houses and Garages 13,894 (6,700) (6,000) (5,100) (4,400) Pre-School Playgroups 6,070 7,200 7,200 7,400 7,500 Miscellaneous Grants 41,638 32,000 32,400 32,900 33,200 School Boards 7,074 10,000 10,100 10,200 10,400
Net Expenditure
17 RECREATION AND CULTURAL SERVICES
22,551,555 22,275,400 23,167,000 23,821,200 24,490,500
Administration 305,216 321,900 288,400 297,200 307,000 Parks and Play Areas 341,647 329,500 335,400 341,500 347,800 Tourism - Caravan Sites 22,286 4,200 3,000 2,700 2,700 Tourism - Hostels 10,957 7,400 7,500 7,500 7,600 Sports Facilities 3,524 10,000 2,800 3,000 3,100 Swimming Pools 321,358 273,900 291,400 298,200 306,200 Theatres 13,669 27,900 28,200 28,700 28,900 Active Schools 0 0 0 0 0 Community Education 551,351 636,000 604,400 620,100 637,600 Adult Education 145,882 137,100 133,300 137,100 141,000 Heritage Development 37,549 71,400 69,100 71,100 73,400 Museums 376,782 327,800 335,200 338,200 347,600 Libraries 775,467 772,700 792,600 810,900 830,900 Social Inclusion Partnership 0 0 0 0 0 Archaeology 28,702 32,400 33,000 33,700 34,300 Orkney Bio-diversity 14,256 0 0 0 0 St Magnus Cathedral 147,594 152,900 156,600 160,200 163,800
Net Expenditure
19-20 COMMUNITY SOCIAL SERVICES
3,096,240 3,105,100 3,080,900 3,150,100 3,231,900
Administration 1,906,906 2,006,728 2,194,000 2,171,600 2,229,000 Childcare 1,367,614 1,555,700 1,559,400 1,649,700 1,733,400 Elderly - Residential 2,104,831 2,090,900 3,091,300 3,151,800 3,220,500 Elderly - Community 436,634 367,700 331,500 335,600 339,700 Elderly - Day Centres 242,176 222,200 217,500 223,600 230,200 Disability 1,023,095 952,700 965,000 990,800 1,019,800 Mental Health 3,013 104,600 109,600 114,300 119,700 Other Community Care 362,536 330,400 472,700 417,300 432,400 Occupational Therapy 288,288 283,600 278,000 284,800 292,700 Home Care 1,813,056 1,618,572 1,494,700 1,544,900 1,601,600 Criminal Justice (58,931) (26,300) (17,500) (10,200) (1,900) Childrens Panel 51,077 48,300 49,200 49,900 50,800 Resource Transfer 40,038 0 0 0 0
Net Expenditure 9,580,334 9,555,100 10,745,400 10,924,100 11,267,900
Budget Book 2005-06 to 2007-08 18

GENERAL FUND SUMMARY
23 LAW, ORDER AND PROTECTIVE SERVICES
Probable Outturn 2004/05
£'s
Approved Budget 2004/05
£'s
Approved Budget 2005/06
£'s
Provisional Estimate 2006/07
£'s
Provisional Estimate 2007/08
£'s
Police Requisition 1,412,557 1,345,700 1,542,000 1,560,600 1,579,300 Fire Requisition 1,170,372 1,416,600 1,422,100 1,437,200 1,452,300 School Crossing Patrol 68,239 61,500 63,900 65,800 67,900 Civil Protection 107,279 109,500 113,200 116,600 120,400
Net Expenditure
24-26 ROADS
2,758,447 2,933,300 3,141,200 3,180,200 3,219,900
Structural Maintenance 2,137,300 2,681,400 2,750,600 2,808,500 2,873,200 Routine Maintenance 415,000 441,300 452,300 462,100 472,700 Winter Maintenance and Response 755,000 746,200 765,400 781,700 799,700 Highway Lighting 280,504 160,000 163,600 166,800 170,200 Car Parks 42,849 37,300 37,800 37,800 38,000 Other Works 75,370 80,000 66,600 68,300 69,500 Traffic Management 44,740 38,200 38,200 38,900 39,100 Miscellaneous (12,331) 10,200 20,100 30,400 41,000
Net Expenditure
27 TRANSPORTATION
3,738,432 4,194,600 4,294,600 4,394,500 4,503,400
Administration 74,003 100,800 77,100 78,900 81,100 Co-ordination 53,055 40,100 51,400 51,900 52,300 Concessionary Fares 92,647 125,300 101,700 103,200 104,600 Support for Operators - Bus 259,824 281,400 285,200 288,800 292,600 Support for Operators - Other 3,578 5,100 5,200 5,200 5,300 Support for Operators - Air 99,219 147,900 461,700 467,600 473,600 Support for Operators - Ferries 8,788 0 10,000 10,000 10,000 Airfields 241,747 211,700 272,200 275,900 279,700 Orkney Ferries 5,124,493 4,965,000 5,257,700 5,504,600 5,838,900 Rural Transport Initiative (261,000) (229,000) (275,000) (275,000) (275,000)
Net Expenditure
28-29 ENVIRONMENTAL SERVICES
5,696,354 5,648,300 6,247,200 6,511,100 6,863,100
Burial Grounds 181,779 169,600 173,900 177,500 181,300 Refuse Collection 493,824 477,600 427,200 440,000 454,300 Landfill and Civic Amenity Sites 291,160 303,800 313,500 316,400 320,100 Waste Disposal 853,062 951,200 896,600 909,900 923,300 Recycling 20,665 58,000 58,900 59,800 60,700 Environmental Cleansing 488,330 474,200 486,500 496,900 508,500 Strategic Waste Fund 0 0 0 0 0 Administration 451,458 433,600 451,400 472,700 492,700 Trading Standards 159,806 195,400 179,300 184,300 189,700 Public Toilets 107,112 94,400 95,700 97,100 98,300 Food 24,763 37,900 38,800 39,800 40,800 Contaminated Land 666 0 0 0 0 Animals 980 7,300 7,400 7,400 7,400 Health & Safety 51,800 51,800 53,600 55,500 57,400 Community Wardens 41,139 80,000 0 0 0 Miscellaneous 420 0 0 0 0
Net Expenditure
30 OTHER HOUSING
3,166,964 3,334,800 3,182,800 3,257,300 3,334,500
Homelessness Strategy 0 0 0 0 0 Homelessness 121,096 91,700 96,700 101,000 105,700 Housing Loans 7,815 8,300 8,500 8,700 9,100 Improvement and Repair Grants 63,846 59,200 60,000 61,200 62,000 Garage Lets (42,834) (54,600) (54,500) (54,300) (54,100) Miscellaneous 41,913 51,000 52,400 54,100 55,500 Housing Benefits 29,093 62,300 32,200 34,800 37,600 Mobile Home Sites (8,742) (8,000) (8,000) (8,000) (8,000) HMO Registration 0 0 0 0 0
Net Expenditure
33 ECONOMIC DEVELOPMENT
212,187 209,900 187,300 197,500 207,800
Administration 334,468 318,300 331,100 341,900 354,000 EEC Expenditure 14,366 16,300 16,600 16,600 16,900 Tourism 201,000 201,000 206,500 210,300 214,400 Miscellaneous 1,337 8,100 8,200 8,300 8,400 Energy Advice Centre 56,924 14,300 18,500 21,800 25,700
Net Expenditure 608,095 558,000 580,900 598,900 619,400
Budget Book 2005-06 to 2007-08 19

GENERAL FUND SUMMARY
34 PLANNING
Probable Outturn 2004/05
£'s
Approved Budget 2004/05
£'s
Approved Budget 2005/06
£'s
Provisional Estimate 2006/07
£'s
Provisional Estimate 2007/08
£'s
Administration 180,134 199,700 206,700 213,200 219,800 Development Control 18,742 52,800 55,400 56,700 58,400 Development Planning 142,992 146,600 151,400 155,200 159,800 Conservation 66,461 116,800 88,500 90,000 91,800 Building Standards (93,060) (39,400) (14,100) (19,700) (16,400) Access to the Countryside 5,535 7,900 7,900 7,900 7,900 Bio-Diversity 19,968 22,000 22,000 22,000 22,000 Other Expenditure 6,165 7,000 7,200 7,400 7,700 Town and Country Improvements 72,745 87,600 89,300 91,000 92,800
Net Expenditure
32, 39 OTHER SERVICES
419,682 601,000 614,300 623,700 643,800
Creation of Employment Opportunities 189,705 176,800 181,700 187,200 192,600 Registration of Births, Deaths and Marriages 19,255 22,200 23,100 23,600 24,300 Miscellaneous Property (908) 8,400 9,000 9,600 10,200 Payments to Joint Boards 252,000 252,000 255,300 258,600 262,000 Elections 2,250 11,200 11,400 11,400 11,600 Licensing 50,748 54,000 56,000 58,100 60,300 Subscriptions and Grants 2,823 5,100 5,200 5,200 5,300 Publicity 8,417 11,100 11,200 11,400 11,500 Twinning 8,712 16,100 9,400 9,900 10,200 Community Councils 237,475 241,000 248,400 254,900 261,700 Oil Pollution 16,000 16,000 16,200 16,400 16,600 Transfers from Other Accounts (182,100) (200,000) 0 0 0 Interest on Loans and Balances (175,295) (175,000) (175,000) (175,000) (175,000) Miscellaneous 22,694 33,500 11,300 11,800 12,200 Council Tax Benefits 0 0 20,000 20,000 20,000 Cost of Collection 0 0 192,000 192,000 192,000 Finance Charges 2,105,000 2,135,000 3,135,000 3,135,000 3,135,000
2,556,776 2,607,400 4,010,200 4,030,100 4,050,500
Budget Book 2005-06 to 2007-08 20

CENTRAL ADMINISTRATION
10A CHIEF EXECUTIVE
Probable Outturn 2004/05
£'s
Approved Budget 2004/05
£'s
Approved Budget 2005/06
£'s
Provisional Estimate 2006/07
£'s
Provisional Estimate 2007/08
£'s
Staff Costs 179,118 183,300 190,500 196,300 202,600 Other Staff Costs 1,076 0 0 0 0 Supplies and Services 6,377 8,200 8,300 8,400 8,500 Transport Costs 14,386 15,400 15,600 15,800 16,000 Administration Costs 10,446 13,400 13,600 13,800 13,900 Apportioned Costs 55,900 55,900 57,900 59,900 62,000 Third Party Payments 844 2,000 2,000 2,100 2,100
Total Expenditure 268,147 278,200 287,900 296,300 305,100 Apportioned Income (268,147) (278,200) (287,900) (296,300) (305,100)
Total Income (268,147) (278,200) (287,900) (296,300) (305,100)
Net Expenditure
10B ADMINISTRATION
0 0 0 0 0
Staff Costs 1,558,082 1,580,700 1,643,000 1,692,600 1,747,400 Other Staff Costs 21,702 0 0 0 0 Property Costs 6,210 8,100 8,200 8,300 8,400 Supplies and Services 140,872 109,900 146,500 149,500 152,200 Transport Costs 47,691 26,300 26,600 26,900 27,300 Administration Costs 123,623 60,700 61,500 62,400 63,200 Apportioned Costs 63,100 63,100 65,300 67,600 70,000 Third Party Payments 21,312 3,000 10,000 11,100 12,000 Miscellaneous Expenditure 97 0 0 0 0
Total Expenditure 1,982,689 1,851,800 1,961,100 2,018,400 2,080,500 Other Grants & Reimbursements (145,716) (143,716) (143,700) (143,700) (143,700) Fees & Charges (21,268) 0 0 0 0 Apportioned Income (1,815,543) (1,708,084) (1,817,400) (1,874,700) (1,936,800) Miscellaneous Income (162) 0 0 0 0
Total Income (1,982,689) (1,851,800) (1,961,100) (2,018,400) (2,080,500)
Net Expenditure
10C FINANCE
0 0 0 0 0
Staff Costs 1,038,546 1,062,800 1,114,100 1,147,500 1,184,900 Other Staff Costs 1,931 0 0 0 0 Property Costs 17 2,600 2,600 2,700 2,700 Supplies and Services 229,435 247,400 278,500 251,800 254,900 Transport Costs 26,802 29,200 24,400 24,900 25,100 Administration Costs 75,182 88,000 82,000 83,100 84,200 Apportioned Costs 97,300 97,300 103,700 100,300 104,000 Third Party Payments 21,290 26,700 27,000 22,100 22,500
Total Expenditure 1,490,503 1,554,000 1,632,300 1,632,400 1,678,300 Government Grants (14,000) (14,000) (5,000) (5,000) (5,000) Other Grants & Reimbursements (27,913) (25,400) (19,200) (19,200) (19,200) Fees & Charges (4,302) (2,500) (2,600) (2,600) (2,700) Apportioned Income (1,431,267) (1,511,500) (1,604,900) (1,605,000) (1,650,800) Miscellaneous Income (13,021) (600) (600) (600) (600)
Total Income (1,490,503) (1,554,000) (1,632,300) (1,632,400) (1,678,300)
Net Expenditure
10D TECHNICAL SERVICES
0 0 0 0 0
Staff Costs 1,664,912 1,760,000 1,829,500 1,884,600 1,945,700 Other Staff Costs 13,538 0 0 0 0 Property Costs 337 0 0 0 0 Supplies and Services 218,460 200,200 202,800 205,500 208,100 Transport Costs 81,523 89,800 91,000 92,200 93,300 Administration Costs 82,773 63,000 63,800 64,600 65,400 Apportioned Costs 186,300 186,300 192,800 199,600 206,500 Third Party Payments 5,554 2,000 2,000 2,100 2,100
Total Expenditure 2,253,397 2,301,300 2,381,900 2,448,600 2,521,100 Government Grants (57,700) 0 0 0 0 Fees & Charges (67,076) (93,400) (96,100) (99,100) (102,100) Apportioned Income (2,120,771) (2,207,900) (2,285,800) (2,349,500) (2,419,000) Miscellaneous Income (7,850) 0 0 0 0
Total Income (2,253,397) (2,301,300) (2,381,900) (2,448,600) (2,521,100)
Net Expenditure 0 0 0 0 0
Budget Book 2005-06 to 2007-08 21

CENTRAL ADMINISTRATION
10F ADMINISTRATION OF BUILDINGS
Probable Outturn 2004/05
£'s
Approved Budget 2004/05
£'s
Approved Budget 2005/06
£'s
Provisional Estimate 2006/07
£'s
Provisional Estimate 2007/08
£'s
Staff Costs 56,383 49,600 51,600 53,100 54,800 Other Staff Costs 125 0 0 0 0 Property Costs 415,704 411,300 418,500 425,300 432,300 Supplies and Services 73,416 29,700 30,100 30,500 30,900 Transport Costs 1,169 0 0 0 0 Administration Costs 24,807 1,000 1,000 1,000 1,000 Apportioned Costs 26,900 26,900 27,800 28,800 29,800 Third Party Payments 5,221 0 0 0 0
Total Expenditure 603,725 518,500 529,000 538,700 548,800 Rents & Lettings (660) 0 0 0 0 Fees & Charges (3) 0 0 0 0 Apportioned Income (602,958) (518,500) (529,000) (538,700) (548,800) Miscellaneous Income (104) 0 0 0 0
Total Income (603,725) (518,500) (529,000) (538,700) (548,800)
Net Expenditure
10G CORPORATE MANAGEMENT
0 0 0 0 0
Staff Costs 412,574 431,200 427,500 392,500 404,400 Other Staff Costs 475 0 0 0 0 Property Costs 3,121 10,000 5,000 0 0 Supplies and Services 215,682 194,400 201,800 212,600 214,500 Transport Costs 67,122 67,000 65,300 63,600 64,400 Administration Costs 40,989 35,900 47,800 44,600 45,000 Apportioned Costs 1,346,700 1,346,700 1,107,000 1,126,300 1,179,000 Third Party Payments 80,471 108,900 105,200 101,500 102,800
Total Expenditure 2,167,134 2,194,100 1,959,600 1,941,100 2,010,100 Government Grants (141,448) (137,500) (70,500) 0 0 Other Grants & Reimbursements (27,230) (8,900) (8,900) (8,900) (8,900)
Total Income (168,678) (146,400) (79,400) (8,900) (8,900)
Net Expenditure
10H HOLDING ACCOUNTS
1,998,456 2,047,700 1,880,200 1,932,200 2,001,200
Property Costs 775 4,700 4,800 4,800 4,900 Administration Costs 1,056,792 846,300 857,400 868,400 879,700 Apportioned Costs 33,000 33,000 34,200 35,300 36,600 Third Party Payments 10 0 0 0 0
Total Expenditure 1,090,577 884,000 896,400 908,500 921,200 Sales (3,085) (18,700) (18,800) (18,800) (18,900) Fees & Charges (1,087,492) (865,300) (877,600) (889,700) (902,300)
Total Income (1,090,577) (884,000) (896,400) (908,500) (921,200)
Net Expenditure
10I LEGAL SERVICES
0 0 0 0 0
Staff Costs 292,873 307,800 321,300 332,200 344,200 Other Staff Costs 3,045 0 0 0 0 Supplies and Services 20,864 34,300 33,400 32,600 31,700 Transport Costs 6,668 9,400 9,500 9,600 9,700 Administration Costs 21,095 18,200 18,500 18,700 18,900 Apportioned Costs 150,100 150,100 155,400 160,800 166,400 Third Party Payments 958 5,500 5,600 5,600 5,800
Total Expenditure 495,603 525,300 543,700 559,500 576,700 Fees & Charges (14,463) (39,100) (9,000) (9,000) (9,000) Apportioned Income (481,140) (486,200) (534,700) (550,500) (567,700)
Total Income (495,603) (525,300) (543,700) (559,500) (576,700)
Net Expenditure 0 0 0 0 0
Budget Book 2005-06 to 2007-08 22

CENTRAL ADMINISTRATION
10J CORPORATE PRIORITIES
Probable Outturn 2004/05
£'s
Approved Budget 2004/05
£'s
Approved Budget 2005/06
£'s
Provisional Estimate 2006/07
£'s
Provisional Estimate 2007/08
£'s
Staff Costs 0 0 200,000 200,000 200,000 Supplies and Services 19,724 20,000 0 0 0 Administration Costs 15,412 25,000 75,000 150,000 150,000 Third Party Payments 45,000 45,000 382,000 432,000 432,000 Transfer Payments 0 0 80,000 80,000 80,000
Total Expenditure 80,137 90,000 737,000 862,000 862,000 Other Grants & Reimbursements (67,500) (65,000) (130,000) (130,000) (130,000)
Total Income (67,500) (65,000) (130,000) (130,000) (130,000)
Net Expenditure
SERVICE AREA SUMMARY
12,637 25,000 607,000 732,000 732,000
Staff Costs 5,202,488 5,375,400 5,777,500 5,898,800 6,084,000 Other Staff Costs 41,892 0 0 0 0 Property Costs 426,164 436,700 439,100 441,100 448,300 Supplies and Services 924,830 844,100 901,400 890,900 900,800 Transport Costs 245,361 237,100 232,400 233,000 235,800 Administration Costs 1,451,119 1,151,500 1,220,600 1,306,600 1,321,300 Apportioned Costs 1,959,300 1,959,300 1,744,100 1,778,600 1,854,300 Third Party Payments 180,660 193,100 533,800 576,500 579,300 Transfer Payments 0 0 80,000 80,000 80,000 Miscellaneous Expenditure 97 0 0 0 0
Total Expenditure 10,431,912 10,197,200 10,928,900 11,205,500 11,503,800 Government Grants (213,148) (151,500) (75,500) (5,000) (5,000) Other Grants & Reimbursements (268,359) (243,016) (301,800) (301,800) (301,800) Rents & Lettings (660) 0 0 0 0 Sales (3,085) (18,700) (18,800) (18,800) (18,900) Fees & Charges (1,194,604) (1,000,300) (985,300) (1,000,400) (1,016,100) Apportioned Income (6,719,826) (6,710,384) (7,059,700) (7,214,700) (7,428,200) Miscellaneous Income (21,137) (600) (600) (600) (600)
Total Income (8,420,819) (8,124,500) (8,441,700) (8,541,300) (8,770,600)
Net Expenditure 2,011,093 2,072,700 2,487,200 2,664,200 2,733,200
Budget Book 2005-06 to 2007-08 23

EDUCATION
11AB SENIOR SECONDARY SCHOOLS
Probable Outturn 2004/05
£'s
Approved Budget 2004/05
£'s
Approved Budget 2005/06
£'s
Provisional Estimate 2006/07
£'s
Provisional Estimate 2007/08
£'s
Staff Costs 5,620,318 5,549,500 5,789,400 5,962,500 6,155,500 Other Staff Costs 227,105 102,000 103,200 104,700 106,100 Property Costs 1,024,643 989,300 1,009,160 1,026,860 1,045,860 Supplies and Services 200,805 155,000 157,000 159,100 161,100 Transport Costs 65,551 48,300 49,000 49,400 50,200 Administration Costs 60,751 40,500 41,000 41,600 42,000 Apportioned Costs 14,500 14,500 15,100 15,500 16,100 Third Party Payments 89,025 82,000 83,200 84,100 85,300 Miscellaneous Expenditure 189 0 0 0 0
Total Expenditure 7,302,887 6,981,100 7,247,060 7,443,760 7,662,160 Government Grants (77,856) (96,600) (98,400) (99,800) (101,400) Other Grants & Reimbursements (28,297) 0 0 0 0 Rents & Lettings (16,207) (16,000) (16,000) (16,000) (16,000) Sales (2,066) 0 0 0 0 Fees & Charges (1,285) (3,000) (3,100) (3,100) (3,200) Miscellaneous Income (9,186) (8,100) (8,100) (8,100) (8,100)
Total Income (134,897) (123,700) (125,600) (127,000) (128,700)
12AE
Net Expenditure
JUNIOR SECONDARY SCHOOLS
7,167,990 6,857,400 7,121,460 7,316,760 7,533,460
Staff Costs 1,639,171 1,643,700 1,732,900 1,784,100 1,841,400 Other Staff Costs 40,075 30,700 31,100 31,400 31,900 Property Costs 279,881 340,500 346,100 351,300 356,800 Supplies and Services 46,024 56,000 56,500 57,400 58,100 Transport Costs 93,087 85,700 86,600 87,600 89,100 Administration Costs 18,948 23,300 23,300 23,700 23,800 Apportioned Costs 9,300 9,300 9,700 10,100 10,400 Third Party Payments 10,332 6,100 6,100 6,300 6,300 Miscellaneous Expenditure 139 0 0 0 0
Total Expenditure 2,136,957 2,195,300 2,292,300 2,351,900 2,417,800 Government Grants (8,375) (14,300) (14,300) (14,300) (14,300) Other Grants & Reimbursements (4,884) 0 (24,000) (24,000) (24,000) Rents & Lettings (9,227) (9,000) (9,000) (9,000) (9,000) Sales (515) 0 0 0 0 Miscellaneous Income (19,739) (5,000) (5,000) (5,000) (5,000)
Total Income (42,740) (28,300) (52,300) (52,300) (52,300)
13AV
Net Expenditure
PRIMARY SCHOOLS
2,094,217 2,167,000 2,240,000 2,299,600 2,365,500
Staff Costs 5,881,691 5,752,900 6,076,400 6,255,500 6,455,500 Other Staff Costs 152,585 82,100 83,000 84,200 85,200 Property Costs 1,133,018 1,017,700 1,037,240 1,054,440 1,073,040 Supplies and Services 157,034 152,300 154,200 155,900 158,100 Transport Costs 82,516 59,400 59,400 60,200 61,000 Administration Costs 45,937 47,400 47,600 47,800 48,700 Apportioned Costs 21,700 21,700 21,900 23,700 23,800 Third Party Payments 20,873 15,200 15,200 15,400 15,400 Transfer Payments 9,932 0 0 0 0 Miscellaneous Expenditure 510 0 0 0 0
Total Expenditure 7,505,796 7,148,700 7,494,940 7,697,140 7,920,740 Government Grants (89,328) (91,700) (91,700) (91,700) (91,700) Other Grants & Reimbursements (14,227) 0 (102,000) (102,000) (102,000) Rents & Lettings (24,753) (25,000) (25,000) (25,000) (25,000) Sales (366) 0 0 0 0 Fees & Charges (1,278) (1,900) (1,900) (2,000) (2,000) Apportioned Income (3,379) 0 0 0 0 Miscellaneous Income (27,449) (25,000) (25,000) (25,000) (25,000)
Total Income (160,780) (143,600) (245,600) (245,700) (245,700)
Net Expenditure 7,345,016 7,005,100 7,249,340 7,451,440 7,675,040
Budget Book 2005-06 to 2007-08 24

EDUCATION
14AB PRE-SCHOOL EDUCATION
Probable Outturn 2004/05
£'s
Approved Budget 2004/05
£'s
Approved Budget 2005/06
£'s
Provisional Estimate 2006/07
£'s
Provisional Estimate 2007/08
£'s
Staff Costs 731,864 669,500 713,400 737,500 763,900 Other Staff Costs 226 0 0 0 0 Property Costs 272 0 0 0 0 Supplies and Services 7,461 16,200 16,500 16,600 16,800 Transport Costs 2,550 1,000 1,000 1,000 1,000 Administration Costs 2,842 5,100 5,200 5,200 5,300 Third Party Payments 1,455 0 0 0 0 Transfer Payments 58,934 64,800 66,600 67,800 69,200 Miscellaneous Expenditure 47 0 0 0 0
Total Expenditure 805,651 756,600 802,700 828,100 856,200 Government Grants (3,359) 0 0 0 0
Total Income (3,359) 0 0 0 0
Net Expenditure
14FI SPECIAL EDUCATION
802,292 756,600 802,700 828,100 856,200
Staff Costs 1,065,761 1,099,000 1,095,400 1,139,400 1,177,000 Other Staff Costs 7,331 200 200 200 200 Property Costs 824 400 400 400 400 Supplies and Services 25,438 21,100 21,400 21,700 22,000 Transport Costs 133,364 103,900 105,200 106,600 108,000 Administration Costs 30,889 49,900 50,600 51,100 51,900 Third Party Payments 220,905 369,500 324,300 366,800 372,100 Transfer Payments 31,500 36,000 37,000 37,600 38,400 Miscellaneous Expenditure 12 3,500 3,500 3,600 3,600
Total Expenditure 1,516,024 1,683,500 1,638,000 1,727,400 1,773,600 Government Grants (171,355) (218,600) (180,800) (185,500) (191,100) Other Grants & Reimbursements (7,327) 0 (10,000) (10,000) (10,000) Miscellaneous Income (1,158) 0 0 0 0
Total Income (179,840) (218,600) (190,800) (195,500) (201,100)
Net Expenditure
14J PAPDALE HALLS OF RESIDENCE
1,336,184 1,464,900 1,447,200 1,531,900 1,572,500
Staff Costs 332,220 335,300 348,500 359,000 370,700 Other Staff Costs 2,790 5,500 5,600 5,600 5,700 Property Costs 82,175 63,400 64,200 65,100 65,900 Supplies and Services 32,668 36,700 37,200 37,700 38,100 Transport Costs 12,717 16,000 16,200 16,400 16,600 Administration Costs 6,279 4,000 9,200 9,200 9,400 Apportioned Costs 11,400 11,400 11,800 12,200 12,600 Third Party Payments 800 0 13,800 14,000 14,100 Miscellaneous Expenditure (2,433) 2,300 2,300 2,400 2,400
Total Expenditure 478,616 474,600 508,800 521,600 535,500 Other Grants & Reimbursements (800) 0 0 0 0 Rents & Lettings (9,300) (10,100) (10,100) (10,100) (10,100) Sales (5) 0 0 0 0 Fees & Charges (542) (1,000) (1,000) (1,100) (1,100) Miscellaneous Income (492) (1,000) (1,000) (1,000) (1,000)
Total Income (11,139) (12,100) (12,100) (12,200) (12,200)
Net Expenditure 467,477 462,500 496,700 509,400 523,300
Budget Book 2005-06 to 2007-08 25

EDUCATION
14N DEVELOPMENT PROJECTS
Probable Outturn 2004/05
£'s
Approved Budget 2004/05
£'s
Approved Budget 2005/06
£'s
Provisional Estimate 2006/07
£'s
Provisional Estimate 2007/08
£'s
Staff Costs 61,858 56,500 375,200 376,800 378,800 Other Staff Costs 90 0 0 0 0 Supplies and Services 20,951 16,500 169,600 170,100 170,200 Transport Costs 10,555 12,800 48,000 48,500 48,500 Administration Costs 4,111 9,000 199,000 199,200 199,200 Apportioned Costs 0 0 0 0 Third Party Payments 19,000 8,800 28,000 28,300 28,300 Transfer Payments 9,000 0 0 0 0
Total Expenditure 125,565 103,600 819,800 822,900 825,000 Government Grants (66,063) (50,900) (716,000) (717,300) (718,300) Other Grants & Reimbursements (77,810) (40,800) (91,700) (92,900) (93,900) Sales (70) 0 0 0 0 Fees & Charges (3,324) 0 0 0 0 Miscellaneous Income (11,533) (11,900) (12,100) (12,300) (12,400)
Total Income (158,800) (103,600) (819,800) (822,500) (824,600)
Net Expenditure
15A ADMINISTRATION
(33,235) 0 0 400 400
Staff Costs 812,249 766,300 662,200 683,800 707,800 Other Staff Costs 45,046 34,800 36,700 37,200 37,700 Property Costs 26,551 25,000 25,400 25,700 26,000 Supplies and Services 135,915 157,500 48,100 49,900 51,500 Transport Costs 87,706 65,600 39,100 39,900 40,700 Administration Costs 292,270 233,000 167,000 169,400 172,300 Apportioned Costs 391,200 391,200 406,100 420,300 434,900 Third Party Payments 115,268 59,900 16,100 17,100 17,800 Miscellaneous Expenditure 374 0 0 0 0
Total Expenditure 1,906,579 1,733,300 1,400,700 1,443,300 1,488,700 Government Grants (673,817) (395,100) (43,700) (49,100) (55,000) Other Grants & Reimbursements (134,547) (123,900) (46,200) (47,800) (49,300) Rents & Lettings (854) (1,100) (1,100) (1,100) (1,100) Fees & Charges (709) (400) (400) (400) (400) Miscellaneous Income (52,610) (52,000) (52,100) (52,300) (52,400)
Total Income (862,537) (572,500) (143,500) (150,700) (158,200)
Net Expenditure
15B FURTHER EDUCATION
1,044,042 1,160,800 1,257,200 1,292,600 1,330,500
Staff Costs 17,048 18,000 18,700 19,300 19,900 Supplies and Services 331 0 0 0 0 Transport Costs 403 0 0 0 0 Administration Costs 452 0 0 0 0 Third Party Payments 14,000 7,000 7,100 7,200 7,300 Transfer Payments 261,461 244,200 237,300 240,600 243,900
Total Expenditure 293,695 269,200 263,100 267,100 271,100 Government Grants (57,020) (37,000) (12,200) (12,300) (12,500)
Total Income (57,020) (37,000) (12,200) (12,300) (12,500)
Net Expenditure
15DE SCHOOL MEALS
236,675 232,200 250,900 254,800 258,600
Staff Costs 50 0 767,500 767,500 767,500 Other Staff Costs 83 0 1,300 1,300 1,300 Property Costs 13,413 8,600 24,500 24,500 24,600 Supplies and Services 10,053 9,600 433,400 433,600 433,700 Transport Costs 954 0 9,100 9,100 9,100 Administration Costs 3,937 5,000 17,500 17,500 17,600 Third Party Payments 1,010,977 1,156,200 6,800 32,900 63,300
Total Expenditure 1,039,467 1,179,400 1,274,900 1,301,200 1,331,900 Government Grants 0 0 (1,900) (1,900) (1,900) Other Grants & Reimbursements (15,046) 0 (2,300) (2,300) (2,300) Sales (430,648) (423,000) (438,300) (451,600) (464,900) Interest & Loans (3,073) 0 0 0 0 Miscellaneous Income 0 0 (92,700) (92,700) (92,700)
Total Income (448,767) (423,000) (535,200) (548,500) (561,800)
Net Expenditure 590,700 756,400 739,700 752,700 770,100
Budget Book 2005-06 to 2007-08 26

EDUCATION
15F SCHOOL TRANSPORT
Probable Outturn 2004/05
£'s
Approved Budget 2004/05
£'s
Approved Budget 2005/06
£'s
Provisional Estimate 2006/07
£'s
Provisional Estimate 2007/08
£'s
Other Staff Costs 240 200 200 200 200 Property Costs 1,091 0 0 0 0 Supplies and Services 0 1,000 1,000 1,000 1,000 Transport Costs 1,419,753 1,358,300 1,506,100 1,525,700 1,545,500 Administration Costs 1,283 2,000 2,000 2,100 2,100 Apportioned Costs 8,300 8,300 8,600 8,900 9,200 Third Party Payments 145 200 200 200 200 Transfer Payments 709 0 0 0 0
Net Expenditure
15J SCHOOL HOUSES AND GARAGES
1,431,521 1,370,000 1,518,100 1,538,100 1,558,200
Staff Costs 198 200 200 200 200 Property Costs 58,322 52,400 53,100 53,800 54,500 Supplies and Services 429 0 0 0 0 Administration Costs 324 200 200 200 200 Apportioned Costs 2,100 2,100 2,100 2,300 2,300 Third Party Payments 2,629 800 800 800 800
Total Expenditure 64,002 55,700 56,400 57,300 58,000 Rents & Lettings (50,108) (62,400) (62,400) (62,400) (62,400)
Total Income (50,108) (62,400) (62,400) (62,400) (62,400)
Net Expenditure
15N PRE-SCHOOL PLAYGROUPS
13,894 (6,700) (6,000) (5,100) (4,400)
Property Costs 4,848 4,200 4,200 4,300 4,400 Supplies and Services 28 0 0 0 0 Third Party Payments 1,194 3,000 3,000 3,100 3,100
Net Expenditure
15S MISCELLANEOUS GRANTS
6,070 7,200 7,200 7,400 7,500
Third Party Payments 41,638 32,000 32,400 32,900 33,200
Net Expenditure
16A SCHOOL BOARDS
41,638 32,000 32,400 32,900 33,200
Staff Costs 2,069 0 0 0 0 Other Staff Costs 1,076 0 0 0 0 Supplies and Services 515 1,000 1,000 1,000 1,000 Transport Costs 260 0 0 0 0 Administration Costs 3,472 8,900 9,000 9,100 9,300 Third Party Payments 222 100 100 100 100
Total Expenditure 7,614 10,000 10,100 10,200 10,400 Miscellaneous Income (540) 0 0 0 0
Total Income (540) 0 0 0 0
Net Expenditure
SERVICE AREA SUMMARY
7,074 10,000 10,100 10,200 10,400
Staff Costs 16,164,497 15,890,900 17,579,800 18,085,600 18,638,200 Other Staff Costs 476,647 255,500 261,300 264,800 268,300 Property Costs 2,625,038 2,501,500 2,564,300 2,606,400 2,651,500 Supplies and Services 637,652 622,900 1,095,900 1,104,000 1,111,600 Transport Costs 1,909,416 1,751,000 1,919,700 1,944,400 1,969,700 Administration Costs 471,495 428,300 571,600 576,100 581,800 Apportioned Costs 458,500 458,500 490,100 507,800 524,100 Third Party Payments 1,548,463 1,740,800 537,100 609,200 647,300 Transfer Payments 371,536 345,000 340,900 346,000 351,500 Miscellaneous Expenditure (1,162) 5,800 5,800 6,000 6,000
Total Expenditure 24,662,082 24,000,200 25,366,500 26,050,300 26,750,000 Government Grants (1,147,173) (904,200) (1,159,000) (1,171,900) (1,186,200) Other Grants & Reimbursements (282,938) (164,700) (276,200) (279,000) (281,500) Rents & Lettings (110,449) (123,600) (123,600) (123,600) (123,600) Sales (433,670) (423,000) (438,300) (451,600) (464,900) Interest & Loans (3,073) 0 0 0 0 Fees & Charges (7,138) (6,300) (6,400) (6,600) (6,700) Apportioned Income (3,379) 0 0 0 0 Miscellaneous Income (122,707) (103,000) (196,000) (196,400) (196,600)
Total Income (2,110,527) (1,724,800) (2,199,500) (2,229,100) (2,259,500)
Net Expenditure 22,551,555 22,275,400 23,167,000 23,821,200 24,490,500
Budget Book 2005-06 to 2007-08 27

RECREATION AND CULTURAL SERVICES
17A ADMINISTRATION
Probable Outturn 2004/05
£'s
Approved Budget 2004/05
£'s
Approved Budget 2005/06
£'s
Provisional Estimate 2006/07
£'s
Provisional Estimate 2007/08
£'s
Staff Costs 180,777 182,600 189,500 194,900 200,900 Other Staff Costs 55 0 0 0 0 Property Costs 8 0 0 0 0 Supplies and Services 6,521 500 500 500 500 Transport Costs 7,269 8,900 9,100 9,100 9,300 Administration Costs 19,268 17,400 17,700 17,900 18,100 Apportioned Costs 72,500 72,500 75,000 77,700 80,400 Third Party Payments 49,271 69,200 31,400 31,800 32,200 Transfer Payments 14,583 18,000 12,400 12,500 12,800 Miscellaneous Expenditure 500 500 500 500 500
Total Expenditure 350,752 369,600 336,100 344,900 354,700 Other Grants & Reimbursements (37,700) (37,700) (37,700) (37,700) (37,700) Fees & Charges (5) 0 0 0 0 Miscellaneous Income (7,831) (10,000) (10,000) (10,000) (10,000)
Total Income (45,536) (47,700) (47,700) (47,700) (47,700)
Net Expenditure
17C PARKS AND PLAY AREAS
305,216 321,900 288,400 297,200 307,000
Staff Costs 1,212 800 800 900 900 Other Staff Costs 131 0 0 0 0 Property Costs 38,800 58,000 58,600 59,300 60,000 Supplies and Services 101,028 84,100 85,200 86,300 87,400 Transport Costs 6,063 1,500 1,500 1,500 1,600 Administration Costs 2,211 300 300 300 300 Apportioned Costs 43,500 43,500 45,100 46,600 48,300 Third Party Payments 218,543 218,000 220,800 223,800 226,700
Total Expenditure 411,488 406,200 412,300 418,700 425,200 Other Grants & Reimbursements (68,000) (68,000) (68,000) (68,000) (68,000) Rents & Lettings (371) (1,000) (1,000) (1,000) (1,000) Fees & Charges (823) (7,700) (7,900) (8,200) (8,400) Miscellaneous Income (647) 0 0 0 0
Total Income (69,841) (76,700) (76,900) (77,200) (77,400)
Net Expenditure
17E TOURISM - CARAVAN SITES
341,647 329,500 335,400 341,500 347,800
Staff Costs 8,207 4,900 5,100 5,200 5,400 Property Costs 34,806 9,900 8,800 8,900 9,000 Supplies and Services 872 600 600 600 600 Administration Costs 1,044 800 800 800 800 Third Party Payments 1,725 1,400 1,400 1,400 1,500
Total Expenditure 46,654 17,600 16,700 16,900 17,300 Fees & Charges (24,368) (13,400) (13,700) (14,200) (14,600)
Total Income (24,368) (13,400) (13,700) (14,200) (14,600)
Net Expenditure
17F TOURISM - HOSTELS
22,286 4,200 3,000 2,700 2,700
Staff Costs 2,417 4,200 4,400 4,500 4,600 Other Staff Costs 163 0 0 0 0 Property Costs 11,740 6,700 6,700 6,900 6,900 Supplies and Services 1,495 300 300 300 300 Administration Costs 683 500 500 500 500 Third Party Payments 1,270 900 900 900 900
Total Expenditure 17,788 12,600 12,800 13,100 13,200 Fees & Charges (6,764) (5,200) (5,300) (5,600) (5,600) Miscellaneous Income (67) 0 0 0 0
Total Income (6,831) (5,200) (5,300) (5,600) (5,600)
Net Expenditure 10,957 7,400 7,500 7,500 7,600
Budget Book 2005-06 to 2007-08 28

RECREATION AND CULTURAL SERVICES
17J SPORTS FACILITIES
Probable Outturn 2004/05
£'s
Approved Budget 2004/05
£'s
Approved Budget 2005/06
£'s
Provisional Estimate 2006/07
£'s
Provisional Estimate 2007/08
£'s
Other Staff Costs 13 0 0 0 0 Property Costs 3,354 10,000 2,800 3,000 3,100
Total Expenditure 3,367 10,000 2,800 3,000 3,100 Rents & Lettings (5) 0 0 0 0 Miscellaneous Income 162 0 0 0 0
Total Income 157 0 0 0 0
Net Expenditure
17K SWIMMING POOLS
3,524 10,000 2,800 3,000 3,100
Staff Costs 268,833 254,500 264,500 272,500 281,400 Other Staff Costs 884 0 0 0 0 Property Costs 131,571 113,800 123,700 125,300 126,900 Supplies and Services 35,060 35,900 36,400 36,800 37,300 Transport Costs 2,589 2,000 2,000 2,000 2,100 Administration Costs 11,604 13,700 13,900 14,000 14,200 Third Party Payments 7,861 5,500 5,600 5,600 5,700 Miscellaneous Expenditure 547 0 0 0 0
Total Expenditure 458,949 425,400 446,100 456,200 467,600 Rents & Lettings (24,560) (33,700) (33,700) (33,700) (33,700) Sales (23,722) (26,600) (27,400) (28,200) (29,000) Fees & Charges (83,658) (80,900) (83,300) (85,800) (88,400) Miscellaneous Income (5,651) (10,300) (10,300) (10,300) (10,300)
Total Income (137,591) (151,500) (154,700) (158,000) (161,400)
Net Expenditure
17M THEATRES
321,358 273,900 291,400 298,200 306,200
Property Costs 11,686 21,400 21,600 22,000 22,200 Supplies and Services 28 0 0 0 0 Administration Costs 308 0 0 0 0 Third Party Payments 1,675 6,500 6,600 6,700 6,700
Total Expenditure 13,697 27,900 28,200 28,700 28,900 Rents & Lettings (28) 0 0 0 0
Total Income (28) 0 0 0 0
Net Expenditure
17N ACTIVE SCHOOLS
13,669 27,900 28,200 28,700 28,900
Staff Costs 85,000 0 211,000 211,000 211,000 Other Staff Costs 10,103 0 0 0 0 Supplies and Services 6,000 0 6,000 6,000 6,000 Transport Costs 5,000 0 20,500 20,500 20,500 Administration Costs 2,500 0 10,000 10,000 10,000 Third Party Payments 30,000 0 41,000 41,000 41,000
Total Expenditure 138,603 0 288,500 288,500 288,500 Other Grants & Reimbursements (125,489) 0 (288,500) (288,500) (288,500) Fees & Charges (12,719) 0 0 0 0 Miscellaneous Income (395) 0 0 0 0
Total Income (138,603) 0 (288,500) (288,500) (288,500)
Net Expenditure 0 0 0 0 0
Budget Book 2005-06 to 2007-08 29

RECREATION AND CULTURAL SERVICES
17P COMMUNITY EDUCATION
Probable Outturn 2004/05
£'s
Approved Budget 2004/05
£'s
Approved Budget 2005/06
£'s
Provisional Estimate 2006/07
£'s
Provisional Estimate 2007/08
£'s
Staff Costs 469,422 509,300 471,500 485,800 502,400 Other Staff Costs 7,783 3,900 3,900 4,000 4,000 Property Costs 211,530 222,200 225,900 229,500 233,200 Supplies and Services 92,471 84,700 85,700 86,900 88,000 Transport Costs 20,087 25,600 24,000 24,300 24,700 Administration Costs 21,962 23,200 23,400 23,800 24,100 Apportioned Costs 13,500 13,500 14,000 14,500 15,000 Third Party Payments 17,784 10,300 5,300 5,400 5,500 Transfer Payments 5,708 0 0 0 0 Miscellaneous Expenditure (477) 0 0 0 0
Total Expenditure 859,770 892,700 853,700 874,200 896,900 Government Grants (31,205) 0 0 0 0 Other Grants & Reimbursements (96,623) (74,900) (62,900) (63,100) (63,500) Rents & Lettings (23,710) (27,500) (27,500) (27,500) (27,500) Sales (156,099) (147,800) (152,300) (156,800) (161,500) Fees & Charges (1,569) (3,000) (3,100) (3,200) (3,300) Miscellaneous Income 787 (3,500) (3,500) (3,500) (3,500)
Total Income (308,419) (256,700) (249,300) (254,100) (259,300)
Net Expenditure
17R ADULT EDUCATION
551,351 636,000 604,400 620,100 637,600
Staff Costs 99,016 88,500 92,000 94,600 97,800 Other Staff Costs 504 0 0 0 0 Property Costs 11,254 10,000 10,100 10,300 10,400 Supplies and Services 3,287 3,300 3,300 3,400 3,400 Transport Costs 10,054 17,300 9,500 9,600 9,600 Administration Costs 8,959 7,000 7,000 7,100 7,200 Third Party Payments 9,689 6,800 6,800 7,100 7,100 Transfer Payments 79,900 79,900 80,900 82,000 83,100
Total Expenditure 222,663 212,800 209,600 214,100 218,600 Other Grants & Reimbursements (54,300) (54,300) (54,300) (54,300) (54,300) Fees & Charges (22,447) (21,400) (22,000) (22,700) (23,300) Miscellaneous Income (34) 0 0 0 0
Total Income (76,781) (75,700) (76,300) (77,000) (77,600)
Net Expenditure
17S HERITAGE DEVELOPMENT
145,882 137,100 133,300 137,100 141,000
Staff Costs 93,282 96,500 100,100 103,100 106,300 Other Staff Costs 7,597 0 0 0 0 Property Costs 677 0 0 0 0 Supplies and Services 15,191 29,000 119,700 112,000 71,400 Transport Costs 11,137 4,800 4,800 5,000 5,000 Administration Costs 10,184 12,000 12,100 12,300 12,400 Third Party Payments 8,277 15,900 11,200 11,300 11,400 Miscellaneous Expenditure 300 0 0 0 0
Total Expenditure 146,645 158,200 247,900 243,700 206,500 Government Grants (29,722) 0 0 0 0 Other Grants & Reimbursements (77,789) (81,800) (173,700) (167,400) (127,800) Sales (83) (1,000) (1,000) (1,100) (1,100) Fees & Charges (1,335) (2,000) (2,100) (2,100) (2,200) Miscellaneous Income (167) (2,000) (2,000) (2,000) (2,000)
Total Income (109,096) (86,800) (178,800) (172,600) (133,100)
Net Expenditure 37,549 71,400 69,100 71,100 73,400
Budget Book 2005-06 to 2007-08 30

RECREATION AND CULTURAL SERVICES
17T MUSEUMS
Probable Outturn 2004/05
£'s
Approved Budget 2004/05
£'s
Approved Budget 2005/06
£'s
Provisional Estimate 2006/07
£'s
Provisional Estimate 2007/08
£'s
Staff Costs 250,335 226,000 235,000 241,900 249,800 Other Staff Costs 55 0 0 0 0 Property Costs 68,020 57,500 58,100 58,900 59,700 Supplies and Services 32,802 38,700 36,500 31,900 32,300 Transport Costs 4,253 2,300 2,300 2,300 2,400 Administration Costs 21,382 12,100 12,200 12,400 12,500 Apportioned Costs 11,300 11,300 11,700 12,100 12,500 Third Party Payments 9,568 7,300 7,400 7,400 7,700 Transfer Payments 32,500 23,000 23,300 23,600 23,900 Miscellaneous Expenditure 984 0 0 0 0
Total Expenditure 431,199 378,200 386,500 390,500 400,800 Government Grants (1,643) 0 0 0 0 Other Grants & Reimbursements (1,275) 0 0 0 0 Rents & Lettings (2,905) (2,200) (2,200) (2,200) (2,200) Sales (23,186) (29,500) (30,400) (31,300) (32,200) Fees & Charges (3,190) (1,000) (1,000) (1,100) (1,100) Miscellaneous Income (22,218) (17,700) (17,700) (17,700) (17,700)
Total Income (54,417) (50,400) (51,300) (52,300) (53,200)
Net Expenditure
17V LIBRARIES
376,782 327,800 335,200 338,200 347,600
Staff Costs 454,532 421,600 438,200 451,400 466,100 Other Staff Costs 11,460 1,000 1,000 1,000 1,000 Property Costs 140,704 140,800 143,600 145,900 148,600 Supplies and Services 136,701 168,700 168,800 171,200 173,300 Transport Costs 24,189 24,400 24,700 25,000 25,300 Administration Costs 25,526 25,300 25,600 25,900 26,300 Apportioned Costs 3,100 3,100 3,200 3,300 3,400 Third Party Payments 589 200 200 200 200 Miscellaneous Expenditure 60 0 0 0 0
Total Expenditure 796,861 785,100 805,300 823,900 844,200 Other Grants & Reimbursements (3,850) 0 0 0 0 Rents & Lettings (2,027) (200) (200) (200) (200) Sales (12,045) (8,000) (8,200) (8,500) (8,700) Fees & Charges (1,806) (2,400) (2,500) (2,500) (2,600) Miscellaneous Income (1,666) (1,800) (1,800) (1,800) (1,800)
Total Income (21,394) (12,400) (12,700) (13,000) (13,300)
Net Expenditure
17W SOCIAL INCLUSION PARTNERSHIP
775,467 772,700 792,600 810,900 830,900
Transfer Payments 40,000 40,000 0 500 1,100
Total Expenditure 40,000 40,000 0 500 1,100 Government Grants (40,000) (40,000) 0 (500) (1,100)
Total Income (40,000) (40,000) 0 (500) (1,100)
Net Expenditure
17X ARCHAEOLOGY
0 0 0 0 0
Staff Costs 24,298 24,100 24,700 25,200 25,800 Property Costs 550 2,200 2,200 2,300 2,300 Supplies and Services 250 1,000 1,000 1,000 1,000 Transport Costs 2,133 2,000 2,000 2,000 2,000 Administration Costs 1,261 2,600 2,600 2,700 2,700 Third Party Payments 82 500 500 500 500 Miscellaneous Expenditure 128 0 0 0 0
Net Expenditure 28,702 32,400 33,000 33,700 34,300
Budget Book 2005-06 to 2007-08 31

RECREATION AND CULTURAL SERVICES
17Z ORKNEY BIO-DIVERSITY
Probable Outturn 2004/05
£'s
Approved Budget 2004/05
£'s
Approved Budget 2005/06
£'s
Provisional Estimate 2006/07
£'s
Provisional Estimate 2007/08
£'s
Staff Costs 7,635 2,900 3,000 3,100 3,200 Property Costs 125 500 500 500 500 Supplies and Services 9,151 700 700 700 700 Transport Costs 210 0 0 0 0 Administration Costs 1,733 0 0 0 0
Total Expenditure 18,854 4,100 4,200 4,300 4,400 Other Grants & Reimbursements (3,500) 0 0 0 0 Fees & Charges (1,098) (4,100) (4,200) (4,300) (4,400)
Total Income (4,598) (4,100) (4,200) (4,300) (4,400)
Net Expenditure
39N ST MAGNUS CATHEDRAL
14,256 0 0 0 0
Staff Costs 50,909 40,500 42,100 43,400 44,800 Property Costs 59,778 80,500 81,600 82,600 83,700 Supplies and Services 1,063 2,000 2,000 2,100 2,100 Transport Costs 1,282 0 0 0 0 Administration Costs 5,699 2,000 2,000 2,100 2,100 Apportioned Costs 31,000 31,000 32,100 33,200 34,400 Third Party Payments 2,266 2,000 2,000 2,100 2,100 Miscellaneous Expenditure 26 0 0 0 0
Total Expenditure 152,023 158,000 161,800 165,500 169,200 Other Grants & Reimbursements (1,250) (2,000) (2,000) (2,000) (2,000) Rents & Lettings (2,785) 0 0 0 0 Fees & Charges 0 (3,100) (3,200) (3,300) (3,400) Miscellaneous Income (394) 0 0 0 0
Total Income (4,429) (5,100) (5,200) (5,300) (5,400)
Net Expenditure
SERVICE AREA SUMMARY
147,594 152,900 156,600 160,200 163,800
Staff Costs 1,995,875 1,856,400 2,081,900 2,137,500 2,200,400 Other Staff Costs 38,748 4,900 4,900 5,000 5,000 Property Costs 724,603 733,500 744,200 755,400 766,500 Supplies and Services 441,920 449,500 546,700 539,700 504,300 Transport Costs 94,266 88,800 100,400 101,300 102,500 Administration Costs 134,324 116,900 128,100 129,800 131,200 Apportioned Costs 174,900 174,900 181,100 187,400 194,000 Third Party Payments 358,600 344,500 341,100 345,200 349,200 Transfer Payments 172,691 160,900 116,600 118,600 120,900 Miscellaneous Expenditure 2,088 500 500 500 500
Total Expenditure 4,138,015 3,930,800 4,245,500 4,320,400 4,374,500 Government Grants (102,570) (40,000) 0 (500) (1,100) Other Grants & Reimbursements (469,776) (318,700) (687,100) (681,000) (641,800) Rents & Lettings (56,391) (64,600) (64,600) (64,600) (64,600) Sales (215,135) (212,900) (219,300) (225,900) (232,500) Interest & Loans 0 0 0 0 0 Fees & Charges (159,782) (144,200) (148,300) (153,000) (157,300) Apportioned Income 0 0 0 0 0 Miscellaneous Income (38,121) (45,300) (45,300) (45,300) (45,300)
Total Income (1,041,775) (825,700) (1,164,600) (1,170,300) (1,142,600)
Net Expenditure 3,096,240 3,105,100 3,080,900 3,150,100 3,231,900
Budget Book 2005-06 to 2007-08 32

COMMUNITY SOCIAL SERVICES
19A ADMINISTRATION
Probable Outturn 2004/05
£'s
Approved Budget 2004/05
£'s
Approved Budget 2005/06
£'s
Provisional Estimate 2006/07
£'s
Provisional Estimate 2007/08
£'s
Staff Costs 866,133 901,728 834,600 776,300 806,100 Other Staff Costs 2,557 4,600 4,500 4,500 4,600 Property Costs 11,129 23,500 23,300 23,600 23,900 Supplies and Services 65,915 77,300 110,400 111,100 111,800 Transport Costs 99,877 62,700 60,600 61,400 62,300 Administration Costs 240,143 123,500 119,000 120,700 122,200 Apportioned Costs 469,400 469,400 485,800 502,800 520,400 Third Party Payments 444,523 551,600 1,081,000 1,087,300 1,146,900 Transfer Payments 352,612 450,500 380,300 388,400 397,600 Miscellaneous Expenditure 2,037 0 0 0 0
Total Expenditure 2,554,326 2,664,828 3,099,500 3,076,100 3,195,800 Government Grants (591,881) (553,800) (729,200) (725,600) (784,800) Other Grants & Reimbursements (46,142) (64,800) (135,300) (136,800) (138,500) Fees & Charges (1,000) (1,000) (1,000) (1,000) (1,100) Apportioned Income (6,105) (37,000) (38,500) (39,600) (40,900) Miscellaneous Income (2,292) (1,500) (1,500) (1,500) (1,500)
Total Income (647,420) (658,100) (905,500) (904,500) (966,800)
Net Expenditure
19C CHILDCARE
1,906,906 2,006,728 2,194,000 2,171,600 2,229,000
Staff Costs 1,281,056 1,299,300 1,299,100 1,339,800 1,385,100 Other Staff Costs (3,133) 7,900 7,500 7,700 7,700 Property Costs 29,303 33,900 34,300 34,700 35,200 Supplies and Services 39,126 34,700 36,500 37,000 37,500 Transport Costs 106,311 113,400 137,100 138,300 140,000 Administration Costs 30,734 34,700 34,600 35,100 35,500 Third Party Payments 435,405 435,482 390,400 396,100 401,600 Transfer Payments 67,571 78,360 96,700 148,300 189,300 Miscellaneous Expenditure 5,994 100 100 100 100
Total Expenditure 1,992,367 2,037,842 2,036,300 2,137,100 2,232,000 Government Grants (530,871) (432,442) (428,300) (437,900) (448,300) Other Grants & Reimbursements (47,460) (31,400) (32,000) (32,800) (33,600) Fees & Charges (20,010) (1,600) (1,500) (1,600) (1,600) Miscellaneous Income (26,412) (16,700) (15,100) (15,100) (15,100)
Total Income (624,753) (482,142) (476,900) (487,400) (498,600)
Net Expenditure
19D ELDERLY - RESIDENTIAL
1,367,614 1,555,700 1,559,400 1,649,700 1,733,400
Staff Costs 2,386,458 2,452,100 3,239,500 3,312,500 3,393,900 Other Staff Costs 28,484 26,100 207,300 207,500 207,600 Property Costs 140,837 133,700 133,500 135,200 137,100 Supplies and Services 210,970 164,800 155,700 157,900 160,100 Transport Costs 55,658 51,900 10,900 11,100 11,100 Administration Costs 13,578 12,600 12,100 12,100 12,300 Third Party Payments 15,095 8,700 3,600 3,700 3,800 Transfer Payments 14,589 20,500 19,600 19,900 20,300 Miscellaneous Expenditure 2,904 16,600 16,000 16,200 16,400
Total Expenditure 2,868,573 2,887,000 3,798,200 3,876,100 3,962,600 Other Grants & Reimbursements (20,689) (100) (100) (100) (100) Rents & Lettings 0 (1,100) (1,000) (1,000) (1,000) Sales (26,737) (9,600) (9,400) (9,700) (10,000) Fees & Charges (659,856) (551,400) (695,900) (713,000) (730,500) Apportioned Income (56,547) (233,400) 0 0 0 Miscellaneous Income 87 (500) (500) (500) (500)
Total Income (763,742) (796,100) (706,900) (724,300) (742,100)
Net Expenditure
19E ELDERLY-COMMUNITY
2,104,831 2,090,900 3,091,300 3,151,800 3,220,500
Supplies and Services 242 0 0 0 0 Transport Costs 2,916 0 0 0 0 Third Party Payments 468,573 383,700 347,200 351,800 356,400 Transfer Payments 1,040 700 700 700 700
Total Expenditure 472,771 384,400 347,900 352,500 357,100 Other Grants & Reimbursements (8,285) 0 0 0 0 Fees & Charges (27,852) (16,700) (16,400) (16,900) (17,400)
Total Income (36,137) (16,700) (16,400) (16,900) (17,400)
Net Expenditure 436,634 367,700 331,500 335,600 339,700
Budget Book 2005-06 to 2007-08 33

COMMUNITY SOCIAL SERVICES
19F ELDERLY - DAY CENTRES
Probable Outturn 2004/05
£'s
Approved Budget 2004/05
£'s
Approved Budget 2005/06
£'s
Provisional Estimate 2006/07
£'s
Provisional Estimate 2007/08
£'s
Staff Costs 188,135 180,100 177,800 183,400 189,700 Other Staff Costs 7,224 300 300 300 300 Property Costs 6,966 6,900 7,000 7,100 7,200 Supplies and Services 14,079 10,800 10,400 10,600 10,700 Transport Costs 9,040 10,700 10,300 10,500 10,600 Administration Costs 657 800 800 800 800 Third Party Payments 1,003 500 500 500 500 Transfer Payments 28,820 20,000 18,100 18,300 18,600
Total Expenditure 255,924 230,100 225,200 231,500 238,400 Rents & Lettings 0 (100) (100) (100) (100) Sales (113) (300) (300) (300) (300) Fees & Charges (10,406) (7,100) (6,900) (7,100) (7,400) Miscellaneous Income (3,229) (400) (400) (400) (400)
Total Income (13,748) (7,900) (7,700) (7,900) (8,200)
Net Expenditure
19G DISABILITY
242,176 222,200 217,500 223,600 230,200
Staff Costs 940,743 825,500 841,600 867,500 896,200 Other Staff Costs (3,110) 100 100 100 100 Property Costs 41,584 46,400 47,000 47,500 48,200 Supplies and Services 54,485 42,200 40,700 41,200 41,800 Transport Costs 31,111 25,600 24,600 24,900 25,300 Administration Costs 10,072 7,000 6,800 6,800 6,900 Third Party Payments 65,861 69,200 66,600 67,500 68,500 Transfer Payments 85,245 97,000 93,400 94,600 95,900 Miscellaneous Expenditure 92 500 500 500 500
Total Expenditure 1,226,083 1,113,500 1,121,300 1,150,600 1,183,400 Government Grants 0 (60,300) (59,400) (61,300) (63,400) Other Grants & Reimbursements (124,581) (48,700) (46,200) (46,200) (46,200) Sales (73) (300) (300) (300) (300) Fees & Charges (69,091) (51,100) (50,000) (51,600) (53,300) Miscellaneous Income (9,243) (400) (400) (400) (400)
Total Income (202,988) (160,800) (156,300) (159,800) (163,600)
Net Expenditure
19H MENTAL HEALTH
1,023,095 952,700 965,000 990,800 1,019,800
Staff Costs 147,532 199,500 207,400 213,600 220,500 Other Staff Costs 7,781 0 0 0 0 Property Costs 7 0 0 0 0 Supplies and Services 4,996 1,200 1,200 1,200 1,200 Transport Costs 18,633 13,500 13,700 13,800 14,000 Administration Costs 9,806 3,000 3,000 3,100 3,100 Third Party Payments 31,564 82,000 78,400 79,400 80,500 Transfer Payments 80,794 100 62,400 62,400 62,400
Total Expenditure 301,113 299,300 366,100 373,500 381,700 Government Grants (238,300) (194,700) (256,500) (259,200) (262,000) Other Grants & Reimbursements (59,800) 0 0 0 0
Total Income (298,100) (194,700) (256,500) (259,200) (262,000)
Net Expenditure
19I OTHER COMMUNITY CARE
3,013 104,600 109,600 114,300 119,700
Staff Costs 467,841 442,200 556,600 524,300 544,000 Other Staff Costs 25,084 3,500 18,800 2,700 2,700 Property Costs 1,964 11,900 11,500 11,600 11,800 Supplies and Services 19,481 8,800 11,400 8,500 8,600 Transport Costs 39,084 24,700 32,100 32,500 32,900 Administration Costs 13,605 5,700 5,600 5,600 5,700 Third Party Payments 9,264 10,900 10,500 10,700 10,800 Transfer Payments 249 0 0 0 0 Miscellaneous Expenditure 143 200 200 200 200
Total Expenditure 576,715 507,900 647,300 596,700 617,400 Government Grants (450) (900) (900) (900) (900) Other Grants & Reimbursements (209,028) (172,600) (169,900) (174,700) (180,300) Fees & Charges (633) 0 0 0 0 Miscellaneous Income (4,068) (4,000) (3,800) (3,800) (3,800)
Total Income (214,179) (177,500) (174,600) (179,400) (185,000)
Net Expenditure 362,536 330,400 472,700 417,300 432,400
19J OCCUPATION THERAPY
Budget Book 2005-06 to 2007-08 34

COMMUNITY SOCIAL SERVICES
Staff Costs
Probable Outturn 2004/05
£'s
Approved Budget 2004/05
£'s
Approved Budget 2005/06
£'s
Provisional Estimate 2006/07
£'s
Provisional Estimate 2007/08
£'s
186,700 184,400 190,200 186,228 196,700 Other Staff Costs 1,270 0 0 0 0 Property Costs 3,370 4,000 4,100 4,100 4,200 Supplies and Services 77,685 73,800 71,100 72,000 73,000 Transport Costs 16,729 16,200 15,700 15,800 16,100 Administration Costs 1,846 1,800 1,700 1,700 1,700 Third Party Payments 982 1,100 1,000 1,000 1,000 Transfer Payments 500 0 0 0 0 Miscellaneous Expenditure 28 0 0 0 0
Total Expenditure 288,638 283,600 278,000 284,800 292,700 Fees & Charges (22) 0 0 0 0 Apportioned Income (328) 0 0 0 0
Total Income (350) 0 0 0 0
Net Expenditure
19K HOME CARE
288,288 283,600 278,000 284,800 292,700
Staff Costs 1,701,102 1,570,472 1,430,100 1,481,400 1,538,300 Other Staff Costs 21,387 19,000 18,200 18,500 18,800 Supplies and Services 12,783 5,100 5,000 5,000 5,100 Transport Costs 133,434 68,800 95,700 96,500 97,500 Administration Costs 9,072 1,000 1,000 1,000 1,000 Third Party Payments 59,133 43,700 42,100 42,600 43,300 Transfer Payments 84,667 99,500 96,400 97,900 99,800 Miscellaneous Expenditure (5,017) (100) (100) (100) (100)
Total Expenditure 2,016,561 1,807,472 1,688,400 1,742,800 1,803,700 Other Grants & Reimbursements (66,000) 0 0 0 0 Fees & Charges (135,233) (133,900) (131,000) (135,200) (139,400) Miscellaneous Income (2,272) (55,000) (62,700) (62,700) (62,700)
Total Income (203,505) (188,900) (193,700) (197,900) (202,100)
Net Expenditure
19L CRIMINAL JUSTICE
1,813,056 1,618,572 1,494,700 1,544,900 1,601,600
Staff Costs 174,336 173,000 181,800 187,200 193,300 Other Staff Costs 540 1,700 1,700 1,700 1,800 Property Costs 5,969 12,000 12,200 12,300 12,500 Supplies and Services 3,625 11,000 11,100 11,300 11,400 Transport Costs 12,960 12,300 12,500 12,600 12,800 Administration Costs 3,845 5,300 5,400 5,400 5,500 Third Party Payments 41,924 9,600 13,500 13,600 13,700 Transfer Payments 29,944 104,000 109,400 110,800 112,200
Total Expenditure 273,143 328,900 347,600 354,900 363,200 Government Grants (331,229) (355,200) (365,100) (365,100) (365,100) Miscellaneous Income (845) 0 0 0 0
Total Income (332,074) (355,200) (365,100) (365,100) (365,100)
Net Expenditure
19M CHILDRENS PANEL
(58,931) (26,300) (17,500) (10,200) (1,900)
Staff Costs 1,692 1,700 1,800 1,800 1,900 Supplies and Services 442 500 500 500 500 Transport Costs 22,927 16,100 16,300 16,500 16,700 Administration Costs 18,765 22,500 22,800 23,100 23,400 Apportioned Costs 7,200 7,200 7,500 7,700 8,000 Third Party Payments 51 300 300 300 300
Net Expenditure 51,077 48,300 49,200 49,900 50,800
Budget Book 2005-06 to 2007-08 35

COMMUNITY SOCIAL SERVICES
20AS RESOURCE TRANSFER
Probable Outturn 2004/05
£'s
Approved Budget 2004/05
£'s
Approved Budget 2005/06
£'s
Provisional Estimate 2006/07
£'s
Provisional Estimate 2007/08
£'s
Staff Costs 1,288,665 1,252,600 1,297,000 1,336,000 1,379,700 Other Staff Costs 1,429 12,200 12,300 12,500 12,600 Property Costs 38,247 42,000 42,600 43,100 43,700 Supplies and Services 34,522 34,700 35,100 35,600 36,200 Transport Costs 22,273 18,400 18,600 18,900 19,100 Administration Costs 6,032 5,700 5,700 5,800 5,900 Third Party Payments 329,769 270,900 284,400 288,000 291,600 Miscellaneous Expenditure 82 100 100 100 100
Total Expenditure 1,721,019 1,636,600 1,695,800 1,740,000 1,788,900 Other Grants & Reimbursements (1,522,770) (1,501,000) (1,545,600) (1,585,800) (1,630,300) Sales (21,523) 0 0 0 0 Fees & Charges (136,066) (134,800) (149,400) (153,400) (157,800) Miscellaneous Income (622) (800) (800) (800) (800)
Total Income (1,680,981) (1,636,600) (1,695,800) (1,740,000) (1,788,900)
Net Expenditure
SERVICE AREA SUMMARY
40,038 0 0 0 0
Staff Costs 9,629,922 9,484,900 10,251,700 10,414,000 10,745,400 Other Staff Costs 89,513 75,400 270,700 255,500 256,200 Property Costs 279,376 314,300 315,500 319,200 323,800 Supplies and Services 538,351 464,900 489,100 491,900 497,900 Transport Costs 570,953 434,300 448,100 452,800 458,400 Administration Costs 358,155 223,600 218,500 221,200 224,000 Apportioned Costs 476,600 476,600 493,900 511,100 529,100 Third Party Payments 1,903,147 1,867,682 2,319,500 2,342,500 2,418,900 Transfer Payments 746,031 870,660 877,000 941,300 996,800 Miscellaneous Expenditure 6,263 17,400 16,800 17,000 17,200
Total Expenditure 14,598,311 14,229,742 15,700,800 15,966,500 16,467,700 Government Grants (1,692,731) (1,597,342) (1,839,400) (1,850,000) (1,924,500) Other Grants & Reimbursements (2,104,755) (1,818,600) (1,929,100) (1,976,400) (2,029,000) Rents & Lettings 0 (1,200) (1,100) (1,100) (1,100) Sales (48,446) (10,200) (10,000) (10,300) (10,600) Fees & Charges (1,060,169) (897,600) (1,052,100) (1,079,800) (1,108,500) Apportioned Income (62,980) (270,400) (38,500) (39,600) (40,900) Miscellaneous Income (48,896) (79,300) (85,200) (85,200) (85,200)
Total Income (5,017,977) (4,674,642) (4,955,400) (5,042,400) (5,199,800)
Net Expenditure 9,580,334 9,555,100 10,745,400 10,924,100 11,267,900
Budget Book 2005-06 to 2007-08 36
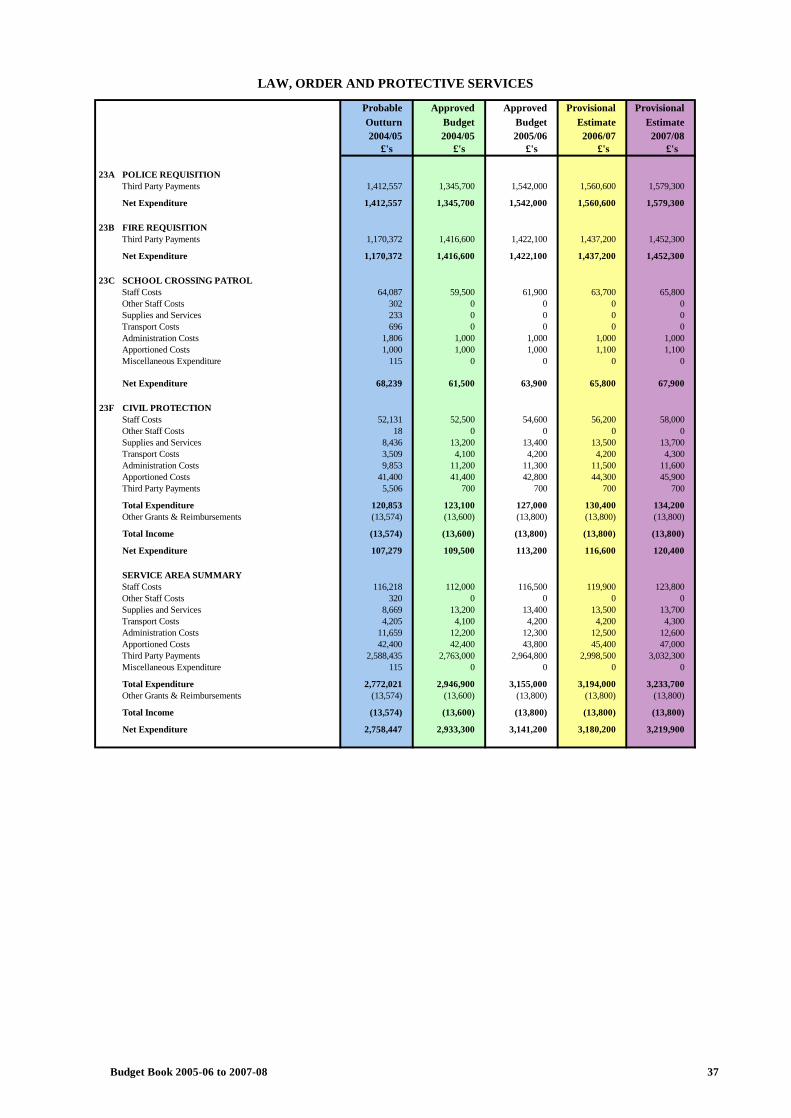
LAW, ORDER AND PROTECTIVE SERVICES
23A POLICE REQUISITION
Probable Outturn 2004/05
£'s
Approved Budget 2004/05
£'s
Approved Budget 2005/06
£'s
Provisional Estimate 2006/07
£'s
Provisional Estimate 2007/08
£'s
Third Party Payments 1,412,557 1,345,700 1,542,000 1,560,600 1,579,300
Net Expenditure
23B FIRE REQUISITION
1,412,557 1,345,700 1,542,000 1,560,600 1,579,300
Third Party Payments 1,170,372 1,416,600 1,422,100 1,437,200 1,452,300
Net Expenditure
23C SCHOOL CROSSING PATROL
1,170,372 1,416,600 1,422,100 1,437,200 1,452,300
Staff Costs 64,087 59,500 61,900 63,700 65,800 Other Staff Costs 302 0 0 0 0 Supplies and Services 233 0 0 0 0 Transport Costs 696 0 0 0 0 Administration Costs 1,806 1,000 1,000 1,000 1,000 Apportioned Costs 1,000 1,000 1,000 1,100 1,100 Miscellaneous Expenditure 115 0 0 0 0
Net Expenditure
23F CIVIL PROTECTION
68,239 61,500 63,900 65,800 67,900
Staff Costs 52,131 52,500 54,600 56,200 58,000 Other Staff Costs 18 0 0 0 0 Supplies and Services 8,436 13,200 13,400 13,500 13,700 Transport Costs 3,509 4,100 4,200 4,200 4,300 Administration Costs 9,853 11,200 11,300 11,500 11,600 Apportioned Costs 41,400 41,400 42,800 44,300 45,900 Third Party Payments 5,506 700 700 700 700
Total Expenditure 120,853 123,100 127,000 130,400 134,200 Other Grants & Reimbursements (13,574) (13,600) (13,800) (13,800) (13,800)
Total Income (13,574) (13,600) (13,800) (13,800) (13,800)
Net Expenditure
SERVICE AREA SUMMARY
107,279 109,500 113,200 116,600 120,400
Staff Costs 116,218 112,000 116,500 119,900 123,800 Other Staff Costs 320 0 0 0 0 Supplies and Services 8,669 13,200 13,400 13,500 13,700 Transport Costs 4,205 4,100 4,200 4,200 4,300 Administration Costs 11,659 12,200 12,300 12,500 12,600 Apportioned Costs 42,400 42,400 43,800 45,400 47,000 Third Party Payments 2,588,435 2,763,000 2,964,800 2,998,500 3,032,300 Miscellaneous Expenditure 115 0 0 0 0
Total Expenditure 2,772,021 2,946,900 3,155,000 3,194,000 3,233,700 Other Grants & Reimbursements (13,574) (13,600) (13,800) (13,800) (13,800)
Total Income (13,574) (13,600) (13,800) (13,800) (13,800)
Net Expenditure 2,758,447 2,933,300 3,141,200 3,180,200 3,219,900
Budget Book 2005-06 to 2007-08 37

ROADS
24-25S STRUCTURAL MAINTENANCE
Probable Outturn 2004/05
£'s
Approved Budget 2004/05
£'s
Approved Budget 2005/06
£'s
Provisional Estimate 2006/07
£'s
Provisional Estimate 2007/08
£'s
Property Costs 300 1,700 1,700 1,800 1,800 Third Party Payments 2,137,000 2,679,700 2,748,900 2,806,700 2,871,400
Net Expenditure
24-25R ROUTINE MAINTENANCE
2,137,300 2,681,400 2,750,600 2,808,500 2,873,200
Property Costs 0 600 600 600 600 Third Party Payments 415,000 440,700 451,700 461,500 472,100
Net Expenditure
26A WINTER MAINTENANCE AND RESPONSE
415,000 441,300 452,300 462,100 472,700
Third Party Payments 755,000 746,200 765,400 781,700 799,700
Net Expenditure
26C HIGHWAY LIGHTING
755,000 746,200 765,400 781,700 799,700
Property Costs 221 0 0 0 0 Supplies and Services 38,427 40,500 41,000 41,600 42,100 Administration Costs 77 0 0 0 0 Third Party Payments 241,833 119,500 122,600 125,200 128,100
Total Expenditure 280,558 160,000 163,600 166,800 170,200 Miscellaneous Income (54) 0 0 0 0
Total Income (54) 0 0 0 0
Net Expenditure
26D CAR PARKS
280,504 160,000 163,600 166,800 170,200
Staff Costs 48,943 55,100 57,300 59,000 60,900 Other Staff Costs 384 0 0 0 0 Property Costs 31,932 55,900 56,500 57,300 58,100 Supplies and Services 1,955 2,000 2,000 2,000 2,100 Transport Costs 3,105 0 0 0 0 Administration Costs 3,312 3,000 3,000 3,100 3,100 Third Party Payments 30,999 1,600 1,600 1,600 1,600
Total Expenditure 120,630 117,600 120,400 123,000 125,800 Fees & Charges (77,731) (80,300) (82,600) (85,200) (87,800) Miscellaneous Income (50) 0 0 0 0
Total Income (77,781) (80,300) (82,600) (85,200) (87,800)
Net Expenditure
26E OTHER WORKS
42,849 37,300 37,800 37,800 38,000
Property Costs 60 0 0 0 0 Third Party Payments 88,310 80,000 81,600 83,300 84,500 Transfer Payments 2,000 0 0 0 0
Total Expenditure 90,370 80,000 81,600 83,300 84,500 Other Grants & Reimbursements (15,000) 0 (15,000) (15,000) (15,000)
Total Income (15,000) 0 (15,000) (15,000) (15,000)
Net Expenditure
26F TRAFFIC MANAGEMENT
75,370 80,000 66,600 68,300 69,500
Supplies and Services 330 2,000 2,000 2,000 2,100 Administration Costs 1,183 2,000 2,000 2,000 2,100 Apportioned Costs 4,100 4,100 4,200 4,400 4,500 Third Party Payments 60,961 45,600 46,000 46,900 47,300
Total Expenditure 66,574 53,700 54,200 55,300 56,000 Fees & Charges (17,366) (15,500) (16,000) (16,400) (16,900) Miscellaneous Income (4,468) 0 0 0 0
Total Income (21,834) (15,500) (16,000) (16,400) (16,900)
Net Expenditure 44,740 38,200 38,200 38,900 39,100
Budget Book 2005-06 to 2007-08 38

ROADS
26Z MISCELLANEOUS
Probable Outturn 2004/05
£'s
Approved Budget 2004/05
£'s
Approved Budget 2005/06
£'s
Provisional Estimate 2006/07
£'s
Provisional Estimate 2007/08
£'s
Property Costs 301 0 0 0 0 Apportioned Costs 269,100 269,100 278,500 288,300 298,400 Third Party Payments 15,043 37,500 38,000 38,500 39,000
Total Expenditure 284,444 306,600 316,500 326,800 337,400 Other Grants & Reimbursements (294,400) (294,400) (294,400) (294,400) (294,400) Rents & Lettings (2,375) (2,000) (2,000) (2,000) (2,000)
Total Income (296,775) (296,400) (296,400) (296,400) (296,400)
Net Expenditure
SERVICE AREA SUMMARY
(12,331) 10,200 20,100 30,400 41,000
Staff Costs 48,943 55,100 57,300 59,000 60,900 Other Staff Costs 384 0 0 0 0 Property Costs 32,814 58,200 58,800 59,700 60,500 Supplies and Services 40,712 44,500 45,000 45,600 46,300 Transport Costs 3,105 0 0 0 0 Administration Costs 4,572 5,000 5,000 5,100 5,200 Apportioned Costs 273,200 273,200 282,700 292,700 302,900 Third Party Payments 3,744,146 4,150,800 4,255,800 4,345,400 4,443,700 Transfer Payments 2,000 0 0 0 0
Total Expenditure 4,149,876 4,586,800 4,704,600 4,807,500 4,919,500 Other Grants & Reimbursements (309,400) (294,400) (309,400) (309,400) (309,400) Rents & Lettings (2,375) (2,000) (2,000) (2,000) (2,000) Fees & Charges (95,097) (95,800) (98,600) (101,600) (104,700) Miscellaneous Income (4,572) 0 0 0 0
Total Income (411,444) (392,200) (410,000) (413,000) (416,100)
Net Expenditure 3,738,432 4,194,600 4,294,600 4,394,500 4,503,400
Budget Book 2005-06 to 2007-08 39

TRANSPORTATION
27A ADMINISTRATION
Probable Outturn 2004/05
£'s
Approved Budget 2004/05
£'s
Approved Budget 2005/06
£'s
Provisional Estimate 2006/07
£'s
Provisional Estimate 2007/08
£'s
Staff Costs 62,004 89,400 58,500 60,300 62,200 Other Staff Costs 1,514 0 0 0 0 Property Costs 265 0 0 0 0 Supplies and Services 5,347 5,000 5,100 5,100 5,200 Transport Costs 3,695 4,500 4,600 4,600 4,700 Administration Costs 683 1,500 1,500 1,500 1,600 Apportioned Costs 0 0 7,000 7,000 7,000 Third Party Payments 495 400 400 400 400
Net Expenditure
27B CO-ORDINATION
74,003 100,800 77,100 78,900 81,100
Property Costs 21,643 10,800 19,900 20,000 20,100 Supplies and Services 3,528 0 0 0 0 Administration Costs 127 0 0 0 0 Third Party Payments 38,652 29,300 31,500 31,900 32,200
Total Expenditure 63,950 40,100 51,400 51,900 52,300 Other Grants & Reimbursements (9,500) 0 0 0 0 Miscellaneous Income (1,395) 0 0 0 0
Total Income (10,895) 0 0 0 0
Net Expenditure
27C CONCESSIONARY FARES
53,055 40,100 51,400 51,900 52,300
Administration Costs 262 0 0 0 0 Third Party Payments 92,385 125,300 101,700 103,200 104,600
Net Expenditure
27G SUPPORT FOR OPERATORS - BUSES
92,647 125,300 101,700 103,200 104,600
Third Party Payments 259,824 281,400 285,200 288,800 292,600
Net Expenditure
27H SUPPORT FOR OPERATORS - OTHER
259,824 281,400 285,200 288,800 292,600
Third Party Payments 3,578 5,100 5,200 5,200 5,300
Net Expenditure
27I SUPPORT FOR OPERATORS - AIR
3,578 5,100 5,200 5,200 5,300
Third Party Payments 399,219 447,900 461,700 467,600 473,600
Total Expenditure 399,219 447,900 461,700 467,600 473,600 Government Grants (300,000) (300,000) 0 0 0
Total Income (300,000) (300,000) 0 0 0
Net Expenditure
27J SUPPORT FOR OPERATORS - FERRIES
99,219 147,900 461,700 467,600 473,600
Third Party Payments 8,788 0 10,000 10,000 10,000
Net Expenditure
27K AIRFIELDS
8,788 0 10,000 10,000 10,000
Property Costs 40,507 25,100 30,400 30,800 31,100 Supplies and Services 5,006 10,300 25,700 25,900 26,000 Transport Costs 3,837 3,100 3,100 3,200 3,200 Administration Costs 20,616 9,300 25,400 25,500 25,700 Apportioned Costs 56,700 56,700 51,400 53,200 55,100 Third Party Payments 126,227 120,200 149,500 151,000 152,600
Total Expenditure 252,893 224,700 285,500 289,600 293,700 Other Grants & Reimbursements (1,700) (1,700) (1,700) (1,700) (1,700) Fees & Charges (8,462) (11,300) (11,600) (12,000) (12,300) Miscellaneous Income (984) 0 0 0 0
Total Income (11,146) (13,000) (13,300) (13,700) (14,000)
Net Expenditure 241,747 211,700 272,200 275,900 279,700
Budget Book 2005-06 to 2007-08 40

TRANSPORTATION
27L ORKNEY FERRIES
Probable Outturn 2004/05
£'s
Approved Budget 2004/05
£'s
Approved Budget 2005/06
£'s
Provisional Estimate 2006/07
£'s
Provisional Estimate 2007/08
£'s
Staff Costs 2,379 0 0 0 0 Supplies and Services 1,593 0 0 0 0 Transport Costs 293,250 262,100 265,500 269,000 272,500 Administration Costs 37 0 0 0 0 Apportioned Costs 5,200 5,200 5,400 5,600 5,800 Third Party Payments 4,822,034 4,697,700 4,986,800 5,230,000 5,560,600
Net Expenditure
27M RURAL TRANSPORT INITIATIVE
5,124,493 4,965,000 5,257,700 5,504,600 5,838,900
Government Grants (261,000) (229,000) (275,000) (275,000) (275,000)
Net Expenditure
SERVICE AREA SUMMARY
(261,000) (229,000) (275,000) (275,000) (275,000)
Staff Costs 64,383 89,400 58,500 60,300 62,200 Other Staff Costs 1,514 0 0 0 0 Property Costs 62,415 35,900 50,300 50,800 51,200 Supplies and Services 15,474 15,300 30,800 31,000 31,200 Transport Costs 300,782 269,700 273,200 276,800 280,400 Administration Costs 21,725 10,800 26,900 27,000 27,300 Apportioned Costs 61,900 61,900 63,800 65,800 67,900 Third Party Payments 5,751,202 5,707,300 6,032,000 6,288,100 6,631,900
Total Expenditure 6,279,395 6,190,300 6,535,500 6,799,800 7,152,100 Government Grants (561,000) (529,000) (275,000) (275,000) (275,000) Other Grants & Reimbursements (11,200) (1,700) (1,700) (1,700) (1,700) Fees & Charges (8,462) (11,300) (11,600) (12,000) (12,300) Miscellaneous Income (2,379) 0 0 0 0
Total Income (583,041) (542,000) (288,300) (288,700) (289,000)
Net Expenditure 5,696,354 5,648,300 6,247,200 6,511,100 6,863,100
Budget Book 2005-06 to 2007-08 41

ENVIRONMENTAL SERVICES
28B BURIAL GROUNDS
Probable Outturn 2004/05
£'s
Approved Budget 2004/05
£'s
Approved Budget 2005/06
£'s
Provisional Estimate 2006/07
£'s
Provisional Estimate 2007/08
£'s
Staff Costs 2,337 4,200 4,400 4,500 4,700 Other Staff Costs 64 0 0 0 0 Property Costs 31,823 28,600 29,000 29,400 29,700 Supplies and Services 11 0 0 0 0 Apportioned Costs 21,700 21,700 22,400 23,300 24,000 Third Party Payments 159,413 138,700 142,300 145,400 148,600
Total Expenditure 215,348 193,200 198,100 202,600 207,000 Sales (10,904) (7,600) (7,800) (8,100) (8,300) Fees & Charges (22,600) (16,000) (16,400) (17,000) (17,400) Miscellaneous Income (65) 0 0 0 0
Total Income (33,569) (23,600) (24,200) (25,100) (25,700)
Net Expenditure
28C REFUSE COLLECTION
181,779 169,600 173,900 177,500 181,300
Supplies and Services 3,380 100,300 20,600 20,800 21,100 Transport Costs 330 2,000 2,000 2,100 2,100 Administration Costs 2,386 2,900 2,900 3,000 3,000 Apportioned Costs 10,400 10,400 10,800 11,100 11,500 Third Party Payments 928,806 787,000 821,300 838,900 858,200
Total Expenditure 945,302 902,600 857,600 875,900 895,900 Other Grants & Reimbursements (256,104) (246,200) (246,200) (246,200) (246,200) Fees & Charges (195,374) (178,800) (184,200) (189,700) (195,400)
Total Income (451,478) (425,000) (430,400) (435,900) (441,600)
Net Expenditure
28D LANDFILL & CIVIC AMENITY SITES
493,824 477,600 427,200 440,000 454,300
Property Costs 1,225 1,300 1,300 1,300 1,300 Transport Costs 56 0 0 0 0 Administration Costs 306 0 0 0 0 Apportioned Costs 8,300 8,300 8,500 8,900 9,200 Third Party Payments 304,099 322,000 332,300 335,700 340,000
Total Expenditure 313,986 331,600 342,100 345,900 350,500 Fees & Charges (22,826) (27,800) (28,600) (29,500) (30,400)
Total Income (22,826) (27,800) (28,600) (29,500) (30,400)
Net Expenditure
28E WASTE DISPOSAL
291,160 303,800 313,500 316,400 320,100
Property Costs 330 2,000 2,000 2,100 2,100 Apportioned Costs 2,100 2,100 2,200 2,200 2,300 Third Party Payments 894,257 979,000 925,300 939,400 953,800
Total Expenditure 896,687 983,100 929,500 943,700 958,200 Fees & Charges (43,625) (31,900) (32,900) (33,800) (34,900)
Total Income (43,625) (31,900) (32,900) (33,800) (34,900)
Net Expenditure
28F RECYCLING
853,062 951,200 896,600 909,900 923,300
Apportioned Costs 1,000 1,000 1,000 1,100 1,100 Third Party Payments 19,830 58,000 58,900 59,800 60,700
Total Expenditure 20,830 59,000 59,900 60,900 61,800 Fees & Charges (165) (1,000) (1,000) (1,100) (1,100)
Total Income (165) (1,000) (1,000) (1,100) (1,100)
Net Expenditure
28G ENVIRONMENTAL CLEANSING
20,665 58,000 58,900 59,800 60,700
Supplies and Services 10 0 0 0 0 Apportioned Costs 6,200 6,200 6,400 6,600 6,900 Third Party Payments 482,120 468,000 480,100 490,300 501,600
Net Expenditure 488,330 474,200 486,500 496,900 508,500
Budget Book 2005-06 to 2007-08 42

ENVIRONMENTAL SERVICES
28H STRATEGIC WASTE FUND
Probable Outturn 2004/05
£'s
Approved Budget 2004/05
£'s
Approved Budget 2005/06
£'s
Provisional Estimate 2006/07
£'s
Provisional Estimate 2007/08
£'s
Staff Costs 13,190 16,000 60,000 60,000 60,000 Other Staff Costs 152 0 0 0 0 Supplies and Services 3,487 3,000 9,000 9,000 9,000 Transport Costs 163 500 3,000 3,000 3,000 Administration Costs 125 500 3,000 3,000 3,000 Third Party Payments 30,000 50,000 160,000 160,000 160,000
Total Expenditure 47,117 70,000 235,000 235,000 235,000 Government Grants (47,117) (70,000) (235,000) (235,000) (235,000)
Total Income (47,117) (70,000) (235,000) (235,000) (235,000)
Net Expenditure
29A ADMINISTRATION
0 0 0 0 0
Staff Costs 326,065 319,300 344,400 357,800 370,000 Other Staff Costs 16,052 0 0 0 0 Property Costs 100 0 0 0 0 Supplies and Services 20,686 15,100 15,300 15,500 15,700 Transport Costs 29,333 26,800 27,100 27,500 27,800 Administration Costs 21,149 16,500 16,700 17,000 17,200 Apportioned Costs 56,900 56,900 58,900 61,000 63,100 Third Party Payments 1,737 0 0 0 0 Miscellaneous Expenditure 155 0 0 0 0
Total Expenditure 472,177 434,600 462,400 478,800 493,800 Government Grants (13,399) 0 (10,000) (5,000) 0 Other Grants & Reimbursements (7,500) 0 0 0 0 Fees & Charges (314) (1,000) (1,000) (1,100) (1,100) Miscellaneous Income 494 0 0 0 0
Total Income (20,719) (1,000) (11,000) (6,100) (1,100)
Net Expenditure
29B TRADING STANDARDS
451,458 433,600 451,400 472,700 492,700
Staff Costs 86,612 107,800 112,100 115,400 119,200 Other Staff Costs 1,223 0 0 0 0 Property Costs 180 0 0 0 0 Supplies and Services 29,451 23,500 13,700 13,900 14,000 Transport Costs 7,534 7,500 7,600 7,700 7,800 Administration Costs 6,587 9,500 9,600 9,700 9,900 Apportioned Costs 36,200 36,200 37,500 38,800 40,100 Third Party Payments 482 13,000 1,000 1,000 1,000 Miscellaneous Expenditure 20 0 0 0 0
Total Expenditure 168,289 197,500 181,500 186,500 192,000 Other Grants & Reimbursements (5,923) 0 0 0 0 Fees & Charges (2,542) (2,100) (2,200) (2,200) (2,300) Miscellaneous Income (18) 0 0 0 0
Total Income (8,483) (2,100) (2,200) (2,200) (2,300)
Net Expenditure
29D PUBLIC TOILETS
159,806 195,400 179,300 184,300 189,700
Property Costs 104,368 92,300 93,500 94,800 95,900 Supplies and Services 420 0 0 0 0 Apportioned Costs 6,200 6,200 6,400 6,600 6,900
Total Expenditure 110,988 98,500 99,900 101,400 102,800 Fees & Charges (3,065) (4,100) (4,200) (4,300) (4,500) Miscellaneous Income (811) 0 0 0 0
Total Income (3,876) (4,100) (4,200) (4,300) (4,500)
Net Expenditure 107,112 94,400 95,700 97,100 98,300
Budget Book 2005-06 to 2007-08 43

ENVIRONMENTAL SERVICES
29E FOOD
Probable Outturn 2004/05
£'s
Approved Budget 2004/05
£'s
Approved Budget 2005/06
£'s
Provisional Estimate 2006/07
£'s
Provisional Estimate 2007/08
£'s
Staff Costs 25,420 26,100 27,100 28,000 28,900 Supplies and Services 5,492 3,900 3,900 3,900 4,100 Transport Costs 3,803 10,600 10,700 10,900 11,000 Administration Costs 330 2,000 2,000 2,100 2,100 Third Party Payments 9,719 3,500 3,500 3,600 3,600 Miscellaneous Expenditure 2 0 0 0 0
Total Expenditure 44,766 46,100 47,200 48,500 49,700 Other Grants & Reimbursements (11,000) 0 0 0 0 Fees & Charges (9,003) (8,200) (8,400) (8,700) (8,900)
Total Income (20,003) (8,200) (8,400) (8,700) (8,900)
Net Expenditure
29F CONTAMINATED LAND
24,763 37,900 38,800 39,800 40,800
Supplies and Services 34 0 0 0 0 Transport Costs 632 0 0 0 0
Net Expenditure
29G ANIMALS
666 0 0 0 0
Supplies and Services 364 1,100 1,100 1,100 1,100 Third Party Payments 3,916 7,200 7,300 7,400 7,400
Total Expenditure 4,280 8,300 8,400 8,500 8,500 Fees & Charges (3,300) (1,000) (1,000) (1,100) (1,100)
Total Income (3,300) (1,000) (1,000) (1,100) (1,100)
Net Expenditure
29I HEALTH AND SAFETY
980 7,300 7,400 7,400 7,400
Apportioned Costs 51,800 51,800 53,600 55,500 57,400
Net Expenditure
29J COMMUNITY WARDENS
51,800 51,800 53,600 55,500 57,400
Staff Costs 39,112 80,000 0 0 0 Other Staff Costs 14 0 0 0 0 Supplies and Services 1,944 0 0 0 0 Transport Costs 19 0 0 0 0 Administration Costs 50 0 0 0 0
Net Expenditure
29S MISCELLANEOUS
41,139 80,000 0 0 0
Third Party Payments 1,312 0 0 0 0
Total Expenditure 1,312 0 0 0 0 Miscellaneous Income (892) 0 0 0 0
Total Income (892) 0 0 0 0
Net Expenditure
SERVICE AREA SUMMARY
420 0 0 0 0
Staff Costs 492,736 553,400 548,000 565,700 582,800 Other Staff Costs 17,505 0 0 0 0 Property Costs 138,026 124,200 125,800 127,600 129,000 Supplies and Services 65,279 146,900 63,600 64,200 65,000 Transport Costs 41,870 47,400 50,400 51,200 51,700 Administration Costs 30,933 31,400 34,200 34,800 35,200 Apportioned Costs 200,800 200,800 207,700 215,100 222,500 Third Party Payments 2,835,691 2,826,400 2,932,000 2,981,500 3,034,900 Miscellaneous Expenditure 177 0 0 0 0
Total Expenditure 3,823,017 3,930,500 3,961,700 4,040,100 4,121,100 Government Grants (60,516) (70,000) (245,000) (240,000) (235,000) Other Grants & Reimbursements (280,527) (246,200) (246,200) (246,200) (246,200) Sales (10,904) (7,600) (7,800) (8,100) (8,300) Fees & Charges (302,814) (271,900) (279,900) (288,500) (297,100) Miscellaneous Income (1,292) 0 0 0 0
Total Income (656,053) (595,700) (778,900) (782,800) (786,600)
Net Expenditure 3,166,964 3,334,800 3,182,800 3,257,300 3,334,500
Budget Book 2005-06 to 2007-08 44

OTHER HOUSING
30A HOMELESSNESS STRATEGY
Probable Outturn 2004/05
£'s
Approved Budget 2004/05
£'s
Approved Budget 2005/06
£'s
Provisional Estimate 2006/07
£'s
Provisional Estimate 2007/08
£'s
Staff Costs 45,957 106,500 110,700 114,000 117,700 Property Costs 21,322 0 0 0 0 Supplies and Services 17,635 1,000 1,000 1,000 1,000 Transport Costs 5,642 7,100 7,200 7,300 7,400 Administration Costs 5,931 6,100 6,200 6,300 6,300 Third Party Payments 1,599 3,100 3,100 3,200 3,200 Transfer Payments 194,453 189,500 185,100 181,500 177,700 Miscellaneous Expenditure 5 0 0 0 0
Total Expenditure 292,544 313,300 313,300 313,300 313,300 Government Grants (156,651) (313,300) (313,300) (313,300) (313,300) Other Grants & Reimbursements (135,163) 0 0 0 0 Fees & Charges (730) 0 0 0 0
Total Income (292,544) (313,300) (313,300) (313,300) (313,300)
Net Expenditure
30B HOMELESSNESS
0 0 0 0 0
Staff Costs 46,465 69,500 72,200 74,400 76,800 Other Staff Costs 648 0 0 0 0 Property Costs 182,624 140,700 142,600 144,400 146,300 Supplies and Services 1,029 0 0 0 0 Transport Costs 5,705 7,000 7,100 7,200 7,300 Administration Costs 5,614 4,000 4,100 4,100 4,200 Third Party Payments 19,841 15,000 15,200 15,400 15,600 Miscellaneous Expenditure 1,222 500 500 500 500
Total Expenditure 263,148 236,700 241,700 246,000 250,700 Rents & Lettings (141,800) (145,000) (145,000) (145,000) (145,000) Fees & Charges (252) 0 0 0 0
Total Income (142,052) (145,000) (145,000) (145,000) (145,000)
Net Expenditure
30C HOUSING LOANS
121,096 91,700 96,700 101,000 105,700
Property Costs 3,055 3,100 3,100 3,200 3,200 Supplies and Services 269 1,500 1,500 1,500 1,600 Administration Costs 2,013 2,000 2,000 2,000 2,100 Apportioned Costs 5,200 5,200 5,400 5,600 5,800
Total Expenditure 10,537 11,800 12,000 12,300 12,700 Interest & Loans (2,000) (2,000) (2,000) (2,000) (2,000) Fees & Charges (722) (1,500) (1,500) (1,600) (1,600)
Total Income (2,722) (3,500) (3,500) (3,600) (3,600)
Net Expenditure
30D IMPROVEMENT & REPAIR GRANTS
7,815 8,300 8,500 8,700 9,100
Supplies and Services 2,974 6,100 6,100 6,300 6,400 Apportioned Costs 11,400 11,400 11,800 12,200 12,600 Transfer Payments 4,000 0 0 0 0 Miscellaneous Expenditure 47,900 47,900 48,500 49,200 49,800
Total Expenditure 66,274 65,400 66,400 67,700 68,800 Fees & Charges (2,428) (6,200) (6,400) (6,500) (6,800)
Total Income (2,428) (6,200) (6,400) (6,500) (6,800)
Net Expenditure
30F GARAGE LETS
63,846 59,200 60,000 61,200 62,000
Staff Costs 1,000 1,000 1,000 1,100 1,100 Property Costs 14,580 9,000 9,100 9,200 9,400 Supplies and Services 190 0 0 0 0
Total Expenditure 15,770 10,000 10,100 10,300 10,500 Rents & Lettings (58,604) (64,600) (64,600) (64,600) (64,600)
Total Income (58,604) (64,600) (64,600) (64,600) (64,600)
Net Expenditure (42,834) (54,600) (54,500) (54,300) (54,100)
Budget Book 2005-06 to 2007-08 45

OTHER HOUSING
30G MISCELLANEOUS
Probable Outturn 2004/05
£'s
Approved Budget 2004/05
£'s
Approved Budget 2005/06
£'s
Provisional Estimate 2006/07
£'s
Provisional Estimate 2007/08
£'s
Staff Costs 3,100 3,100 3,200 3,300 3,400 Property Costs 3,383 2,600 2,600 2,700 2,700 Supplies and Services 687 0 0 0 0 Transport Costs 2,741 3,200 3,200 3,300 3,300 Administration Costs 1,408 0 0 0 0 Apportioned Costs 29,000 29,000 30,000 31,100 32,200 Third Party Payments 1,972 7,500 7,600 7,700 7,800 Transfer Payments 1,271 7,700 7,900 8,100 8,200 Miscellaneous Expenditure 451 0 0 0 0
Total Expenditure 44,013 53,100 54,500 56,200 57,600 Other Grants & Reimbursements (100) (100) (100) (100) (100) Rents & Lettings (2,000) (2,000) (2,000) (2,000) (2,000)
Total Income (2,100) (2,100) (2,100) (2,100) (2,100)
Net Expenditure
30H HOUSING BENEFITS
41,913 51,000 52,400 54,100 55,500
Supplies and Services 4,128 6,200 6,300 6,400 6,400 Administration Costs 150 0 0 0 0 Apportioned Costs 70,400 70,400 72,900 75,400 78,100 Third Party Payments 1,395 1,500 1,500 1,500 1,600 Transfer Payments 1,969,298 1,948,300 2,034,000 2,059,600 2,085,400 Miscellaneous Expenditure 20 0 0 0 0
Total Expenditure 2,045,391 2,026,400 2,114,700 2,142,900 2,171,500 Government Grants (2,016,298) (1,964,100) (2,082,500) (2,108,100) (2,133,900)
Total Income (2,016,298) (1,964,100) (2,082,500) (2,108,100) (2,133,900)
Net Expenditure
30J MOBILE HOME SITES
29,093 62,300 32,200 34,800 37,600
Property Costs 751 1,000 1,000 1,000 1,000
Total Expenditure 751 1,000 1,000 1,000 1,000 Rents & Lettings (9,493) (9,000) (9,000) (9,000) (9,000)
Total Income (9,493) (9,000) (9,000) (9,000) (9,000)
Net Expenditure
30K HMO REGISTRATION
(8,742) (8,000) (8,000) (8,000) (8,000)
Staff Costs 14,335 14,000 14,000 0 0 Supplies and Services 665 1,000 1,000 0 0
Total Expenditure 15,000 15,000 15,000 0 0 Other Grants & Reimbursements (15,000) (15,000) (15,000) 0 0
Total Income (15,000) (15,000) (15,000) 0 0
Net Expenditure
SERVICE AREA SUMMARY
0 0 0 0 0
Staff Costs 110,857 194,100 201,100 192,800 199,000 Other Staff Costs 648 0 0 0 0 Property Costs 225,715 156,400 158,400 160,500 162,600 Supplies and Services 27,577 15,800 15,900 15,200 15,400 Transport Costs 14,088 17,300 17,500 17,800 18,000 Administration Costs 15,116 12,100 12,300 12,400 12,600 Apportioned Costs 116,000 116,000 120,100 124,300 128,700 Third Party Payments 24,807 27,100 27,400 27,800 28,200 Transfer Payments 2,169,022 2,145,500 2,227,000 2,249,200 2,271,300 Miscellaneous Expenditure 49,598 48,400 49,000 49,700 50,300
Total Expenditure 2,753,428 2,732,700 2,828,700 2,849,700 2,886,100 Government Grants (2,172,949) (2,277,400) (2,395,800) (2,421,400) (2,447,200) Other Grants & Reimbursements (150,263) (15,100) (15,100) (100) (100) Rents & Lettings (211,897) (220,600) (220,600) (220,600) (220,600) Interest & Loans (2,000) (2,000) (2,000) (2,000) (2,000) Fees & Charges (4,132) (7,700) (7,900) (8,100) (8,400)
Total Income (2,541,241) (2,522,800) (2,641,400) (2,652,200) (2,678,300)
Net Expenditure 212,187 209,900 187,300 197,500 207,800
Budget Book 2005-06 to 2007-08 46

ECONOMIC DEVELOPMENT
33A ADMINISTRATION
Probable Outturn 2004/05
£'s
Approved Budget 2004/05
£'s
Approved Budget 2005/06
£'s
Provisional Estimate 2006/07
£'s
Provisional Estimate 2007/08
£'s
Staff Costs 202,385 194,500 240,300 247,500 255,600 Other Staff Costs 5,969 0 0 0 0 Property Costs 14 0 0 0 0 Supplies and Services 2,608 4,100 4,200 4,200 4,300 Transport Costs 17,602 14,500 17,000 17,200 17,500 Administration Costs 13,368 13,200 15,400 15,600 15,800 Apportioned Costs 88,000 88,000 91,100 94,300 97,600 Third Party Payments 4,552 4,000 4,100 4,100 4,200 Miscellaneous Expenditure 108 0 0 0 0
Total Expenditure 334,606 318,300 372,100 382,900 395,000 Other Grants & Reimbursements 0 0 (41,000) (41,000) (41,000) Miscellaneous Income (138) 0 0 0 0
Total Income (138) 0 (41,000) (41,000) (41,000)
Net Expenditure
33C EEC EXPENDITURE
334,468 318,300 331,100 341,900 354,000
Supplies and Services 1,547 5,100 5,200 5,200 5,300 Transport Costs 2,647 5,100 5,200 5,200 5,300 Administration Costs 1,240 1,000 1,000 1,000 1,000 Third Party Payments 8,932 5,100 5,200 5,200 5,300
Net Expenditure
33I TOURISM
14,366 16,300 16,600 16,600 16,900
Third Party Payments 201,000 201,000 206,500 210,300 214,400
Net Expenditure
33W MISCELLANEOUS
201,000 201,000 206,500 210,300 214,400
Third Party Payments 1,337 8,100 8,200 8,300 8,400
Net Expenditure
33X ENERGY ADVICE CENTRE
1,337 8,100 8,200 8,300 8,400
Staff Costs 119,870 89,600 93,100 95,900 99,100 Property Costs 6,541 6,400 6,500 6,600 6,700 Supplies and Services 1,771 1,000 1,000 1,000 1,000 Transport Costs 32,471 13,200 13,400 13,500 13,700 Administration Costs 19,077 12,200 12,400 12,500 12,700 Third Party Payments 2,343 14,200 14,400 14,600 14,800 Miscellaneous Expenditure 15,098 0 0 0 0
Total Expenditure 197,171 136,600 140,800 144,100 148,000 Other Grants & Reimbursements (140,174) (122,300) (122,300) (122,300) (122,300) Miscellaneous Income (73) 0 0 0 0
Total Income (140,247) (122,300) (122,300) (122,300) (122,300)
Net Expenditure
SERVICE AREA SUMMARY
56,924 14,300 18,500 21,800 25,700
Staff Costs 322,255 284,100 333,400 343,400 354,700 Other Staff Costs 5,969 0 0 0 0 Property Costs 6,555 6,400 6,500 6,600 6,700 Supplies and Services 5,926 10,200 10,400 10,400 10,600 Transport Costs 52,720 32,800 35,600 35,900 36,500 Administration Costs 33,685 26,400 28,800 29,100 29,500 Apportioned Costs 88,000 88,000 91,100 94,300 97,600 Third Party Payments 218,164 232,400 238,400 242,500 247,100 Miscellaneous Expenditure 15,206 0 0 0 0
Total Expenditure 748,480 680,300 744,200 762,200 782,700 Other Grants & Reimbursements (140,174) (122,300) (163,300) (163,300) (163,300) Miscellaneous Income (211) 0 0 0 0
Total Income (140,385) (122,300) (163,300) (163,300) (163,300)
Net Expenditure 608,095 558,000 580,900 598,900 619,400
Budget Book 2005-06 to 2007-08 47

PLANNING
34A ADMINISTRATION
Probable Outturn 2004/05
£'s
Approved Budget 2004/05
£'s
Approved Budget 2005/06
£'s
Provisional Estimate 2006/07
£'s
Provisional Estimate 2007/08
£'s
Staff Costs 77,020 95,800 99,600 102,600 105,900 Other Staff Costs 2,331 0 0 0 0 Property Costs 802 0 0 0 0 Supplies and Services 4,837 5,900 6,000 6,100 6,100 Transport Costs 635 1,000 1,000 1,000 1,000 Administration Costs 7,079 7,100 7,200 7,300 7,400 Apportioned Costs 86,900 86,900 89,900 93,100 96,300 Third Party Payments 530 3,000 3,000 3,100 3,100
Net Expenditure
34B DEVELOPMENT CONTROL
180,134 199,700 206,700 213,200 219,800
Staff Costs 112,009 131,200 143,800 148,200 152,900 Other Staff Costs (1,358) 0 0 0 0 Supplies and Services 7,160 4,000 4,100 4,100 4,200 Transport Costs 8,082 6,700 6,800 6,900 7,000 Administration Costs 12,294 6,700 6,800 6,900 7,000 Apportioned Costs 7,200 7,200 7,500 7,700 8,000 Third Party Payments 3,079 0 0 0 0 Miscellaneous Expenditure 6,962 3,500 3,500 3,600 3,600
Total Expenditure 155,428 159,300 172,500 177,400 182,700 Fees & Charges (136,686) (106,500) (117,100) (120,700) (124,300)
Total Income (136,686) (106,500) (117,100) (120,700) (124,300)
Net Expenditure
34C DEVELOPMENT PLANNING
18,742 52,800 55,400 56,700 58,400
Staff Costs 103,397 109,500 113,800 117,200 121,100 Other Staff Costs 3,816 0 0 0 0 Supplies and Services 7,407 9,500 9,600 9,700 9,900 Transport Costs 8,230 4,100 4,200 4,200 4,300 Administration Costs 7,983 21,900 22,200 22,500 22,800 Third Party Payments 12,174 1,600 1,600 1,600 1,700
Total Expenditure 143,007 146,600 151,400 155,200 159,800 Miscellaneous Income (15) 0 0 0 0
Total Income (15) 0 0 0 0
Net Expenditure
34D CONSERVATION
142,992 146,600 151,400 155,200 159,800
Staff Costs 20,200 20,000 20,800 21,400 22,100 Supplies and Services 1,800 0 0 0 0 Transport Costs 841 1,800 1,800 1,800 1,900 Administration Costs 21 0 0 0 0 Third Party Payments 44,921 100,000 70,900 71,800 72,800
Total Expenditure 67,783 121,800 93,500 95,000 96,800 Government Grants (1,322) (5,000) (5,000) (5,000) (5,000)
Total Income (1,322) (5,000) (5,000) (5,000) (5,000)
Net Expenditure
34E BUILDING STANDARDS
66,461 116,800 88,500 90,000 91,800
Staff Costs 129,720 132,900 178,100 186,900 195,400 Other Staff Costs 894 0 8,100 0 0 Supplies and Services 772 1,000 2,500 2,500 2,600 Transport Costs 13,737 10,900 13,000 13,300 13,400 Administration Costs 3,636 3,800 4,300 4,400 4,500 Apportioned Costs 11,400 11,400 11,800 12,200 12,600 Third Party Payments 7 0 0 0 0
Total Expenditure 160,166 160,000 217,800 219,300 228,500 Fees & Charges (206,226) (152,400) (184,900) (192,000) (197,900) Miscellaneous Income (47,000) (47,000) (47,000) (47,000) (47,000)
Total Income (253,226) (199,400) (231,900) (239,000) (244,900)
Net Expenditure (93,060) (39,400) (14,100) (19,700) (16,400)
Budget Book 2005-06 to 2007-08 48

PLANNING
34F ACCESS TO THE COUNTRYSIDE
Probable Outturn 2004/05
£'s
Approved Budget 2004/05
£'s
Approved Budget 2005/06
£'s
Provisional Estimate 2006/07
£'s
Provisional Estimate 2007/08
£'s
Staff Costs 17,948 21,900 21,900 21,900 21,900 Supplies and Services 300 3,000 3,000 3,000 3,000 Transport Costs 2,107 2,500 2,500 2,500 2,500 Administration Costs 90 900 900 900 900 Third Party Payments 216 0 0 0 0
Total Expenditure 20,661 28,300 28,300 28,300 28,300 Government Grants (10,200) (20,400) (20,400) (20,400) (20,400) Other Grants & Reimbursements (4,926) 0 0 0 0
Total Income (15,126) (20,400) (20,400) (20,400) (20,400)
Net Expenditure
34I BIO-DIVERSITY
5,535 7,900 7,900 7,900 7,900
Staff Costs 22,709 24,600 24,600 24,600 24,600 Property Costs 265 0 0 0 0 Supplies and Services 2,124 3,400 3,400 3,400 3,400 Transport Costs 2,631 4,300 3,400 4,300 4,300 Administration Costs 1,055 1,900 1,900 1,900 1,900 Third Party Payments 159 0 0 0 0
Total Expenditure 28,943 34,200 33,300 34,200 34,200 Government Grants (6,100) (12,200) (11,300) (12,200) (12,200) Other Grants & Reimbursements (2,875) 0 0 0 0
Total Income (8,975) (12,200) (11,300) (12,200) (12,200)
Net Expenditure
34J OTHER EXPENDITURE
19,968 22,000 22,000 22,000 22,000
Apportioned Costs 6,000 6,000 6,200 6,400 6,700 Third Party Payments 165 1,000 1,000 1,000 1,000
Net Expenditure
34L TOWN & COUNTRY IMPROVEMENTS
6,165 7,000 7,200 7,400 7,700
Staff Costs 13,119 13,800 14,300 14,800 15,300 Property Costs 1,215 1,300 1,300 1,300 1,400 Supplies and Services 351 0 0 0 0 Transport Costs 1,886 1,000 1,000 1,000 1,000 Administration Costs 699 0 0 0 0 Apportioned Costs 3,100 3,100 3,200 3,300 3,400 Third Party Payments 62,889 83,400 84,500 85,600 86,700
Total Expenditure 83,259 102,600 104,300 106,000 107,800 Government Grants (8,014) (10,000) (10,000) (10,000) (10,000) Other Grants & Reimbursements (2,500) (5,000) (5,000) (5,000) (5,000)
Total Income (10,514) (15,000) (15,000) (15,000) (15,000)
Net Expenditure
SERVICE AREA SUMMARY
72,745 87,600 89,300 91,000 92,800
Staff Costs 496,122 549,700 616,900 637,600 659,200 Other Staff Costs 5,683 0 8,100 0 0 Property Costs 2,282 1,300 1,300 1,300 1,400 Supplies and Services 24,751 26,800 28,600 28,800 29,200 Transport Costs 38,149 32,300 33,700 35,000 35,400 Administration Costs 32,857 42,300 43,300 43,900 44,500 Apportioned Costs 114,600 114,600 118,600 122,700 127,000 Third Party Payments 124,140 189,000 161,000 163,100 165,300 Miscellaneous Expenditure 6,962 3,500 3,500 3,600 3,600
Total Expenditure 845,546 959,500 1,015,000 1,036,000 1,065,600 Government Grants (25,636) (47,600) (46,700) (47,600) (47,600) Other Grants & Reimbursements (10,301) (5,000) (5,000) (5,000) (5,000) Fees & Charges (342,912) (258,900) (302,000) (312,700) (322,200) Miscellaneous Income (47,015) (47,000) (47,000) (47,000) (47,000)
Total Income (425,864) (358,500) (400,700) (412,300) (421,800)
Net Expenditure 419,682 601,000 614,300 623,700 643,800
Budget Book 2005-06 to 2007-08 49

OTHER SERVICES
32BH CREATION OF EMPLOYMENT OPPORTUNITIES
Probable Outturn 2004/05
£'s
Approved Budget 2004/05
£'s
Approved Budget 2005/06
£'s
Provisional Estimate 2006/07
£'s
Provisional Estimate 2007/08
£'s
Staff Costs 425,679 398,200 414,000 426,400 440,200 Other Staff Costs 1,167 0 0 0 0 Property Costs 25,612 33,300 33,800 34,100 34,600 Supplies and Services 97,165 115,500 117,000 118,500 120,000 Transport Costs 61,253 57,100 57,700 58,600 59,300 Administration Costs 49,102 57,700 58,400 59,300 59,900 Apportioned Costs 12,200 12,200 12,500 13,100 13,500 Third Party Payments 75,246 9,000 9,100 9,300 9,300 Transfer Payments 15,144 50,000 50,700 51,300 52,000 Miscellaneous Expenditure 23,573 14,200 14,400 14,600 14,700
Total Expenditure 786,141 747,200 767,600 785,200 803,500 Government Grants (96,851) (54,900) (55,500) (55,800) (56,300) Other Grants & Reimbursements (167,438) (172,400) (181,300) (186,900) (192,800) Sales (248) (1,500) (1,500) (1,600) (1,600) Interest & Loans (2,118) 0 0 0 0 Fees & Charges (118,267) (178,100) (183,400) (188,900) (194,700) Miscellaneous Income (211,514) (163,500) (164,200) (164,800) (165,500)
Total Income (596,436) (570,400) (585,900) (598,000) (610,900)
Net Expenditure
39B REGISTRATION BIRTHS, DEATHS & MARRIAGES
189,705 176,800 181,700 187,200 192,600
Staff Costs 12,937 18,100 18,800 19,400 20,000 Other Staff Costs 177 0 0 0 0 Property Costs 4,547 500 500 500 500 Supplies and Services 1,994 4,100 4,200 4,200 4,300 Transport Costs 1,261 0 0 0 0 Administration Costs 2,309 0 0 0 0 Apportioned Costs 7,200 7,200 7,500 7,700 8,000 Third Party Payments 354 500 500 500 500
Total Expenditure 30,779 30,400 31,500 32,300 33,300 Other Grants & Reimbursements (136) 0 0 0 0 Fees & Charges (11,388) (8,200) (8,400) (8,700) (9,000)
Total Income (11,524) (8,200) (8,400) (8,700) (9,000)
Net Expenditure
39C MISCELLANEOUS PROPERTY
19,255 22,200 23,100 23,600 24,300
Property Costs 9,919 15,000 15,200 15,400 15,600 Supplies and Services 4,854 0 0 0 0 Administration Costs 129 0 0 0 0 Apportioned Costs 11,400 11,400 11,800 12,200 12,600 Third Party Payments 1,574 0 0 0 0
Total Expenditure 27,876 26,400 27,000 27,600 28,200 Rents & Lettings (28,252) (18,000) (18,000) (18,000) (18,000) Miscellaneous Income (532) 0 0 0 0
Total Income (28,784) (18,000) (18,000) (18,000) (18,000)
Net Expenditure
39D PAYMENT TO JOINT BOARDS
(908) 8,400 9,000 9,600 10,200
Third Party Payments 252,000 252,000 255,300 258,600 262,000
Net Expenditure
39F ELECTIONS
252,000 252,000 255,300 258,600 262,000
Other Staff Costs 13,069 0 0 0 0 Supplies and Services 1,434 5,600 5,700 5,700 5,800 Transport Costs 1,108 0 0 0 0 Administration Costs 1,839 0 0 0 0 Third Party Payments 924 5,600 5,700 5,700 5,800
Total Expenditure 18,374 11,200 11,400 11,400 11,600 Miscellaneous Income (16,124) 0 0 0 0
Total Income (16,124) 0 0 0 0
Net Expenditure 2,250 11,200 11,400 11,400 11,600
Budget Book 2005-06 to 2007-08 50

OTHER SERVICES
39G LICENSING
Probable Outturn 2004/05
£'s
Approved Budget 2004/05
£'s
Approved Budget 2005/06
£'s
Provisional Estimate 2006/07
£'s
Provisional Estimate 2007/08
£'s
Apportioned Costs 82,800 82,800 85,700 88,700 91,800 Third Party Payments 1,814 0 0 0 0
Total Expenditure 84,614 82,800 85,700 88,700 91,800 Fees & Charges (33,866) (28,800) (29,700) (30,600) (31,500)
Total Income (33,866) (28,800) (29,700) (30,600) (31,500)
Net Expenditure
39H SUBSCRIPTIONS AND GRANTS
50,748 54,000 56,000 58,100 60,300
Third Party Payments 842 5,100 5,200 5,200 5,300 Transfer Payments 1,981 0 0 0 0
Net Expenditure
39K PUBLICITY
2,823 5,100 5,200 5,200 5,300
Third Party Payments 8,417 11,100 11,200 11,400 11,500
Net Expenditure
39L TWINNING
8,417 11,100 11,200 11,400 11,500
Other Staff Costs 831 0 0 0 0 Transport Costs 9,971 10,000 10,100 10,300 10,400 Administration Costs 2,016 1,000 1,000 1,000 1,000 Apportioned Costs 3,100 3,100 3,200 3,300 3,400 Third Party Payments 7,807 8,000 8,100 8,200 8,300 Transfer Payments 1,000 0 0 0 0 Miscellaneous Expenditure 330 2,000 2,000 2,100 2,100
Total Expenditure 25,055 24,100 24,400 24,900 25,200 Other Grants & Reimbursements (15,000) 0 (15,000) (15,000) (15,000) Miscellaneous Income (1,343) (8,000) 0 0 0
Total Income (16,343) (8,000) (15,000) (15,000) (15,000)
Net Expenditure
39M COMMUNITY COUNCILS
8,712 16,100 9,400 9,900 10,200
Staff Costs 16,402 13,500 14,000 14,500 14,900 Property Costs 905 500 500 500 500 Supplies and Services 5,034 0 0 0 0 Transport Costs 2,059 2,000 2,000 2,100 2,100 Administration Costs 3,089 4,100 4,200 4,200 4,300 Apportioned Costs 101,400 101,400 104,900 108,600 112,400 Third Party Payments 1,372 0 0 0 0 Transfer Payments 108,914 119,500 122,800 125,000 127,500
Total Expenditure 239,175 241,000 248,400 254,900 261,700 Miscellaneous Income (1,700) 0 0 0 0
Total Income (1,700) 0 0 0 0
Net Expenditure
39Q OIL POLLUTION
237,475 241,000 248,400 254,900 261,700
Third Party Payments 16,000 16,000 16,200 16,400 16,600
Net Expenditure
39R TRANSFERS FROM OTHER ACCOUNTS
16,000 16,000 16,200 16,400 16,600
Other Grants & Reimbursements (182,100) (200,000) 0 0 0
Net Expenditure
39S INTEREST ON LOANS AND BALANCES
(182,100) (200,000) 0 0 0
Interest & Loans (175,295) (175,000) (175,000) (175,000) (175,000)
Net Expenditure
39T MISCELLANEOUS
(175,295) (175,000) (175,000) (175,000) (175,000)
Apportioned Costs 9,300 9,300 9,600 10,000 10,300 Third Party Payments 20,681 29,400 6,900 7,000 7,100
Total Expenditure 29,981 38,700 16,500 17,000 17,400 Other Grants & Reimbursements (5,200) (5,200) (5,200) (5,200) (5,200) Miscellaneous Income (2,087) 0 0 0 0
Total Income (7,287) (5,200) (5,200) (5,200) (5,200)
Net Expenditure 22,694 33,500 11,300 11,800 12,200
Budget Book 2005-06 to 2007-08 51

OTHER SERVICES
39W COUNCIL TAX BENEFITS
Probable Outturn 2004/05
£'s
Approved Budget 2004/05
£'s
Approved Budget 2005/06
£'s
Provisional Estimate 2006/07
£'s
Provisional Estimate 2007/08
£'s
Apportioned Costs 0 0 68,000 68,000 68,000 Transfer Payments 0 0 747,600 747,600 747,600
Total Expenditure 0 0 815,600 815,600 815,600 Government Grants 0 0 (795,600) (795,600) (795,600)
Total Income 0 0 (795,600) (795,600) (795,600)
Net Expenditure
39X COST OF COLLECTION
0 0 20,000 20,000 20,000
Supplies and Services 0 0 19,000 19,000 19,000 Administration Costs 0 0 13,000 13,000 13,000 Apportioned Costs 0 0 201,000 201,000 201,000 Third Party Payments 0 0 1,000 1,000 1,000
Total Expenditure 0 0 234,000 234,000 234,000 Fees & Charges 0 0 (42,000) (42,000) (42,000)
Total Income 0 0 (42,000) (42,000) (42,000)
Net Expenditure
39Y FINANCE CHARGES
0 0 192,000 192,000 192,000
Loan Charges 2,105,000 2,135,000 3,135,000 3,135,000 3,135,000
Net Expenditure
SERVICE AREA SUMMARY
2,105,000 2,135,000 3,135,000 3,135,000 3,135,000
Staff Costs 455,018 429,800 446,800 460,300 475,100 Other Staff Costs 15,244 0 0 0 0 Property Costs 40,983 49,300 50,000 50,500 51,200 Supplies and Services 110,481 125,200 145,900 147,400 149,100 Transport Costs 75,652 69,100 69,800 71,000 71,800 Administration Costs 58,484 62,800 76,600 77,500 78,200 Apportioned Costs 227,400 227,400 504,200 512,600 521,000 Third Party Payments 387,031 336,700 319,200 323,300 327,400 Transfer Payments 127,039 169,500 921,100 923,900 927,100 Loan Charges 2,105,000 2,135,000 3,135,000 3,135,000 3,135,000 Miscellaneous Expenditure 23,903 16,200 16,400 16,700 16,800
Total Expenditure 3,626,235 3,621,000 5,685,000 5,718,200 5,752,700 Government Grants (96,851) (54,900) (851,100) (851,400) (851,900) Other Grants & Reimbursements (369,874) (377,600) (201,500) (207,100) (213,000) Rents & Lettings (28,252) (18,000) (18,000) (18,000) (18,000) Sales (248) (1,500) (1,500) (1,600) (1,600) Interest & Loans (177,413) (175,000) (175,000) (175,000) (175,000) Fees & Charges (163,521) (215,100) (263,500) (270,200) (277,200) Miscellaneous Income (233,300) (171,500) (164,200) (164,800) (165,500)
Total Income (1,069,459) (1,013,600) (1,674,800) (1,688,100) (1,702,200)
Net Expenditure 2,556,776 2,607,400 4,010,200 4,030,100 4,050,500
Budget Book 2005-06 to 2007-08 52

SOURCES OF FUNDING
37A NON-DOMESTIC RATES
Probable Outturn 2004/05
£'s
Approved Budget 2004/05
£'s
Approved Budget 2005/06
£'s
Provisional Estimate 2006/07
£'s
Provisional Estimate 2007/08
£'s
Government Grants (486,000) (486,000) (500,000) (500,000) (500,000) Fees & Charges (6,719,000) (6,719,000) (6,743,000) (6,924,000) (7,110,000)
Total Income
37C COUNCIL TAX
(7,205,000) (7,205,000) (7,243,000) (7,424,000) (7,610,000)
Fees & Charges (6,367,000) (6,367,000) (6,642,000) (6,874,000) (7,046,000)
Total Income
37S REVENUE SUPPORT GRANT
(6,367,000) (6,367,000) (6,642,000) (6,874,000) (7,046,000)
Government Grants (42,684,000) (43,314,600) (44,793,000) (47,823,000) (48,695,000)
Total Income
37T RELEVANT SERVICES FUND CONTRIBUTION
(42,684,000) (43,314,600) (44,793,000) (47,823,000) (48,695,000)
Other Grants & Reimbursements (140,158) (209,000) (3,061,000) (1,231,900) (1,814,900)
Total Income (140,158) (209,000) (3,061,000) (1,231,900) (1,814,900)
SERVICE AREA SUMMARY Government Grants (43,170,000) (43,800,600) (45,293,000) (48,323,000) (49,195,000) Other Grants & Reimbursements (140,158) (209,000) (3,061,000) (1,231,900) (1,814,900) Fees & Charges (13,086,000) (13,086,000) (13,385,000) (13,798,000) (14,156,000)
Total Income (56,396,158) (57,095,600) (61,739,000) (63,352,900) (65,165,900)
Net Expenditure (56,396,158) (57,095,600) (61,739,000) (63,352,900) (65,165,900)
Budget Book 2005-06 to 2007-08 53

Budget Book 2005-06 to 2007-08 54

HOUSING REVENUE ACCOUNT
Budget Book 2005-06 to 2007-08 55

Budget Book 2005-06 to 2007-08 56

HOUSING REVENUE ACCOUNT
61A ADMINISTRATION
Probable Outturn 2004/05
£'s
Approved Budget 2004/05
£'s
Approved Budget 2005/06
£'s
Provisional Estimate 2006/07
£'s
Provisional Estimate 2007/08
£'s
Staff Costs 336,000 310,000 313,900 316,200 319,300 Property Costs 16,000 10,000 10,100 10,300 10,400 Supplies and Services 35,000 25,000 25,400 25,700 26,000 Transport Costs 21,000 28,200 28,500 29,000 29,300 Administration Costs 34,000 35,600 36,100 36,500 37,000 Apportioned Costs 125,000 125,000 129,400 133,900 138,600 Third Party Payments 31,000 36,500 36,900 37,500 37,900
Total Expenditure 598,000 570,300 580,300 589,100 598,500 Government Grants (29,000) (29,300) (29,600) (30,100) (30,500)
Total Income (29,000) (29,300) (29,600) (30,100) (30,500)
Net Expenditure
61F TENANT PARTICIPATION
569,000 541,000 550,700 559,000 568,000
Staff Costs 0 0 15,000 15,000 15,000 Supplies and Services 0 0 5,000 5,000 5,000 Administration Costs 9,000 4,000 10,000 10,000 10,000 Transfer Payments 1,000 3,000 5,000 5,000 5,000
Net Expenditure
61B PROPERTY COSTS
10,000 7,000 35,000 35,000 35,000
Property Costs 337,000 445,000 436,000 427,000 418,000 Apportioned Costs 94,000 94,000 97,300 100,000 103,000 Third Party Payments 18,000 12,000 12,200 12,100 12,100
Total Expenditure 449,000 551,000 545,500 539,100 533,100 Fees & Charges (5,000) (1,000) (1,000) (1,100) (1,100)
Total Income (5,000) (1,000) (1,000) (1,100) (1,100)
Net Expenditure
61J COMMON HOUSING REGISTER
444,000 550,000 544,500 538,000 532,000
Supplies and Services 10,000 10,000 10,000 10,000 10,000
Total Expenditure 10,000 10,000 10,000 10,000 10,000 Other Grants & Reimbursements (10,000) (10,000) (10,000) (10,000) (10,000)
Total Income (10,000) (10,000) (10,000) (10,000) (10,000)
Net Expenditure
61Y FINANCE CHARGES
0 0 0 0 0
Loan Charges 707,000 625,000 558,500 562,000 517,000
Net Expenditure
61E RENT INCOME
707,000 625,000 558,500 562,000 517,000
Staff Costs 3,000 6,000 6,200 6,400 6,600 Transport Costs 5,000 1,000 1,000 1,000 1,000
Total Expenditure 8,000 7,000 7,200 7,400 7,600 Rents & Lettings (1,705,000) (1,703,000) (1,660,900) (1,673,400) (1,631,600)
Total Income (1,705,000) (1,703,000) (1,660,900) (1,673,400) (1,631,600)
Net Expenditure
61I OTHER INCOME
(1,697,000) (1,696,000) (1,653,700) (1,666,000) (1,624,000)
Rents & Lettings (18,000) (12,000) (20,000) (13,000) (13,000) Interest & Loans (15,000) (15,000) (15,000) (15,000) (15,000)
Net Expenditure (33,000) (27,000) (35,000) (28,000) (28,000)
Budget Book 2005-06 to 2007-08 57

HOUSING REVENUE ACCOUNT
SERVICE AREA SUMMARY
Probable Outturn 2004/05
£'s
Approved Budget 2004/05
£'s
Approved Budget 2005/06
£'s
Provisional Estimate 2006/07
£'s
Provisional Estimate 2007/08
£'s
Staff Costs 339,000 316,000 335,100 337,600 340,900 Property Costs 353,000 455,000 446,100 437,300 428,400 Supplies and Services 45,000 35,000 40,400 40,700 41,000 Transport Costs 26,000 29,200 29,500 30,000 30,300 Administration Costs 43,000 39,600 46,100 46,500 47,000 Apportioned Costs 219,000 219,000 226,700 233,900 241,600 Third Party Payments 49,000 48,500 49,100 49,600 50,000 Transfer Payments 1,000 3,000 5,000 5,000 5,000 Loan Charges 707,000 625,000 558,500 562,000 517,000
Total Expenditure 1,782,000 1,770,300 1,736,500 1,742,600 1,701,200 Government Grants (29,000) (29,300) (29,600) (30,100) (30,500) Other Grants & Reimbursements (10,000) (10,000) (10,000) (10,000) (10,000) Rents & Lettings (1,723,000) (1,715,000) (1,680,900) (1,686,400) (1,644,600) Interest & Loans (15,000) (15,000) (15,000) (15,000) (15,000) Fees & Charges (5,000) (1,000) (1,000) (1,100) (1,100)
Total Income (1,782,000) (1,770,300) (1,736,500) (1,742,600) (1,701,200)
Net Expenditure 0 0 0 0 0
Budget Book 2005-06 to 2007-08 58
HARBOUR ACCOUNTS
Budget Book 2005-06 to 2007-08 59

Budget Book 2005-06 to 2007-08 60

SCAPA FLOW OIL PORT
52A ADMINISTRATION
Probable Outturn 2004/05
£'s
Approved Budget 2004/05
£'s
Approved Budget 2005/06
£'s
Provisional Estimate 2006/07
£'s
Provisional Estimate 2007/08
£'s
Staff Costs 246,873 238,700 277,800 283,400 289,800 Property Costs 155,584 387,600 392,600 397,700 402,900 Supplies and Services 10,047 18,600 18,800 19,000 19,200 Transport Costs 25,783 30,000 30,400 30,800 31,200 Administration Costs 46,600 48,600 49,200 49,800 50,400 Apportioned Costs 74,500 74,500 75,500 76,500 77,500 Third Party Payments 2,886 7,200 7,300 7,400 7,500 Miscellaneous Expenditure 3,074 0 0 0 0
Total Expenditure 565,347 805,200 851,600 864,600 878,500 Rents & Lettings (11,218) (11,000) (11,000) (11,000) (11,000) Interest & Loans (15,525) (123,000) (123,000) (123,000) (123,000) Fees & Charges (17,500) (17,500) (18,000) (18,500) (19,100)
Total Income (44,243) (151,500) (152,000) (152,500) (153,100)
Net Expenditure
52L SCAPA FLOW DEVELOPMENT
521,104 653,700 699,600 712,100 725,400
Staff Costs 0 50,000 50,000 51,000 52,100 Property Costs 0 11,300 11,400 11,500 11,600 Supplies and Services 13,302 33,000 33,400 33,800 34,200 Transport Costs 1,093 21,700 22,000 22,300 22,600 Administration Costs 3,191 4,200 4,300 4,400 4,500 Third Party Payments 120,595 32,000 32,400 32,800 33,200
Total Expenditure 138,181 152,200 153,500 155,800 158,200
Total Income 0 0 0 0 0
Net Expenditure
52M OIL POLLUTION
138,181 152,200 153,500 155,800 158,200
Staff Costs 57,702 70,600 65,700 67,000 68,500 Property Costs 2,183 0 0 0 0 Supplies and Services 119,746 4,100 4,200 4,300 4,400 Transport Costs 86,888 35,700 36,200 36,700 37,200 Administration Costs 13,939 10,200 10,300 10,400 10,500 Third Party Payments 17,050 8,700 8,800 8,900 9,000 Miscellaneous Expenditure 64 0 0 0 0
Total Expenditure 297,572 129,300 125,200 127,300 129,600 Rents & Lettings 0 (300) (300) (300) (300) Fees & Charges (6,126) (9,300) (9,600) (9,900) (10,200)
Total Income (6,126) (9,600) (9,900) (10,200) (10,500)
Net Expenditure
52B ENVIRONMENTAL UNIT
291,446 119,700 115,300 117,100 119,100
Staff Costs 96,238 100,300 114,600 116,900 119,500 Property Costs 5,522 7,200 7,300 7,400 7,500 Supplies and Services 4,990 13,500 13,700 13,900 14,100 Transport Costs 3,719 6,200 6,300 6,400 6,500 Administration Costs 4,363 4,200 4,300 4,400 4,500 Third Party Payments 491 5,200 5,300 5,400 5,500 Miscellaneous Expenditure 50 0 0 0 0
Total Expenditure 115,373 136,600 151,500 154,400 157,600 Fees & Charges (8,985) (5,200) (5,400) (5,600) (5,800)
Total Income (8,985) (5,200) (5,400) (5,600) (5,800)
Net Expenditure
52C MARINE OFFICERS
106,388 131,400 146,100 148,800 151,800
Staff Costs 796,769 783,800 774,700 790,200 808,000 Property Costs 360 3,200 3,200 3,200 3,200 Supplies and Services 3,822 3,100 3,100 3,100 3,100 Transport Costs 7,168 11,300 11,400 11,500 11,600 Administration Costs 15,456 1,000 1,000 1,000 1,000 Transfer Payments 10,131 0 0 0 0 Miscellaneous Expenditure 20 0 0 0 0
Net Expenditure 833,726 802,400 793,400 809,000 826,900
Budget Book 2005-06 to 2007-08 61

SCAPA FLOW OIL PORT
52DN NAVIGATIONAL AIDS
Probable Outturn 2004/05
£'s
Approved Budget 2004/05
£'s
Approved Budget 2005/06
£'s
Provisional Estimate 2006/07
£'s
Provisional Estimate 2007/08
£'s
Property Costs 4,467 0 0 0 0 Supplies and Services 30,653 0 0 0 0 Transport Costs 47 0 0 0 0 Administration Costs 151 0 0 0 0 Third Party Payments 32,165 0 0 0 0 Transfer Payments 10,000 0 0 0 0 Miscellaneous Expenditure 24 0 0 0 0
Net Expenditure
52E WEATHER FORECASTS
77,507 0 0 0 0
Third Party Payments 18,615 9,300 9,400 9,500 9,600
Net Expenditure
52F HARBOUR LAUNCHES
18,615 9,300 9,400 9,500 9,600
Staff Costs 717,359 697,700 701,600 715,600 731,700 Property Costs 3,251 1,500 1,500 1,500 1,500 Supplies and Services 24,101 62,000 62,800 63,600 64,400 Transport Costs 203,947 146,700 148,600 150,500 152,500 Administration Costs 2,850 7,200 7,300 7,400 7,500 Third Party Payments 369 0 0 0 0
Total Expenditure 951,877 915,100 921,800 938,600 957,600 Fees & Charges (5,766) (3,100) (3,200) (3,300) (3,400)
Total Income (5,766) (3,100) (3,200) (3,300) (3,400)
Net Expenditure
52G TOWAGE SERVICES
946,111 912,000 918,600 935,300 954,200
Property Costs 101 0 0 0 0 Supplies and Services 633 0 0 0 0 Apportioned Costs 16,100 13,500 13,700 13,900 14,100 Third Party Payments 2,550,000 2,550,000 2,583,200 2,616,800 2,650,800
Total Expenditure 2,566,834 2,563,500 2,596,900 2,630,700 2,664,900
Total Income 0 0 0 0 0
Net Expenditure
52I HARBOUR DUES
2,566,834 2,563,500 2,596,900 2,630,700 2,664,900
Fees & Charges (5,743,766) (5,448,900) (5,634,800) (5,077,200) (4,956,700)
Net Expenditure
52R PILOTAGE INCOME
(5,743,766) (5,448,900) (5,634,800) (5,077,200) (4,956,700)
Fees & Charges (301,902) (56,700) (58,400) (60,200) (62,000)
Net Expenditure
SERVICE AREA SUMMARY
(301,902) (56,700) (58,400) (60,200) (62,000)
Staff Costs 1,914,941 1,941,100 1,984,400 2,024,100 2,069,600 Property Costs 171,468 410,800 416,000 421,300 426,700 Supplies and Services 207,294 134,300 136,000 137,700 139,400 Transport Costs 328,645 251,600 254,900 258,200 261,600 Administration Costs 86,550 75,400 76,400 77,400 78,400 Apportioned Costs 90,600 88,000 89,200 90,400 91,600 Third Party Payments 2,742,171 2,612,400 2,646,400 2,680,800 2,715,600 Transfer Payments 20,131 0 0 0 0 Miscellaneous Expenditure 3,232 0 0 0 0
Total Expenditure 5,565,032 5,513,600 5,603,300 5,689,900 5,782,900 Rents & Lettings (11,218) (11,300) (11,300) (11,300) (11,300) Interest & Loans (15,525) (123,000) (123,000) (123,000) (123,000) Fees & Charges (6,084,045) (5,540,700) (5,729,400) (5,174,700) (5,057,200)
Total Income (6,110,788) (5,675,000) (5,863,700) (5,309,000) (5,191,500)
Net Expenditure (545,756) (161,400) (260,400) 380,900 591,400
Budget Book 2005-06 to 2007-08 62
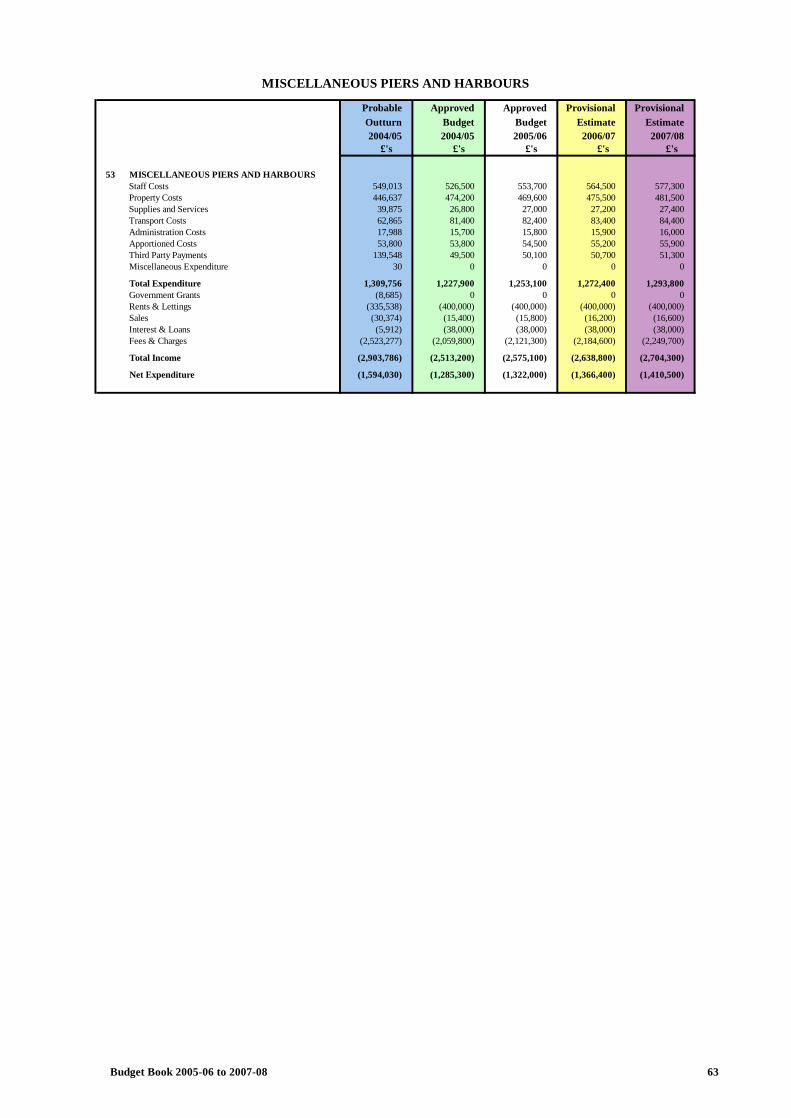
MISCELLANEOUS PIERS AND HARBOURS
53 MISCELLANEOUS PIERS AND HARBOURS
Probable Outturn 2004/05
£'s
Approved Budget 2004/05
£'s
Approved Budget 2005/06
£'s
Provisional Estimate 2006/07
£'s
Provisional Estimate 2007/08
£'s
Staff Costs 549,013 526,500 553,700 564,500 577,300 Property Costs 446,637 474,200 469,600 475,500 481,500 Supplies and Services 39,875 26,800 27,000 27,200 27,400 Transport Costs 62,865 81,400 82,400 83,400 84,400 Administration Costs 17,988 15,700 15,800 15,900 16,000 Apportioned Costs 53,800 53,800 54,500 55,200 55,900 Third Party Payments 139,548 49,500 50,100 50,700 51,300 Miscellaneous Expenditure 30 0 0 0 0
Total Expenditure 1,309,756 1,227,900 1,253,100 1,272,400 1,293,800 Government Grants (8,685) 0 0 0 0 Rents & Lettings (335,538) (400,000) (400,000) (400,000) (400,000) Sales (30,374) (15,400) (15,800) (16,200) (16,600) Interest & Loans (5,912) (38,000) (38,000) (38,000) (38,000) Fees & Charges (2,523,277) (2,059,800) (2,121,300) (2,184,600) (2,249,700)
Total Income (2,903,786) (2,513,200) (2,575,100) (2,638,800) (2,704,300)
Net Expenditure (1,594,030) (1,285,300) (1,322,000) (1,366,400) (1,410,500)
Budget Book 2005-06 to 2007-08 63

Budget Book 2005-06 to 2007-08 64
GENERAL FUND
CAPITAL PROGRAMME
Budget Book 2005-06 to 2007-08 65

Budget Book 2005-06 to 2007-08 66

GENERAL FUND SUMMARY
PROJECT Total Cost £000
2005/06 £000
2006/07 £000
2007/08 £000
Programme Expenditure Housing - ( Non HRA ) 3,664 1,580 1,042 1,042 Community Social Services 698 29 150 519 Education 6,502 1,773 2,594 2,135 Roads 1,951 916 268 767 Recreational and Cultural Services 1,140 627 252 261 Administration Services 2,175 725 725 725 Corporate Property Maintenance 5,824 1,930 1,949 1,945 Environmental services 1,744 557 579 608 Transportation Services 1,700 1,200 500 0
Expenditure Total
Sources of Funding
25,398 9,337 8,059 8,002
Borrowing 16,579 5,039 5,563 5,977 Government Grants 5,895 3,569 1,162 1,164 Capital Receipts - Disposals 530 210 160 160 Capital Receipts - Contributions 650 50 550 50 Capital Receipts - Loan repayments 180 60 60 60 Capital Receipts - Other Grants 1,542 387 564 591 Capital Financed from Current Revenue 22 22 0 0
Income Total 25,398 9,337 8,059 8,002
Net Expenditure 0 0 0 0
Budget Book 2005-06 to 2007-08 67
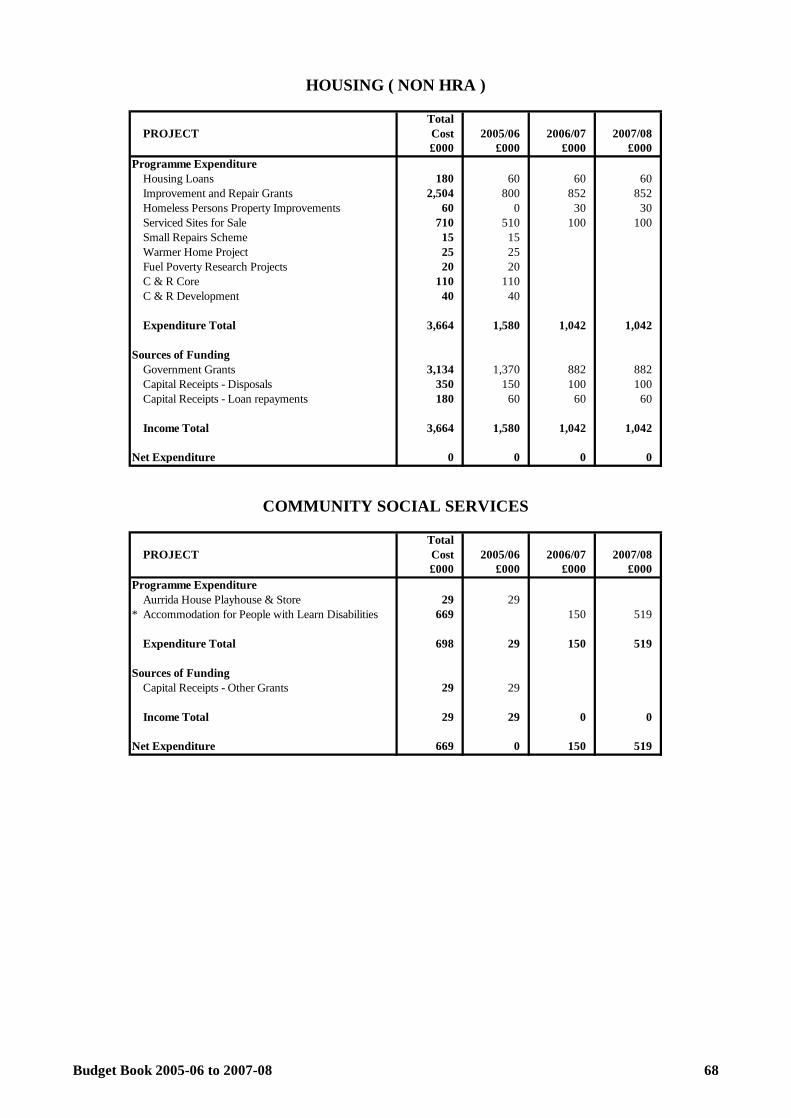
HOUSING ( NON HRA )
PROJECT Total Cost £000
2005/06 £000
2006/07 £000
2007/08 £000
Programme Expenditure Housing Loans 180 60 60 60 Improvement and Repair Grants 2,504 800 852 852 Homeless Persons Property Improvements 60 0 30 30 Serviced Sites for Sale 710 510 100 100 Small Repairs Scheme 15 15 Warmer Home Project 25 25 Fuel Poverty Research Projects 20 20 C & R Core 110 110 C & R Development 40 40
Expenditure Total
Sources of Funding
3,664 1,580 1,042 1,042
Government Grants 3,134 1,370 882 882 Capital Receipts - Disposals 350 150 100 100 Capital Receipts - Loan repayments 180 60 60 60
Income Total 3,664 1,580 1,042 1,042
Net Expenditure 0 0 0 0
COMMUNITY SOCIAL SERVICES
PROJECT Total Cost £000
2005/06 £000
2006/07 £000
2007/08 £000
Programme Expenditure Aurrida House Playhouse & Store
* Accommodation for People with Learn Disabilities
Expenditure Total
Sources of Funding Capital Receipts - Other Grants
Income Total
Net Expenditure
29 669
698
29
29
669
29
29
29
29
0
150
150
0
150
519
519
0
519
Budget Book 2005-06 to 2007-08 68

EDUCATION
PROJECT Total Cost £000
2005/06 £000
2006/07 £000
2007/08 £000
Programme Expenditure Plant and Equipment 450 150 150 150 New Burray Primary School 1,000 1,000 Papdale Primary School 3,230 500 1,500 1,230 Rousay Community School 600 123 377 100 Stromness Academy Upgrade 1,022 542 480 North Walls Pre-school 200 25 175
Expenditure Total 6,502 1,773 2,594 2,135
Sources of Funding Capital Receipts - Disposals 180 60 60 60 Capital Receipts - Other Grants 120 120
Income Total 300 180 60 60
Net Expenditure 6,202 1,593 2,534 2,075
ROADS
PROJECT Total Cost £000
2005/06 £000
2006/07 £000
2007/08 £000
Programme Expenditure B9066 Westray 8 8 Bridges and Structures 210 70 70 70 Street Lighting 360 120 120 120 A965 Junction with Picky Road, Grainshore Road 16 16 Long Stay Car Park Stromness 5 5 Cycling, Walking & Safer Streets / 20 mph Scheme 250 98 75 77 A965 Barnhouse to Brodgar 22 22 Improvement Access to St Margarets Hope 468 468 A961 St Mary's - Road Footway Improvements 81 79 2 Glaitness Park - Road Improvements 31 30 1
* Asset Replacement Programme 500 500
Expenditure Total 1,951 916 268 767
Sources of Funding Government Grants 250 98 75 77 Capital Financed from Current Revenue 22 22
Income Total 272 120 75 77
Net Expenditure 1,679 796 193 690
Budget Book 2005-06 to 2007-08 69

RECREATIONAL AND CULTURAL SERVICES
PROJECT Total Cost £000
2005/06 £000
2006/07 £000
2007/08 £000
Programme Expenditure Safety Surfaces and Play Equipment 90 30 30 30 Playing Fields 150 50 50 50 Capital Grants Scheme 192 24 81 87 Access to the Countryside 273 88 91 94 Healthy Living Centres 435 435
Expenditure Total 1,140 627 252 261
Sources of Funding Government Grants 99 33 33 33 Capital Receipts - Other Grants 218 218 0 0
Income Total 317 251 33 33
Net Expenditure 823 376 219 228
ADMINISTRATION SERVICES
PROJECT Total Cost £000
2005/06 £000
2006/07 £000
2007/08 £000
Programme Expenditure E-Government Development Programme IT Replacement Programme Project Appraisal Assessment
Net Expenditure
600 825 750
2,175
200 275 250
725
200 275 250
725
200 275 250
725
CORPORATE PROPERTY MAINTENANCE
PROJECT Total Cost £000
2005/06 £000
2006/07 £000
2007/08 £000
Programme Expenditure CSS Capital Repairs 300 100 100 100 Education Improvement Programme 2,160 720 720 720 Recreation Improvement Programme 450 150 150 150 Community Centre Improvement Programme 150 50 50 50 Museum Building Improvement Programme 180 60 60 60 St Magnus Cathedral 390 130 130 130 Energy Conservation Programme 420 140 140 140 Administration Offices Improvements 450 150 150 150 Disability Discrimination Act Improvements 150 50 50 50 Public Conveniences 1,174 380 399 395
Expenditure Total 5,824 1,930 1,949 1,945
Sources of Funding Government Grants 818 474 172 172 Capital Receipts - Contributions 150 50 50 50 Capital Receipts - Other Grants 60 20 20 20
Income Total 1,028 544 242 242
Net Expenditure 4,796 1,386 1,707 1,703
Budget Book 2005-06 to 2007-08 70

Budget Book 2005-06 to 2007-08 71

ENVIRONMENTAL SERVICES
PROJECT Total Cost £000
2005/06 £000
2006/07 £000
2007/08 £000
Programme Expenditure Contaminated Land Waste Strategy Orkney Landscape Partnership
Expenditure Total
Sources of Funding Government Grants Capital Receipts - Other Grants
Income Total
Net Expenditure
143 414
1,187
1,744
514 1,115
1,629
115
143 414
557
514
514
43
579
579
544
544
35
608
608
571
571
37
TRANSPORTATION
PROJECT Total Cost £000
2005/06 £000
2006/07 £000
2007/08 £000
Programme Expenditure Kirkwall & Stromness Travel Centres
Expenditure Total
Sources of Funding Government Grants Capital Receipts - Contributions
Income Total
Net Expenditure
1,700
1,700
1,080 500
1,580
120
1,200
1,200
1,080
1,080
120
500
500
500
500
0
0
0
0
Note * Projects still subject to Verification
Budget Book 2005-06 to 2007-08 72

Budget Book 2005-06 to 2007-08 73

NON-GENERAL FUND
CAPITAL PROGRAMME
Budget Book 2005-06 to 2007-08 74

Budget Book 2005-06 to 2007-08 75

NON GENERAL FUND SUMMARY
PROJECT Total Cost £000
2005/06 £000
2006/07 £000
2007/08 £000
Programme Expenditure Housing - HRA Services 2,310 770 770 770 Strategic Reserve Fund 6,778 2,048 2,365 2,365 Non Transportation - Harbours 1,400 1,400 0 0 Harbours 2,136 926 955 255
Expenditure Total
Sources of Funding
12,624 5,144 4,090 3,390
Borrowing 660 220 220 220 Government Grants 262 12 250 0 Capital Receipts - Disposals 300 100 100 100 Capital Receipts - Loan repayments 600 600 0 0 Capital Receipts - Other Grants 795 265 265 265 Capital Financed from Current Revenue 10,007 3,947 3,255 2,805
Income Total 12,624 5,144 4,090 3,390
Net Expenditure 0 0 0 0
Budget Book 2005-06 to 2007-08 76

HOUSING (HRA SERVICES)
PROJECT Total Cost £000
2005/06 £000
2006/07 £000
2007/08 £000
Programme Expenditure Capital Repairs and Improvements
Expenditure Total
Sources of Funding Borrowing Capital Receipts - Disposals Capital Financed from Current Revenue
Income Total
Net Expenditure
2,310
2,310
660 300
1,350
2,310
0
770
770
220 100 450
770
0
770
770
220 100 450
770
0
770
770
220 100 450
770
0
STRATEGIC RESERVE FUND
PROJECT Total Cost £000
2005/06 £000
2006/07 £000
2007/08 £000
Programme Expenditure Property Maintenance 750 250 250 250 Contingency for Projects Arising During Year 579 200 179 200 Loganair Hanger at Kirkwall Airport 800 750 50 Marine Energy Test Centre 106 106 Community Network Infrastructure 1,128 434 367 327 Recreational Slipway - Eday 182 7 169 6 Recreational Slipway - Firth 142 1 137 4 New Creamery Store 300 300 Kirkwall Travel Centre SRF Contribution 500 500 World Heritage Area 945 463 482
* Stromness Pierhead Regeneration 1,096 1,096 * Pickaquoy Caravan Site 250 250
Expenditure Total
Sources of Funding
6,778 2,048 2,365 2,365
Capital Receipts - Contributions 600 600 Capital Receipts - Other Grants 530 265 265 Capital Financed from Current Revenue 5,648 1,448 2,100 2,100
Income Total 6,778 2,048 2,365 2,365
Net Expenditure 0 0 0 0
Budget Book 2005-06 to 2007-08 77

NON TRANSPORTATION - HARBOURS
PROJECT Total Cost £000
2005/06 £000
2006/07 £000
2007/08 £000
Programme Expenditure New Pilot Boat - Survey
* New Replacement Pilot Boat
Expenditure Total
Sources of Funding Capital Receipts - Other Grants Capital Financed from Current Revenue
Income Total
Net Expenditure
150 1,250
1,400
265 1,135
1,400
0
150 1,250
1,400
265 1,135
1,400
0
0
0
0
0
0
0
HARBOURS - CIVIL WORKS
PROJECT Total Cost £000
2005/06 £000
2006/07 £000
2007/08 £000
Programme Expenditure Minor Improvements to Piers 690 230 230 230
* Hatston Lairage 525 25 475 25 * North Pier, Stromness - Deck and Fillet 650 400 250 * Vessel Tracking System - Kirkwall Harbour 121 121 * Marshalling Area Building - Hatston Terminal 150 150
Expenditure Total 2,136 926 955 255
Sources of Funding Government Grants 262 12 250 Capital Financed from Current Revenue 1,874 914 705 255
Income Total 2,136 926 955 255
Net Expenditure 0 0 0 0
Note * Projects still subject to Verification
Budget Book 2005-06 to 2007-08 78

Budget Book 2005-06 to 2007-08 79