local government riparian buffers in the san francisco bay area
TRANSCRIPT
Local Government Riparian Buffers in the San Francisco Bay Area
San Francisco Bay Regional Water Quality Control Board
July 2004
2
Table of Contents
Introduction 3
Background 3 Purpose 3 Why Establish Creek Buffers? 4 Regulatory Context 6 Political Reality 8
Methodology 9
Limitations of Study 9 Results 11 Findings 12
Typical Issues of Controversy 12 Approaches to Regulation 13
Discussion 16
Summary of Analysis 16 Analysis/Priority for Regional Board Outreach and Implementation 16 The Role of Community Outreach 18
References 19 APPENDICES 20
A. Riparian Resources and Erosion Control Survey 21 B. Summaries of Buffer Policies and Stream Protection Approaches 23 C. Relevant factors when evaluating a stream buffer policy: 27 D. Graphical Summary of Results 28

3
I N T R O D U C T I O N Background As indicated in the Plan for California’s Nonpoint Source Pollution Control Program (Plan), the San Francisco Bay Regional Water Quality Control Board (Water Board) supports local agency efforts to reduce erosion and sedimentation and protect riparian areas. The Plan calls on local agencies to:
• Develop a technical assistance program for project design that will include guidelines for designing projects that avoid wetlands and riparian areas
• Develop a framework linking stream, hydrological, and ecological function to beneficial uses
• Develop criteria for protecting ecological functions and other beneficial use of streams • Draft Stream Protection Policy
The Water Board is currently working to support local agency efforts to enact stream protection regulations that protect and restore natural stream function. As part of that effort, the Water Board published A Primer on Stream and River Protection for the Regulator and Program Manager (April 2003), which discusses the link between channel stability and water quality and outlines ways to avoid excessive erosion and sediment deposition. The Water Board has also prepared a draft Stream Protection Policy that contains the following objectives for riparian buffer zones:
Buffer zones shall be maintained or enhanced to protect stream functions. Examples of ways in which buffer zones protect stream functions include: removing agricultural and urban stormwater pollutants, reducing sediment from upland sources, stabilizing stream banks, minimizing changes to the hydrograph by infiltrating stormwater runoff, metering stream baseflow, and supporting vegetation which provides nutrients and shade.
Purpose
This survey of local government efforts to regulate land use for the protection of water quality and habitat for aquatic species was conducted in order to:
1) Determine what land use regulations and management measures local jurisdictions are already undertaking to protect riparian corridors;
2) Inventory riparian buffer widths and the methods used to calculate the width of the buffers
3) Identify obstacles to establishing riparian protection regulations 4) Make recommendations for local governments regarding riparian buffer regulations
with the goal of drafting a model ordinance. This can serve as a point of departure for local jurisdictions crafting new or revised ordinances.

4
Many Bay Area cities and counties have riparian protection policies, rules, or ordinances and others are considering adopting such rules. As the embarks on Total Maximum Daily Load (TMDL) development and implementation and the issuance of Phase 2 Urban Stormwater Permits, we are interested in knowing how local jurisdictions regulate land use to protect water quality and preserve aquatic habitat. Other topics that will be addressed in this study are:
• The number of cities and counties that are currently working on or considering proposing riparian setback ordinances.
• The key areas of controversial issues that have arisen over riparian buffers in each community
Why Establish Creek Buffers? Stream buffers can be effectively established through a variety of planning tools, including overlay zoning, creek setback ordinances, and conservation easements. The preparation of local regulations typically involves several components. The first step is to develop the purpose and need for the regulation. Purposes and needs statements contained in ordinances typically cite public safety, hazards reduction, health, and other compelling traditional “police powers” of local government. Protection of environmental habitats has been added to these purposes recently because responsibilities for complying federal and state laws, including the federal Clean Water Act, Endangered Species Act, and the state Porter Cologne and Endangered Species Acts, are increasingly being shifted from federal and state levels to local levels. The next section describes the regulations, which must have a clear and logical connection to the purposes just described. Other sections typically describe enforcement provisions, variances allowed, and often an appeals process. Riparian zones perform many ecological functions important to enhancing water quality, water quantity, biodiversity, habitat connectivity, and flood capacity. The stream channel itself conveys runoff, supports aquatic plants and animals, provides groundwater recharge, and supplies water to trees and plants that typically thrive in the riparian zone. Stream buffers are an effective way to physically protect and separate a stream or wetland from future disturbance or encroachment. A network of stream buffers acts as a right-of-way during floods and sustains the integrity of stream ecosystems and habitat (Center for Watershed Protection, www.cwp.org/aquatic_buffers.htm). Riparian forest and wetland buffers, if properly maintained, appear to have a significant capacity to mitigate some of the effects of development. Riparian buffers protect stream function, protect habitat, and provide additional capacity for flood flow conveyance.

5
The Water Board’s Watershed Management Initiative identifies the following major non-point source problems in the San Francisco Bay Region, many of which can be partially or fully addressed through establishment of riparian buffers:
• Elimination of natural channels, including loss of wetlands, wildlife, fisheries and riparian areas;
• Increased sedimentation due to construction activities and land clearing; • Unmitigated changes in hydrology that upset the geomorphic equilibrium of
streams, causing destabilization and erosion of channels, and more frequent flooding;
• Increased pollutant loads associated with urban activities; • Impairment of fish habitat from water diversions and fish passage barriers due to
the construction of in-channel reservoirs and diversion structures, the sedimentation of channels, and the removal of vegetation; and,
• Increased pollutant loads associated with agricultural activities. Stream Function The riparian zone functions to decrease sedimentation by intercepting sediment and debris in root zones before sediment-laden runoff enters the stream system. The capture of sediments has the added benefit of trapping particle-bound chemicals and pollutants, preventing them from degrading aquatic environments. Also, the vegetation within a creek buffer will decrease erosion and allow for increased soil infiltration by stabilizing stream banks and slowing flow velocities. In some settings, intact riparian areas will remove pollutants traveling in stormwater or groundwater. Riparian Habitat The riparian zone is an ecotone, or transition zone, between aquatic and terrestrial habitats. Because riparian zones contain both aquatic and terrestrial plant and animal species they have unusually high species diversity. Riparian zones are also important migratory corridors. A continuous buffer provides migratory and wildlife corridors, which are of particular value in protecting amphibians and waterfowl populations, as well as fish spawning and nursery areas. According to the U.S. Fish and Wildlife Service, California has lost 90 percent or more of its wetlands, which includes riparian communities. This is despite the fact that according to government biologists, riparian communities in the Western states, such as California, provide habitat for up to 80 percent of western wildlife species. It is estimated that about 50 percent of endangered species require wetlands at some point in their life cycle. Flood Conveyance
Riparian zones form the part of the floodplain that is closest to the edge of the water body and are the most frequent areas to be inundated. To minimize property damage, it is advantageous for local regulations to include the entire 100-year floodplain within the riparian buffer to reduce flood risks.

6
Regulatory Context Federal Clean Water Act Sections 404 and 401 The California Regional Water Quality Control Boards review applications for water quality certifications under Section 401 of the federal Clean Water Act (CWA). CWA Section 401 is tied to CWA Section 404, which requires federally issued permits for all proposed fill and dredge activities in waters of the United States. Section 401 gives states the authority to approve, conditionally approve, or deny a Section 404 permit to ensure that federally permitted actions are consistent with state law. Section 404(b)(1) provides guidance for evaluating project alternatives. It calls for first avoiding impacts, and then minimizing impacts to assure that there is no net loss of fully functional streams, wetlands, and/or water bodies. Implementation of stream protection regulations can go a long way to avoiding impacts and can ease the Section 404/401 permit process for projects. Additionally, projects that avoid all impacts, or potential impacts to waters of the State will not require 401 water quality certification. California’s Porter-Cologne Water Quality Control Act California’s Porter-Cologne Act provides both immediate and long-term authority for the protection of the physical integrity of river and stream environments. The Act directs regional boards to regulate impacts to waters of the State by the issuance of Waste Discharge Requirements (WDRs) for any activity that results in a waste discharge that directly or indirectly impacts waters of the State. WDRs can and are being used to maintain and promote stable waterways. When used to condition discharges such as fill into a water body, WDRs may encourage a balance between erosion, sediment transport, and deposition as a means of avoiding the degradation of water quality. In the past, WDRs were primarily used to regulate point source discharges of liquid or solid waste to land (e.g., septic tank discharges, landfill operations, etc.) However, WDRs are an appropriate means to regulate discharge of waste including fill material, sediment and changes in flow to waterways. Each of the nine Regional Boards has a master policy document that describes the legal, technical, and programmatic foundation used for protecting water quality. In the Bay Area, this Water Quality Control Plan, or “Basin Plan,” details beneficial uses that are directly related to the concern of the physical integrity of stream and river channels. While there are many beneficial uses provided by aquatic ecosystems, the uses best preserved by riparian buffers are: cold freshwater habitat for trout and anadramous salmon and steelhead; fisheries migration including unimpeded river flows; preservation of rare and endangered species; and protection of wildlife habitat. These beneficial uses can be effectively protected and maintained through riparian and wetland land use regulation at the local level.

7
Federal Clean Water Act Sections 303(d) Section 303(d) of the CWA requires identification of impaired water bodies (those that do not meet water quality objectives or support designated beneficial uses). Many water bodies in the Bay Area have been listed under Section 303(d) as impaired and the Water Board is developing Total Maximum Daily Loads (TMDLs) to address these impairments. TMDLs create a plan to attain the designated water quality objectives and protect beneficial uses for impaired water bodies. Impairment due to excess sediment, nutrients, and pathogens are common in the Bay Area. The Water Board is developing TMDLs to address impaired water bodies in the Bay Area. We are encouraging a broad watershed management approach that allows for flexibility in attaining water quality goals and objectives. The TMDL may combine the concept of load allocations with aggressive Best Management Practice programs and local “commitments to action” tied to measurable factors such as extents of riparian setbacks, riparian canopy coverage, and stable vegetated stream banks. TMDLs provide an opportunity to identify and apply locally based remedies to improve watershed conditions. Endangered Species Act The Regional Board works cooperatively with the California Department of Fish and Game and the federal U.S. Fish and Wildlife Service (USFWS) and National Marine Fisheries Service (NMFS) to assist in the protection of threatened and endangered species. In June 2000, NMFS adopted regulations affecting fourteen groups of salmon and steelhead listed as threatened under the Endangered Species Act (ESA). Other listed aquatic species found in the Bay Area include freshwater shrimp, red-legged frog, western pond turtle, and other non-salmonid fish. In addition to aquatic species there are a number of threatened and endangered birds and mammals that use sensitive riparian and wetland habitat for vital life functions. The ESA provides a variety of tools for saving species threatened with extinction. Review of activities that could affect endangered aquatic species is facilitated by proactive riparian and wetland land use policies. California Environmental Quality Act The California Environmental Quality Act (CEQA) requires that the potential environmental impacts of projects be evaluated and that mitigation measures be developed to reduce any identified significant impacts. CEQA requires evaluation of hydrologic, water quality, and biotic resource impacts. Mitigation measures, developed on a project-by-project basis, often include riparian buffers. Local stream protection policies and ordinances limit development in riparian areas and can alleviate the need to conduct a project-specific impact analysis.

8
Political Reality Many cities and counties in the Bay Area are struggling to adopt stream protection policies and ordinances to provide a mechanism for complying with the wide range of water quality and endangered species regulations discussed above. However, in many jurisdictions there is concern that riparian buffers could result in undesirable restrictions on private property. These concerns can be addressed through ordinance exceptions or variance provisions. It is important for local government to initiate a stakeholder outreach and education program prior to releasing a draft ordinance for the decision-making body to consider. On the other hand, in some communities concerned citizens and environmental groups may believe that the riparian protections are not stringent enough or that enforcement mechanisms are weak. The success of riparian buffer regulation lies with the community. The community must be educated about the benefits of riparian protection, what the proposed regulations will and will not allow, how exceptions to the regulations are permitted, and finally, who will implement and enforce the ordinance.

9
M E T H O D O L O G Y In February 2003, a “Stream Protection and Erosion Control Survey” (Appendix A) was drafted by the Water Board with the intent of being administered to staff in city and county planning departments. In an effort to identify policies that contribute to sediment reduction and aquatic habitat protection throughout the San Francisco Bay region, questions were asked regarding stream and tree protection, and hillside development policies. San Francisco Estuary Project Interns Orrin Cook and Brendan Thompson conducted phone and email surveys between March and November 2003. At times, planning staff deferred questions to their jurisdictions’ public works or community development departments, who then replied to the survey questions. Between March and May 2004, the data were fact-checked to ensure that the results were current. The survey questionnaire consisted of nine questions, and question results were entered into an Excel spreadsheet and then summarized. For survey question #1, which asks if a given General Plan contains policies about the protection of riparian resources, a threshold was established whereby if the General Plan had a clear statement about restricting development in the riparian zone, then an affirmative answer would be assigned. All affirmative responses from city and county staff were checked with that jurisdictions General Plan to ensure the threshold was satisfied. For some of the cities that did not respond to the survey, we were able to access their General Plans online. These cities were included in the survey results for question #1. If the General Plan could not be accessed, then the question was not assigned a response. Survey question #3 asks if a municipality has a zoning ordinance regarding riparian buffers. If a stream buffer policy existed in the jurisdictions zoning ordinance, municipal code, or supplemental policy document, an affirmative response was assigned. General Plan policies were not included. “Easement” and “setback” policies were included in our definition of a stream buffer. For all of the questions, responses were confirmed by checking the corresponding policy document. During our study, we discovered that the initial scope of the survey was too broad, given the available resources. Information was gathered on tree protection policy, hillside development policy, and flood hazard issues (see Appendix D). Once much of these data were gathered, it was evident that there was not enough information for analytical applications. Later survey participants were given an abbreviated survey that only asked the questions of the survey that applied to issues of stream resource protection. Limitations of Study The survey began with the intention of finding several meaningful, quantitative descriptions to describe stream, tree, and hillside protection policies in the 85 incorporated cities and nine Bay Area counties within the San Francisco Bay Regional Water Quality Control Board (Region 2). Not surprisingly, the absence and presence and characteristics of these policies were not clear-cut, and did not lend themselves to be easily summarized within discrete categories. Consequently, the only absolute quantitative data we can report from this survey is the number
10
of jurisdictions with some form of riparian buffer policy in their city and county codes. We also provide a range of buffer widths prescribed by local regulation, as well as a percentage of jurisdictions with tree protection ordinances and hillside development ordinances (Appendix D). We intended to develop a rating system that would evaluate the effectiveness of the stream buffer policies. This proved to be unmanageable, as the effectiveness of a given stream buffer policy is a function of many variables. For a list of stream buffer policy characteristics that would be used to develop evaluative criteria of a given policy, see Appendix C. Additionally, we were unable to determine how closely or effectively a given jurisdiction was following their stream protection policies. It is possible that some communities protect their riparian areas more effectively through their design review process than other communities who have an established buffer policy. Although it is difficult to assess the success of these buffer policies, it can be said that vague definitions of allowable land use in buffer zones, or liberal granting of variances do not lend themselves to an effective buffer policy. We cannot guarantee the accuracy of the information provided by participants. We interviewed senior planners, principal planners, planning directors, city planners, planning managers, assistant planners, and various staff in public works departments. It is also possible that certain participants’ unfamiliarity or inexperience could have resulted in inaccurate survey replies. The reported results reflect conditions that were accurate at the time the surveys were conducted. The information was gathered between March 2003 and May 2004. Since the time interviews were done, General Plans may have been updated or new ordinances may have been implemented.
11
R E S U L T S With 89% of cities reporting, 41% have some form of a stream buffer policy in their municipal code, zoning ordinance, or supplemental policy document. Of the nine counties in the Region 2 jurisdiction, with San Francisco County not responding, 75%, or 6 of 8 have a stream buffer policy established. After examining the General Plans of 81% of the 85 Region 2 cities, we determined that 32% of those cities have General Plans describing an implementation policy that restricts development within riparian zones. A summary of some local stream buffer policies and stream protection approaches is provided in Appendix B. Of the 59% of cities that do not have a stream buffer policy, 4% are working to adopt such policies, 7% are considering the possibility, 80% are not considering adopting one, and for 9%, it is unknown whether or not they are working on or considering a buffer policy. See Appendix D for a graphical summary.

12
F I N D I N G S Typical Issues of Controversy Property Encroachment Fear of private property encroachment is the most common contention raised at the mention of stream buffer policy. Enactment of a policy has the perceived potential to restrict property owners of some uses or activities on portions of their parcels. This becomes less of an issue in communities with large lots; in cities with small lots, the buffer would have a greater effect on a landowners’ “reasonable use,” thereby making the implementation of a stream buffer policy much more difficult. Planners expressed a need to accommodate property owners who may have small parcels, or parcels with a high ratio of total property line adjoining a creek. Cupertino is the only city found with a buffer policy that establishes buffer widths based on lot size. In Cupertino, lots less than one acre in size must provide a 50-foot stream buffer zone; sites over one acre must leave 100-foot buffers. Some policies reflect other methods of protecting landowners. In 1990, when the City of San Ramon established a 100-foot stream buffer ordinance within “resource conservation areas,” properties that were already parceled prior to conservation district approval were precluded from the ordinance. In a very small percentage of jurisdictions, a proposed, amended, or approved stream buffer ordinance has met opposition from members of the community. Amidst concerns and debate from citizens opposed to regulation of private property, Napa County Supervisors adopted a stream setback Revision Ordinance that ambitiously expanded upon an existing stream buffer policy (see Appendix B). The Board of Supervisors then withdrew the ordinance after critics of the new policy submitted a referendum petition. According to a senior planner from the County, resistance came from private property owners who thought that the county was taking land unjustifiably. Private landowners argued that the science behind the stream buffer guidelines might not be valid. The fate of the ordinance was determined by a countywide vote in March 2004, whereupon it was defeated. The City of Portola Valley in San Mateo County has also been having difficulty increasing an existing 20-foot from creek center setback policy, due to property owner opposition. Many landowners have misconceptions about existing and proposed riparian buffer ordinances. Often landowners assume that their land will be transferred to public ownership. In addition, landowners are often unfamiliar with existing land use restrictions and state and federal law pertaining to wetland fill and stream alteration. (Some existing regulations are described in the Introduction). The goal of riparian buffer regulation is to reinforce at the local level Section 404 and Section 401 CWA regulations on all streams (see introduction, pg. 6) and to further provide for a setback from the top of bank to allow for improved water quality, to promote riparian habitat values, and to protect stream banks from erosion. A Napa county planner noted that if the county could start the entire process again, it would have “done more public scoping and more public education.” He emphasized the need for open workshops and town meetings with scientists present, since planners and commissioners are

13
often now well versed in stream science. Doing this, he said, would have allowed the public to better understand the environmental benefits of a stream buffer ordinance. Jurisdictional resistance Some communities, and more often community groups, have pressured their city or county to adopt a stream buffer ordinance or make an existing ordinance more stringent. However, these groups have occasionally met opposition from the city or county. The governing body often cites a lack of funding, departmental resources, or political will to pursue stream protection legislation. Instead, jurisdictions frequently respond to political pressure by focusing on the design review or permit process as a way to limit development within riparian zones. Though these results may be beneficial, the sincerity of their efforts can sometime be viewed as questionable. As one county senior planner stated, “If you throw enough money at [a proposed development], anything is possible.” This approach also leads to a case-by-case approach to stream setbacks that can be inconsistent and inefficient. In similar respect to the aggrieved property owner who must compromise development potential because of a riparian buffer, jurisdictions may tend to perceive the buffer as an expensive policy that further depletes an already finite reservoir of developable land. One city planner suggested that setting aside and preserving riparian areas would reduce the amount of land available for development, thereby adversely affecting housing availability and affordability. Development and a riparian buffer need not always be at odds with one another. We learned from the survey of one instance where the passage of a proposed large residential development would have been facilitated by the presence of a riparian buffer ordinance. The city’s conditions of approval for the development were being heavily contested partly due to public demand for a significant level of riparian protection. If the city had already had a riparian buffer ordinance in place prior to the project introduction, the developer would have presented a different plan at the outset, and the conflict could have been greatly diminished, or avoided entirely. Aside from providing the developer with a level of certainty, the city would be alleviated of the need for extra analysis within the CEQA process. Cities can provide incentives, such as housing density bonuses, for development that avoids riparian areas. Approaches to Regulation Throughout the region, cities are employing various tools to regulate riparian zones. No two are quite the same. Appendix B describes some representative policies that demonstrate the wide range of riparian resource management. The 59% of cities without a stream buffer policy do exercise some regulation of development in their riparian areas. When asked whether or not they regulate land use in riparian zones beyond state and federal law, planners often responded affirmatively, noting that through development permits and CEQA processes, riparian areas are protected. This “case-by-case,” or “project-by-project” approach to riparian regulation may result in inconsistent and
14
inadequate riparian protection. Some planners earnestly described community and planning commission support for protection of riparian resources. It was likely in many of these cities that unwritten buffer policies and other riparian protection guidelines were adhered to by the planning departments, and that even in the absence of an ordinance or formal policy, the watercourses were in good health. In other cases, a case-by-case approach is tantamount to not having a riparian protection policy. In municipalities or counties where the planning commission is more supportive of development, or community interest in preserving riparian zones is lacking, the absence of a formal policy will contribute to degradation of the riparian areas. Without a formal policy, adequate long-term creek stewardship is not assured. Virtually all the cities in the Bay Area without a stream buffer ordinance have within their General Plan a paragraph that acknowledges and praises the value of their creeks. Far fewer have implementation policies that attempt to actively preserve those waterways. The General Plan of Colma contains a recommended stream setback that does not have specific implementation policies. When a development project comes under review by the planning department, the General Plan recommended stream setback is referenced as an attempt to establish some degree of riparian protection. While such a policy is not as reliable as a code/ordinance, it provides a tool for riparian preservation where a code or ordinance does not exist. It is also an alternative approach to riparian protection for communities where a riparian buffer ordinance is not yet a political possibility. Contra Costa County also has a stream buffer policy within their General Plan. This policy is stronger than the aforementioned, because the policy is not “recommended,” but rather states that setback areas “shall be provided.” The City of San Jose has a stream buffer policy that is neither in the code nor the General Plan. The city administers a riparian buffer policy through use of a “riparian corridor study” document that describes suggested buffer widths. The document recommends a 100-foot setback, but exemptions are given that may reduce the setback to 50-foot distances. Some cities protect watercourses by requiring that development projects near riparian areas obtain a special permit. Although a stream buffer requirement is not part of the regulatory process, this approach ensures that every project adjacent to a creek will be evaluated in terms of avoiding watercourse impacts. The permit will typically have conditions of development that are designed to protect riparian functions. Jurisdictions that claim to effectively protect creeks through the design review process could adopt a permit requirement, thereby providing assurance that potential creeks impacts are receiving due consideration. The city of Oakland uses this permit approach (see Appendix B). There is much variability among the established stream buffer ordinances. Stream buffers are measured from either the top of the stream bank, the centerline of the creek, or sometimes from the outward edge of riparian vegetation. Measuring the buffer from the outward edge of vegetation has the potential to discourage property owners from preserving their riparian zones. Some ordinances use the dimensions of the stream channel to formulate a buffer width, and the calculations can get rather complicated (see Lafayette, Appendix B). Operative assumptions within these policies are that steeper and deeper channels require wider buffer widths. The cities of Orinda and Lafayette in Contra Costa County, and the County of Napa have such policies.
15
Many policies apply only to waterways that are specifically identified in the text of the codes. These policies are excellent for high-profile waterways, but can leave headwater and other unnamed tributaries unprotected. While not stream buffer policies per se, some cities and counties have floodplain ordinances that will leave a stream buffer as a consequence of limiting development within FEMA or high-risk flood zones. Contra Costa County has a Floodplain Management Ordinance that incidentally protects riparian areas by prohibiting development within a one- to two-foot elevation range above a FEMA or Floodplain Administrator-determined base flood elevation. This approach doesn’t specifically target preservation of riparian functions, and will leave higher-elevation watercourses unprotected by the ordinance.

16
D I S C U S S I O N Summary of Analysis Responses to our survey indicate that some city and county planning departments lack awareness of stream issues and functions. Many of the established stream buffer policies have ineffective or sub-optimal buffer distances for effective sediment and pathogen filtration functions. An effective buffer would require increasing buffer distances with gradients; few of the policies we researched account for this need. Also, many of the policies do not mandate that buffers apply to the entire jurisdiction, but rather to special zoning districts and/or areas within the cities and counties. Most survey participants informed us that their jurisdiction’s General Plan addressed the protection of riparian areas. Upon inspection, the Plans did often have excellent objectives to protect creeks, but the implementation measures lacked a detailed performance standard. In the cities without riparian protection policies, planners often justified their absence by citing the lack of riparian areas within their community. Analysis/Priority for Water Board Outreach and Implementation There are many areas in which the Water Board can provide regional leadership. Many city and county planners have a vague familiarity with stream issues. While some planning departments are extremely knowledgeable and competent in riparian science, many planners we spoke with were unaware of stream issues relevant to Water Board goals. Before the Water Board encourages the adoption of stream buffer policy by local jurisdictions, there must be an effort to educate the community on the water quality, habitat, and property protection benefits of stream buffers. It will be easier to argue the relevance of adopting such policies within cities or counties that still have significant amounts of undeveloped area. However, cities that have either reached, or have nearly exhausted, their reserve of developable land will need to be convinced why their communities would benefit from the enactment of a stream buffer policy. During the survey, planners from these heavily urbanized or “built-out” cities acknowledged not having or planning stream buffer policies, and justified this by mentioning that the scant developable land is generally devoid of drainages, and all existing watercourses are already in culverts, channelized, or underground. In their opinion, there is no need to adopt an ordinance to protect streams where there are none to protect. Only the most obvious of open-channel, flowing waterways are considered creeks. One city was devoid of riparian protection because, in the planner’s words, “we don’t have too many riparian zones.” This situation appears to be quite common, and is most likely a major reason why riparian issues are perceived as non-existent or irrelevant. An “out-of-sight, out-of-mind” mentality is present, where the role of watercourses in non-point source/sediment transportation is overlooked. The lack of awareness of creek functions may inhibit any beneficial regulations from being considered or enforced. In
17
a built-out community, a riparian buffer policy is critically needed to protect the remaining riparian areas from future re-zoning and/or development intensification. Survey participants had varying levels of familiarity with the stream protection policies in their jurisdictions’ General Plans, municipal codes, and zoning ordinances. A thorough knowledge of municipal code and zoning ordinance regulations was typical. However, often when planners were asked to summarize and evaluate the level of protection of riparian resources in their General Plans, they appeared to be unfamiliar with the associated policies. The apparent lack of familiarity on the part of some planners with these portions of their General Plans suggests that the Plan is not often referenced for riparian protection guidance. The Water Board should encourage actions that are consistent both with local General Plans and with code requirements. An annual training of General Plan policies for planning department employees would be a good way to ensure that the Plan has a role in the decision-making process. The Water Board should require jurisdictions to include a clear, outlined vision for the protection of their riparian areas in their General Plans. The General Plan policy must serve as guidance for each jurisdiction, and be known and used for decision-making purposes by the corresponding planning department. Implementation measures must be drafted using the active voice (word choice such as “will” and “require,” not “should” and “encourage”). We found many General Plan policies for riparian protection were written using a passive voice, suggesting that waterways protection was not a significant priority. Buffer Distances Estimates of effective buffer distances for sediment and nutrient filtration vary, but most of the scientific studies suggest distances between 50 and 100 feet for this purpose (Jones & Stokes 2002). Although any buffer distance from the top of bank is helpful for maintaining channel stability, a minimum 33-foot riparian buffer is required for contributing to a significant reduction in sediment levels (Corely et. al. 1999, Peterson et. al. 1992, as cited in Jones and Stokes 2002). In Bay Area cities, approximately 38% of stream buffer policies require a 33-foot or greater minimum buffer distance (Appendix D). The buffer distances in the region vary greatly, and it is likely that many were not chosen based upon specific buffer thresholds designed to satisfy water quality considerations. A scientifically based approach can help quantify buffer-induced benefits to water quality, thereby allowing the Board to more easily quantify TMDL reduction amounts when communicating with the region cities.

18
Preserving headwater drainages is a critical step in environmental protection and must be conveyed. The culverting and filling of these typically ephemeral watercourses will concentrate flows and destabilize creek channels downstream. Within the assorted stream buffer policies we reviewed, “first-order” or “headwater” streams were not specifically identified as watercourses to be protected. However, these streams would be subject to protection in the jurisdictions in which buffer policies identify ephemeral streams as part of the stream network. An additional and important level of protection is given to these streams in the jurisdictions that require wider buffer widths with increasing slope. These streams are typically regulated under sections 404 and 401 of the CWA for fill or alteration of the channel. Grading and Hillside Ordinances Another possibility for protecting headwater streams is through local grading and hillside development ordinances. Many jurisdictions either prohibit or limit development beyond a particular average slope threshold. These regulations have the effect of incidentally protecting first-order drainages, but are not a guarantee that these headwater streams will be preserved. While a potentially important tool for maintaining the functional integrity of higher-elevation riparian zones and for reducing erosion, these policies are limited to areas that meet a locally determined slope threshold, and therefore, are not substitutes for a stream buffer policy. However, communities that are built-out at lower elevations could provide a significant level of protection for their creeks by implementing protection within their grading policies in lieu of formal stream buffer regulations. The Role of Community Outreach Jurisdictions looking to adopt a stream buffer ordinance should, in general, open the process for public participation and comment. Governments that do not address community concerns or provide scientific justification face the possibility of public outcry and backlash similar to what happened in Napa County. Community outreach and education is especially key in areas where lack of information or misinformation has formed a foundation of opposition. This can include areas with strong agricultural communities or areas with expensive hillside lots.

19
R E F E R E N C E S Castelle, A.J., A.W. Johnson, and C. Conolly. 1994. Wetland and Stream Buffer Size Requirements - A Review. Journal of Environmental Quality 23: 878-882. Center for Watershed Protection. 2000. Principals of Watershed Protection. http://www.cwp.org. Center for Watershed Protection. Site Planning for Urban Stream Protection. http://www.cwp.org. Center for Watershed Protection. Watershed Protection Techniques. 1(4): 155-163; 1(1): 19-21. Corely, C.J., G.W. Frasier, M.J. Trlica, F.M. Smith, and E.M. Taylor, Jr. 1999. Technical Note: Nitrogen and phosphorous in runoff from two montane riparian communities. Journal of Range Management: 52 (6): 6000-6005. Dahl, T.E., U.S. Fish and Wildlife Service, U.S. Department of the Interior. 1990. Wetlands Losses in the United States, 1780’s to 1980’s A Report to Congress. Gregory, S.V., F.J. Swanson, W.A. McKee, and K.W. Cummins. 1991. An Ecosystem Perspective of Riparian Zones. BioScience 41:540-551. Heraty, M. 1993. Riparian Buffer Programs: A Guide to Developing and Implementing a Riparian Buffer Program as an Urban Stormwater Best Management Practice. Metropolitian Washington Council Government U.S. EPA Office of Oceans, Wetlands, and Watersheds 152 pp. Jones & Stokes. October 18, 2002. Stream Setback Technical Memorandum. L.R. Johnson Associates. 1989. Interagency Task Force on Floodplain Management, A Status Report on the Nations’ Floodplain Management Activity. April. Petersen, R.C., L.B.M. Petersen, and J. Lacoursiere. 1992. A building block model for stream restoration. pp. 293-309. In: River Conservation and Management., P.J. Boon, P. Calow and G.E. Petts (eds). Chichester: John Wiley. Verpeet, Karen. 2001. Protecting Streams and Riparian Habitat, Sonoma County, California. Sonoma Ecology Center, July.

20
A P P E N D I X E S
21
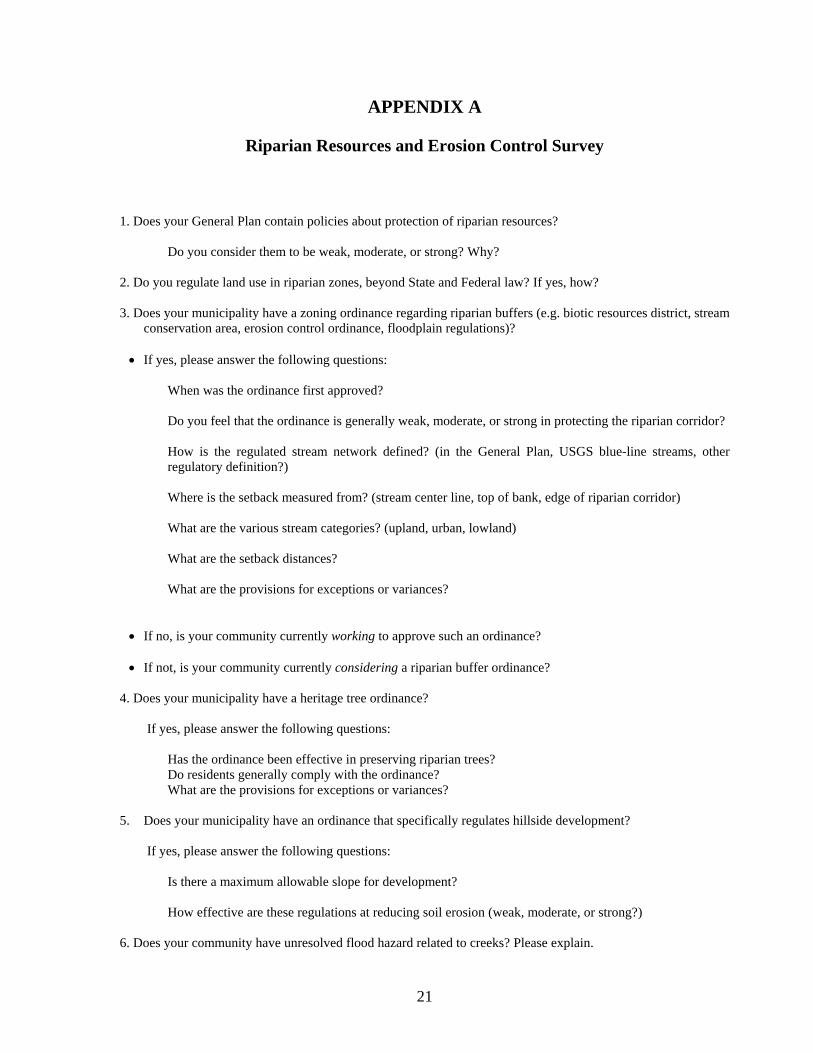
APPENDIX A
Riparian Resources and Erosion Control Survey 1. Does your General Plan contain policies about protection of riparian resources? Do you consider them to be weak, moderate, or strong? Why? 2. Do you regulate land use in riparian zones, beyond State and Federal law? If yes, how? 3. Does your municipality have a zoning ordinance regarding riparian buffers (e.g. biotic resources district, stream
conservation area, erosion control ordinance, floodplain regulations)?
• If yes, please answer the following questions:
When was the ordinance first approved? Do you feel that the ordinance is generally weak, moderate, or strong in protecting the riparian corridor?
How is the regulated stream network defined? (in the General Plan, USGS blue-line streams, other regulatory definition?)
Where is the setback measured from? (stream center line, top of bank, edge of riparian corridor)
What are the various stream categories? (upland, urban, lowland)
What are the setback distances? What are the provisions for exceptions or variances?
• If no, is your community currently working to approve such an ordinance?
• If not, is your community currently considering a riparian buffer ordinance? 4. Does your municipality have a heritage tree ordinance? If yes, please answer the following questions:
Has the ordinance been effective in preserving riparian trees? Do residents generally comply with the ordinance?
What are the provisions for exceptions or variances? 5. Does your municipality have an ordinance that specifically regulates hillside development?
If yes, please answer the following questions:
Is there a maximum allowable slope for development?
How effective are these regulations at reducing soil erosion (weak, moderate, or strong?) 6. Does your community have unresolved flood hazard related to creeks? Please explain.

22
Are there any plans for flood control projects? 7. What are the main controversies, if any, regarding riparian protection in your community? (property rights
advocates, environmental groups want better protection, etc.) 8. Has there been any litigation regarding your stream protection regulations? 9. How can we get a copy of your General Plan or stream/tree/hillslope regulations? Additional comments:

23
APPENDIX B
Summaries of Buffer Policies and Stream Protection Approaches
Oakland, Alameda County In December 1997 the City of Oakland amended their Stormwater Ordinance to include a heightened level of protection to the city’s many riparian areas. While not a setback policy, the ordinance requires that construction and development projects nearby creeks first obtain a “creek protection permit” from the city. In order to get permit approval, the applicant must meet criteria and guidelines that are intended to either minimize or avoid negative impacts to the creek area and its natural functions. Activities that are typically not allowed by the city include: construction of structures across a creek; agricultural activities on the creek banks; any disturbance of the creek channel and flow; removal of tree canopies, and the installation of structures on the creek bank. The City is amending the ordinance to include more-specific standards and guidelines for the development of creekside properties. The standards and guidelines will include criteria regarding slope, soils, flows and types of vegetation, and provide guidance on appropriate setbacks and mitigation measures for development. The amended ordinance will also provide a detailed map of creekside properties subject to the policy.
Fremont, Alameda County In November 2002, Fremont adopted Measure T that among other things stated, “No development shall be located within a riparian corridor except for otherwise permitted flood control, erosion control, water supply, transportation facilities, fences or hiking or equestrian trails. ‘Riparian corridors’ are the areas within 200 feet from the center of a permanent or intermittent stream bed.” Measure T, however, was geared only at the zone delineated as “Hill Area,” which included the Open Space zone and two residential districts. The 200-foot buffer is not applied elsewhere in the city. Other riparian areas in Fremont are protected via the Fremont General Plan and the design review process. A General Plan implementation policy requires that as part of a development application, the “extent and characteristics of riparian corridors shall be carefully assessed to a minimum distance of 100 feet from the center of the creek bed.”
24
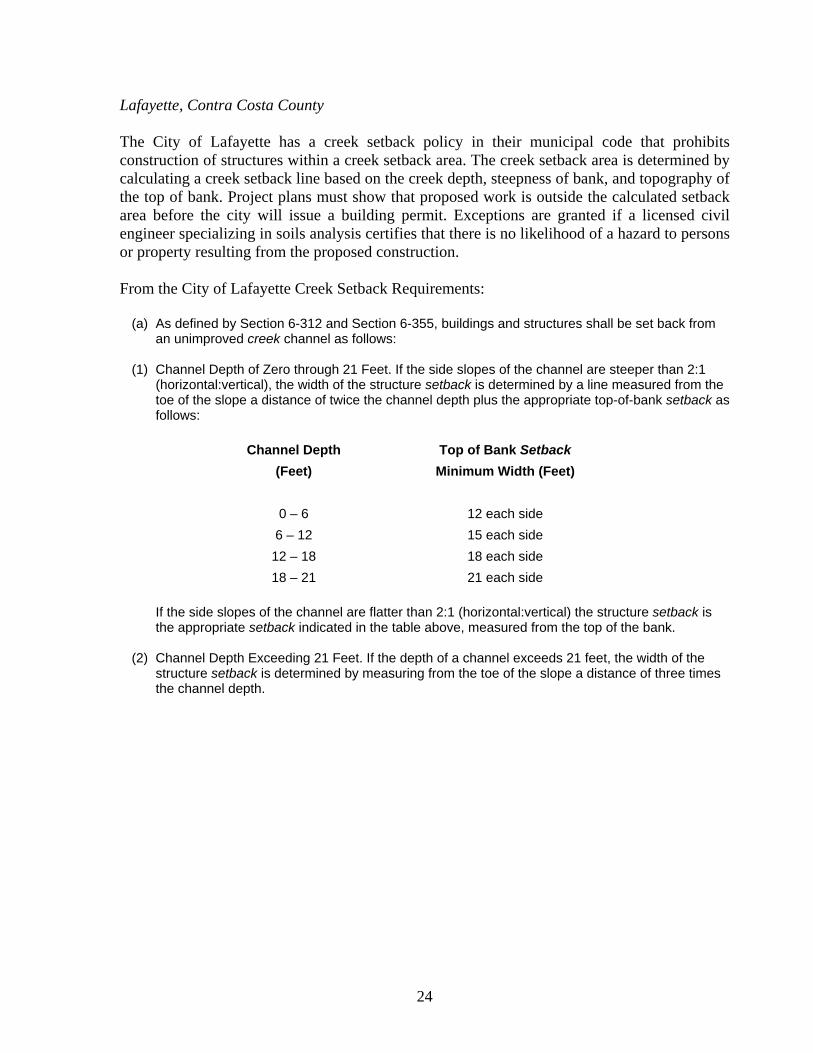
Lafayette, Contra Costa County The City of Lafayette has a creek setback policy in their municipal code that prohibits construction of structures within a creek setback area. The creek setback area is determined by calculating a creek setback line based on the creek depth, steepness of bank, and topography of the top of bank. Project plans must show that proposed work is outside the calculated setback area before the city will issue a building permit. Exceptions are granted if a licensed civil engineer specializing in soils analysis certifies that there is no likelihood of a hazard to persons or property resulting from the proposed construction. From the City of Lafayette Creek Setback Requirements:
(a) As defined by Section 6-312 and Section 6-355, buildings and structures shall be set back from an unimproved creek channel as follows:
(1) Channel Depth of Zero through 21 Feet. If the side slopes of the channel are steeper than 2:1
(horizontal:vertical), the width of the structure setback is determined by a line measured from the toe of the slope a distance of twice the channel depth plus the appropriate top-of-bank setback as follows:
Channel Depth Top of Bank Setback
(Feet) Minimum Width (Feet)
0 – 6 12 each side 6 – 12 15 each side
12 – 18 18 each side 18 – 21 21 each side
If the side slopes of the channel are flatter than 2:1 (horizontal:vertical) the structure setback is the appropriate setback indicated in the table above, measured from the top of the bank.
(2) Channel Depth Exceeding 21 Feet. If the depth of a channel exceeds 21 feet, the width of the
structure setback is determined by measuring from the toe of the slope a distance of three times the channel depth.
25
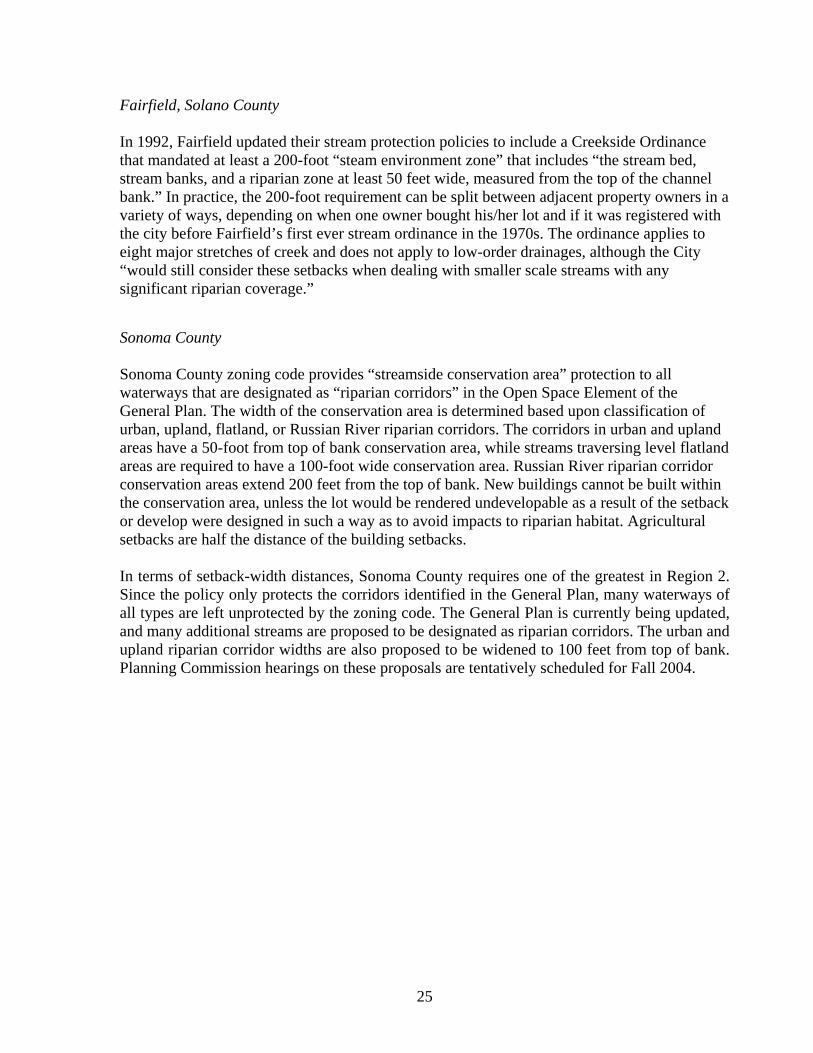
Fairfield, Solano County In 1992, Fairfield updated their stream protection policies to include a Creekside Ordinance that mandated at least a 200-foot “steam environment zone” that includes “the stream bed, stream banks, and a riparian zone at least 50 feet wide, measured from the top of the channel bank.” In practice, the 200-foot requirement can be split between adjacent property owners in a variety of ways, depending on when one owner bought his/her lot and if it was registered with the city before Fairfield’s first ever stream ordinance in the 1970s. The ordinance applies to eight major stretches of creek and does not apply to low-order drainages, although the City “would still consider these setbacks when dealing with smaller scale streams with any significant riparian coverage.” Sonoma County Sonoma County zoning code provides “streamside conservation area” protection to all waterways that are designated as “riparian corridors” in the Open Space Element of the General Plan. The width of the conservation area is determined based upon classification of urban, upland, flatland, or Russian River riparian corridors. The corridors in urban and upland areas have a 50-foot from top of bank conservation area, while streams traversing level flatland areas are required to have a 100-foot wide conservation area. Russian River riparian corridor conservation areas extend 200 feet from the top of bank. New buildings cannot be built within the conservation area, unless the lot would be rendered undevelopable as a result of the setback or develop were designed in such a way as to avoid impacts to riparian habitat. Agricultural setbacks are half the distance of the building setbacks. In terms of setback-width distances, Sonoma County requires one of the greatest in Region 2. Since the policy only protects the corridors identified in the General Plan, many waterways of all types are left unprotected by the zoning code. The General Plan is currently being updated, and many additional streams are proposed to be designated as riparian corridors. The urban and upland riparian corridor widths are also proposed to be widened to 100 feet from top of bank. Planning Commission hearings on these proposals are tentatively scheduled for Fall 2004.

26
Napa County The Napa County Conservation Regulations has been in use since 1991. They use slope percentage adjacent to creeks to formulate required setbacks that range from 35–150 feet. Protected waterways include: those designated by “a solid line or dash and three dots symbol” on the U.S. Geological Survey topographic map; watercourses with well-defined channels at least four-feet deep; and banks steeper than 3:1 (horizontal:vertical) with hydrophilic vegetation or specific streams specified by resolution by the County Board of Supervisors. The Napa County Board of Supervisors voted 3-1 to adopt a Stream Setback Revision Ordinance on April 8, 2003. This ordinance would have, among other things, increased standard stream setbacks for non-residential projects to 100 to 150 feet on all Class I streams depending on slope, 75 to 150 feet on all Class II streams depending on slope, and 25 feet on all Class III streams. Community critics of the policy, led by property owners who felt the ordinance imposed on their land ownership rights, successfully organized a referendum petition, and the Board of Supervisors reversed their adoption of the policy. The Board of Supervisors decided to put the issue before Napa County voters. The Ordinance was presented as Measure P in March 2004, and was voted down with a 65% majority.

27
APPENDIX C
Relevant Factors When Evaluating Stream Buffer Policies A city or county with a setback policy is not necessarily more effective at protecting riparian habitat and functions than a city without a policy. The mindfulness and determination on the part of city and county planners to be aware of potential riparian impacts from all development projects is a vital part of riparian protection. Nevertheless, the effectiveness of a given stream buffer or setback policy is a function of several factors, and a successful ordinance will address some or all of these criteria:
• Buffer width • Level of enforcement
• Type of watercourses protected
• Breadth of application (i.e., entire city, special districts) • Provisions for, and frequency of, exemptions and/or variances
• Inclusion of specific directives in General Plan • Riparian vegetation protection
• Mitigation standards • Clarity of purpose, goals
• Clarity of definitions

28
Appendix D
Graphical Summary of Results

RWQCB Region 2 Cities - Stream Buffers
Without or not consideringstream buffers
45 (59%)
With streambuffers
31 (41%)
Not known/ unsure4 (9%)
Working on policy2 (4%)
No current plans to
adopt stream buffer policy
36 (80%}
Policy under consideration
3 (7%)
Unknown10%
Variable-width stream
buffers12 (44%)
Fixed-width stream buffers
15 (56%)
76 of 85 (89%) of cities reporting
29

30
No47 (68%)
Yes22 (32%)
RWQCB Region 2 Cities - Stream Buffer Protection in General Plan
RWQCB Region 2 Cities - Tree Ordinance
Yes44 (70%)No
19 (30%)
RWQCB Region 2 Cities - Hillside Ordinance
Yes36 (64%)
No20 (36%)
*69 of 85 (81%) of cities reporting
*63 of 85 (73%) of cities reporting
*56 of 85 (65%) of cities reporting

31

32
Variation in Bay Area Stream Buffer Distances (fixed width)
0 20 40 60 80 100 120 140 160 180 200 220
Benicia
Fairfax
Novato
San Anselmo
San Carlos (3 creeks only)
San Rafael
Albany
Los Altos Hills
San Jose
Alameda County
Woodside (greater distance of the two)
Woodside (greater distance of the two)
Portola Valley
Berkeley
San Ramon (upland areas only)
Fremont (hill area only)
Yountville (Hopper Creek only)
distance (feet)
Measured fromcenter of creek
Measured fromtop of bank32

33
0 20 40 60 80 100 120 140 160 180 200 220
top of bank distance (feet)
Sonoma (specific creek)
Fairfield (historical development)
Ross (structure type)
San Rafael (acreage)
Half Moon Bay (stream type)
Cupertino (lot size)
San Jose (exception criteria)
Calistoga (slope)
Sonoma County (stream designation)
Napa County (slope)
Marin County (district)
Mun
icip
ality
(var
iabl
e us
ed to
det
erm
ine
buffe
r wid
th)
Variation in Bay Area Stream Buffer Distances (variable width)
33