local propensities and statistical potentials of backbone dihedral angles in proteins
TRANSCRIPT

doi:10.1016/j.jmb.2004.06.091 J. Mol. Biol. (2004) 342, 635–649
Local Propensities and Statistical Potentials ofBackbone Dihedral Angles in Proteins
Marcos R. Betancourt* and Jeffrey Skolnick
University at Buffalo Center ofExcellence in Bioinformatics901 Washington St., Suite 300Buffalo, NY 14203, USA
0022-2836/$ - see front matter q 2004 E
Abbreviations used: PDB, Proteinresidue secondary structure depth;based potentials.
E-mail address of the [email protected]
The following three issues concerning the backbone dihedral angles ofprotein structures are presented. (1) How do the dihedral angles of the 20amino acids depend on the identity and conformation of their nearestresidues? (2) To what extent are the native dihedral angles determined bylocal (dihedral) potentials? (3) How to build a knowledge-based potentialfor a residue’s dihedral angles, considering the identity and conformationof its nearest residues? We find that the dihedral angle distribution for aresidue can significantly depend on the identity and conformation of itsadjacent residues. These correlations are in sharp contrast to the Floryisolated-pair hypothesis. Statistical potentials are built for all combinationsof residue triplets and depend on the dihedral angles between consecutiveresidues. First, a low-resolution potential is obtained, which onlydifferentiates between the main populated basins in the dihedral angledensity plots. Minimization of the dihedral potential for 125 test proteinsreveals that most native a-helical residues (89%) and a large fraction ofnative b-sheet residues (47%) adopt conformations close to their native one.For native loop residues, the percentage is 48%. It is also found that thisfraction is higher for residues away from the ends of a or b secondarystructure elements. In addition, a higher resolution potential is built as afunction of dihedral angles by a smoothing procedure and continuousfunctions interpolations. Monte Carlo energy minimization with thispotential results in a lower fraction for native b-sheet residues. Never-theless, because of the higher flexibility and entropy of b structures, theycould be preferred under the influence of non-local interactions. In general,most a-helices and many b-sheets are strongly determined by the localpotential, while the conformations in loops and near the end of b-sheets aremore influenced by non-local interactions.
q 2004 Elsevier Ltd. All rights reserved.
Keywords: protein folding; knowledge based potentials; protein secondarystructure; backbone dihedral angles; Ramachandran plots
*Corresponding authorIntroduction
The relation between the structure of a proteinand its energy is the central problem in proteinmodeling. The overall structure of proteins can bedescribed by their backbone dihedral angles.Regular patterns in dihedral angles are indicativeof the protein’s secondary structure such asa-helices and b-sheets.1 A way to visualize theallowed values of the dihedral angles and their
lsevier Ltd. All rights reserve
Data Bank; RSSD,KBPs, knowledge
ing author:
populations is by generating Ramachandran plots,2
which show the correlations between the f, jdihedral angles. Recently, Hovmoller et al.3 studiedthe Ramachandran plots of native proteins for eachindividual amino acid. This calculation was madepossible by the abundant number of availableprotein structures that have been determinedexperimentally. The results show marked differ-ences between the plots of different amino acidresidues.
The type of secondary structure and dihedralangles the residues adopt are determined from abalance between local interactions (those close insequence) and non-local ones. The population ofdihedral angles in a Ramachandran plot is a partialreflection of the local interaction free energies.
d.

636 Backbone Statistical Potential for Proteins
Effective statistical potentials can be extracted fromthese populations. In recent quantum mechanicalcomputations on peptides, a remarkable agreementwas found between the peptides’ (relative)
Figure 1. (a) Combined f, j free energy contour plot forall residues (except Pro). High energy regions wereeliminated for clarity. The data for this and all otherfree-energy plots are interpolated by the contour plotalgorithm. The basins are defined by the outer contourlines and the following conditions: A (130%f!360,K100%j!50); B (130%f!360, 50%j!260); C1(0%f!130, K100%j!100); and C2 (0%f!130,100%j!260). (b) u, j density plot for Pro. The basinsare defined by the outer contour lines and followingconditions: D falls in the (K100%u!90) range and E fallsin the (K450%u!K100) range. The j angle boundariesare: D1 (90%j!230), D2 (K130%j!30), D3 (30%j!90), E1 (90%j!230), and E2 (K130%j!90). (c) Normal-ized scale.
conformational energies and the statistical poten-tials retrieved from their crystal structures.4 Suchlocal potentials could be combined with non-localpotentials to study protein folding. We can expectthat the role of a local potential is to reduce theaccessible conformational space of a polypeptide byrestricting and biasing the dihedral angles to valuespreferred by the local sequence arrangements.5
The growing number of protein structuresdeposited in the Protein Data Bank (PDB) allowsthe study of the free energies involving higherdihedral angle correlations. Ramachandran plotsfor a particular residue can be affected by the natureof the adjacent residues due to their own torsionalpropensities and side-chain interactions. It has beenargued on the basis of the conformational enumer-ation of polyalanyl chains5 and molecular dynamicsimulations of monomers, dimers, and trimers6 thatthe Ramachandran basin populations are affectedby their nearest neighbors, in contrast to the Floryisolated-pair hypothesis. Other molecular dynamicsimulations on polyalanyl chains7 have suggestedthat non-local interactions of more than fiveresidues away do not violate the Flory isolated-pair hypothesis, but local ones do. The populationsare affected, in particular, by the neighbor’sconformation and their identity.6 It can be expectedthat correlations between a residue’s conformationand that of its neighbors are responsible forcooperative effects that enhance the formation ofregular secondary structures.
The purpose of this work is to study the effects ofthe nearest neighbors’ identity and conformation onthe backbone dihedral angle populations of proteinresidues in their native state and to derive corre-sponding dihedral angle statistical potentials thatinclude these effects. Pairwise correlations betweenthe f, j angles (or u for proline) are determined forall combinations of three residues. They includeangle correlations between different residues, suchas the j angle of a residue with the j angle of itsneighbors. These correlations are used to build lowand high-resolution dihedral angle statistical poten-tials. The low-resolution potentials differentiatemainly between coiled and extended states. Low-resolution free energies are compared to the onesobtained independently of the adjacent residuetypes and are used to determine to what extentthey determine the native secondary structure ofproteins. The high-resolution potential, involving afiner dihedral angle partition, is computed andfitted to continuous periodic functions. The resultsof the minimization of this potential for a group ofproteins are described.
Results
General sequence fragments properties
Figure 1(a) shows the Ramachandran free-energycontour plot for all residues excluding proline.The data come from the structures of high quality

Backbone Statistical Potential for Proteins 637
non-homologous proteins (see Materials andMethods). The free energy is given by:
Vðf;jÞZKln½1CNðf;jÞ� (1)
where N(f,j) is the number of residues withdihedral angles f, j. The f, j space was dividedin 64!64 bins. Note that adding one to N(f,j)avoids infinities for bins with no data and sets areference zero potential. For proline, an analogousRamachandran plot was generated by replacing fwith u as shown in Figure 1(b). Proline’s f angle isnearly fixed while its u angle (the one preceding f)is more variable and therefore provides moreinformation on the residue backbone conformation.For future reference, we loosely label differentregions of the Ramachandran plots as shown inFigure 1. Regions A1 and A2 contain anglespredominant in right-handed a-helices. There is asharp peak at A1, where the regular right-handeda-helices are located. A2 is a smaller peak contain-ing the more deformed helices, such as short helicesor helix ends.3 Loops and some unpaired sheets arealso contained in A1 and A2. For convenience,regions A1 and A2 are collectively called A. Asimilar convention is used for the other regions. B1and B2 contain parallel and antiparallel b-sheets. B3is mostly populated by loops and unpaired bstrands. C1 contains left-handed a-helices andturns, and C2 is generated mainly by glycine inloops. Smaller regions could be identified,8 butthese suffice for our purposes. For proline (Figure1(b)), five regions are defined. D1, E1 and D3correspond to the same j range as the B regionwhile D2 and E2 correspond to the A j range. In D,proline is in the trans conformation while in E it is inthe cis conformation.
The conformations of 755,973 consecutive three-residue combinations (triplets) were used forobtaining higher dihedral angle correlations. The
Table 1. Number of triplets for each amino acid (aa)
aa Triplets aa Triplets
Ala 57,270 Gln 30,721Arg 38,318 Glu 49,775Asn 35,573 Gly 52,383Asp 44,809 His 19,359Cys 12,160 Ile 44,893
The total number of triplets is 755,973 (see Materials and Methods).
Table 2. Triplets with the lowest and highest samples C
Lowest samples
Triplet Co C ðCKCoÞ=ffiffiffiffiffiffiCo
pCMW 2.94 1 K1.13WCW 4.33 1 K1.60CCC 2.94 2 K0.55CMC 2.94 2 K0.55CWF 3.04 2 K0.60
Co is the expected samples, estimated from the number of residues o
number of residues of each type are shown in Table1, which correspond to the proportions commonlyobserved.1 The distribution of triplet samples in ourset is Poisson-like, ranging from 1 to 449, with amaximum peaking around 40 samples. On anaverage, there are 94 samples per triplet, whichshould provide sufficient data for our statistics.Only for a small fraction of triplets, the number ofsamples becomes inadequate. For example, 8% ofthe triplets have less than 20 samples. The observedappearance of some residues deviate from what isexpected at random, based on the number ofresidues of each type. Table 2 shows the tripletswith lowest and highest samples. As expected,triplets containing Cys and Trp are less common,while those containing Ala and Leu are morecommon. The Table also shows the deviation fromthe expected (random) value, Co in units oftheir estimated standard deviation ð
ffiffiffiffiffiffiCo
pÞ, i.e. the
Z-score. Co is proportional to the product of thesingle residue probabilities. For the less abundanttriplets, the deviation is not too significant, while forthe more abundant ones, their deviation is muchmore significant. Table 3 shows the triplets withextreme deviations from the expected numbers. Thetriplet with the largest deviation is HHH. Many ofthese HHH triplets arise as part of histidine tags. Acloser examination shows that these tags contain sixhistidine residues or less and their dihedral anglesare spread over the A and B Ramachandran regionswith no noticeable biases. The triplets with extremedeviations also show a frequent appearance ofproline at the center position. In spite of theseextreme cases, the number of repeated triplets isstrongly correlated to the expected values, with acorrelation coefficient of 0.97 and a linear regressionslope of 0.997.
The low sequence identity criteria on the data setdoes not exclude the possibility of repeated
aa Triplets aa Triplets
Leu 62,916 Ser 44,898Lys 45,625 Thr 41,922Met 17,315 Trp 11,752Phe 32,288 Tyr 28,888Pro 32,863 Val 52,245
Highest samples
Triplet Co C ðCKCoÞ=ffiffiffiffiffiffiCo
pAAA 328.68 449 6.64ALA 361.08 435 3.89LAA 361.08 434 3.84AAL 361.08 411 2.63ALL 396.68 394 K0.13
f each type. (CKCo)ffiffiffiffiffiffiCo
pis an estimate of the samples Z-score.

Table 3. Triplets with extreme deviations from average (Z-score)
Less than expected More than expected
Triplet Co C ðCKCoÞ=ffiffiffiffiffiffiCo
pTriplet Co C ðCKCoÞ=
ffiffiffiffiffiffiCo
pGPP 98.99 30 K6.93 HHH 12.70 74 17.20KPP 86.22 32 K5.84 NPE 101.82 186 8.34LIL 310.95 211 K5.67 TPE 119.99 209 8.13DPP 84.68 33 K5.62 HPD 49.88 104 7.66PPD 84.68 33 K5.62 LEK 250.01 364 7.21
C and C0 are the actual and expected triplet samples, respectively.
Table 4. Observed and expected quintuplet samples
Samples C Co Samples C Co Samples C Co
1 472,718 498,980 5 1279 350 9 18 02 93,646 97,046 6 392 25 10 7 03 20,690 16,417 7 157 6 11 0 04 5108 2241 8 61 0 12 2 0
The expected numbers are estimated from the residues numbers. One additional observed event with 30 samples for HHHHH wasomitted from the Table.
638 Backbone Statistical Potential for Proteins
sequence fragments of significant length. However,these are very rare. Analysis of fragments with fiveresidues (quintuplets) gives a good idea of theprobability of finding longer repeated sequences inour set. The number of combinations of quintupletsis 3,200,000, which is more than four times largerthan the number of quintuplets available. Thedistribution of quintuplet appearances is sharplypeaked around one. Table 4 shows the distribution.Around 99% of the quintuplets appear four times orless. The distribution is very close to the expectedone based on the residue abundance. The threemost common quintuplets (along with their counts)are HHHHH:30, AAAAA:12, and AALAA:12.Most of the histidine quintuplets belong to histi-dine sextuplet tags. These results show that thestatistics obtained for triplets are not significantlybiased by longer homologous sequences and thatthere is not much general information that can beobtained from longer continuous sets of residuesbecause of their low count. Note that an exception
Table 5. Basin probabilities for the 20 amino acids, independ
A B C1 Out
Ala 0.64 0.34 0.01 0.01Arg 0.59 0.38 0.03 0.01Asn 0.49 0.39 0.11 0.01Asp 0.54 0.39 0.05 0.01Cys 0.44 0.53 0.02 0.00Gln 0.61 0.35 0.03 0.01Glu 0.66 0.31 0.02 0.01Gly 0.22 0.24 0.31 0.12His 0.50 0.45 0.04 0.01Ile 0.46 0.54 0.00 0.00
Out is the probability of being outside the basins. In addition, Gly hasD1 0.51; D2 0.41; D3 0.02; E1 0.03; E2 0.01; out 0.03.
to the latter remark comes from the possibility ofusing a lower resolution description of the aminoacid types.9
Dependency of a residue’s dihedral angles on itsneighbor residue types
The influence of the nearest neighbor’s identityon the amino acid dihedral angles can be measuredin part by looking at the changes in probability ofbeing in each of the individual basins shown inFigure 1, with and without considering the neigh-bor’s identity. In particular, the basins are definedby the outer contour lines, which contain more than99% of the cases, and the boundaries described ineach Figure caption. The few angles falling outsidethe outer contour lines are left unclassified. For eachresidue, the f, j basin probability is computed,both independent of and as a function of theadjacent residue types. For each basin, the differ-ence between these probabilities (i.e. neighbor
ent of the adjacent residue composition
A B C1 Out
Leu 0.59 0.40 0.01 0.00Lys 0.60 0.36 0.03 0.01Met 0.57 0.41 0.01 0.00Phe 0.48 0.50 0.02 0.00Ser 0.50 0.47 0.02 0.01Thr 0.47 0.52 0.00 0.01Trp 0.52 0.46 0.01 0.01Tyr 0.48 0.50 0.02 0.01Val 0.42 0.58 0.00 0.00
a probability of 0.12 of being in C2. For Pro, the probabilities are:

Figure 2. Probability difference between the singleresidue and the triplet probabilities for basins (a) A, (b) B,and (c) C1. All residue types were used except for Pro asthe center residue.
Figure 3. f, j free energy plot examples for tripletscomposed of Ala and Asn, followed by different residues.The residues are labeled as iK1, i, iC1 and the anglesbelong to the center residue i.
Backbone Statistical Potential for Proteins 639
dependent probabilityKneighbor independent prob-ability) is computed, giving an indication of howmuch the basin probability changes when the neigh-bor identities are considered. Note that this does notconsider the conformations of the neighbors. Table 5shows the basin probabilities for the 20 amino acids,computed independently from the neighbors’ iden-tities. Most residues have a higher probability of beingin the A basin, except for Val, Ile, and Cys, which havea dominant probability of being in the B basin.
640 Backbone Statistical Potential for Proteins
Plots with the distribution of probability differ-ences for basins A, B, and C1 are shown in Figure2(a)–(c), respectively. Only triplets with 20 events ormore were used in this calculation. In addition,proline residues occupying the triplet center wereexcluded. Figure 2(a) shows a significant deviation,especially below zero. The distribution has a longtail consisting of triplets with reduced probability.Many of these triplets are residues followed by aproline. It is well known that proline residues affectthe conformation of their adjacent residue on theiramino-terminal side.10,11 As the data show, theyreduce the probability of being in basin A. Manyother triplets in this tail contain Val and Ile residues.On the other side of the distribution, many tripletsare surrounded by Ala and Leu, but no long tail isobserved. No correlation between the probabilitydifferences and the number of events for each tripletis found, showing that the deviations from zero arenot due to low data statistics (except below 20 events).The distribution for the B basin (Figure 2(b)) shows
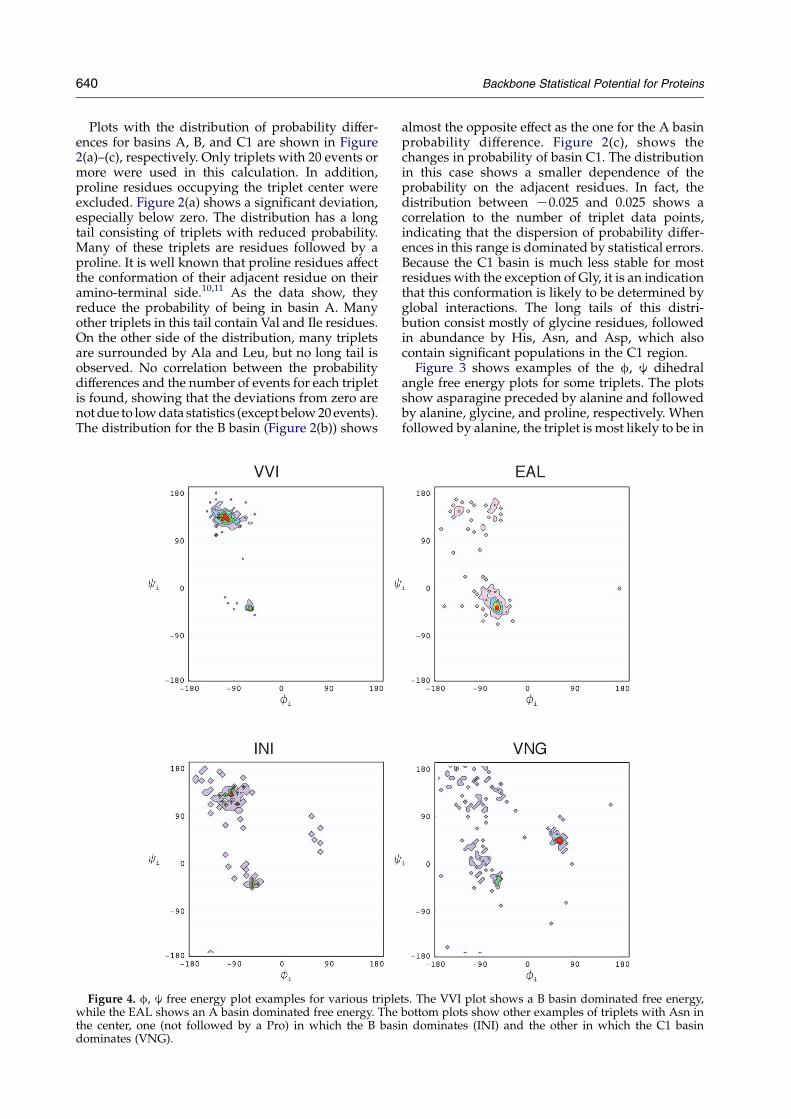
Figure 4. f, j free energy plot examples for various triplewhile the EAL shows an A basin dominated free energy. Thethe center, one (not followed by a Pro) in which the B basidominates (VNG).
almost the opposite effect as the one for the A basinprobability difference. Figure 2(c), shows thechanges in probability of basin C1. The distributionin this case shows a smaller dependence of theprobability on the adjacent residues. In fact, thedistribution between K0.025 and 0.025 shows acorrelation to the number of triplet data points,indicating that the dispersion of probability differ-ences in this range is dominated by statistical errors.Because the C1 basin is much less stable for mostresidues with the exception of Gly, it is an indicationthat this conformation is likely to be determined byglobal interactions. The long tails of this distri-bution consist mostly of glycine residues, followedin abundance by His, Asn, and Asp, which alsocontain significant populations in the C1 region.
Figure 3 shows examples of the f, j dihedralangle free energy plots for some triplets. The plotsshow asparagine preceded by alanine and followedby alanine, glycine, and proline, respectively. Whenfollowed by alanine, the triplet is most likely to be in
ts. The VVI plot shows a B basin dominated free energy,bottom plots show other examples of triplets with Asn inn dominates (INI) and the other in which the C1 basin

Backbone Statistical Potential for Proteins 641
the A basin. With glycine, the plot shows twonoticeable differences. First, the probability of beingin the C1 region is slightly larger. Second, the peakin the A basin has shifted from A1 to A2. BecauseA1 is a typical a-helical region and A2 morecommon in loops, we should expect the tripletANG to be found in or near loops most of the time.When asparagine is followed by a proline, thepopulation shifts almost entirely to the B basin.
Figure 4 shows other examples. The top two casesare strong deviations from the single residue casefor Val and Ala. VVI shows a high probability ofbeing in the B1 region, typical of b structures.Individually, valine and isoleucine residues have aslight preference to be in the B basin, but when theyare together the preference is much strongershowing a cooperative behavior. Conversely,EAL is most likely (88% of the time) to be in theA1 (a-helical) conformation. As expected, Ala, Glu,and Leu are among the residues with the highestprobability of being in the A basin (64%, 66%, and59%, respectively). The lower two cases are someextreme cases for Asn. FNI is a case (not involvingPro) with significant lower probability for the Abasin than for the B basin. The probability in A isreduced from 49% for asparagine in general to 21%for INI. The VNG triplet shows a high tendency ofbeing in the C1 basin. With the exception of Gly, Asnis the residue with the highest probability of beingin the C1 basin (11%). But in VNG, the probabilityincreases to 29%.
Figure 5. Free energies for dihedral angle pairs betweenconsecutive residues. The angles are indicated in the axes.All the amino acid residues are included in theprobability densities except proline. Only residue pairsare used in this illustration, therefore the i, iC1 cases areequal to the iK1, i cases.
Dependency of dihedral angles on neighborresidue conformations
The dependence of an amino acid conformationon the conformations of its adjacent residuesinvolves too many variables to be captured in asingle probability density function for the availabledata. Instead, we divided the probability densitiesin individual terms involving pairs of angles.In particular, for a triplet with indices iK1, i, iC1,we looked at the density plots involving (fiK1, fi),(jiK1, fi), (jiK1, ji), (fi, fiC1), (ji, fiC1), and(ji, jiC1). As before, if the residue is Pro, f isreplaced by u. The only difference between the iK1,i and the i, iC1 cases is that in the former theprobability density depends on the composition ofresidue iC1 and in the latter on the composition ofresidue iK1. Using two angle distributions makesthe approximation of the same order as the fi, ji
probability density, which is important in thecombination of the free energy terms.
To illustrate the basins occupied by these angles,we show in Figure 5(a)–(c), the free energy of thecombined densities for all amino acid pairs (notinvolving proline). For proline, three more cases(not shown) need to be considered, (ui, fiC1), (fi,uiC1), (ji, uiC1). The plots show the correlationbetween the conformations of consecutive residues.The (ji, jiC1) case clearly distinguishes betweenbasins A and B, and gives a higher probability fortwo consecutive residues to be in the same basin. In

Figure 6. Free energy examples for the dihedral angles ji, jiC1 between residue pairs. The DP example shows a strongasymmetry. The two deepest minima in YT shows a preference for the pair to be either in a coiled or in an extendedconformation. The PP example also shows an asymmetric behavior in spite of being the same residue. In the GG examplethere is a slight asymmetry opposite to the PP case.
642 Backbone Statistical Potential for Proteins
the (fi, fiC1) case, a distinction is made between theACB and the C basins. The (ji, fiC1) plot showssome correlations but not as strong as the (fi, ji)plots.
When residue identities are considered, strongdeviations from the general probability densitiescan be observed. For simplicity, in the followingexamples we only consider the (ji, jiC1) tworesidue correlations. Figure 6 shows the (ji, jiC1)probability densities for four cases: DP, YT, PP,and GG. The DP (Asp, Pro) case shows a clearasymmetry. Evidently, Asp has a higher probabilityof being in the B basin (jiO50), while Pro prefers tobe in the D2 (jiC1!0) basin. In the YT example,
(Tyr, Thr), the conformations are mostly found withboth residues either in the A basin or the B basin,with a slight preference for the B basin. Theseresults vary when the identity of residue iK1 isconsidered. The PP (Pro, Pro) case shows a strongasymmetry. This means, for example that when twoproline residues are found together in differentbasins, the first one is more likely to be in either theD1 or E1 basin (extended) and the second one in theD2 or E2 (coiled) basin. Otherwise, both prefer to bein the D1 or E1 basins. In the GG (Gly, Gly) case, anasymmetry is also noticed, although not as pro-nounced. This time, the first glycine is more likely tobe in the A or C1 basins while the second one

Backbone Statistical Potential for Proteins 643
prefers to be in the B basin. Other residue pairs ofequal types show more symmetric behavior.
The local free energy and its influence in thenative dihedral angles
We now formulate the dihedral angle potentialand investigate to what extent it determines aresidue native conformation. In the free energyexamples shown by us, it is evident that someresidues have strong conformational preferencesthat depend on their nearest neighbors. Therefore,we should expect that a significant fraction of thenative backbone conformation is determinedlocally. This hypothesis is supported by resultsobtained from the application of information theoryto the local sequence-to-backbone structurerelationship.9
Given a protein sequence, a dihedral anglestatistical potential can be defined as:
Vtot ZXi
fV0;abgðfi;jiÞC ½V1;abgðfiK1;fiÞ
CV2;abgðjiK1;fiÞCV3;abgðjiK1;jiÞ
CV4;abgðfi;fiC1ÞCV5;abgðji;fiC1Þ
CV6;abgðji;jiC1Þ�=2g (2)
where abg represents a sequence of three aminoacid residues and each V in the sum is of the form ofequation (1) with the appropriate angle depen-dence. The factor of 2 was introduced because thereare two terms for each angle pair, except for V0. Atthe protein ends, the V0 term is substituted by apotential derived from the single residue prob-ability for the given amino acid, and the other termsare derived from the probabilities between tworesidues. When Pro is present, the correspondingprobabilities are replaced by probabilitiesdepending on u.
To test the role of the local free energy on thenative conformations, it is more convenient at firstto use a coarse (low-resolution) description of theresidue conformations, which can be accomplishedby mapping the dihedral angles to the basinsdescribed in the f, j plots. Similar basins for thedihedral angle combination between neighboringresidues can be defined consistent with the f, jbasins. The total number of events in each basin isused to compute N in equation (1), which in turn isused to build the low resolution version of equation(2). Only the two-dimensional triplet histogramswith NR20 are used, otherwise the two residuedependent histograms are used. All histograms arerenormalized so that the total number of events perhistogram is equal to the average (94).
A stable conformational state for a sequence isobtained by minimizing the low-resolution poten-tial with respect to the basins. If only the V0 termsare considered, minimizing Vtot is trivially achievedby minimizing each individual term independently.When the other terms are included, the equation
has to be globally minimized. The algorithm toaccomplish this is the following:
(1)
For each residue iZ1,.,N of a sequence oflength N, we select a window of consecutiveresidues of size wi centered around i. wi is thesame for all i (except at the sequence ends) andit is initially set to one.(2)
Equation (2) is minimized for each windowindependently of the residues outside thewindow by searching all possible (low resolu-tion) conformations for the residues in thewindow. Only the conformation of the centerresidue i for each window is updated accordingto the minimum energy conformation of thewindows.(3)
Step 2 is repeated by increasing the window sizeand the process ends when the total energyconverges to a minimum, i.e. when the totalremains the same after the window size hasbeen increased several (three) times.This algorithm converges quickly to a very low(but not necessarily the lowest) energy state.Typically, window sizes of no more than sevenresidues are needed.
The conformations obtained by minimizing thelow-resolution potential can be compared to thoseextracted from the conformations of known proteinstructures. We arbitrarily selected a test set of non-homologous proteins consisting of a total of 125chains ranging from 36 to 174 residues. For testingpurposes, the dihedral angle potentials were re-derived by eliminating any one of the test proteinsappearing in the protein set used to construct theprobability distributions. Because of this and thecomputational requirements in the minimization,the test set was kept relatively small. For each chain,the conformation obtained from the minimizationwas compared to the native one. For all residuesexcept for Gly and Pro, four states were considered:A, B, C1, and neither. For Gly the C2 state was alsoconsidered and for Pro the corresponding stateswere used. The fraction of identical states was usedas a similarity measure.
The results show that around 62% of the residuesminimize to the same state as the native one. Thiscan be compared to 60% if only the V0 term is used,and 55% if V0 is independent of the adjacent residueidentities. Figure 7(a) shows the distribution of thefraction of correctly assigned residues for the testchains. Many of the cases with the lowest fractionscorrespond to b-rich structures. Conversely, manyof the cases with the highest fractions correspond toa-rich structures, although a significant amount of bstructure can be found.
To better understand the nature of the precedingresult, we can divide the residues according to theirnative secondary structure, which can be deter-mined by using the DSSP algorithm.12 For sim-plicity, we adopt the three code description for thesecondary structure, i.e. a, b, and loops for every-thing else. The DSSP code is reduced to a three

Figure 7. Results of minimizingthe low resolution dihedral anglepotential for 125 test proteins. Thecorrect assignment fraction is thefraction of residues correctlyassigned to their respective basinsfor each protein.
644 Backbone Statistical Potential for Proteins
secondary structure code as follows: {H,G,I} / a;{E}/b; and {B,T,S,_}/L. In terms of this classifi-cation, the fraction of residues that adopt a nativeconformation after minimizing the dihedral anglepotential is a: 0.89, b: 0.47, and L: 0.48. Clearly, theconformations of a-helices are strongly determinedby the local interactions. The local potentialinfluence in b-sheets is much less than for a-helices,but nevertheless significant. Notice that if thebackbone potential simply classifies residues to bein helix and extended basins at random, then if theprobability to be in the helix basin is 0.89, we wouldexpect the probability to find a residue in a bstructure to be no more than 0.11. Instead, theaverage probability is nearly four times larger. Thefraction obtained for the loop residues is similar tothat of residues in b-sheets. Nevertheless, thisfraction is somewhat smaller than expected, con-sidering that 43% of the residues in loops are in
coiled and 49% in extended states. Therefore, theinfluence of non-local interaction may play a moreimportant role in loops than in b-sheet residues.
The correlations between conformations of adja-cent residues suggest that the local energy influenceof residues in a-helices and b-sheets may depend onhow deep the residue is buried in the structuralelement. To this end, we define the residuesecondary structure depth (RSSD) as one plus thenumber of consecutive residue pairs on both sidesof a residue in the same secondary structureelement as the residue. The results of the backboneenergy minimization for each secondary structuretype can be divided as a function of the RSSD. Theresults are plotted in Figure 8. The error barsrepresent the inverse of the square root of thenumber of cases. For all three secondary structuretypes, there is a clear dependence on the RSSD. Fora-helices, the fraction grows from 85% to near 92%
Figure 8. Dihedral angle potentialinfluence in the residue confor-mation as a function of residuesecondary structure depth. Thestatistics were obtained from 125test proteins after minimizing thelow-resolution dihedral anglepotential. The secondary structuresare divided into a-helices, b-sheets,and loops (L), according to theprotein native structure. The errorbars are indicative of the number ofdata points used in each averagepoint and are calculated as theinverse of the square root of thenumber of points. Only averagepoints with more than six datapoints are shown.

Backbone Statistical Potential for Proteins 645
from one to three residues deep. Then it graduallydecreases to 82% around ten residues deep andincreases to 100% soon after. The rapid increase innative fraction near the edge of an a-helix suggests acooperative behavior that favors their formation. Itis not clear why this fraction decreases further intothe structure. For b-sheets, it grows from 41% tonear 83% after a RSSD of 9. The cooperative effectaround the edge of the structure (from one to threeresidues in depth) is also evident. The loops, on theother hand, show an increase from one to tworesidues in depth, but a decrease to values below40% as the RSSD increases further.
Backbone dihedral potential for folding
The dihedral angle probability distributionscontain more information than the one providedby coarse potentials described above. Cases suchas those in Figure 3 show the advantage of refiningthe probability distribution beyond a few broaddomains. Higher resolution knowledge basedpotentials (KBPs) can be constructed from theseprobabilities, which in combination with non-localinteractions, can be used in reduced protein modelsimulations. In this section, we construct continu-ous functions that broadly approximate the KBPsderived from the triplet probability distributions.This is convenient because of the low data countand higher noise to signal ratio in triplet histo-grams. In addition, continuous function fits aremore appropriate in some minimizations andsimulation procedures.
The general f, j effective free energy (Figure 1(a))can be roughly approximated by a sum of arbitraryperiodic functions localized at the labeled regions.One possibility is:
FZXLi
Ai cos2lifCj
4Kqi
� �cos2mi
fKj
4Khi
� ��
Csin2lifCj
4Kqi
� �sin2mi
fKj
4Khi
� ��
(3)
This function represents a series of L localizedfunctions whose positions are related to qi and hi,their amplitudes to Ai, and their widths to li and mi.For Pro, the function is:
FZXLi
Aicos2liu
2Kqi
� �cos2mi
j
2Khi
� �(4)
Equation (3) is used to fit the f, j energy plots ofeach individual residue obtained independently ofthe adjacent residue identities. Initial guesses aremade for the 20 amino acids and then are fittedusing the conjugate gradient method by minimizingan error function between equation (3) and theextracted free energies.
Fitting equation (3) to the triplet free energies iscomplicated by the higher noise to signal ratio.Several steps are taken to improve the estimates of
the probability density and to carry out unsuper-vised fits over the 8000 sets. First, the probabilitydensities are estimated for plots with 20 points ormore; otherwise the single residue (neighborindependent) density of the triplet’s center residueis used. To estimate the density of sparse data,selecting a constant grid size can generate largeerrors. Instead, the densities are estimated by usinga modification of a recursive density estimationalgorithm.13 This algorithm selects the space par-tition tailored to the local density, rather than usinga uniform partition. A brief description of thealgorithm is presented in Materials and Methods.The estimated densities are transformed into freeenergies and fitted using equations (3) or (4). Theinitial values are selected to be those resulting fromfitting the single residue free energies. This time,only the amplitudes Ai are fitted, keeping the otherparameters constant. In this way, the number ofminima remains the same, unless an amplitude Ai
vanishes.The terms involving correlations of the angles
between two residues (V1,.,V6) are fitted in asimilar way. This time, all the free energies are fittedby equation (4). Nine terms (LZ9) are used whenonly the f, j angles are involved. This number isdifferent if one of the angles is u. Initially, the threefree energies in Figure 5(a)–(c) are fitted usingestimates for the initial parameters. In addition, thefi, uiC1, ji, uiC1, ui, fiC1, and ui, uiC1 cases,involving Pro, are fitted separately. The parametersof these functions are used as initial conditions to fitthe corresponding free energies for all residue pairs.That is, the free energies involving the threedihedral angle pairs (replacing f by u whenappropriate) for each one of the 400 residue paircombinations are fitted. Finally, these fitted para-meters are used as initial conditions for fitting theamplitudes Ai of the V1,.,V6 potentials for the 8000triplet combinations (containing at least 20 points).
To evaluate the potential, we perform MonteCarlo simulations on a simplified protein modelwhose details are described elsewhere14 (unpub-lished results). This model uses a simplifiedrepresentation of the side-chain, while keeping adetail description of the backbone. However, for thepresent simulations, only the backbone dihedral-angle potential is used and the side-chains areirrelevant. The Monte Carlo algorithm works bygenerating window moves for a group of consecu-tive residues. These moves efficiently change thevalues of the flexible dihedral angles while keepingthe bond angle and distances constant or withintheir natural range.
The test set of 125 sequences was used in theenergy minimization. As described earlier, thepotential was re-derived without the proteinsappearing in the test set. Random initial confor-mations were generated and a finial structure wasobtained by minimizing the backbone potential.The minimization was done for 40 independentannealing simulations. For each residue, the dihe-dral angles between the native and minimized

Figure 9. Local energy gap after the minimization of thehigh-resolution potential, as a function of the residuedihedral angle distance D for the 125 test proteins. Thelocal energy gap is the difference between the energy of aresidue after energy minimization and a competingconformation with the lowest energy outside a 908range. The results are separated into two plots accordingto which basin the residues minimize into. The residues(plot points) are further classified according to theirnative secondary structure. (a) A basin residues. Residuesthat form a-helices have on average slightly lower energygaps than residues that form b-sheets or loops. (b) B basinresidues. Residues that form b-sheets or loops have onaverage significantly lower energy gaps than residuesthat form a-helices. In addition, the D for b-sheetsgenerally increases as the energy gap increases.
646 Backbone Statistical Potential for Proteins
structures were compared. If the difference betweenany of the residues’ dihedral angles between theminimized and the native structures was more than908, the residue was classified as non-native.
The total fraction of residues in the nativeconformation, separated by native secondary struc-ture type is a: 0.96, b: 0.18, and L: 0.44. The nativefraction is 0.55 for all residues combined. This highresolution potential gives a larger fraction ofresidues in helical conformation than the lowresolution potential. It comes at the cost of a lowerfraction for residues in b structures. In spite of beingsmall, it is still more significant that an a-dominatedrandom assignment (i.e. 96% a and 4% b).
The difference between the high and low poten-tial can be understood by noticing that the dihedralangles for helical structures are more concentratedaround the typical a-helices values, making the freeenergy lower for them than for extended structures,whose dihedral angles are more disperse. Thissuggests that an equilibrium conformation at asimulation temperature higher than zero couldincrease the yield of b structures. Carrying outsuch a calculation at an arbitrary (but low)temperature, and averaging over ensembles of 40independent minimizations for each of the 125proteins, we obtained a: 0.82, b: 0.25, and L: 0.41.While the fraction in a structures have diminished,the b fraction evidently increased.
The conformational state of a residue is affectedby that of its neighbors, which are competing tominimize the global energy. Locally, a residue canbe in a higher energy conformation as a result of thiscompetition. This local stability can be measured bycomputing the difference between the residueenergy in the energy-minimized structure and theminimum energy among all other alternate confor-mations. Residues in alternate conformation aredefined as differing from the minimum energyconformation by a dihedral distance DO908, whichis defined as:
D2hX3
iZ1
ðti KliÞ2 (5)
where ti and li are the backbone dihedral angles fora residue in the native and minimum energystructure, respectively. Equation (5) measures theEuclidian distance between the angles of a residue,taking the periodicity into account. The particularchoice of metric is not important for our purposes,as long as it gives a measure of distance. Thealternate conformation corresponds to a localcompeting state and the energy difference corre-sponds to a local energy gap. The local energy gapfor a residue can be plotted against D to determinethe correlation between the local stability and theproximity to its native conformation.
In Figure 9, we have plotted the local energy gapas function of D for residues classified by theirconformational basin in the minimum energyconformation and by their native secondary struc-ture. Only the A and B basins were considered,
corresponding to Figure 9(a) and (b), respectively.Note how the data for a-helices and b-sheets tendto cluster in two groups. In Figure 9(a), most ofthe residues that minimize to the A basin are alsoa-helices. On an average, b-sheet residues thatminimize to the A basin have slightly higher energygaps. Residues in loops either minimize to theirnative basin or an alternate one, judging from theclustering in groups with low and high D values.In either case, the energy is also slightly higher onaverage, as compared to the residues that forma-helices and b-sheets. In particular, the averagelocal energy gaps and their standard deviations are

Backbone Statistical Potential for Proteins 647
a: K5.18G2.7; b: K4.10G2.5; and Loop: K3.42G2.5. Figure 9(b) shows the results for residues thatminimize to the B basin. This time, the residues thatform b-sheets have significantly lower energy gaps,on average, than a-helical residues folding into theB basin. The local energy gaps in this case are a:0.71G1.9; b: K0.69G2.6; and Loop: K0.72G2.1. Thegaps are significantly smaller than for the A basinindicating less stable structures. Notice that acorrelation between the energy gap and D can beobserved for b-sheet residues. The dihedral anglesincreasingly deviate from their minimum energyvalues as they become locally unstable.
Curiously, Figure 9(a) shows some points thatminimize to the A basin and form b-sheets butshows little change in D. This discrepancy is a resultof the way the DSSP algorithm classifies residuesinto secondary structure classes. For example,residue 56 in chain A of the protein with PDBcode 1nbc is classified by DSSP as b, in spite ofhaving dihedral angles typical of a-helices (fZK688, jZK378). The structure shows this residueburied in the middle of a b-strand. In Figure 9(b)some residues that minimize to basin B and formb-sheets have a large D. For example, residue 13 ofthe protein with PDB code 1rip is classified as b inspite of having dihedral angles outside the B basinand closer to the C2 basin (fZ748, jZK1028). Thedihedral angles of this particular structure were notaccurately determined experimentally. Overall,cases like these are rare and do not significantlychange our results.
Discussion
We have investigated how the distribution ofdihedral angles of residues in native structures areaffected by their neighboring residue identities andconformations. Triplets of residues with all avail-able combinations were examined by looking at theprobability density plots between the f, j angles forthe central residue (Ramachandran plots) and forother combinations of dihedral angles betweenadjacent residues. For cases involving Pro, the uangle replaced the f angle. f, j Plots revealedstrong conformational dependencies on the adja-cent residue identities and conformations for manytriplet combinations. This agrees with the con-clusions of Zaman et al.6 for tripeptide simulations.The well-known effect of Pro on the conformation ofpreceding residues was clearly observed andquantified. Residues preceding Pro showed a highprobability of being in a b-like state (the B basin). Inaddition, residues surrounded by amino acidresidues with greater tendency to be in b-likeconformations (such as Ile, Val, and Cys), have anincreased tendency to be in b-like conformations.Similarly, residues surrounded by amino acidresidues with greater tendency to be in a-likeconformations (A basin), are likely to be in a-likeconformations. The plots between adjacent resi-dues, such as the j, j plots, showed cooperative
behavior. Most amino acid residues have higherprobabilities to be in similar conformations ratherthan in different ones. One common exceptionoccurs when Pro follows some other amino acidresidues. In this case, Pro is more likely to be in ab-like conformation while the preceding residue ismore likely to be in an a-like conformation.
We have also explored the extent to which localangle propensities determine the conformation ofdihedral angles in the native state. A low-resolutionknowledge-based potential was derived usingdihedral angle basins representing the most com-mon secondary structure conformations such as thecoiled and extended state. After minimizing thispotential for a series of test proteins, we found that55% of the residues are assigned to the native basinonly when the identity of the central residue, butnot that of the adjacent residues, is considered. If theidentity of the adjacent residues is considered, thenative assignments increase to 60%, and to 62%when the conformations of the adjacent residues arealso considered. This number clearly shows a localenergy influence on the dihedral angles and isbetter appreciated when the residues are dividedaccording to their secondary structures in theirnative states. The local potential influence is largerfor a-helices, in which 89% of the residues in nativea-helical conformations minimize to the A basin.The influence in b-sheets is smaller (47% minimizeto the B basin) but significant, given the higha-helical fraction. The loops (or random coils) yield48% of residues in the native basin, which is similarto that of b-sheets. However, because loops can beeither in coiled or extended conformation, 48% isless of what would be expected given the yield forthe a-helices and b-sheets. We also found that theconformation of residues in a-helices or b-sheets isincreasingly determined by the local potential astheir location moves away from the edge and intothe secondary structure element. The increase ismore significant for b-sheets.
A higher resolution dihedral potential, derivedby fitting periodic localized functions, was obtainedand used to minimize the dihedral angles in off-lattice Monte Carlo simulations for a group of testproteins. This time, the simulations showed that thepotential favors coiled conformations. The fractionsof residues in the native basin after minimizationare 96% for a-helices, 18% for b-sheets, and 44% forloops. The discrepancy between these results andthe low-resolution ones arises because the dihedralangles of helical structures are more localized in theA basin that the ones of extended structures are inthe B basin. This results in a lower free energy in theA basin for some triplets, even when the events inthe B basin are higher. The larger entropy of the Bbasin indicates a higher flexibility for b structures,which could be preferred when non-local inter-actions are present. Further analysis of the energy ofa residue relative to conformations with competingenergies (energy gap) revealed that residues thatminimize to the B basin generally become b-sheetsif the gap is large and negative. This is also true for
648 Backbone Statistical Potential for Proteins
a-helices but to a much lesser extent. In general,b-sheet residues that minimize to the B basin and a-helices that minimize to the A basin are more stablethan when they minimize to opposite basins. Loopsare generally more stable in coiled conformations.Overall, these results indicate that the dihedralangle potential is a significant contribution to thetotal folding potential and to the determination ofthe native dihedral angles.
The dihedral angle potential alone can give agood indication of the backbone conformationalpreference, but it is not intended to be a secondarystructure predictor. For that purpose, secondarystructure prediction (SSP) algorithms, such asPSIPRED,15 can determine the state of a residuewith an average success rate of nearly Q3Z78%,using the three-type secondary structure descrip-tion (a, b, Loop). Part of the success of the SSPmethods is due to the intrinsic local propensity ofthe residues towards different secondary structuretypes, as indicated by our results. Another part isthe non-local interactions implicitly included inmultiple sequence alignment and neural networksmethod. Without the latter, Q3 could drop below70%. While 78% seems to be a significant amount,the structural information contained in a loopprediction is significantly less than that of an a ora b prediction. This is because the loop dihedralangles encompass a wide rage of values, includingthe extended or the coiled state ones. In our data,the distribution of native secondary structure is33%, 24%, and 43% for a, b and loops, respectively.Applying the SSP method to our data would resultin approximately 45% (57%!78%) of residues withdeterminable dihedral angles (a or b), which iscomparable to what we obtained by minimizing thelow-resolution dihedral angle potential for the aand b structures combined.
Materials and Methods
Protein set
The dihedral angle populations were computed fromexperimentally solved proteins structures deposited inthe PDB. From 26,256 structure files, 54,860 polypeptidechains were extracted and clustered to eliminate highlyredundant chains. In particular, clusters of chains differ-ing by 95% sequence identity or more, normalized by theshortest chain, were obtained. A complete linkagehierarchical clustering was used, meaning that allsequences from a cluster were at least 95% identicalwith other members of the cluster and less than 95%identical with all other sequences outside the cluster. TheFASTA sequence alignment algorithm was used for thesequence alignment.16 The best structure from eachcluster was selected satisfying the conditions that theyshould contain at least ten residues with all their heavyatoms, that the structure should not be obsolete, and thatthe resolution should be 3 A or better. This processresulted in 7070 high quality chains.
For computing the dihedral angle distributions, it isimportant to use as many non-redundant high-qualitysequences as possible. This is accomplished by further
clustering the 7070 chains into groups differing by nomore than 20% sequence identity, resulting in 703clusters. Notice that 20% sequence identity nearlyguarantees unrelated proteins although no requirementis imposed on the global structure similarity. If only onesequence from each cluster is used, the data would beinsufficient to obtain good statistics. To circumvent thisproblem, for each of the 8000 triplets (and the seven pairsof dihedral angle combinations used), we use all 7070chains with the requirement that triplet events come fromdifferent clusters differing by 20% identity or more andthat the center residue of each triplet is at least tworesidues away from the chain ends. This allows us to findevents for all triplets resulting in a total of 755,973 tripletevents and an average of 94.5 events per triplet.
Probability estimation method
A probability density estimation algorithm is applied tothe dihedral angle distributions of the residue triplets. Itrecursively divides the density space by 2d, where dZ2 isthe dimension of the space. In our version, the division ismade by dividing each coordinate range in half. The fourboxes created by this division are subdivided again. Thena c-square test is made for the two division levelscorresponding to a 20% confidence level. The c-squareconditions are:
c23 Z ½ð16=9Þð1=NÞ
X3
iZ0
ðai KN=4Þ2�!1:547 (6)
c215 Z ½ð256=225Þð1=NÞ
X3
i;jZ0
ðbij KN=16Þ2�!1:287 (7)
where N is the number of points in the box being divided,ai is the number of points in the ith box of the first divisionlevel, and bij is the number of points in the ijth box of thesecond division level. If any of these inequalities is notsatisfied, the density is assumed non-uniform, and thedivision procedure is repeated for each of the first levelboxes. This process is iterated until no more substructuresare found.
Acknowledgements
We thank Adrian K. Arakaki for stimulatingdiscussions. This research was supported in part byNIH Grant GM-37408 of the Division of GeneralMedical Sciences.
References
1. Creighton, T.E. (1996). Proteins: Structures and Molecu-lar Properties (2nd edit.). W. H. Freeman: New York.
2. Ramachandran, G. N. & Sasisekharan, V. (1968).Conformation of polypeptides and proteins. Advan.Protein Chem. 23, 283–438.
3. Hovmoller, S., Zhou, T. & Ohison, T. (2002). Confor-mations of amino acids in proteins. Acta Crystallog.sect. D, 58, 768–776.
4. Perczel, A., Jakli, I. & Csizmadia, I. G. (2003).Intrinsically stable secondary structure elements ofproteins: a comprehensive study of folding units of

Backbone Statistical Potential for Proteins 649
proteins by computation and by analysis of datadetermined by X-ray crystallography. Chem. Eur. J. 9,5332–5342.
5. Pappu, R. V., Srinivasan, R. & Rose, G. D. (2000). TheFlory isolated-pair hypothesis is not valid for poly-peptide chains: implications for protein folding. Proc.Natl Acad. Sci. USA, 97, 12565–12570.
6. Zaman, M. H., Shen, M., Berry, R. S., Freed, K. F. &Sosnick, T. R. (2003). Investigations into sequence andconformational dependence of backbone entropy,inter-basin dynamics and the flory isolated-pairhypothesis for peptides. J. Mol. Biol. 331, 693–711.
7. Ohkubo, Y. Z. & Brooks, C. L., III. (2003). ExploringFlory’s isolated-pair hypothesis: statistical mechanicsof helix-coil transitions in polyalanine and thec-peptide from rnase a. Proc. Natl Acad. Sci. USA,100, 13916–13921.
8. Karplus, P. A. (1996). Experimentally observed con-formation-dependent geometry and hidden strain inproteins. Protein Sci. 5, 1406–1420.
9. Solis, A. D. & Rackovsky, S. (2002). Optimallyinformative backbone structural properties inproteins. Proteins: Struct. Funct. Genet. 48, 463–486.
10. MacArthur, M. W. & Thornton, J. M. (1991). Influenceof proline residues on protein conformation. J. Mol.Biol. 218, 397–412.
11. Hurley, J. H., Mason, D. A. & Matthews, B. W. (1992).Flexible-geometry conformational energy maps forthe amino acid preceding a proline. Biopolymers, 32,1443–1446.
12. Kabsch, W. & Sander, C. (1983). Dictionary of proteinsecondary structure: pattern recognition of hydrogen-bonded and geometrical features. Biopolymers, 22,2577–2637.
13. Fraser, A. M. (1989). Information and entropyin strange attractors. IEEE Trans. Info. Theroy, IT-35,245–262.
14. Betancourt, M. B. (2003). A reduced protein modelwith accurate native-structure identification ability.Proteins: Struct. Funct. Genet. 53, 889–907.
15. Jones, D. T. (1999). Protein secondary structureprediction based on position-specific scoringmatrices. J. Mol. Biol. 292, 195–202.
16. Pearson, W. R. & Lipman, D. J. (1988). Improved toolsfor biological sequence comparison. Proc. Natl Acad.Sci. USA, 183, 2444–2448.
Edited by J. Thornton
(Received 23 January 2004; received in revised form 25 June 2004; accepted 28 June 2004)