local wfo flooding and tornado impact recognition and messagingflghc.org/ppt/2014/training...
TRANSCRIPT

Local WFO Flooding and Tornado Impact Recognition and Messaging
Florida Governors Hurricane Conference – May 13, 2014
Scott SprattWFO Melbourne, FL

Hurricane Flood Danger
Freshwater flooding is the leading
cause of TC fatalities in the US…

Hurricane Flood Danger
Freshwater flooding is the leading
cause of TC fatalities in the US…
but not in Florida.
‘Storm Data’ for Florida (1970-2013)
includes 70 direct fatalities related
to tropical storms/hurricanes.
Only ~10% of Florida fatalities due to
freshwater flooding.
Majority of Florida fatalities due to
drowning at sea, rip currents, and
falling trees.
The Florida perspective
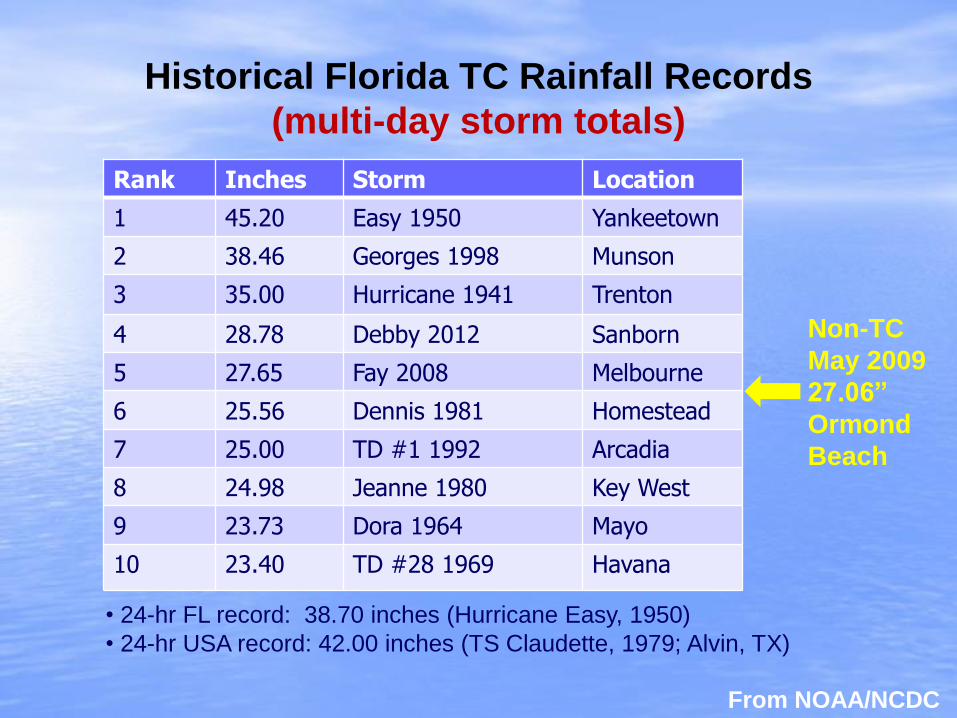
Rank Inches Storm Location
1 45.20 Easy 1950 Yankeetown
2 38.46 Georges 1998 Munson
3 35.00 Hurricane 1941 Trenton
4 28.78 Debby 2012 Sanborn
5 27.65 Fay 2008 Melbourne
6 25.56 Dennis 1981 Homestead
7 25.00 TD #1 1992 Arcadia
8 24.98 Jeanne 1980 Key West
9 23.73 Dora 1964 Mayo
10 23.40 TD #28 1969 Havana
Historical Florida TC Rainfall Records
(multi-day storm totals)
• 24-hr FL record: 38.70 inches (Hurricane Easy, 1950)
• 24-hr USA record: 42.00 inches (TS Claudette, 1979; Alvin, TX)
From NOAA/NCDC
Non-TC
May 2009
27.06”
Ormond
Beach

Public EducationWhat NOT to do!
Most cars will float (and be swept away)
in 18-24 inches of moving water.
"If you haven't left the Keys already, stay where you are. This
is not the time to evacuate … now is the time to hunker
down," Gov. Bush said. "What we say around here is Turn
around, don't drown.“ [Sept. 20, 2005 – Hurricane Rita threat]

Most difficult to forecast hazard?Storm Surge, Flooding, Wind, Tornadoes
• Need accurate NHC forecast (NHC track, speed, structure)
• Need to account for mesoscale interactions
• Subtle boundaries focus excessive rainfall (“two-phased impacts”)
• Local influences can produce sustained feed off water, training cells
• TC rainfall climatologies helpful, but extreme events are averaged out
• Model guidance for precipitation often varies widely, lowering forecaster
confidence (resolution not sufficient for localized, maximum values)
• Planning forecasts include wide range (e.g. 5-10”, 15-25”, etc.)
• Forecasts updated with greater detail once event underway (satellite &
radar estimation techniques, real-time gage observations)
• “Kraft” rule of thumb: 100 / forward speed (kt) = estimated inches of rain
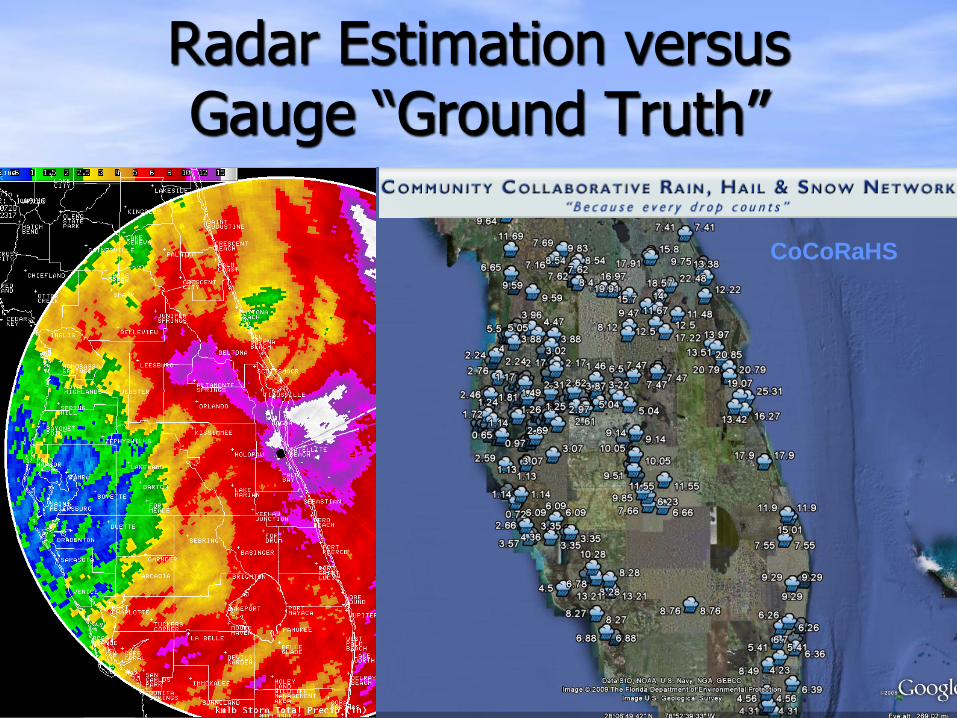
Radar Estimation versus Gauge “Ground Truth”
CoCoRaHS

Dual-Pol Radar Improves Rainfall Estimates
Legacy Radar
Dual-Pol Radar

TC intensity versus speed of motion
8
8
7
4
4
2
4 5 5
Forward speed (kt)
= stationary

TS Fay (2008) Rainfall Rates
0.00
0.20
0.40
0.60
0.80
1.00
1.20
1.40
1 2 3 4 5 6 7 8 9 10 11 12 13 14 15 16 17 18 19 20 21 22 23 240.00
0.50
1.00
1.50
2.00
2.50
1 2 3 4 5 6 7 8 9 10 11 12 13 14 15 16 17 18 19 20 21 22 23 24
0.00
0.50
1.00
1.50
2.00
2.50
1 2 3 4 5 6 7 8 9 10 11 12 13 14 15 16 17 18 19 20 21 22 23 24
0.00
0.50
1.00
1.50
2.00
2.50
1 2 3 4 5 6 7 8 9 10 11 12 13 14 15 16 17 18 19 20 21 22 23 24
Aug. 21 hourly rainfall rates for select USAF field mills (34) at KSC
14.56” (24 hr) 12.56” (24 hr)
11.93” (24 hr) 11.82” (24 hr)
Data courtesy of John Madura, Dr. Frank Merceret and Phil Gemmer, NASA KSC Weather Office
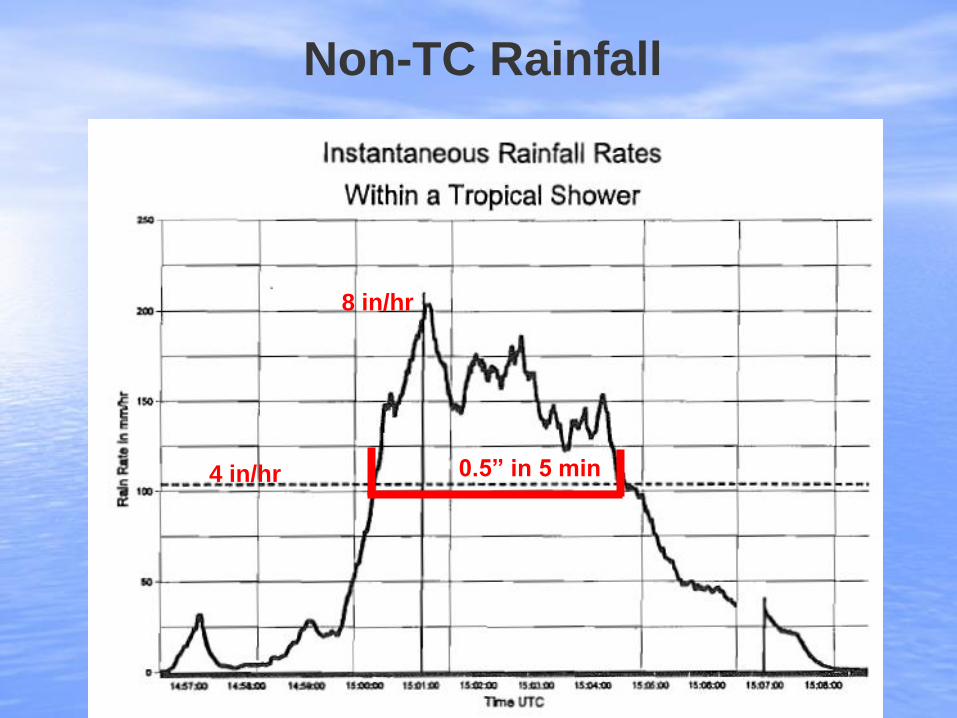
Choy and Trexler, 1994
4 in/hr
8 in/hr
0.5” in 5 min
Non-TC Rainfall

Hurricane Impact Graphics
• Excellent local planning tool
• Quick look of relative threat ‘impacts’
• Updated at least every 6-hours – watch for
increasing/decreasing trend of impacts
Updated 4 AM Wed Aug 20Updated 6 PM Sun Aug 17 Updated 12 PM Wed Aug 20
River Flood Forecast Issues
• Specific amount and location of excessive rainfall greatly impacts
response of local rivers.
• Rainfall maxima near headwaters results in greater/slower rise
downstream.
• Wide/shallow rivers allow flooding to spread laterally rather than flow.
• Response of wide/shallow rivers are most difficult to model/predict.
• River stages can differ significantly from forecasts if control
structures are used (and details are not communicated to NWS).
• Additional rain gages help to lessen the bias of radar rainfall
estimates, resulting in improved river forecasts, but modeled response
needs to improve (RFC’s recently implemented new river forecast
model scheme).

Advanced Hydrologic Prediction Service (AHPS)Click on “Rivers/Lakes” on left side of any WFO webpage
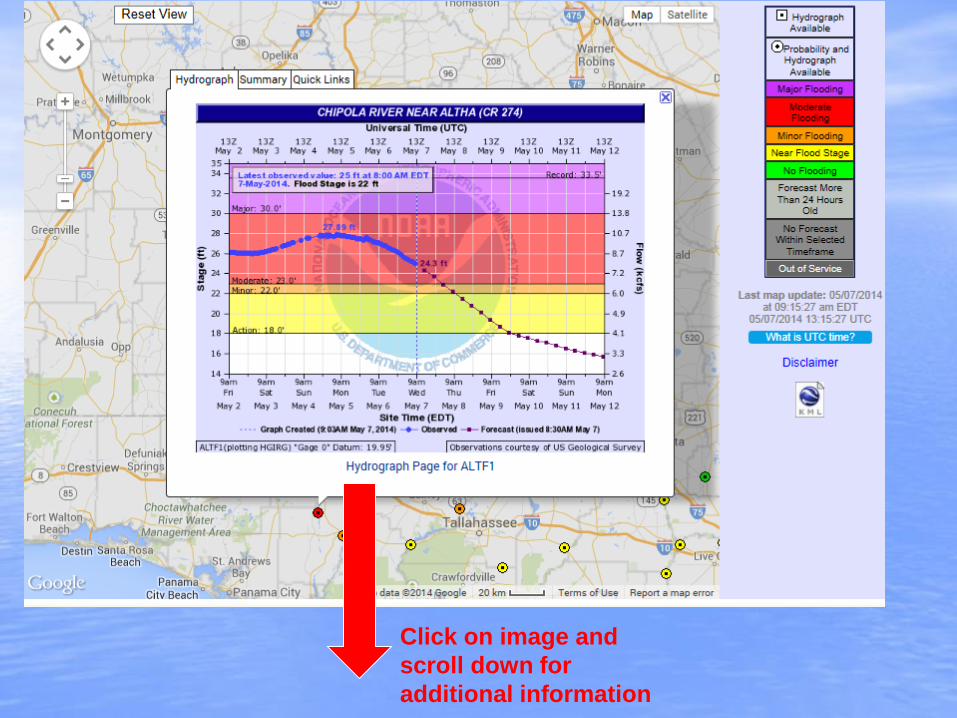
Click on image and
scroll down for
additional information

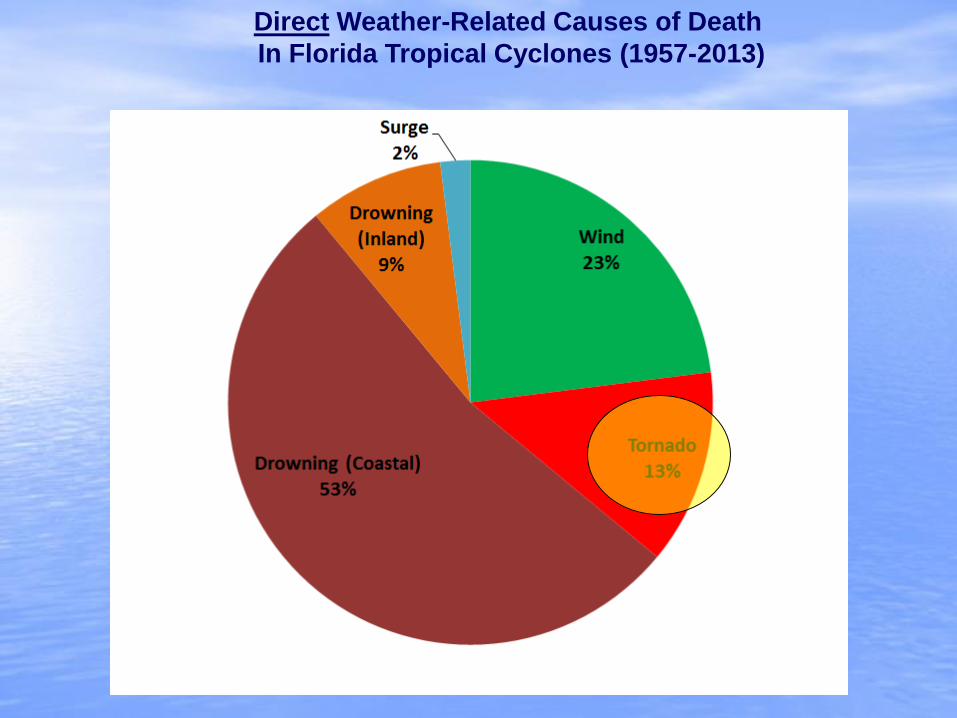
Direct Weather-Related Causes of Death
In Florida Tropical Cyclones (1957-2013)

Wind-related deaths occur in two well-defined
areas of a hurricane
Primaryouter rainbandtornadoes
Eyewall
Hurricane Charley 2352 UTC 8/13/04
TOR Warning
EWW Warning

Florida killer tornadoes and deaths by month

10 DEADLIEST FLORIDA TORNADO OUTBREAKS
FEBRUARY 1998 42 DEADFEBRUARY 2007 21 DEADMARCH 1962 17 DEADAPRIL 1966 11 DEADJUNE 1972 7 DEAD HURRICANE AGNESJANUARY 1936 7 DEADSEPTEMBER 2004 6 DEAD HURRICANE IVANSEPTEMBER 1882 6 DEAD HURRICANEAPRIL 1925 5 DEADOCTOBER 1992 4 DEAD Un-Named HybridMARCH 1939 4 DEAD
Through 2013

Tornadoes Have Occurred In 65 of 67 Counties
Top 10 Counties
Brevard (30)Palm Beach (26)Hillsborough (25)Monroe (24)Dade (22)Polk (21)Volusia (21)Duval (18)Okaloosa (18)St. Johns (17)
Gilchrist
Hamilton
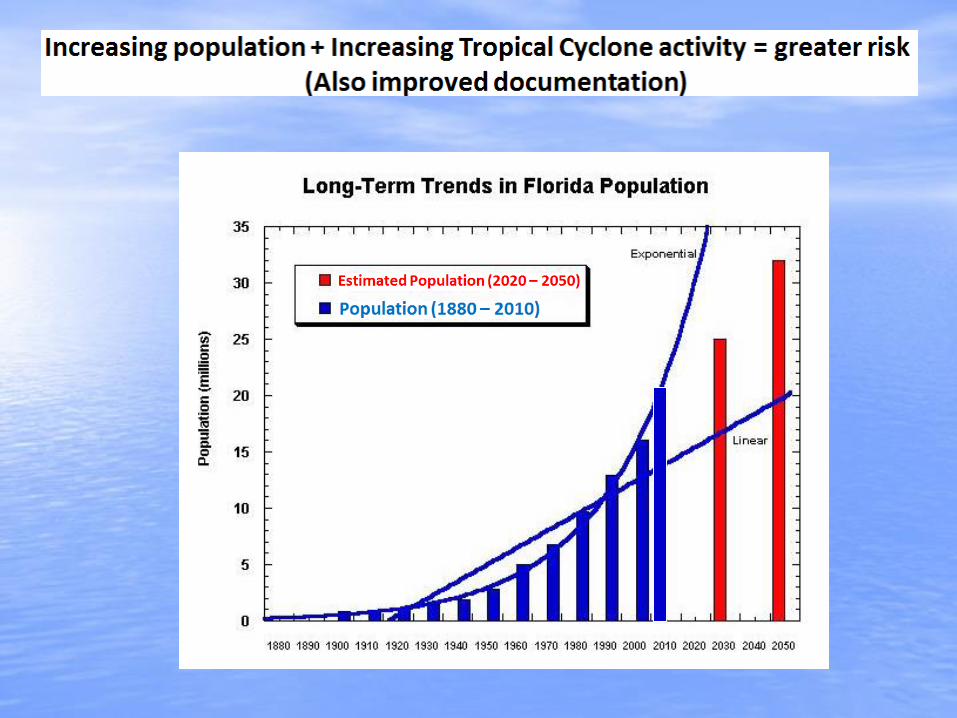
Increasing Population - Increasing Tropical CycloneActivity - Greater Documentation - Greater Risk

Types of Tornado-Producing Systems (1882-2009)
TC Tornadoes are relatively common, but the situations that bring about tornadogenesis are incredibility diverse!

694
1 2
RightFront
Location of Tornadoes Relative to Cyclone CenterWith Respect to Cyclone Motion (1882-2004)
9*
103 Cases
85
31
4
10*
Location of Tornadoes Relative to Cyclone Center
With Respect to Cyclone Motion (1882-2010)
Greatest Low-level:
Convergence – Lift
Moisture – Fuel
Wind shear - Spin

The central characteristics of the Tropical Cyclone are not necessarily an indicator of tornado potential – it is the environment of the primary outer rainbands that determines significant tornado potential. – Bart Hagemeyer

Significant Tornadoes - Focus on Outer Rainbands
Very Different Storms - Same Tornado
Result
H. OPAL
TS Gordon L
“DRY Slot”
“DRY Slot”
SRM ~40kts
SRM ~40kts

Hurricane Opal 10/4/95 - F2 Tornado 1 Dead

Tropical Storm Gordon 11/15/94 - F2 Tornado 1 Dead

Potential worst-case scenario:
Hurricane Ivan…displaced 150 miles farther east

Determining the tornado threat• Climatology/Pattern recognition (forecaster expertise)
• Large scale set-up (numerical models); wind shear, instability, dry air intrusiono Upstream weathero Location & timing of greatest potentialo Likelihood, frequency & intensity of tornado threato Evolution/movement of threat
• Near-storm environment
• Radar analyses and warning issuance
The FutureMesoscale Modeling
Hurricane Ivan Max Radar Reflectivity Simulation
John Michalakes (National Center for Atmospheric Research)
500 PM EDT APR XX, 2014

ORANGE COUNTY POTENTIAL TORNADO IMPACTS

Concluding Thoughts
• The ability to separate the more typical TC tornado from the
truly dangerous outbreaks is not nearly so advanced.
• High resolution models and continued research into
storm environments provide best chance for improvement.
• Tornado forecast ability has improved significantly. Tornado
Watches are issued for most tropical cyclones. Tornado
Warnings must be taken seriously, but false alarms can be
high. In some cases tornadoes can spin up rapidly with little
warning.
• There is no reason to believe that in the future, a TC tornado
outbreak could not kill more people than the February 1998
Extratropical Outbreak (42 fatalities).
• Worst-Case Scenario: EF2/EF3 TC TORs strike old-code or no-code
manufactured home communities and/or highly populated areas.

Note: Bart Hagemeyer conducted much of the initial tornado climatology and related assessments discussed
during this presentation.