localization of moving objects based on rfid tag array and
TRANSCRIPT

electronics
Article
Localization of Moving Objects Based on RFID TagArray and Laser Ranging Information
Shafiq Ur Rehman 1,2, Ran Liu 1,3,* , Hua Zhang 1, Gaoli Liang 1, Yulu Fu 1 andAbdul Qayoom 1,2
1 School of Information Engineering, Southwest University of Science and Technology,Mianyang 621010, China
2 Department of Computer Science, Lasbela University of Agriculture, Water and Marine Sciences,Balochistan 90150, Pakistan
3 Engineering Product Development, Singapore University of Technology and Design,Singapore 487372, Singapore
* Correspondence: [email protected]; Tel.: +65-819-473-91
Received: 25 June 2019; Accepted: 6 August 2019; Published: 10 August 2019�����������������
Abstract: RFID (radio-frequency identification) technology is rapidly emerging for the localization ofmoving objects and humans. Due to the blockage of radio signals by the human body, the localizationaccuracy achieved with a single tag is not satisfactory. This paper proposes a method based on anRFID tag array and laser ranging information to address the localization of live moving objects suchas humans or animals. We equipped a human with a tag array and calculated the phase-based radialvelocity of every tag. The laser information was, first, clustered through the DBSCAN (Density-BasedSpatial Clustering of Applications with Noise) algorithm and then laser-based radial velocity wascalculated. This velocity was matched with phase-based radial velocity to get best matching clusters.A particle filter was used to localize the moving human by fusing the matching results of bothvelocities. Experiments were conducted by using a SCITOS G5 service robot. The results verified thefeasibility of our approach and proved that our approach significantly increases localization accuracyby up to 25% compared to a single tag approach.
Keywords: moving object localization; human tracking; RFID tag array; laser clustering; velocitymatching; particle filter; DBSCAN; UHF RFID
1. Introduction
In the last few years, there has been significant research in the area of tracking, navigation,and localization of objects in different environments. Outdoor localization is easy to managewith the help of GPS, while, indoor localization has a lot of challenges like environmental factors(humidity, thickness of walls, and temperature) that can greatly affect sensor feedback, whichultimately decreases the localization accuracy. A typical indoor localization system may use differenttechnologies for localization, for example UWB (ultra-wideband) [1], Wifi [2], and RFID (radio frequencyidentification) [3]. Every technology has its limitations and advantages; for instance, printed barcodes are typically read by an optical scanner that requires a direct line-of-sight to detect and extractinformation [4]. On the other hand, RFID technology is easy to use due to its unique qualities, suchas a wide range of tag types including passive and active tags, identification through an uniqueID [5], contactless feature [6], small size [7], and cost effectiveness [8]. Hence, RFID is not only apreferred technology for indoor localization but also the most convenient one. RFID technology canfacilitate indoor localization in different complex environments, such as in the areas of supply chainmanagement, inventory control, and human or robot localization, in a cost effective way [9].
Electronics 2019, 8, 887; doi:10.3390/electronics8080887 www.mdpi.com/journal/electronics
Electronics 2019, 8, 887 2 of 17
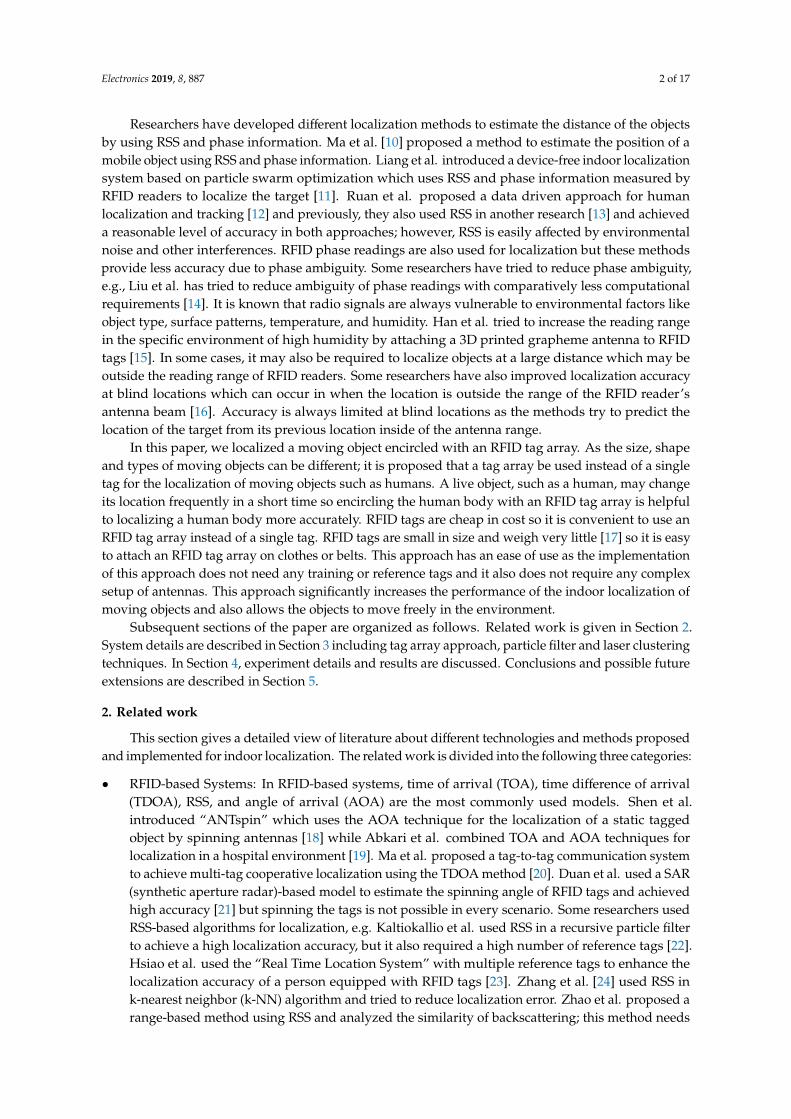
Researchers have developed different localization methods to estimate the distance of the objectsby using RSS and phase information. Ma et al. [10] proposed a method to estimate the position of amobile object using RSS and phase information. Liang et al. introduced a device-free indoor localizationsystem based on particle swarm optimization which uses RSS and phase information measured byRFID readers to localize the target [11]. Ruan et al. proposed a data driven approach for humanlocalization and tracking [12] and previously, they also used RSS in another research [13] and achieveda reasonable level of accuracy in both approaches; however, RSS is easily affected by environmentalnoise and other interferences. RFID phase readings are also used for localization but these methodsprovide less accuracy due to phase ambiguity. Some researchers have tried to reduce phase ambiguity,e.g., Liu et al. has tried to reduce ambiguity of phase readings with comparatively less computationalrequirements [14]. It is known that radio signals are always vulnerable to environmental factors likeobject type, surface patterns, temperature, and humidity. Han et al. tried to increase the reading rangein the specific environment of high humidity by attaching a 3D printed grapheme antenna to RFIDtags [15]. In some cases, it may also be required to localize objects at a large distance which may beoutside the reading range of RFID readers. Some researchers have also improved localization accuracyat blind locations which can occur in when the location is outside the range of the RFID reader’santenna beam [16]. Accuracy is always limited at blind locations as the methods try to predict thelocation of the target from its previous location inside of the antenna range.
In this paper, we localized a moving object encircled with an RFID tag array. As the size, shapeand types of moving objects can be different; it is proposed that a tag array be used instead of a singletag for the localization of moving objects such as humans. A live object, such as a human, may changeits location frequently in a short time so encircling the human body with an RFID tag array is helpfulto localizing a human body more accurately. RFID tags are cheap in cost so it is convenient to use anRFID tag array instead of a single tag. RFID tags are small in size and weigh very little [17] so it is easyto attach an RFID tag array on clothes or belts. This approach has an ease of use as the implementationof this approach does not need any training or reference tags and it also does not require any complexsetup of antennas. This approach significantly increases the performance of the indoor localization ofmoving objects and also allows the objects to move freely in the environment.
Subsequent sections of the paper are organized as follows. Related work is given in Section 2.System details are described in Section 3 including tag array approach, particle filter and laser clusteringtechniques. In Section 4, experiment details and results are discussed. Conclusions and possible futureextensions are described in Section 5.
2. Related work
This section gives a detailed view of literature about different technologies and methods proposedand implemented for indoor localization. The related work is divided into the following three categories:
• RFID-based Systems: In RFID-based systems, time of arrival (TOA), time difference of arrival(TDOA), RSS, and angle of arrival (AOA) are the most commonly used models. Shen et al.introduced “ANTspin” which uses the AOA technique for the localization of a static taggedobject by spinning antennas [18] while Abkari et al. combined TOA and AOA techniques forlocalization in a hospital environment [19]. Ma et al. proposed a tag-to-tag communication systemto achieve multi-tag cooperative localization using the TDOA method [20]. Duan et al. used a SAR(synthetic aperture radar)-based model to estimate the spinning angle of RFID tags and achievedhigh accuracy [21] but spinning the tags is not possible in every scenario. Some researchers usedRSS-based algorithms for localization, e.g. Kaltiokallio et al. used RSS in a recursive particle filterto achieve a high localization accuracy, but it also required a high number of reference tags [22].Hsiao et al. used the “Real Time Location System” with multiple reference tags to enhance thelocalization accuracy of a person equipped with RFID tags [23]. Zhang et al. [24] used RSS ink-nearest neighbor (k-NN) algorithm and tried to reduce localization error. Zhao et al. proposed arange-based method using RSS and analyzed the similarity of backscattering; this method needs

Electronics 2019, 8, 887 3 of 17
reference tags in the environment to get better localization results [25]. Wu et al. proposed anunwrapped phase position model to localize a static RFID tag [26]. Xiao et al. attached twotags to the same item and exploited the RFID phase for the localization of relatively small itemsin a controlled environment [27]. Buffi et al. tested and validated a localization method fortagged objects moving along a conveyor belt, where, in their experiments, the speed and path ofthe objects was already known [28]; however, tracking a human being is more complex as themovement path and speed of humans and animals are random. In another method [29], Buffi
et al. achieved a high localization accuracy for static tags by using the SAR (synthetic apertureradar) approach in the context of the RFID phase-based technique.
• Sensor Fusion based Systems: Researchers fused information from different sensors (e.g., laser,vision sensors, sound etc.) for the localization of the objects. Liu et al. combined RFID and a2d laser range finder to follow a dynamic RFID tag with obstacle avoidance capabilities using amobile robot [30]. Wu et al. used a fuzzy reasoning algorithm, a fused laser and RFID to localize arobot using a single RFID tag [31]. Duan et al. proposed to fuse vision and RFID sensors to get ahigh accuracy [32] but because of the limitations of vision sensors, it could only work in specificenvironments. Llorca et al. implemented a people localization system for outdoor environmentsby fusing RFID and BLE (Bluetooth Low Energy) with a vision system and was able to recognizeindividuals in a group [33]. Alfian et al. proposed an RFID-based tracking system for food itemsby utilizing data mining techniques to predict missing sensor data [34]. Yang et al. improvedparticle filters by using some characteristics of moving direction in a densely tagged environment,but this method needs a much longer time to build the system model [35]. Wu et al. proposedanother method to localize by the fusion of RFID and inertial measurement units (IMU) [36]. Theycreated a virtual map with the help of four persons carrying RFID tags and compared the mapresults with RSS to increase localization accuracy. Proximity-based approaches were also testedby different researchers for localization in RFID systems. For example, Sequeira et al. constructeda model to localize moving humans wearing RFID tags and tried to build proximity between therobot and human [37]; however, proximity-based approaches are not cost-effective as an array ofantenna is required for implementation.
• Hybrid Systems:RFID technology is also combined with other positioning systems such as GPS,Wifi, ZigBee and Bluetooth for localization. Suparyanto et al. combined inertial sensors andiGPS with RFID and developed a position monitoring system to localize container trucks [38].Digiampaolo et al. presented a global localization system for an indoor autonomous vehicleequipped with odometer and RFID reader [39]. Zheng et al. also increased localization accuracyby combining GPS and RFID technologies [40]. Some researchers merged different technologiesto improve the accuracy of indoor localization; for example, Wu et al. combined MM (magneticmatching), PDR (Pedestrian Dead Reckoning) and RFID in their research [41]. Recently, Luo et al.used Wifi and a RFID tag array to localize an educational robot [42], but arranging Wifi devices ina specific layout is needed in this hybrid system.
The different approaches are compared in Table 1.

Electronics 2019, 8, 887 4 of 17
Table 1. Comparison of related work.
Author/s Approach Accuracy (meters) Remarks Human Tracking
Shen [18] AOA technique 0.13m For static objects only No
Ma [20] TDOA 0.46m Multiple reference tags areneeded No
Kaltiokallio [22] RSS and combination ofKalman and Particle Filter 0.12–0.53m Recursive and large amount
of reference tags are required Yes
Hsiao [23] Real-time location system 0.3m Multiple reference tags andmultiple antennas are used Yes
Wu [26] Phase position modelsensors 0.096m Can work for static RFID tag
only No
Xiao [27] Multipath propagationmodel 0.06m For static items only and
many antennas are needed No
Liu [30] Fusion of laser and RFID 0.2–0.65m Specific environment andtracking of single tag Yes
Wu [31] Fuzzy reasoning algorithmand fusion of laser and RFID 0.09m Works for robot localization No
Wu [36] Graph-based mapping withRFID and PDR 1.2m Localization accuracy is
limited. Yes
Our Approach Fusion of RFID tag arrayand laser 0.38m
No reference tags needed,model free and tracking of
dynamic moving objectYes
Existing approaches require reference tags, antenna arrays, or are developed for specificenvironments/objects, while our approach localizes a human in a cost-effective way with lesscomputation and relatively high accuracy. Details of all the symbols used in this paper are defined inTable 2.
Table 2. Definition of mathematical symbols.
Mathematical Symbols Definitions
Xt Position of the object at time tgt Measurement of laser at time tut Motion information of the object at time tηt Normalization factor at time t
rtagt Measurement of RFID tag at time t
ω[n]t
Weight of particle n at time t
X[n]t
State of the particle at time t
x[n]t , y[n]tLocation of particle n at time t
N Number of particlesK The best matching K clustersσt Gaussian noise at time tl Nearest cluster
vit Laser-based radial velocity of cluster i at time t
vrt Phase-based radial velocity of the tag at time t
Cit Laser cluster i at time tσd Translation coefficient to the distance functionε Epsilon represents minimum distance between two laser pointsζ MinPoints is minimum number of laser points to form a dense region
(xit,y
it) Center of cluster i at time t
ϕt Signal phase at time tc Velocity of lightf Signal frequency
3. System Details
In this paper, we propose a tag array approach to deal with the localization and tracking of livemoving objects (human). Previously, Fu et al. had developed an approach to track a moving object byusing a single tag carried by a human [43] but we have used a tag array from a different perspectiveand used DBSCAN for better clustering results of laser data. As the system is supposed to localize the

Electronics 2019, 8, 887 5 of 17
tags at specific timestamps, so the tag array approach will always give better localization results than asingle tag approach. We have conducted different experiments to verify the localization accuracy ofour approach. The results of our experiments strengthened and proved this argument. Our approachallows the human to move freely in the environment so this approach can satisfy many industrialneeds such as tracking patients in hospital environment, monitoring pets, and the localization of ahuman in a building etc. Secondly, RFID tags are not expensive so it is also a cost effective approach touse tag array instead of only one tag.
As shown in Figure 1, the entire localization system can be divided into three parts. The first partuses an RFID reader and 2d laser range finder to receive the measurements from the environment. Thesecond part processes the measurements collected from the RFID and the laser range finder. The thirdpart uses a particle filter to achieve the tracking and localization of a dynamic object.
Electronics 2019, 8, x FOR PEER REVIEW 5 of 17
( ��, ���� ) Center of cluster i at time t �� Signal phase at time t � Velocity of light � Signal frequency
3. System Details
In this paper, we propose a tag array approach to deal with the localization and tracking of live
moving objects (human). Previously, Fu et al. had developed an approach to track a moving object
by using a single tag carried by a human [43] but we have used a tag array from a different
perspective and used DBSCAN for better clustering results of laser data. As the system is supposed
to localize the tags at specific timestamps, so the tag array approach will always give better
localization results than a single tag approach. We have conducted different experiments to verify
the localization accuracy of our approach. The results of our experiments strengthened and proved
this argument. Our approach allows the human to move freely in the environment so this approach
can satisfy many industrial needs such as tracking patients in hospital environment, monitoring
pets, and the localization of a human in a building etc. Secondly, RFID tags are not expensive so it is
also a cost effective approach to use tag array instead of only one tag.
As shown in Figure 1, the entire localization system can be divided into three parts. The first
part uses an RFID reader and 2d laser range finder to receive the measurements from the
environment. The second part processes the measurements collected from the RFID and the laser
range finder. The third part uses a particle filter to achieve the tracking and localization of a dynamic
object.
Figure 1. System flowchart giving a brief overview of the system. Figure 1. System flowchart giving a brief overview of the system.
Our proposed approach fuses laser and RFID phase information in a particle filter. Laserinformation is fragmented into different clusters. The laser cluster velocity and phase-based velocityof each tag is calculated to match both velocities to find the position of the tag. Laser raw data areprocessed with the help of the DBSCAN algorithm to find laser clusters and then calculate laser velocity.At the same time, RFID information which consists of antenna ID, tag ID, phase, and timestamp iscollected. Due to multiple tag readings at the same time stamp, we pulled together all tag informationto calculate the phase-based RFID velocity of each tag at specific timestamps. We compared laservelocity and phase-based velocity and extracted the similarities between them. Among similarityresults, we choose the best laser clusters for the data input of particle filtering. This simple approachhighly increases the localization accuracy.
Electronics 2019, 8, 887 6 of 17
3.1. Tag Array Importance in Our Approach
Some researchers have tried to localize daily used objects (static) which are equipped with a tagarray in a limited and controlled environment [44]. Tracking an animal or human in a cost-effectivemanner in a complex environment still needs a lot of effort. Wang et al. tried to improve the localizationaccuracy of a moving finger to improve gesture learning through an RFID tag array [45]; however, itcannot be used for relatively large objects like humans. Nakamori et al. read body posture and theprobability among deducted objects to be a human body by using laser range finders [46] but only fora specific game-playing environment.
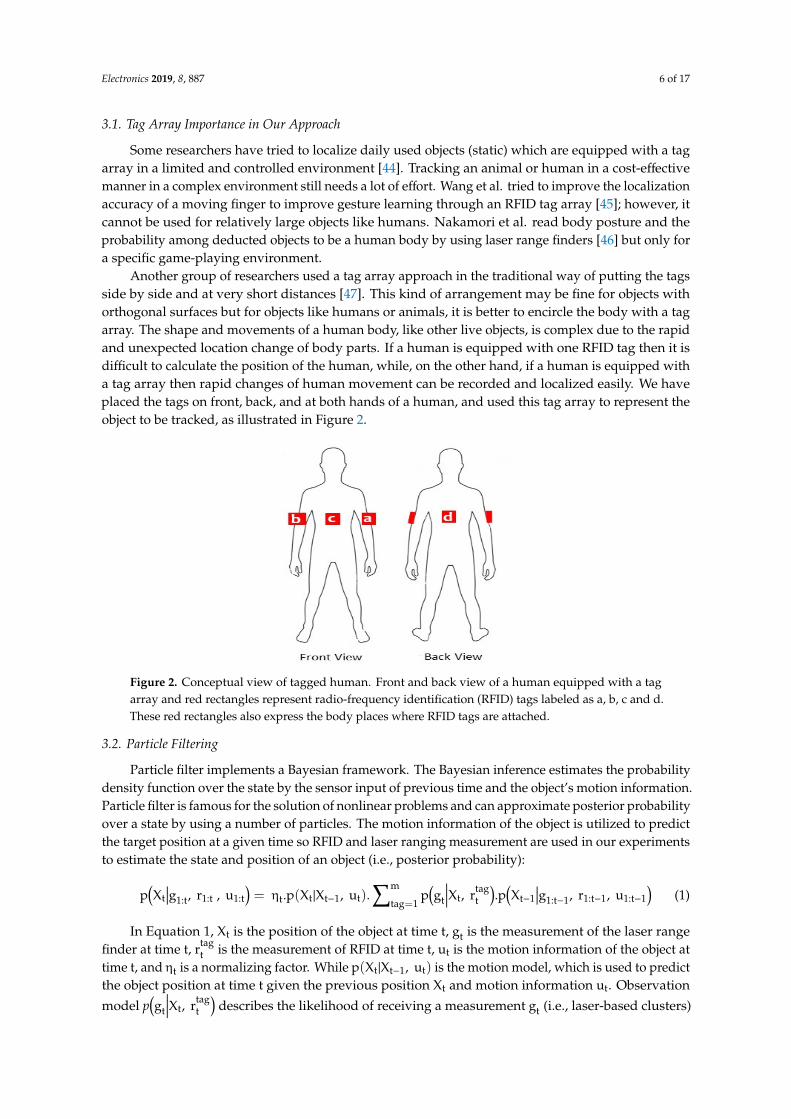
Another group of researchers used a tag array approach in the traditional way of putting the tagsside by side and at very short distances [47]. This kind of arrangement may be fine for objects withorthogonal surfaces but for objects like humans or animals, it is better to encircle the body with a tagarray. The shape and movements of a human body, like other live objects, is complex due to the rapidand unexpected location change of body parts. If a human is equipped with one RFID tag then it isdifficult to calculate the position of the human, while, on the other hand, if a human is equipped witha tag array then rapid changes of human movement can be recorded and localized easily. We haveplaced the tags on front, back, and at both hands of a human, and used this tag array to represent theobject to be tracked, as illustrated in Figure 2.
Electronics 2019, 8, x FOR PEER REVIEW 6 of 17
Our proposed approach fuses laser and RFID phase information in a particle filter. Laser
information is fragmented into different clusters. The laser cluster velocity and phase-based velocity
of each tag is calculated to match both velocities to find the position of the tag. Laser raw data are
processed with the help of the DBSCAN algorithm to find laser clusters and then calculate laser
velocity. At the same time, RFID information which consists of antenna ID, tag ID, phase, and
timestamp is collected. Due to multiple tag readings at the same time stamp, we pulled together all
tag information to calculate the phase-based RFID velocity of each tag at specific timestamps. We
compared laser velocity and phase-based velocity and extracted the similarities between them.
Among similarity results, we choose the best laser clusters for the data input of particle filtering.
This simple approach highly increases the localization accuracy.
3.1. Tag Array Importance in Our Approach
Some researchers have tried to localize daily used objects (static) which are equipped with a tag
array in a limited and controlled environment [44]. Tracking an animal or human in a cost-effective
manner in a complex environment still needs a lot of effort. Wang et al. tried to improve the
localization accuracy of a moving finger to improve gesture learning through an RFID tag array [45];
however, it cannot be used for relatively large objects like humans. Nakamori et al. read body
posture and the probability among deducted objects to be a human body by using laser range
finders [46] but only for a specific game-playing environment.
Another group of researchers used a tag array approach in the traditional way of putting the
tags side by side and at very short distances [47]. This kind of arrangement may be fine for objects
with orthogonal surfaces but for objects like humans or animals, it is better to encircle the body with
a tag array. The shape and movements of a human body, like other live objects, is complex due to the
rapid and unexpected location change of body parts. If a human is equipped with one RFID tag then
it is difficult to calculate the position of the human, while, on the other hand, if a human is equipped
with a tag array then rapid changes of human movement can be recorded and localized easily. We
have placed the tags on front, back, and at both hands of a human, and used this tag array to
represent the object to be tracked, as illustrated in Figure 2.
Figure 2. Conceptual view of tagged human. Front and back view of a human equipped with a tag
array and red rectangles represent radio-frequency identification (RFID) tags labeled as a, b, c and d.
These red rectangles also express the body places where RFID tags are attached.
3.2. Particle Filtering
Particle filter implements a Bayesian framework. The Bayesian inference estimates the
probability density function over the state by the sensor input of previous time and the object’s
motion information. Particle filter is famous for the solution of nonlinear problems and can
approximate posterior probability over a state by using a number of particles. The motion
information of the object is utilized to predict the target position at a given time so RFID and laser
Figure 2. Conceptual view of tagged human. Front and back view of a human equipped with a tagarray and red rectangles represent radio-frequency identification (RFID) tags labeled as a, b, c and d.These red rectangles also express the body places where RFID tags are attached.
3.2. Particle Filtering
Particle filter implements a Bayesian framework. The Bayesian inference estimates the probabilitydensity function over the state by the sensor input of previous time and the object’s motion information.Particle filter is famous for the solution of nonlinear problems and can approximate posterior probabilityover a state by using a number of particles. The motion information of the object is utilized to predictthe target position at a given time so RFID and laser ranging measurement are used in our experimentsto estimate the state and position of an object (i.e., posterior probability):
p(Xt
∣∣∣g1:t, r1:t , u1:t)= ηt.p(Xt|Xt−1, ut).
∑m
tag=1p(gt
∣∣∣∣Xt, rtagt
).p
(Xt−1
∣∣∣g1:t−1, r1:t−1, u1:t−1)
(1)
In Equation 1, Xt is the position of the object at time t, gt is the measurement of the laser rangefinder at time t, rtag
t is the measurement of RFID at time t, ut is the motion information of the object attime t, and ηt is a normalizing factor. While p(Xt|Xt−1, ut) is the motion model, which is used to predictthe object position at time t given the previous position Xt and motion information ut. Observation
model p(gt
∣∣∣∣Xt, rtagt
)describes the likelihood of receiving a measurement gt (i.e., laser-based clusters)

Electronics 2019, 8, 887 7 of 17
given the RFID measurement rtagt and the current state Xt. Further, p
(Xt−1
∣∣∣g1:t−1, r1:t−1, u1:t−1)
is thestate at time t − 1. Location of a particle Xt is denoted as
Xt ={X[n]
t , ω[n]t
}N
n=1(2)
where ω[n]t is particle weight [2] and X[n]
t is represented as
X[n]t =
{x[n]t , y[n]t
}(3)
Equation (3) denotes the 2D location of the particle. The particle filter performs three steps:Prediction, update, and resampling. At the prediction stage, we predict the state of a particle x[n]t .
Prediction is computed by using the information of previous state x[n]t−1 and the object’s motion ut. Aswe do not know the moving direction of the particle so it can be described as x[n]t = x[n]t−1 + N(O,σt)
y[n]t = y[n]t−1 + N(O, σt)(4)
where σt represents the Gaussian noise. We, first, find the nearest cluster l of particle n, and use ∆t.vlt as
σt, where ∆t is the time difference between two timestamps and vlt is the laser-based radial velocity of
nearest cluster l at time t. At the update stage of the particle filter, we change the previous prediction byusing current information and update the weights of the particles. We represent the object location bya number of particles with different weights. Weightω[n]
t of the particle X[n]t is computed in Equation 5
based on the observation model p(gt
∣∣∣∣Xt, rtagt
).
ω[n]t = ηt.ω
[n]t−1.p
(gt
∣∣∣∣X[n]t , rtag
t
)(5)
While combined with the weighted K most similar clusters, the observation model p(gt
∣∣∣∣Xt, rtagt
)is approximated as
p(gt
∣∣∣∣Xt, rtagt
)=
k∑i=1
sim(vi
t, vrt
). exp
−d2
(X[n]
t , Cit
)2
(6)
d2(X[n]
t , Cit
)=
(x[n]t − xi
t
)2
σd+
(y[n]
t − xit
)2
σd(7)
In Equation (7), σd is translation coefficient to the distance function. An important stage of theparticle filter is to resample the particles as per the weight of the particle. Resampling is done whenweight of particles is updated. After a reasonable number of iterations, less weighted particles arereplaced with a high weighted set of particles.
3.3. Laser Clustering
We use a 2D laser range finder to scan the environment. Laser information is used to get thedistance of a moving object. Laser data are divided into different clusters. A clustering algorithmDBSCAN is used for the clustering of laser data. DBSCAN groups together those points which areclose to each other based on a distance measurement (usually Euclidean distance). It also marks thepoints that are in low-density regions as outliers. It uses two basic parameters, Epsilon ε and MinPointsζ. Different details of these parameters are given as below.

Electronics 2019, 8, 887 8 of 17
• Epsilon ε is the radius of neighborhood around a point. It means that if the distance between twopoints is lower or equal to ε, these points are considered as neighbors. If the ε value chosen is toosmall, a large part of the data will not be clustered. Those values will be considered as outliersbecause they do not satisfy the number of points to create a dense region. On the other hand, ifthe value is chosen to be too high, clusters will be merged and the majority of objects will be in thesame cluster. The ε should be chosen based on the distance of the dataset but, in general, small εvalues are preferable.
• MinPoints ζ is the minimum number of points to form a dense region. For example, if we setthe ζ as 5, then we need at least 5 points to form a dense region. As a general rule, a minimumζ can be derived from a number of dimensions (D) in the data set, as ζ ≥ D + 1. Larger valuesare usually better for data sets with noise and will form more significant clusters. The minimumvalue for the ζmust be 2, but for a larger data set, a larger ζ value should be chosen.
Figure 3; Figure 4 represent raw laser data and clustering results using DBSCAN parameters,epsilon ε, and MinPoints ζ.
Electronics 2019, 8, x FOR PEER REVIEW 8 of 17
points that are in low-density regions as outliers. It uses two basic parameters, Epsilon ε and
MinPoints ζ. Different details of these parameters are given as below.
• Epsilon ε is the radius of neighborhood around a point. It means that if the distance between
two points is lower or equal to ε, these points are considered as neighbors. If the ε value chosen
is too small, a large part of the data will not be clustered. Those values will be considered as
outliers because they do not satisfy the number of points to create a dense region. On the other
hand, if the value is chosen to be too high, clusters will be merged and the majority of objects
will be in the same cluster. The ε should be chosen based on the distance of the dataset but, in
general, small ε values are preferable.
• MinPoints ζ is the minimum number of points to form a dense region. For example, if we set the
ζ as 5, then we need at least 5 points to form a dense region. As a general rule, a minimum ζ can
be derived from a number of dimensions (D) in the data set, as ζ ≥ D + 1. Larger values are
usually better for data sets with noise and will form more significant clusters. The minimum
value for the ζ must be 2, but for a larger data set, a larger ζ value should be chosen.
Figure 3; Figure 4 represent raw laser data and clustering results using DBSCAN parameters,
epsilon ε, and MinPoints ζ.
Figure 3. Raw Laser Data. It shows laser points readings during the experiment when multiple
humans are moving in the test area.
Figure 3. Raw Laser Data. It shows laser points readings during the experiment when multiple humansare moving in the test area.
Electronics 2019, 8, x FOR PEER REVIEW 8 of 17
points that are in low-density regions as outliers. It uses two basic parameters, Epsilon ε and
MinPoints ζ. Different details of these parameters are given as below.
• Epsilon ε is the radius of neighborhood around a point. It means that if the distance between
two points is lower or equal to ε, these points are considered as neighbors. If the ε value chosen
is too small, a large part of the data will not be clustered. Those values will be considered as
outliers because they do not satisfy the number of points to create a dense region. On the other
hand, if the value is chosen to be too high, clusters will be merged and the majority of objects
will be in the same cluster. The ε should be chosen based on the distance of the dataset but, in
general, small ε values are preferable.
• MinPoints ζ is the minimum number of points to form a dense region. For example, if we set the
ζ as 5, then we need at least 5 points to form a dense region. As a general rule, a minimum ζ can
be derived from a number of dimensions (D) in the data set, as ζ ≥ D + 1. Larger values are
usually better for data sets with noise and will form more significant clusters. The minimum
value for the ζ must be 2, but for a larger data set, a larger ζ value should be chosen.
Figure 3; Figure 4 represent raw laser data and clustering results using DBSCAN parameters,
epsilon ε, and MinPoints ζ.
Figure 3. Raw Laser Data. It shows laser points readings during the experiment when multiple
humans are moving in the test area.
Figure 4. Clustered Laser Data. It shows the laser points after applying DBSCAN (Density-BasedSpatial Clustering of Applications with Noise).

Electronics 2019, 8, 887 9 of 17
3.4. Comparison of Phase-based Radial Velocity and Cluster-based Radial Velocity
First, we have to find distance dit between two clusters to find laser-based radial velocity vi
t and
for every cluster Cit at time t, we find the nearest cluster C j
t−1 at the previous time t–1. Therefore, both
clusters(Ci
t, C jt−1
)could be considered as the same object at two sequent timestamps. Laser-based
radial velocity vit is calculated in Equation 8:
vit =
∆dit
∆t=
√(xi
t
)2+
(yi
t
)2−
√(xj
t−1
)2+
(yj
t−1
)2
∆t(8)
where (xit, yi
t ) is center of cluster Cit and (xj
t−1, yjt−1) is center of cluster C j
t−1. While j is calculated as
j = argminj
√(xi
t − xjt−1
)2+
(yi
t − yjt−1
)2(9)
where 1 ≤ j ≤ Nt−1 and radial velocity of the tag based on phase difference vrt is calculated as
vrt =
∆ϕt
∆t=
c4πf∆t
.(ϕt −ϕt−1) (10)
In Equation (10), c is the velocity of light,f is signal frequency, and ∆ϕt is the phase difference ofthe tag at two successive times. Comparison results derived from Equation 11 can identify whetherboth of them are from the same object or not.
sim(vi
t, vrt
)= 1 −
∣∣∣vit − vr
t
∣∣∣∣∣∣vit
∣∣∣+ ∣∣∣vrt
∣∣∣ (11)
It is observed that a high similarity result creates more chances that the corresponding laser clusteris our target object. For further improvement of the system, we updated the weight of the particles byselecting the clusters having the best similarity results as potential objects.
4. Experiment Details
We have checked and verified our approach by executing different experiments. The experimentswere performed on a SCITOS G5 service robot (manufactured in Metralabs GmbH, Ilmenau, Germany),as shown in Figure 5. The robot has a 2D laser range finder (SICK S300), two circularly polarizedantennas (RFMAX SS8688P), and a UHF RFID reader (Speedway Revolution R420) which has asampling frequency of 2 Hz and has reading range up to 7 m (meter). All experiments are conductedwith Dense Reader Mode 8 (DRM8) and the RFID reader channel is fixed at 920.625 MHz. The RFIDantennas and tags are at same height of 1.2 m above the ground. The measuring range for the laserrange finder is up to 29m, within the angle of 270◦ and resolution of 0.5◦. In addition, the laser rangefinder works at a frequency of 20 Hz. A human, which is our target object, was equipped with fourtags (Alien Squiggle RFID Wet Inlay from Alien Technology, San Jose, CA, USA) in the experiments.

Electronics 2019, 8, 887 10 of 17
Electronics 2019, 8, x FOR PEER REVIEW 10 of 17
(a) (b)
(c) (d)
Figure 5. Robot and experiment setup. (a)An example of a real time experiment; (b) conceptual view
of the environment; (c) another human moving in the test area; (d) multiple humans moving in test
area.
As shown in Figure 5a, the SCITOS G5 robot already has all the required sensors and setup so it
was convenient to use this robot instead of setting up a separate RFID system. We setup a
rectangular area of 4 × 2m for experiments and setup the movement path as follows.
• TEST 1: Simple rectangular trajectory.
• TEST 2: Crossed rectangular trajectory.
The robot was placed at a distance of 1 m perpendicular to the test area, as shown in Figure 5.
The human moved for 4 rounds at simple rectangular path and crossed rectangular path.
Experiments were also conducted for both (clockwise and anticlockwise) directions of the concerned
path. The human, equipped with an RFID tag array, stopped at some points but mostly moved with
a velocity of approximately 0.4 m/s. In another set of experiments, multiple humans moved in the
testing area and the effect of multiple persons was also verified for the proposed method. As the
method used similarity results between laser cluster radial velocity and RFID phase-based radial
velocity, it was observed that the best matching cluster was our target object.
4.1. Evaluation of Tracking Accuracy
Figures 6 and 7 show that the estimated paths were almost consistent with true paths for the
both simple rectangular trajectory and the crossed rectangular trajectory.
Figure 5. Robot and experiment setup. (a)An example of a real time experiment; (b) conceptual view ofthe environment; (c) another human moving in the test area; (d) multiple humans moving in test area.
As shown in Figure 5a, the SCITOS G5 robot already has all the required sensors and setup so itwas convenient to use this robot instead of setting up a separate RFID system. We setup a rectangulararea of 4 × 2m for experiments and setup the movement path as follows.
• TEST 1: Simple rectangular trajectory.• TEST 2: Crossed rectangular trajectory.
The robot was placed at a distance of 1 m perpendicular to the test area, as shown in Figure 5. Thehuman moved for 4 rounds at simple rectangular path and crossed rectangular path. Experimentswere also conducted for both (clockwise and anticlockwise) directions of the concerned path. Thehuman, equipped with an RFID tag array, stopped at some points but mostly moved with a velocityof approximately 0.4 m/s. In another set of experiments, multiple humans moved in the testing areaand the effect of multiple persons was also verified for the proposed method. As the method usedsimilarity results between laser cluster radial velocity and RFID phase-based radial velocity, it wasobserved that the best matching cluster was our target object.
4.1. Evaluation of Tracking Accuracy
Figures 6 and 7 show that the estimated paths were almost consistent with true paths for the bothsimple rectangular trajectory and the crossed rectangular trajectory.

Electronics 2019, 8, 887 11 of 17Electronics 2019, 8, x FOR PEER REVIEW 11 of 17
Figure 6. Comparison of ground truth and estimated track for 4× 2m with a simple rectangular
trajectory.
Figure 7. Comparison of ground truth and estimated track for 4× 2m with a crossed rectangular
trajectory.
In Table 3, the average localization error represents rooted mean square error and it is defined
as the Euclidean distance between the ground truth and the estimated position. It is observed that,
for both TEST1 and TEST2, localization accuracy was significantly improved, as shown in Table 3.
For every TEST, we performed different experiments and checked the results with different
combinations of tags, starting from a single tag to four tags. Table 3 gives detailed results of different
combinations of tags in different TESTs. Results show that using two tags is better than single tag
and the usage of three tags is better than two tags. Four tags also give slightly better results than
using three tags. It also strengthens the argument that using more than four tags may not be very
useful because the “percentage of improvement in accuracy” reduces to an almost minimum level
when the number of tags is increased from three to four. In a column of Table 3 named as “RFID Tag
Combinations”, the letters a, b, c, and d are considered as RFID tag id attached at left hand, right
hand, front, and back of the human, respectively.
Table 3. Evaluation of the average localization error (meter).
Total Tags RFID Tag
Combinations
Average Localization Error
of TEST 1 (m)
Average Localization Error
of TEST 2 (m)
Clockwise Anticlockwise Clockwise Anticlockwise
1 a 0.48 0.76 0.61 0.59
-3 -2 -1 0 1 2 3-1
-0.5
0
0.5
1
1.5
2
2.5
3
3.5
4
Robot position
x(m)
y(m)
True path
Estimated path
-3 -2 -1 0 1 2 3-1
-0.5
0
0.5
1
1.5
2
2.5
3
3.5
4
Robot position
x(m)
y(m)
True path
Estimated path
Figure 6. Comparison of ground truth and estimated track for 4× 2m with a simple rectangular trajectory.
Electronics 2019, 8, x FOR PEER REVIEW 11 of 17
Figure 6. Comparison of ground truth and estimated track for 4× 2m with a simple rectangular
trajectory.
Figure 7. Comparison of ground truth and estimated track for 4× 2m with a crossed rectangular
trajectory.
In Table 3, the average localization error represents rooted mean square error and it is defined
as the Euclidean distance between the ground truth and the estimated position. It is observed that,
for both TEST1 and TEST2, localization accuracy was significantly improved, as shown in Table 3.
For every TEST, we performed different experiments and checked the results with different
combinations of tags, starting from a single tag to four tags. Table 3 gives detailed results of different
combinations of tags in different TESTs. Results show that using two tags is better than single tag
and the usage of three tags is better than two tags. Four tags also give slightly better results than
using three tags. It also strengthens the argument that using more than four tags may not be very
useful because the “percentage of improvement in accuracy” reduces to an almost minimum level
when the number of tags is increased from three to four. In a column of Table 3 named as “RFID Tag
Combinations”, the letters a, b, c, and d are considered as RFID tag id attached at left hand, right
hand, front, and back of the human, respectively.
Table 3. Evaluation of the average localization error (meter).
Total Tags RFID Tag
Combinations
Average Localization Error
of TEST 1 (m)
Average Localization Error
of TEST 2 (m)
Clockwise Anticlockwise Clockwise Anticlockwise
1 a 0.48 0.76 0.61 0.59
-3 -2 -1 0 1 2 3-1
-0.5
0
0.5
1
1.5
2
2.5
3
3.5
4
Robot position
x(m)
y(m)
True path
Estimated path
-3 -2 -1 0 1 2 3-1
-0.5
0
0.5
1
1.5
2
2.5
3
3.5
4
Robot position
x(m)
y(m)
True path
Estimated path
Figure 7. Comparison of ground truth and estimated track for 4× 2m with a crossedrectangular trajectory.
In Table 3, the average localization error represents rooted mean square error and it is defined asthe Euclidean distance between the ground truth and the estimated position. It is observed that, forboth TEST1 and TEST2, localization accuracy was significantly improved, as shown in Table 3. Forevery TEST, we performed different experiments and checked the results with different combinationsof tags, starting from a single tag to four tags. Table 3 gives detailed results of different combinationsof tags in different TESTs. Results show that using two tags is better than single tag and the usageof three tags is better than two tags. Four tags also give slightly better results than using three tags.It also strengthens the argument that using more than four tags may not be very useful because the“percentage of improvement in accuracy” reduces to an almost minimum level when the number oftags is increased from three to four. In a column of Table 3 named as “RFID Tag Combinations”, theletters a, b, c, and d are considered as RFID tag id attached at left hand, right hand, front, and back ofthe human, respectively.

Electronics 2019, 8, 887 12 of 17
Table 3. Evaluation of the average localization error (meter).
Total Tags RFID TagCombinations
Average Localization Error ofTEST 1 (m)
Average Localization Error ofTEST 2 (m)
Clockwise Anticlockwise Clockwise Anticlockwise
1 a 0.48 0.76 0.61 0.59b 0.86 0.50 0.57 0.63c 1.50 1.60 1.33 1.28d 1.75 2.11 1.84 1.17
2 a + b 0.41 0.45 0.53 0.56a + c 0.44 0.60 0.57 0.58a + d 0.45 0.62 0.59 0.60b + d 0.63 0.46 0.55 0.62b + c 0.60 0.45 0.54 0.61c + d 0.77 0.74 0.92 0.84
3 a + b + d 0.40 0.44 0.51 0.55a + b + c 0.39 0.43 0.50 0.54a + c + d 0.43 0.50 0.55 0.58b + c + d 0.47 0.45 0.53 0.61
4 a + b + c + d 0.38 0.41 0.49 0.52
4.2. Impact of Number of Moving Humans
We verified this proposed method for another possible scenario. There is a possibility of multiplehumans moving around the target object so we checked the impact of a different number of movinghumans in the testing area. It can be observed from the results of Table 4 that the number of movinghumans has a small effect on the accuracy. In the first set of experiments, a human randomly moved inthe test area at the same time as the target object was moving (as shown in Figure 5c) and the accuracybecame slightly better (from 0.38m to 0.37m) as one human did not disturb the tag readings and theclustering results got better due to the increase in moving objects in the area.
Table 4. Impact of Number of Moving objects in test area.
Total TagsTotal Number
of MovingHuman
Average Localization Error ofTEST 1 (m)
Average Localization Error ofTEST 2 (m)
Clockwise Anticlockwise Clockwise Anticlockwise
4 2 0.37 0.40 0.47 0.504 3 0.39 0.44 0.51 0.54
In second set of experiments, when two persons moved randomly in the test area (as shown inFigure 5d) then the laser clustering got better but there were more chances that a human would blockthe RFID readings at some moments so localization accuracy slightly decreased from 0.38m to 0.39m.
4.3. Impact of Different Parameters
We checked the impact of different important parameters in this experiment. The impact ofnumber of particle, K best matching clusters, and DBSCAN parameters were checked for the rectanglewith simple rectangular path (TEST 1) in clockwise direction.
4.3.1. Impact of Number of Particles (N)
We checked the system for different number of particles. Since we use particle filtering for thetracking, the number of particles N directly affects the localization accuracy and the running time ofthe algorithm. The results are shown in Table 5. We used a CPU with Corei5-3337u (1.8GHz) with 4GBRAM for the processing. The other parameters of the experiments are set as follows: ε = 0.2, ζ = 2, K =
4, and σd = 0.05.

Electronics 2019, 8, 887 13 of 17
Table 5. Effect of particle numbers N on localization accuracy and running time.
N 5 50 100 200 300 500 800 1000
Error(m) 4.39 0.41 0.39 0.38 0.39 0.38 0.40 0.39Time(ms) 9.52 10.14 11.01 12.82 14.68 17.93 23.16 26.73
It is observed that number of particles has a significant impact on localization accuracy. When Nis less than 50, then the localization accuracy is not satisfactory and accuracy gets better when N isgreater than 100. The best localization accuracy can be observed when the value of N is in between 200and 500. Simultaneously, execution time is always smaller when the number of particles is reduced.We can see from Table 5, when value of N is set to 200 then it gives the best result in the minimumexecution time of 12.82 milliseconds.
4.3.2. Impact of the Best Matching Clusters (K)
K and σd are two important parameters to update particle filter. Table 6 shows the impact of thelocalization accuracy under this parameter. The remaining parameters are set as follows: ε = 0.2, ζ = 2,and N = 200.
Table 6. Effect of K and σd on localization accuracy.
Electronics 2019, 8, x FOR PEER REVIEW 13 of 17
Table 5. Effect of particle numbers N on localization accuracy and running time.
N 5 50 100 200 300 500 800 1000
Error(m) 4.39 0.41 0.39 0.38 0.39 0.38 0.40 0.39
Time(ms) 9.52 10.14 11.01 12.82 14.68 17.93 23.16 26.73
It is observed that number of particles has a significant impact on localization accuracy. When N is less than 50, then the localization accuracy is not satisfactory and accuracy gets better when N is greater than 100. The best localization accuracy can be observed when the value of N is in between 200 and 500. Simultaneously, execution time is always smaller when the number of particles is reduced. We can see from Table 5, when value of N is set to 200 then it gives the best result in the minimum execution time of 12.82 milliseconds.
4.3.2. Impact of the Best Matching Clusters (K)
K and 𝜎 are two important parameters to update particle filter. Table 6 shows the impact of the localization accuracy under this parameter. The remaining parameters are set as follows: ε = 0.2, ζ = 2, and N = 200.
Table 6. Effect of K and 𝜎 on localization accuracy.
Error (m) 0.01 0.05 0.1 0.5
1 1.26 0.48 0.86 7.01
2 0.41 0.41 0.41 0.47
3 0.39 0.39 0.39 0.44
4 0.40 0.38 0.40 0.45
7 0.41 0.39 0.40 0.45
10 0.41 0.39 0.43 0.47
13 0.41 0.40 0.39 0.45
It can be seen from Table 6, K and 𝜎 have a significant effect on the localization accuracy. As there are no obstacles in the test area or in the way of the moving object, k>2 will give the best result. Translation coefficient 𝜎 gives the best result of 0.38m when it is set to a value of 0.05 so k=4 and 𝜎 =0.05 can be used to get the best localization accuracy.
4.3.3. Impact of Epsilon ε and MinPoints ζ
DBSCAN clustering is controlled by two parameters: Epsilon ε and the minimum number of points ζ. DBSCAN parameter setting depends upon the clustering requirements of the system. In this system, laser data is being clustered and it requires several experiments to be performed to test the effect of ε and ζ on the localization accuracy. The results are shown in Table 7. We set other parameters as follows: N = 200, K = 4, and σ = 0.05. As can be seen from Table 7, a setting of ε = 0.2 and ζ = 2 gives the best localization result. We can see that a very small value of ε (e.g., 0.05) has a high impact on the localization accuracy and when its value is equal to or greater than 0.2, the impact is almost stable, provided that minPoints ζ is less than 4. It is also observed that a very high value of minPoints ζ (for example, 10) gives very bad results; on the other hand, a too-small value of minPoints ζ also increases the error, and the best results are at a value of 2.
K
𝜎
It can be seen from Table 6, K and σd have a significant effect on the localization accuracy. Asthere are no obstacles in the test area or in the way of the moving object, k>2 will give the best result.Translation coefficient σd gives the best result of 0.38m when it is set to a value of 0.05 so k=4 and σd=0.05 can be used to get the best localization accuracy.
4.3.3. Impact of Epsilon ε and MinPoints ζ
DBSCAN clustering is controlled by two parameters: Epsilon ε and the minimum number ofpoints ζ. DBSCAN parameter setting depends upon the clustering requirements of the system. In thissystem, laser data is being clustered and it requires several experiments to be performed to test theeffect of ε and ζ on the localization accuracy. The results are shown in Table 7. We set other parametersas follows: N = 200, K = 4, and σd = 0.05. As can be seen from Table 7, a setting of ε = 0.2 and ζ = 2gives the best localization result. We can see that a very small value of ε (e.g., 0.05) has a high impacton the localization accuracy and when its value is equal to or greater than 0.2, the impact is almoststable, provided that minPoints ζ is less than 4. It is also observed that a very high value of minPointsζ (for example, 10) gives very bad results; on the other hand, a too-small value of minPoints ζ alsoincreases the error, and the best results are at a value of 2.

Electronics 2019, 8, 887 14 of 17
Table 7. Effect of ε and ζ on localization accuracy.
Electronics 2019, 8, x FOR PEER REVIEW 14 of 17
Table 7. Effect of ε and ζ on localization accuracy.
Error (m) 1 2 3 4 7 10
0.05 0.61 0.85 3.98 4.05 4.07 4.21
0.1 0.45 0.39 0.66 0.69 4.02 4.08
0.2 0.41 0.38 0.39 0.43 2.72 3.90
0.3 0.39 0.39 0.39 2.38 1.82 3.92
0.5 0.39 0.39 0.39 0.42 8.57 6.68
5. Conclusion
In this paper, we proposed a different approach to localize a moving human equipped with an RFID tag array. We have calculated the phase-based radial velocity of RFID tags and compared it with laser-based radial velocity. Laser information was clustered through the DBSCAN algorithm. The best matching clusters were measured and fused with phase-based radial velocity in a particle filter. It was observed that for an area of 4 × 2m with a simple rectangular path, the tag array method gave a 25% increase in localization accuracy compared to a single tag approach. We plan to embed signal strength in this method and may also move the robot and object at the same time in upcoming work.
Author Contributions: S.Ur.R. analyzed the data and wrote the paper. R.L. proposed the idea and designed the experiments, G.L. and Y.F. conducted the experiments. H.Z. and A.Q. reviewed the paper.
Funding: This work is funded by the National Natural Science Foundation of China (No. 61601381 and 61701421), and partially by China’s 13th Five-Year Plan in the Development of Nuclear Energy under the grant number of 2016(1295)
Acknowledgments: We are thankful to the members of “Key Laboratory of Robot Technology used for Special Environment” in Sichuan province of China for facilitation and support to conduct experiments for this research.
Conflicts of Interest: The authors declare that there is no conflict of interest regarding the publication of this paper.
Abbreviations
RFID Radio Frequency Identification
DBSCAN Density Based Spatial Clustering of Applications with Noise
UWB Ultra wideband
GPS Global Positioning System
RSS Received Signal Strength
UHF Ultra High Frequency
TOA Time of Arrival
TDOA Time Difference of Arrival
AOA Angle of Arrival
SAR Synthetic Aperture Radar
BLE Bluetooth Low Energy
IMU Inertial Measurement Unit
MM Magnetic Matching
PDR Pedestrian Dead Reckoning
ε
ζ
5. Conclusions
In this paper, we proposed a different approach to localize a moving human equipped with anRFID tag array. We have calculated the phase-based radial velocity of RFID tags and compared it withlaser-based radial velocity. Laser information was clustered through the DBSCAN algorithm. The bestmatching clusters were measured and fused with phase-based radial velocity in a particle filter. It wasobserved that for an area of 4 × 2m with a simple rectangular path, the tag array method gave a 25%increase in localization accuracy compared to a single tag approach. We plan to embed signal strengthin this method and may also move the robot and object at the same time in upcoming work.
Author Contributions: S.Ur.R. analyzed the data and wrote the paper. R.L. proposed the idea and designed theexperiments, G.L. and Y.F. conducted the experiments. H.Z. and A.Q. reviewed the paper.
Funding: This work is funded by the National Natural Science Foundation of China (No. 61601381 and 61701421),and partially by China’s 13th Five-Year Plan in the Development of Nuclear Energy under the grant number of2016(1295)
Acknowledgments: We are thankful to the members of “Key Laboratory of Robot Technology used for SpecialEnvironment” in Sichuan province of China for facilitation and support to conduct experiments for this research.
Conflicts of Interest: The authors declare that there is no conflict of interest regarding the publication of this paper.
Abbreviations
RFID Radio Frequency IdentificationDBSCAN Density Based Spatial Clustering of Applications with NoiseUWB Ultra widebandGPS Global Positioning SystemRSS Received Signal StrengthUHF Ultra High FrequencyTOA Time of ArrivalTDOA Time Difference of ArrivalAOA Angle of ArrivalSAR Synthetic Aperture RadarBLE Bluetooth Low EnergyIMU Inertial Measurement UnitMM Magnetic MatchingPDR Pedestrian Dead ReckoningiGPS indoor Global Positioning SystemPF Particle FilterDRM Dense Reader Mode

Electronics 2019, 8, 887 15 of 17
References
1. Liu, R.; Yuen, C.; Do, T.N.; Jiao, D.; Liu, X.; Tan, U.X. Cooperative relative positioning of mobile users byfusing IMU inertial and UWB ranging information. In Proceedings of the IEEE International Conference onRobotics and Automation, Singapore, 29 May–3 June 2017; pp. 5623–5629.
2. Liu, R.; Yuen, C.; Do, T.N.; Jiang, Y.; Liu, X.; Tan, U.X. Indoor positioning using similarity-based sequenceand dead reckoning without training. In Proceedings of the IEEE Workshop on Signal Processing Advancesin Wireless Communications (SPAWC), Sapporo, Japan, 3–6 July 2017; pp. 1–5.
3. Mikšaj, U.T.; Bonefacic, D. Propagation characteristics of UHF radiofrequency identification system signalfor application in indoor positioning. In Proceedings of the 22nd International Conference on AppliedElectromagnetics and Communications (ICECom 2016), Dubrovnik, Croatia, 19–21 September 2016.
4. Sarkar, S.K. Enabling ubiquitous sensing with RFID. In Proceedings of the2015 International Conference onMicrowave and Photonics (ICMAP 2015), Dhanbad, India, 11–13 December 2015.
5. Pai, G.; D’souza, J.M.; D’souza, J.T.; Acharya, S.R.; Chaitra, M. Health Monitoring using RFID. Am. J. Intell.Syst. 2017, 7, 100–103.
6. Yang, A.; Hancke, G.P. RFID and contactless technology. In Smart Cards, Tokens, Security and Applications, 2nded.; Springer: Cham, Switzerland.
7. Liang, S.Y.; Chen, B.S.; Chen, C.C.; Sim, C.Y.D. Very small size UHF RFID tag for racing pigeon ringapplications. In Proceedings of the Wireless Power Transfer Conference (WPTC 2017), Taipei, Taiwan, 10–12May 2017.
8. Pentakota, S.L.B.; Chalasani, P.; Mekala, S.K.; Okate, S.I. Evaluating the Modern Airlines Maintenance PartsSupply Chain Reliability and Effectiveness. Int. Supply Chain Technol. J. 2018, 3. [CrossRef]
9. Xiao, C.; Chen, N.; Li, D.; Lv, Y.; Gong, J. SCRMS: An RFID and sensor web-enabled smart cultural relicsmanagement system. Sensors 2017, 17, 60. [CrossRef] [PubMed]
10. Ma, H.; Wang, K. Fusion of RSS and Phase Shift Using the Kalman Filter for RFID Tracking. IEEE Sens. J.2017, 17, 3551–3558. [CrossRef]
11. Ma, L.; Liu, M.; Wang, H.; Yang, Y.; Wang, N.; Zhang, Y. WallSense: Device-Free Indoor Localization UsingWall-Mounted UHF RFID Tags. Sensors 2019, 19, 68. [CrossRef] [PubMed]
12. Ruan, W.; Sheng, Q.Z.; Yao, L.; Li, X.; Falkner, N.J.G.; Yang, L. Device-free human localization and trackingwith UHF passive RFID tags: A data-driven approach. J. Netw. Comput. Appl. 2018, 104, 78–96. [CrossRef]
13. Ruan, W.; Sheng, Q.Z.; Yao, L.; Gu, T.; Ruta, M.; Shangguan, L. Device-free indoor localization and trackingthrough Human-Object Interactions. In Proceedings of the17th International Symposium on a World ofWireless, Mobile and Multimedia Networks (WoWMoM 2016), Coimbra, Portugal, 21–24 June 2016.
14. Liu, Z.; Chen, X.; Wei, Z.; Liu, T.; Li, L.; Peng, B. Ambiguity Analysis and Resolution for Phase-Based 3DSource Localization under Given UCA. Int. J. Antennas Propag. 2019, 2019, 4743829. [CrossRef]
15. He, H.; Akbari, M.; Sydänheimo, L.; Ukkonen, L.; Virkki, J. 3D-Printed Graphene Antennas andInterconnections for Textile RFID Tags: Fabrication and Reliability towards Humidity. Int. J. Antennas Propag.2017, 2017, 1386017. [CrossRef]
16. Çiftler, B.S.; Kadri, A.; Güvenç, I. IoT Localization for Bistatic Passive UHF RFID Systems with 3-D RadiationPattern. IEEE Internet Things J. 2017, 4, 905–916. [CrossRef]
17. Colella, R.; Catarinucci, L. Wearable UHF RFID Sensor Tag in 3D-Printing Technology for Body TemperatureMonitoring. In Proceedings of the 2nd URSI Atlantic Radio Science Meeting (AT-RASC 2018), Meloneras,Spain, 28 May–1 June 2018.
18. Shen, L.; Zhang, Q.; Pang, J.; Xu, H.; Li, P.; Xue, D. ANTspin: Efficient Absolute Localization Method of RFIDTags via Spinning Antenna. Sensors 2019, 19, 2194. [CrossRef]
19. El Abkari, S.; Jilbab, A.; el Mhamdi, J. Real time positioning over WSN and RFID network integration.In Proceedings of the2018 4th International Conference on Advanced Technologies for Signal and ImageProcessing (ATSIP 2018), Sousse, Tunisia, 21–24 March 2018; pp. 1–5.
20. Ma, Y.; Tian, C.; Jiang, Y. A Multi-Tag Cooperative Localization Algorithm Based on WeightedMultidimensional Scaling for Passive UHF RFID. IEEE Internet Things J. 2019, 6. [CrossRef]
21. Duan, C.; Yang, L.; Liu, Y. Accurate Spatial Calibration of RFID Antennas via Spinning Tags. In Proceedings ofthe International Conference on Distributed Computing Systems, Nara, Japan, 27–30 June 2016; pp. 519–528.

Electronics 2019, 8, 887 16 of 17
22. Kaltiokallio, O.; Hostettler, R.; Patwari, N.; Jäntti, R. Recursive Bayesian Filters for RSS-Based Device-FreeLocalization and Tracking. In Proceedings of the9th International Conference on Indoor Positioning andIndoor Navigation (IPIN 2018), Nantes, France, 24–27 September 2018.
23. Hsiao, R.S.; Kao, C.H.; Chen, T.X.; Chen, J.L. A passive RFID-based location system for personnel and assetmonitoring. Technol. Health Care 2018, 26, 11–16. [CrossRef] [PubMed]
24. Zhang, Z.; Lu, Z.; Saakian, V.; Qin, X.; Chen, Q.; Zheng, L.R. Item-level indoor localization with passive UHFRFID based on tag interaction analysis. IEEE Trans. Ind. Electron. 2013, 61, 2122–2135.
25. Zhao, Y.; Liu, K.; Ma, Y.; Gao, Z.; Zang, Y.; Teng, J. Similarity Analysis-Based Indoor Localization Algorithmwith Backscatter Information of Passive UHF RFID Tags. IEEE Sens. J. 2017, 17, 185–193. [CrossRef]
26. Wu, H.; Tao, B.; Gong, Z.; Yin, Z.; Ding, H. A Fast UHF RFID Localization Method Using UnwrappedPhase-Position Model. IEEE Trans. Autom. Sci. Eng. 2019, 1–10. [CrossRef]
27. Xiao, F.; Wang, Z.; Ye, N.; Wang, R.; Li, X.Y. One more tag enables fine-grained RFID localization and tracking.IEEE/ACM Trans. Netw. 2018, 26, 161–174. [CrossRef]
28. Buffi, A.; Nepa, P.; Lombardini, F. A phase-based technique for localization of uhf-rfid tags moving on aconveyor belt: Performance analysis and test-case measurements. IEEE Sens. J. 2015, 15, 387–396. [CrossRef]
29. Buffi, A.; Pino, M.R.; Nepa, P. Experimental validation of a SAR-Based RFID localization technique exploitingan automated handling system. IEEE Antennas Wirel. Propag. Lett. 2017, 16, 2795–2798. [CrossRef]
30. Liu, R.; Huskic, G.; Zell, A. On tracking dynamic objects with long range passive UHF RFID using a mobilerobot. Int. J. Distrib. Sens. Netw. 2015, 11, 781380. [CrossRef]
31. Wu, H.; Wu, X.; Tian, G. Indoor robot localization based on single RFID tag. Artif. Life Robot. 2018, 23,373–379. [CrossRef]
32. Duan, C.; Rao, X.; Yang, L.; Liu, Y. Fusing RFID and computer vision for fine-grained object tracking.In Proceedings of the IEEE Conference on Computer Communications INFOCOM, Atlanta, GA, USA, 1–4May 2017.
33. Llorca, D.F.; Quintero, R.; Parra, I.; Sotelo, M.A. Recognizing individuals in groups in outdoor environmentscombining stereo vision, RFID and BLE. Cluster Comput. 2017, 20, 769–779. [CrossRef]
34. Alfian, G.; Rhee, J.; Ahn, H.; Lee, J.; Farooq, U.; Ijaz, M.F.; Syaekhoni, M.A. Integration of RFID, wirelesssensor networks, and data mining in an e-pedigree food traceability system. J. Food Eng. 2017, 212, 65–75.[CrossRef]
35. Yang, P.; Wu, W. Efficient particle filter localization algorithm in dense passive RFID tag environment. IEEETrans. Ind. Electron. 2014, 61, 5641–5651. [CrossRef]
36. Wu, J.; Zhu, M.; Xiao, B.; Qiu, Y. Graph-based indoor localization with the fusion of PDR and RFIDtechnologies. In Lecture Notes in Computer Science (Including Subseries Lecture Notes in Artificial Intelligence andLecture Notes in Bioinformatics); Springer: Cham, Switzerland, 2018; Volume 11336 LNCS, pp. 630–639.
37. Sequeira, J.S.; Gameiro, D. A Probabilistic Approach to RFID-Based Localization for Human-Robot Interactionin Social Robotics. Electronics 2017, 6, 32. [CrossRef]
38. Suparyanto, A.; Fatimah, R.N.; Widyotriatmo, A.; Nazaruddin, Y.Y. Port Container Truck LocalizationUsing Sensor Fusion Technique. In Proceedings of the 5th International Conference on Electric VehicularTechnology (ICEVT 2018), Surakarta, Indonesia, 30–31 October 2018; pp. 72–77.
39. Digiampaolo, E.; Martinelli, F. Mobile robot localization using the phase of passive UHF RFID signals. IEEETrans. Ind. Electron. 2014, 61, 365–376. [CrossRef]
40. Zheng, K.; Yang, Q. Vehicle Positioning Method Based on RFID in VANETs. In Proceedings of the 2ndInternational Conference on Computer Science and Application Engineering, Hohhot, China, 22–24 October2018; pp. 1–5.
41. Wu, J.; Zhu, M.; Xiao, B.; Qiu, Y. The Improved Fingerprint-Based Indoor Localization with RFID/PDR/MMTechnologies. In Proceedings of the International Conference on Parallel and Distributed Systems (ICPADS),Singapore, 11–13 December 2019; pp. 878–885.
42. Luo, W.; Deng, X.; Zhang, F.; Wen, Y.; Kadhim, D.J. Positioning and guiding educational robots by usingfingerprints of WiFi and RFID array. EURASIP J. Wirel. Commun. Netw. 2018, 2018, 170. [CrossRef]
43. Fu, Y.; Wang, C.; Liu, R.; Liang, G.; Zhang, H.; Rehman, S.U. Moving object localization based on UHF RFIDphase and laser clustering. Sensors 2018, 18, 825. [CrossRef]

Electronics 2019, 8, 887 17 of 17
44. Bu, Y.; Xie, L.; Gong, Y.; Wang, C.; Yang, L.; Liu, J.; Lu, S. RF-Dial: An RFID-based 2D Human-ComputerInteraction via Tag Array. In Proceedings of the IEEE Conference on Computer Communications (INFOCOM),Honolulu, HI, USA, 16–19 April 2018; pp. 837–845.
45. Wang, C.; Liu, J.; Chen, Y.; Liu, H.; Xie, L.; Wang, W.; He, B.; Lu, S. Multi-Touch in the Air: Device-Free FingerTracking and Gesture Recognition via COTS RFID. In Proceedings of the IEEE Conference on ComputerCommunications (INFOCOM), Honolulu, HI, USA, 16–19 April 2018; pp. 1–9.
46. Nakamori, Y.; Hiroi, Y.; Ito, A. Multiple player detection and tracking method using a laser range finder for arobot that plays with human. ROBOMECH J. 2018, 5, 25. [CrossRef]
47. Zhang, Y.; Xie, L.; Bu, Y.; Wang, Y.; Wu, J.; Lu, S. 3-Dimensional Localization via RFID Tag Array. InProceedings of the 14th IEEE International Conference on Mobile Ad Hoc and Sensor Systems (MASS 2017),Orlando, FL, USA, 22–25 October 2017; pp. 353–361.
© 2019 by the authors. Licensee MDPI, Basel, Switzerland. This article is an open accessarticle distributed under the terms and conditions of the Creative Commons Attribution(CC BY) license (http://creativecommons.org/licenses/by/4.0/).