location, location, location: priority effects in wood...
TRANSCRIPT

This is an Open Access document downloaded from ORCA, Cardiff University's institutional
repository: http://orca.cf.ac.uk/84160/
This is the author’s version of a work that was submitted to / accepted for publication.
Citation for final published version:
Hiscox, Jennifer, Savoury, Melanie, Johnston, Sarah R., Parfitt, David, Muller, Carsten Theodor,
Rogers, Hilary Joan and Boddy, Lynne 2016. Location, location, location: priority effects in wood
decay communities may vary between sites. Environmental Microbiology 18 (6) , pp. 1954-1969.
10.1111/1462-2920.13141 file
Publishers page: http://dx.doi.org/10.1111/1462-2920.13141 <http://dx.doi.org/10.1111/1462-
2920.13141>
Please note:
Changes made as a result of publishing processes such as copy-editing, formatting and page
numbers may not be reflected in this version. For the definitive version of this publication, please
refer to the published source. You are advised to consult the publisher’s version if you wish to cite
this paper.
This version is being made available in accordance with publisher policies. See
http://orca.cf.ac.uk/policies.html for usage policies. Copyright and moral rights for publications
made available in ORCA are retained by the copyright holders.

Location, location, location: priority effects in wooddecay communities may vary between sites
Jennifer Hiscox,* Melanie Savoury,
Sarah R. Johnston, David Parfitt, Carsten T. Müller,
Hilary J. Rogers and Lynne Boddy
School of Biosciences, Cardiff University, Cardiff
CF10 3AX, UK.
Summary
Priority effects are known to have a major influence
on fungal community development in decomposing
wood, but it has not yet been established whether
these effects are consistent between different geo-
graphical locations. Here, beech (Fagus sylvatica)
wood disks that had been pre-colonized with three
wood decay basidiomycetes were placed in seven
woodland sites with similar characteristics for
12–24 months, and the successor communities pro-
filed using culture-based techniques coupled with
amplicon sequencing. On the majority of sites,
assembly history differed as a result of primary
versus secondary resource capture only (i.e. different
communities developed in uncolonized control disks
compared with those that had been pre-colonized),
but on certain sites distinct successor communities
followed each pre-colonizer species. This study pro-
vides preliminary evidence that differences in abiotic
factors and species pools between sites can cause
spatial variation in how priority effects influence
wood decay communities.
Introduction
Understanding and predicting the establishment and
development of decomposer communities is essential for
modelling carbon cycling and other ecosystem functions
(Bardgett et al., 2008; Chapin et al., 2009; McGuire
and Treseder, 2010). However, decomposer community
change is unpredictable, idiosyncratic and sensitive to
environmental variation (Van der Wal et al., 2014). Conse-
quently, community structure is omitted from many models,
despite its importance in ecosystem dynamics (Wardle,
2002; Deacon et al., 2006; Hansen et al., 2008;
Heichmann and Reichstein, 2008). Wood decay commu-
nities are especially important since lignocellulolytic fungi
are key determinants of forest carbon sequestration rates
and nutrient cycling (Baldrian and Lindahl, 2011). Including
fungal community dynamics could help bridge the gap
between observed and predicted decay rates in wood
decay models (Van der Wal et al., 2014).
Community structure and function is largely determined
by assembly history (the timing and sequence in which
species join a community), a major driver of which are
‘priority effects’, where the resource’s initial colonizers
affect the colonization success of subsequent arrivals
(Fukami et al., 2010; Dickie et al., 2012; Ottosson et al.,
2014; Hiscox et al., 2015). Wood decay communities lend
themselves well to studies of assembly history and priority
effects. While the general order of colonization is well
established for certain fungal species, there is large varia-
tion in the timing of species immigration and interactions
(Boddy, 2001; Boddy and Heilmann-Clausen, 2008;
Fukami et al., 2010). Local dispersal sources of wood
decay fungi, such as fruiting structures or mycelial cords
and rhizomorphs (linear aggregations of hyphae; Boddy,
2001) strongly affect colonization patterns (Edman et al.,
2004).
Fungal community change is largely driven by antago-
nistic mycelial interactions, which are affected by local
abiotic and biotic factors (Boddy and Heilmann-Clausen,
2008). Mycelial antagonism involves various morphologi-
cal and biochemical responses (Boddy, 2000), resulting
either in deadlock (no change in territory occupied by either
combatant) or replacement (partial or complete) of one
combatant by another, leading to community change
(Boddy, 2000). The initial community is fairly characteristic
of different angiosperm tree species, comprising
endophytes latently present in functional sapwood and
ruderal opportunists arriving as spores (Boddy et al., 1989;
Hendry et al., 2002; Parfitt et al., 2010). The initial commu-
nity progressively changes as species are displaced by
more aggressive colonizers (or, later on, stress-tolerant
species), which arrive at the resource as spores or mycelial
cords (Boddy, 2001; Boddy and Heilmann-Clausen, 2008;
Fricker et al., 2008; Boddy et al., 2009).
Priority effects are determined not only through com-
bative hierarchies/mechanisms, but by resource alteration
Received 24 June, 2015; revised 17 November, 2015; accepted 18
November, 2015. *For correspondence. E-mail [email protected];
Tel. (+44) 2920 875384; Fax +44(0)2920874829.
Environmental Microbiology (2016) doi:10.1111/1462-2920.13141
© 2015 The Authors. Environmental Microbiology published by Society for Applied Microbiology and John Wiley & Sons Ltd.This is an open access article under the terms of the Creative Commons Attribution License, which permits use, distribution andreproduction in any medium, provided the original work is properly cited.
Environmental Microbiology (2016) 18(6), 1954–1969 doi:10.1111/1462-2920.13141
VC 2015 The Authors. Environmental Microbiology published by Society for Applied Microbiology and John Wiley & Sons Ltd.This is an open access article under the terms of the Creative Commons Attribution License, which permits use, distribution andreproduction in any medium, provided the original work is properly cited.

through enzyme activity, mycelial growth and secondary
metabolites (Boddy and Heilmann-Clausen, 2008; Allison,
2012). Species differ in their decay rates and/or biochemi-
cal processes, structurally and chemically altering the
resource (Worrall et al., 1997; Woodward and Boddy,
2008). Predecessor species may effectively select for
successor species adapted to certain conditions. Several
studies on wood decay communities demonstrated prior-
ity effects at the species level (Fukami et al., 2010;
Lindner et al., 2011; Dickie et al., 2012; Ottosson et al.,
2014; Hiscox et al., 2015). Recently, community develop-
ment following nine different single pre-colonizer species
was studied in beech wood on the forest floor (Hiscox
et al., 2015). Distinct successor communities followed
ascomycete versus basidiomycete pre-colonizers, and
one of the basidiomycete pre-colonizers led to a unique
successor community, indicating that individual species
may have pivotal effects in assembly history.
Priority effects may account for much of the community
structure variation in different localities with similar envi-
ronmental conditions (Chase, 2010; Weslien et al., 2011).
However, it has not yet been tested whether priority
effects are consistent across locations; previous studies
were either undertaken in the laboratory or used a single
field site. Assembly history within a resource is con-
strained by the pool of available successors, which differs
between geographic areas (Edman et al., 2004); the pres-
ence of potential replacing species varies through differ-
ences in local species abundance, fruiting phenology and
species of wood available. For example, fungal assem-
blages within decaying Picea abies wood varied as much
as 68% between sites (Olsson et al., 2011). It is not yet
known whether priority effects differ between similar
forests in different locations.
Here, we assess the consistency of priority effects: do
the same predecessor species result in convergent suc-
cessor communities on different sites? Since abiotic con-
ditions and hence community composition vary between
woodlands (Ferris et al., 2000; Nordén and Paltto, 2001;
Iršenaite and Kutorga, 2007), we hypothesize that suc-
cessor communities will differ between multiple sites with
similar characteristics. We test how priority effects deter-
mine fungal community composition in wood by pre-
colonizing beech disks with species from different
successional stages (Vuilleminia comedens, primary
colonizer; Trametes versicolor, secondary colonizer;
Hypholoma fasciculare, late secondary cord-forming
colonizer) and blank, uncolonized control disks, and
placing them on the floor of seven deciduous woodlands,
followed by community characterization using culture-
based approaches and high-throughput amplicon
sequencing. We also test the hypothesis that time in the
field has a greater effect on community structure than
location.
Results
Isolation of fungi from wood disks
Retrieval rate of wood disks varied across sites (52.8–
90%), but at least three replicates of each pre-colonizer/
control were retrieved from every site (Table S1),
excepting H. fasciculare on Wytham site 1 (set Wy1B),
where disks could not be found, due to unexplained
mammal activity (Hiscox et al., 2015). The prevalence of
attached cords varied between sites (12.5–100%; Fig. 1;
Table S1). Fungal and/or bacterial outgrowth occurred
from all wood isolation points, with multiple types of out-
growth per point being common. Unknown fungi (i.e. not
pre-colonizer) grew out from 98.2% disks (corresponding
to 77.1% isolation points), of which most (69.3% isolation
points; Table S1) were considered to be opportunists that
grew and sporulated rapidly on agar, but were not active
in wood decay and probably only colonized disk surfaces.
In only 0.7% cases (two disks) did all isolation points
result in outgrowth of the same non-opportunistic invading
fungus. The highest isolation occurrence of non-
opportunistic invading fungi followed pre-colonization by
V. comedens (71.1% disks), and the lowest following
H. fasciculare (17.1% disks).
Vuilleminia comedens was not recovered from any
disks by re-isolation, and while T. versicolor was recov-
ered from 15% disks overall, it had been at least partially
replaced within every disk (Fig. 1A; Table S1). Very
little replacement of H. fasciculare occurred, with
H. fasciculare re-isolated from 96.6% disks in the field for
12 months, and 57.1% disks after 24 months.
pH within disks at the end of the experiment was sig-
nificantly lower at the Garth and Usk sites than the other
sites (F5,71 = 5.885, P = 0.00013; Fig. S1A). Conversely,
soil pH was significantly higher at the Garth site and
Wytham site 2 compared with other sites (F5,71 = 35.83,
P < 0.0001; Fig. S1B). There was no correlation between
wood and soil pH (Fig. S1C).
Identification of unknown fungi from isolations and
direct incubation
Isolation from wood chips, cords and incubation of disks,
yielded 106 fungal strains that were not pre-colonizers, of
which 75 were identified into 33 species by sequencing
(Tables S1 and S2). The remaining fungi could not be
identified due to insufficient material or inability to
obtain pure cultures, and these were grouped into 23
morphospecies (Table S2).
Occurrence of pre-colonizer operational taxonomic units
Only three of 38 V. comedens disks contained operational
taxonomic units (OTUs) corresponding to this species,
2 J. Hiscox et al.
© 2015 The Authors. Environmental Microbiology published by Society for Applied Microbiology and John Wiley & Sons Ltd,Environmental Microbiology
Location and priority effects in fungi 1955
VC 2015 The Authors. Environmental Microbiology published by Society for Applied Microbiology and John Wiley & Sons Ltd.,Environmental Microbiology, 18, 1954–1969

Fig. 1. Changes in community composition within disks that had been left in the field for 12 or 24 (Wy1A only) months. Disks were either
initially uncolonized controls (C), or had been pre-colonized with either V. comedens (Vc), T. versicolor (Tv) or H. fasciculare (Hf). Plots show
the percentage of disks that: A, retained the original pre-colonizer; B, contained invading fungi; and C, had mycelial cords attached. See
Table 1 for site name abbreviations. No data were available for Hf in site Wy1B as disks could not be found.
Location and priority effects in fungi 3
© 2015 The Authors. Environmental Microbiology published by Society for Applied Microbiology and John Wiley & Sons Ltd,Environmental Microbiology
1956 J. Hiscox et al.
VC 2015 The Authors. Environmental Microbiology published by Society for Applied Microbiology and John Wiley & Sons Ltd.,Environmental Microbiology, 18, 1954–1969

and at low levels (mean 3.1% OTU counts/sample where
present; Table S3). Trametes versicolor maintained a
greater foothold, and was detected in nine out of 38 disks
(mean 37.4% OTU counts/sample where present),
although in two samples it dominated the OTU profile with
> 80% counts (Table S3). Very little replacement of
H. fasciculare occurred (mean 95.9% OTU counts/
sample; Table S3).
Overall differences in composition between sites
Community composition was significantly different follow-
ing different pre-colonizers, and on different sites, and
there was a significant interaction between pre-colonizer
and site (F14,110 = 1.7244, P < 0.001; Figs 2 and 3). These
highly significant differences were maintained when the
decomposer communities (F14,110 = 1.4992, P < 0.001) and
co-colonizer communities (F14,110 = 1.7749, P < 0.001)
were considered separately.
Differences in profiles of invading species between sites
Overall variability of OTU profiles did not significantly differ
(P > 0.05) between sites (Table S4). Significant differ-
ences (P < 0.05) in species diversity and community even-
ness were detected between Usk and all other sites
(Table S5). There were more Ascomycota OTUs detected
on each site than Basidiomycota (Fig. 4A; Table S5).
However, in terms of OTU counts (i.e. occurrence), roughly
equal numbers of Ascomycota and Basidiomycota were
detected in disks from Wytham site 1 (Wy1A&B), Bagley,
Tintern and Whitestone, while Basidiomycota outnum-
bered Ascomycota at Usk, Garth and Wytham site 2
(Table S5). Each site had a different dominant replacing
OTU, averaging 26.5% OTU counts on any one site. On
five of the seven sites, the dominant replacing species
were cord-forming Basidiomycota (Fig. 4C; Table S5).
Similar pools of invading species were detected on
certain sites: e.g. there were no significant differences in
community composition in disks from the Whitestone
(WS2) and Bagley (B) sites, regardless of the pre-
colonizer treatment (Fig. 2; Table S6). However, on other
sites invading species were affected by different pre-
colonizers: e.g. communities within disks from Tintern,
Bagley and Whitestone were not significantly different in
control or T. versicolor disks but were significantly differ-
ent in disks pre-colonized with V. comedens (Fig. 2). Con-
versely, disks from the Usk site had unique successor
communities in controls and following V. comedens
pre-colonization, but not following T. versicolor pre-
colonization (Fig. 2).
Comparing priority effects between sites
The effect of pre-colonizers on community development
differed between sites. On two sites (Wy1B and B) eachTab
le1.
Locations
and
chara
cte
ristics
of
sites
used.
Site
Abbre
v
Location
Tre
especie
spre
sent
Gro
und
cover
Soil
pH
Soil
type
aC
ounty
Grid
ref
%S
pecie
s
Wyth
am
site
#1
Wy1
Oxfo
rdshire
51.7
75912,
−1.3
42048
Pre
dom
inantly
beech,
som
e
oak
and
hazel
80
Blu
ebell,
sedge
–S
hallo
wlim
e-r
ich
soil
over
chalk
or
limesto
ne
Wyth
am
site
#2
Wy2
Oxfo
rdshire
51.7
68902,
−1.3
44022
Pre
dom
inantly
beech,
som
e
hazel
<5
Sedge,
moss
6.5
8S
hallo
wlim
e-r
ich
soil
over
chalk
or
limesto
ne
Bagle
yB
Oxfo
rdshire
51.7
20134,
−1.2
66750
Beech,
hazel,
holly
25
Fern
,bra
mble
,sedge
4.5
2S
low
lyperm
eable
,seasonally
wet,
acid
loam
yand
cla
yey
soil
Hazelg
rove,
Tin
tern
TM
onm
outh
shire
51.7
11529,
−2.6
84246
Pre
dom
inantly
oak,
som
e
beech
and
holly
95
Blu
ebells
,bra
mble
,fe
rns,
sedge
5.6
7F
reely
dra
inin
g,
slig
htly
acid
,
loam
ysoil
Whitesto
ne
WS
Monm
outh
shire
51.7
25378,
−2.9
53690
Beech,
oak,
sycam
ore
75
Blu
ebells
,iv
y,fe
rns,
bra
mble
,
ivy,
wood
anem
one
4.9
5F
reely
dra
inin
g,
slig
htly
acid
,
loam
ysoil
Coed
yP
aen,
Usk
UM
onm
outh
shire
51.6
72524,
−2.9
53690
Pre
dom
inantly
beech,
som
e
ash
and
sycam
ore
<5
Woodru
sh,
fern
,iv
y4.6
8F
reely
dra
inin
g,
slig
htly
acid
,
loam
ysoil
Gart
h,
Card
iff
GC
ard
iff
51.5
35784,
−3.2
77605
Beech,
oak,
holly
<5
Fern
,sedge,
bra
mble
4.7
0F
reely
dra
inin
g,
slig
htly
acid
but
base-r
ich
soil
a.
Soil
type
info
rmation
from
Cra
nfield
Univ
ers
ity
2015.
The
Soils
Guid
e.
Availa
ble
:w
ww
.landis
.org
.uk.
Cra
nfield
Univ
ers
ity,
UK
.Last
accessed
09/0
6/2
015.
4 J. Hiscox et al.
© 2015 The Authors. Environmental Microbiology published by Society for Applied Microbiology and John Wiley & Sons Ltd,Environmental Microbiology
Location and priority effects in fungi 1957
VC 2015 The Authors. Environmental Microbiology published by Society for Applied Microbiology and John Wiley & Sons Ltd.,Environmental Microbiology, 18, 1954–1969

pre-colonizer led to a significantly (P < 0.05) distinct
community (Fig. 3; Table 2). However, on five sites,
there were no significant differences (P > 0.05) between
communities following pre-colonization with V. comedens
or T. versicolor, but a significantly distinct community fol-
lowed the controls (Fig. 3; Table 2).
Most inter-site differences were driven by variation in
colonization rate by the dominant replacing species
(Table 2). For example, on Wytham site 2, V. comedens
and T. versicolor disks had high occurrences of Coprinus
lagopus, whereas control disks had higher occurrence of
Coprinus cortinarius and L. hispida (Table 2). On Wytham
site 1 (Wy1B), dominant invading cord-forming species
differed depending on pre-colonizer: control disks were
dominated by Coprinellus impatiens, V. comedens disks
were dominated by Phanerochaete sp., and T. versicolor
Fig. 2. Fungal community composition after
12 or 24 months in disks pre-colonized with
different species at different field sites.
CAPdiscrim plots of fungal OTU composition
in A, initially uncolonized (control) disks; B,
disks pre-colonized with V. comedens (Vc);
and C, disks pre-colonized with T. versicolor
(Tv). Ordination was based on the
Bray–Curtis metric of dissimilarity. Points
represent individual samples and ellipses
indicate treatment (i.e. site) means with 95%
confidence intervals fitted onto the spatial
ordination. See Table 1 for site name
abbreviations.
Location and priority effects in fungi 5
© 2015 The Authors. Environmental Microbiology published by Society for Applied Microbiology and John Wiley & Sons Ltd,Environmental Microbiology
1958 J. Hiscox et al.
VC 2015 The Authors. Environmental Microbiology published by Society for Applied Microbiology and John Wiley & Sons Ltd.,Environmental Microbiology, 18, 1954–1969

disks were dominated by Xenasmatella vaga (Table 2).
On the Usk site, differences in extent of replacement by
Megacollybia platyphylla and Resinicium bicolor drove
most of the variation in community composition following
different pre-colonizers (Table 2).
Asomycota and Basidiomycota occurrence, in terms of
OTU counts, were similar following all pre-colonizers
(75–77% and 22–24% OTU counts, respectively;
Table S3). The dominant replacing species was an
ascomycete (L. hispida) in the control disks, whereas
a basidiomycete (Scopuloides hydnoides) dominated
the replacing community in disks pre-colonized by
V. comedens and T. versicolor (Table S3). Lasiosphaeris
hispida and S. hydnoides were detected at all sites
(Table S7).
Effect of time in the field
There were no significant differences in overall commu-
nity composition in disks on the same site for 12 (Wy1B)
and 24 (Wy1A) months (Fig. 2; Table S6). However, there
were different patterns of priority effects (Fig. 3; Table 2).
Fig. 3. Fungal community composition in disks following different predecessors on different field sites. CAPdiscrim plots of fungal OTU
composition in uncolonized (Control) disks, and in disks pre-colonized with either V. comedens (Vc) or T. versicolor (Tv), after 12 months at
field sites Wy1A, Wy2, B, G, T, U and WS2, and after 24 months at Wy1B. Ordination was based on the Bray–Curtis metric of dissimilarity.
Points represent individual samples and ellipses indicate treatment (i.e. pre-colonizer) means with 95% confidence intervals fitted onto the
spatial ordination.
6 J. Hiscox et al.
© 2015 The Authors. Environmental Microbiology published by Society for Applied Microbiology and John Wiley & Sons Ltd,Environmental Microbiology
Location and priority effects in fungi 1959
VC 2015 The Authors. Environmental Microbiology published by Society for Applied Microbiology and John Wiley & Sons Ltd.,Environmental Microbiology, 18, 1954–1969

Fig. 4. Composition of invading communities
following different pre-colonizers.
A. The number of OTUs identified on each
site, and the number of Ascomycota or
Basidiomycota.
B. The mean number of OTUs detected
following different pre-colonizer species (five
replicates, ± 95% confidence interval).
C. The dominant invading OTU detected on
each site, expressed as a per cent of total
OTU counts from each site. For site
abbreviations, see Table 1.
Location and priority effects in fungi 7
© 2015 The Authors. Environmental Microbiology published by Society for Applied Microbiology and John Wiley & Sons Ltd,Environmental Microbiology
1960 J. Hiscox et al.
VC 2015 The Authors. Environmental Microbiology published by Society for Applied Microbiology and John Wiley & Sons Ltd.,Environmental Microbiology, 18, 1954–1969

Table 2. Operational taxonomic units responsible for the top 50% variability between pre-colonizer species.
Site
Pairwise
comparison
Adonis outcomes Adonissimper results
F P (adj) Ratio
Av. %
A OTUs
Av. %
B OTUs
Cumulative
variation OTU Identification
Co-colonizer or
decomposer? Taxonomy
Wy1A Control –
V. comedens
1.419 0.152 0.90 371.2 214 0.1912 Xenasmatella vaga D Basidiomycota
0.67 101.6 242.2 0.3239 Coprinellus impatiens D Basidiomycota
0.67 248.8 36.6 0.4242 Phialocephala dimorphospora C Ascomycota
0.71 8.6 221 0.5231 uncultured fungus|Chalara C Ascomycota
Control –
T. versicolor
1.412 0.152 0.90 371.2 215.6 0.2018 Xenasmatella vaga D Basidiomycota
0.97 248.8 212 0.3275 Phialocephala dimorphospora C Ascomycota
0.52 164.2 9.8 0.4064 Lasiosphaeris hispida C Ascomycota
0.81 1.2 155.8 0.4786 Mycena galopus D Basidiomycota
0.62 101.6 31.4 0.535 Coprinellus impatiens D Basidiomycota
V. comedens –
T. versicolor
1.929 0.051 0.67 214 215.6 0.1512 Xenasmatella vaga D Basidiomycota
0.55 242.2 31.4 0.2651 Coprinellus impatiens D Basidiomycota
0.76 221 29.2 0.3662 Uncultured_fungus|Chalara C Ascomycota
0.51 187 2.8 0.449 Hypocrea pachybasioides C Ascomycota
0.98 36.6 212 0.5264 Phialocephala dimorphospora C Ascomycota
Wy1B Control –
V. comedens
4.301 0.007 0.87 406 154 0.1784 Phanerochaete D Basidiomycota
2.10 0.4 283.8 0.2941 Hyphodiscus hymeniophilus C Ascomycota
0.50 2.8 235 0.3907 Xenasmatella vaga D Basidiomycota
0.72 222 0.2 0.4813 Coprinellus impatiens D Basidiomycota
1.14 0 134 0.5362 Helotiales sp SGSGf25 C Ascomycota
Control –
T. versicolor
2.491 0.007 0.75 406 0.5 0.1655 Phanerochaete D Basidiomycota
1.12 92.6 322.25 0.2985 Lasiosphaeris hispida C Ascomycota
0.57 2.8 277.5 0.4132 Xenasmatella vaga D Basidiomycota
0.76 222 19.5 0.5063 Coprinellus impatiens D Basidiomycota
V. comedens –
T. versicolor
2.779 0.003 0.73 235 277.5 0.1695 Xenasmatella vaga D Basidiomycota
1.02 0.4 322.25 0.3057 Lasiosphaeris hispida C Ascomycota
2.09 283.8 1 0.4254 Hyphodiscus hymeniophilus C Ascomycota
0.49 154 0.5 0.4905 Phanerochaete D Basidiomycota
1.11 134 4.5 0.5458 Helotiales sp SGSGf25 C Ascomycota
Wy2 Control –
V. comedens
2.307 0.003 0.56 0.2 289.75 0.1175 uncultured Cantharellales D Basidiomycota
0.92 228.8 104.5 0.219 Psathyrella microrhiza D Basidiomycota
0.49 245.8 0 0.3185 Coprinus cortinatus D Basidiomycota
0.49 229.2 0 0.4115 Lasiosphaeris hispida C Ascomycota
0.56 0 205 0.4953 Ceriporia reticulata D Basidiomycota
0.86 170 0 0.5644 Mycena galopus D Basidiomycota
Control –
T. versicolor
2.496 0.021 1.62 36.4 390.25 0.1544 Coprinopsis lagopus D Basidiomycota
1.38 1.6 249.25 0.2572 Chalara sp PRM915970 C Ascomycota
0.50 245.8 4.5 0.3595 Coprinus cortinatus D Basidiomycota
0.75 104.4 184.25 0.4577 Scopuloides hydnoides D Basidiomycota
0.49 229.2 0.25 0.5524 Lasiosphaeris hispida C Ascomycota
V. comedens –
T. versicolor
1.088 0.386 1.58 43.25 390.25 0.1582 Coprinopsis lagopus D Basidiomycota
0.56 289.75 0 0.2819 uncultured Cantharellales D Basidiomycota
0.56 205 0 0.37 Ceriporia reticulata D Basidiomycota
1.25 72.75 249.25 0.458 Chalara sp PRM915970 C Ascomycota
0.68 40.5 184.25 0.5455 Scopuloides hydnoides D Basidiomycota
B Control –
V. comedens
6.599 0.006 1.46 681.25 0 0.273 Lasiosphaeris hispida C Ascomycota
0.76 332.25 187.2 0.4419 Phallus impudicus D Basidiomycota
2.13 0 210.2 0.5261 uncultured Chalara C Ascomycota
Control –
T. versicolor
3.915 0.003 1.46 681.25 0.2 0.2641 Lasiosphaeris hispida C Ascomycota
1.25 0 466.8 0.445 uncultured Chaetosphaeria C Ascomycota
0.58 332.25 0 0.5736 Phallus impudicus D Basidiomycota
V. comedens –
T. versicolor
3.009 0.005 1.26 1 466.8 0.1949 uncultured Chaetosphaeria C Ascomycota
0.50 0.6 265.8 0.3056 Psathyrella fibrillosa D Basidiomycota
2.02 210.2 8.4 0.3899 uncultured Chalara C Ascomycota
0.49 187.2 0 0.468 Phallus impudicus D Basidiomycota
0.56 172.6 4.6 0.5399 uncultured Basidiomycota D Basidiomycota
G Control –
V. comedens
3.679 0.030 1.18 716.4 0.2 0.3023 Mutinus caninus D Basidiomycota
1.21 223.8 586 0.5456 Scopuloides hydnoides D Basidiomycota
Control –
T. versicolor
1.979 0.087 1.17 716.4 818.5 0.3913 Mutinus caninus D Basidiomycota
0.72 223.8 296.25 0.6484 Scopuloides hydnoides D Basidiomycota
V. comedens –
T. versicolor
2.243 0.038 1.49 0.2 818.5 0.3659 Mutinus caninus D Basidiomycota
1.23 586 296.25 0.6291 Scopuloides hydnoides D Basidiomycota
8 J. Hiscox et al.
© 2015 The Authors. Environmental Microbiology published by Society for Applied Microbiology and John Wiley & Sons Ltd,Environmental Microbiology
Location and priority effects in fungi 1961
VC 2015 The Authors. Environmental Microbiology published by Society for Applied Microbiology and John Wiley & Sons Ltd.,Environmental Microbiology, 18, 1954–1969
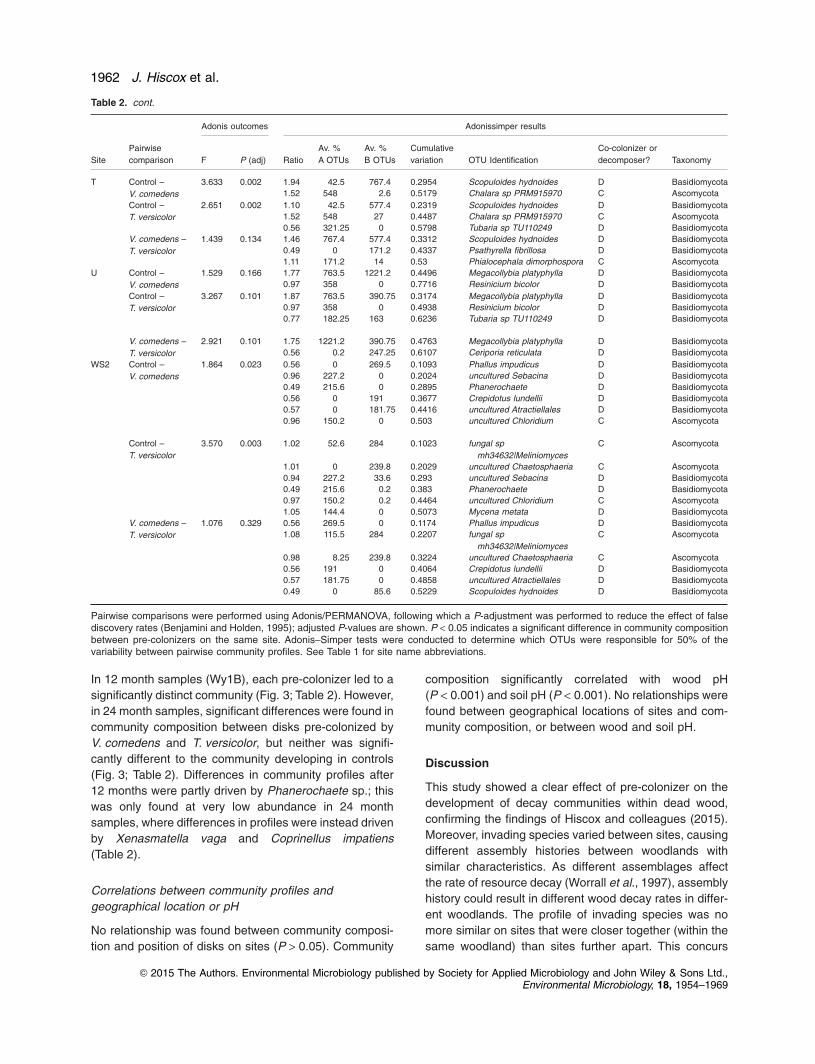
In 12 month samples (Wy1B), each pre-colonizer led to a
significantly distinct community (Fig. 3; Table 2). However,
in 24 month samples, significant differences were found in
community composition between disks pre-colonized by
V. comedens and T. versicolor, but neither was signifi-
cantly different to the community developing in controls
(Fig. 3; Table 2). Differences in community profiles after
12 months were partly driven by Phanerochaete sp.; this
was only found at very low abundance in 24 month
samples, where differences in profiles were instead driven
by Xenasmatella vaga and Coprinellus impatiens
(Table 2).
Correlations between community profiles and
geographical location or pH
No relationship was found between community composi-
tion and position of disks on sites (P > 0.05). Community
composition significantly correlated with wood pH
(P < 0.001) and soil pH (P < 0.001). No relationships were
found between geographical locations of sites and com-
munity composition, or between wood and soil pH.
Discussion
This study showed a clear effect of pre-colonizer on the
development of decay communities within dead wood,
confirming the findings of Hiscox and colleagues (2015).
Moreover, invading species varied between sites, causing
different assembly histories between woodlands with
similar characteristics. As different assemblages affect
the rate of resource decay (Worrall et al., 1997), assembly
history could result in different wood decay rates in differ-
ent woodlands. The profile of invading species was no
more similar on sites that were closer together (within the
same woodland) than sites further apart. This concurs
Table 2. cont.
Site
Pairwise
comparison
Adonis outcomes Adonissimper results
F P (adj) Ratio
Av. %
A OTUs
Av. %
B OTUs
Cumulative
variation OTU Identification
Co-colonizer or
decomposer? Taxonomy
T Control –
V. comedens
3.633 0.002 1.94 42.5 767.4 0.2954 Scopuloides hydnoides D Basidiomycota
1.52 548 2.6 0.5179 Chalara sp PRM915970 C Ascomycota
Control –
T. versicolor
2.651 0.002 1.10 42.5 577.4 0.2319 Scopuloides hydnoides D Basidiomycota
1.52 548 27 0.4487 Chalara sp PRM915970 C Ascomycota
0.56 321.25 0 0.5798 Tubaria sp TU110249 D Basidiomycota
V. comedens –
T. versicolor
1.439 0.134 1.46 767.4 577.4 0.3312 Scopuloides hydnoides D Basidiomycota
0.49 0 171.2 0.4337 Psathyrella fibrillosa D Basidiomycota
1.11 171.2 14 0.53 Phialocephala dimorphospora C Ascomycota
U Control –
V. comedens
1.529 0.166 1.77 763.5 1221.2 0.4496 Megacollybia platyphylla D Basidiomycota
0.97 358 0 0.7716 Resinicium bicolor D Basidiomycota
Control –
T. versicolor
3.267 0.101 1.87 763.5 390.75 0.3174 Megacollybia platyphylla D Basidiomycota
0.97 358 0 0.4938 Resinicium bicolor D Basidiomycota
0.77 182.25 163 0.6236 Tubaria sp TU110249 D Basidiomycota
V. comedens –
T. versicolor
2.921 0.101 1.75 1221.2 390.75 0.4763 Megacollybia platyphylla D Basidiomycota
0.56 0.2 247.25 0.6107 Ceriporia reticulata D Basidiomycota
WS2 Control –
V. comedens
1.864 0.023 0.56 0 269.5 0.1093 Phallus impudicus D Basidiomycota
0.96 227.2 0 0.2024 uncultured Sebacina D Basidiomycota
0.49 215.6 0 0.2895 Phanerochaete D Basidiomycota
0.56 0 191 0.3677 Crepidotus lundellii D Basidiomycota
0.57 0 181.75 0.4416 uncultured Atractiellales D Basidiomycota
0.96 150.2 0 0.503 uncultured Chloridium C Ascomycota
Control –
T. versicolor
3.570 0.003 1.02 52.6 284 0.1023 fungal sp
mh34632|Meliniomyces
C Ascomycota
1.01 0 239.8 0.2029 uncultured Chaetosphaeria C Ascomycota
0.94 227.2 33.6 0.293 uncultured Sebacina D Basidiomycota
0.49 215.6 0.2 0.383 Phanerochaete D Basidiomycota
0.97 150.2 0.2 0.4464 uncultured Chloridium C Ascomycota
1.05 144.4 0 0.5073 Mycena metata D Basidiomycota
V. comedens –
T. versicolor
1.076 0.329 0.56 269.5 0 0.1174 Phallus impudicus D Basidiomycota
1.08 115.5 284 0.2207 fungal sp
mh34632|Meliniomyces
C Ascomycota
0.98 8.25 239.8 0.3224 uncultured Chaetosphaeria C Ascomycota
0.56 191 0 0.4064 Crepidotus lundellii D Basidiomycota
0.57 181.75 0 0.4858 uncultured Atractiellales D Basidiomycota
0.49 0 85.6 0.5229 Scopuloides hydnoides D Basidiomycota
Pairwise comparisons were performed using Adonis/PERMANOVA, following which a P-adjustment was performed to reduce the effect of false
discovery rates (Benjamini and Holden, 1995); adjusted P-values are shown. P < 0.05 indicates a significant difference in community composition
between pre-colonizers on the same site. Adonis–Simper tests were conducted to determine which OTUs were responsible for 50% of the
variability between pairwise community profiles. See Table 1 for site name abbreviations.
Location and priority effects in fungi 9
© 2015 The Authors. Environmental Microbiology published by Society for Applied Microbiology and John Wiley & Sons Ltd,Environmental Microbiology
1962 J. Hiscox et al.
VC 2015 The Authors. Environmental Microbiology published by Society for Applied Microbiology and John Wiley & Sons Ltd.,Environmental Microbiology, 18, 1954–1969

with fruit body surveys, where fungal community compo-
sition varied highly between forest areas, and also
between plots within areas (Ferris et al., 2000; Nordén
and Paltto, 2001; Iršenaite and Kutorga, 2007). Variation
in local pools of invading species is driven by biotic and
abiotic factors such as habitat variability, forest history and
dynamics (including management type), and environmen-
tal constraints. These factors impact upon community
development history at the woodland level, neutral
mechanisms (e.g. the inherent randomness in dispersal
and establishment), and biological interactions (Gonthier
et al., 2001; Berglund et al., 2011; Bässler et al., 2012;
Abrego et al., 2014).
Fungal colonization of wood is influenced both by the
dispersal ability of local invading species, as spores or
through dispersal organs such as mycelial cords, and by
the combative ability of these species, i.e. the ability to
displace the resident mycelium (Boddy, 2000; Edman
et al., 2004). On all sites, the dominant invading
basidiomycete (decomposer) was a cord-forming species.
Cord systems grow from colonized resources and forage
for new ones, forming extensive (many m2), dynamic net-
works at the soil–litter interface (Boddy 1993; 1999; Fricker
et al., 2008; Boddy et al., 2009). Cord-forming fungi are
usually highly combative secondary colonizers; producing
cord networks is energetically expensive, and it has been
suggested that to be an evolutionarily successful strategy,
the cord former must be able to compete against different
communities and capture resources at various stages of
decay (Stenlid et al., 2008). Single species dominance
was most evident at the Usk site, where M. platyphylla
comprised nearly 63% of fungal OTU counts, and search-
ing for the disks at harvest revealed an extensive mycelial
network.
The patchy nature of cord systems might suggest that
replacement by cord formers would be concentrated in,
or localized to, specific areas within a site, resulting in
dispersal limitation (i.e. not all disks would have the
opportunity to be invaded by the same set of species,
see Fukami et al., 2005). Non-cord-forming invaders
may have arrived at disks as spores, and may also be
subject to dispersal limitation, although there is limited
effect of this over the small size of the experimental
grids used (Norros et al., 2012). Our random assortment
of treatments and replication should act to control
for these effects. Spatial autocorrelation was not
detected on any site, suggesting dispersal limitation was
not an issue in this experiment. However, any spatial
autocorrelation may have been masked by differences
in pre-colonizer susceptibility to different invading
species.
On the majority of sites, there were clear differences in
communities formed as a result of primary resource
capture (following initially uncolonized disks, where
species with r-selected characteristics have an advan-
tage) versus secondary resource capture (following
V. comedens or T. versicolor, where combative ability is
an advantage). However, clear priority effects occurred on
two of the seven sites, with distinct successor communi-
ties following V. comedens and T. versicolor. Priority
effects within woody resources, therefore, vary between
woodlands. Variation in abiotic factors between sites,
such as microclimate or soil pH, influences local species
pools (Fukami et al., 2005; 2010; Dickie et al., 2012).
Variation in abiotic factors may further affect community
development by altering the progress and outcomes of
species interactions, which can be affected by tempera-
ture, moisture and gaseous regime (Boddy, 2000). Previ-
ous field studies on priority effects, species associations
and succession in wood decay fungal communities have
either used single sites (e.g. Dickie et al., 2012), or
merged data from multiple sites with similar characteris-
tics (e.g. Lindner et al., 2011; Ottosson et al., 2014). Simi-
larly, use of multiple sites has been overlooked in studies
of priority effects and assembly history in other ecosys-
tems. Our results suggest that to draw meaningful con-
clusions about priority effects and assembly history, it is
essential that location and/or the effect of abiotic factors
on local species assemblages and species interactions be
considered.
Resource modification may explain differences in com-
munity development following different pre-colonizers
(Woodward and Boddy, 2008; Allison, 2012): T. versicolor
decays beech wood faster than V. comedens (Hiscox
et al., 2015a), but V. comedens decreases the pH of colo-
nized wood more than T. versicolor (Hiscox et al., 2015).
Fungi alter their resource pH, with different species (and
hence assemblages) generating different pH (Tudor
et al., 2013). The initial pH of wood disks was suspected
partly to explain differences in successor communities in
beech disks in a previous experiment (Hiscox et al.,
2015). We found a significant correlation between suc-
cessor community composition within disks and pH of the
underlying soil, despite an absence of correlation
between soil and wood disk pH. This might indicate that
soil pH is important in determining local pools of succes-
sor species. Future studies should profile the abiotic con-
ditions on each site much more thoroughly, including
precise temperature and precipitation measurements,
canopy coverage and distance to forest edges. Similarly,
attempts to profile the pools of potential successor
species could be undertaken, although this is an enor-
mous undertaking as it would need to incorporate profil-
ing air and soil spora at regular intervals, mapping large
cord systems and determining species composition in
adjacent dead woody resources.
Differences in subsequent community development
may also be determined by combative ability, as
10 J. Hiscox et al.
© 2015 The Authors. Environmental Microbiology published by Society for Applied Microbiology and John Wiley & Sons Ltd,Environmental Microbiology
Location and priority effects in fungi 1963
VC 2015 The Authors. Environmental Microbiology published by Society for Applied Microbiology and John Wiley & Sons Ltd.,Environmental Microbiology, 18, 1954–1969

T. versicolor (a secondary colonizer) is more combative
than V. comedens (a primary colonizer; Hiscox et al.,
2015). Differences in susceptibility to replacement, espe-
cially by cord formers, may explain the variation in priority
effects at different sites. An intransitive species hierarchy
was implied (Boddy, 2000); V. comedens was frequently
replaced by Phanerochaete sp. on Wytham site 1 and by
M. platyphylla at Usk, while T. versicolor was not.
However, on the Garth site, V. comedens was much
better able to resist replacement by Mutinus caninus
than T. versicolor. The third pre-colonizer species,
H. fasciculare, a later secondary colonizer, is more com-
bative than V. comedens and T. versicolor (Hiscox et al.,
2015a), and was hardly replaced over the experiment.
This differs from a previous study, where after 12 months
there was significant replacement of the same strain of
H. fasciculare (Hiscox et al., 2015), probably reflecting
poor pre-colonization in the lab in the earlier experiment.
Hypholoma fasciculare’s persistence within the resource
means that priority effects driven by this species would
only be revealed after longer in the field.
Length of time in the field affected the successor com-
munities. After 12 months, distinct successor communities
followed both the pre-colonizers V. comedens and
T. versicolor and control disks, driven mostly by suscepti-
bility to replacement by Phanerochaete sp., X. vaga and
C. impatiens. However, after 24 months, neither pre-
colonizer led to a significantly different successor commu-
nity compared with control disks, supporting the
suggestion that priority effects become weaker as decay
progresses (Rajala et al., 2011; Dickie et al., 2012). This
may indicate that while priority effects drive differences in
decay rate during the early stages of succession, due to the
different species assemblages present (Worrall et al.,
1997), these effects on decay rate attenuate during later
successional stages. Despite a high prevalence of
Phanerochaete sp. in the 12 month samples (2012–2013),
this species hardly colonized the 24 month samples (2011–
2013). This implies that Phanerochaete sp. cord systems
developed more extensively on Wytham site 1 in the latter
12 months. The 24 month disk communities were domi-
nated instead by X. vaga and C. impatiens, and if these
developed a foothold within the disks in the first 12 months
of the study, this could have prevented subsequent colo-
nization by Phanerochaete sp.
In the previous experiment, also on Wytham site 1
(Hiscox et al., 2015), disks were set out at the same
time as the 24 month samples here, but collected after
12 months. The dominant replacing decomposer species
were X. vaga, C. impatiens and Coprinopsis lagopus,
consistent with the dominant successor species in the
current 24 month samples. However, the pattern of pri-
ority effects in the previous study was not the same as
those in the 12 or 24 month disks used here, but was
instead consistent with the majority of the other sites in
the current study: initially uncolonized controls led to a
different successor community compared with disks pre-
colonized with V. comedens and T. versicolor. This dif-
ference between experiments in subsequent years may
have been driven by the increased colonization of the
site by Phanerochaete sp., or other uncontrollable
factors, demonstrating the dynamic nature of fungal
interactions and underlining the importance of stochastic
rather than deterministic factors in fungal community
succession.
Another difference between the present and previous
study (Hiscox et al., 2015) is the relationship between
decomposer and co-colonizer taxa. Previously, differ-
ences in community composition following different pre-
colonizers were driven by changes in co-colonizer but
not decomposer taxa. Here, significant relationships with
site and pre-colonizer species were found for both
decomposers and co-colonizers, in part perhaps due to
greater sequencing depth in the current study. The domi-
nant co-colonizer taxa may be more consistent between
sites than the decomposers, with Phialocephala
dimorphospora, Lasiosphaeris hispida, Meliniomyces sp.
and Chalara sp. occurring on multiple sites. Although
these co-colonizers are thought to be opportunistic scav-
engers rather than directly contributing to wood decay,
they clearly play a large role in wood decay communi-
ties. Exactly what this role is, and how they affect the
decomposition process, remains an important avenue
for future research.
Conclusions
Priority effects following different pre-colonizers varied
depending on geographical location: at two sites all pre-
colonizer treatments led to distinct successor communi-
ties. At the other five sites, priority effects followed a
different pattern, with different communities found in ini-
tially uncolonized disks (primary resource capture) com-
pared with disks pre-colonized with V. comedens or
T. versicolor (secondary resource capture). Further,
length of time in the field altered the pattern of priority
effects within a site. Abiotic factors are presumed to be
major drivers of these differences in assembly history,
determining the pools of invading species, which differed
on all sites, and influencing the progress and outcomes
of species interactions. The dominance of cord-forming
fungi in developing communities at all sites highlights
the importance of these fungi in wood decomposition on
the forest floor. While it was not possible in this study,
future research should employ experimental designs that
can more rigorously evaluate priority effects in different
locations, as opposed to dispersal limitation and other
forces that affect community assembly.
Location and priority effects in fungi 11
© 2015 The Authors. Environmental Microbiology published by Society for Applied Microbiology and John Wiley & Sons Ltd,Environmental Microbiology
1964 J. Hiscox et al.
VC 2015 The Authors. Environmental Microbiology published by Society for Applied Microbiology and John Wiley & Sons Ltd.,Environmental Microbiology, 18, 1954–1969

Experimental procedures
Colonization of wood disks
Beech (Fagus sylvatica) wood disks (diameter 10 cm, thick-
ness 2 cm) were colonized by V. comedens, T. versicolor and
H. fasciculare, respectively, representing fungi from primary,
secondary and late secondary/tertiary stages of succession
as in Hiscox and colleagues (2015; Table S8). Briefly, freshly
felled branches were cut, sterilized by autoclaving three
times, placed onto mycelia growing on 0.5% MA (malt agar)
in plastic 400 ml lidded pots and incubated in the dark at 20°C
for 12 weeks.
Field site characteristics and experimental layouts
Seven woodland sites predominantly comprised of beech
(Fagus sylvatica), 0.8–137 km apart, were selected in the
southern UK (Tables 1 and S8). On six sites, a 15 × 15 m grid
was divided into 6 × 6 sections and experimental units allo-
cated to grid squares. Colonized disks (scraped free of
adhering mycelium; nine replicates/species) and nine sterile
control disks were placed in the litter layer, randomly distrib-
uted across the grids (Fig. S2). On the remaining site
(Wytham site 1), colonized and control disks (10 replicates)
were distributed in a larger grid (25 × 25 m; 10 × 10 sections)
as part of a larger experiment (Hiscox et al., 2015). Disks
were placed on the forest floor for 12 months (September
2012–2013). An additional set of disks (termed Wy1A) were
placed on the Wytham site 1 in the previous year, harvested
after 24 months (September 2011–2013), and compared only
with those on the same site for 12 months (Wy1B).
Isolation, DNA sample generation and direct incubation
After harvest, disks were scraped clean and attached cords
sampled by placing sections onto 2% MA following surface
sterilization (30 s immersion in 5–10% domestic bleach). The
disk surface was also sterilized, and then skimmed off using
a sterile chisel, and six 3–4 mm chips excised aseptically
from each face and placed onto 2% MA. Plates were incu-
bated in the dark at 20°C until mycelia emerged. Pre-
colonizer fungi were identified based on mycelial morphology.
Mycelia that grew and sporulated very rapidly were not con-
sidered to be true colonizers, but rather ‘contaminants’ that
grew opportunistically on artificial media. Disks were drilled at
20 + points through their width, using a sterile 4 mm drill bit,
the sawdust flash frozen and stored at −80°C. Disks were
sprayed with distilled water and incubated at 20°C in the dark
for 1–2 months, and outgrowth of mycelia recorded. pH was
measured in disks, by shaking 0.5 g sawdust in 5 ml distilled
water for 1 h and of soil taken immediately beneath the disks
at harvest.
Molecular identification of unknown fungi
Deoxyribonucleic acid (DNA) was extracted from unknown
mycelia (in pure culture) and from outgrowing mycelia and
cords attached to disks, and polymerase chain reaction (PCR)
amplifications performed using ITS1F/ITS4 (Gardes and
Bruns, 1993) following Parfitt and colleagues (2010). Polymer-
ase chain reaction products were purified (PCR purification kit;
Qiagen, USA), and sequenced using the 3710xl DNAanalyser
with BIG DYE TERMINATOR v3.1 (Life Technologies, UK) by
Eurofins Genomics (Ebersberg, Germany). Sequences were
identified by BLASTN comparison with the UNITE and INSD
databases (PLUTOF; Abarenkov et al., 2010). Where fungi
could not be identified through sequencing, they were grouped
based on morphology and assigned an identification number.
Preparation of samples for 454 pyrosequencing
454 amplicon sequencing was performed on 144 samples four
to five replicates of each treatment per site. Deoxyribonucleic
acid was extracted from sawdust using the PowerSoil DNA
extraction kit (MoBio, USA) modified to include a bead-beating
step [3 × (4 m s−1 for 20 s); FastPrep-24, MP Biomedicals,
UK]; the ITS2 region was PCR amplified using the primer ITS4
(extended with 8 bp sample identification tags; Integrated
DNA Technologies Belgium; Table S9) in combination with
gITS7 (Ihrmark et al., 2012). Polymerase chain reaction was
performed using a Dyad-Peltier thermal cycler (Bio Rad,
Herts, UK) in 50 μl reactions [0.25 ng template, 300 nM
tagged-ITS4, 500 nM gITS7, 0.025 U μl−1 Taq polymerase
(PCR Biosystems, London, UK) in supplied buffer; 5 min at
94°C; 22–30 × (30 s at 94°C; 30 s at 56°C; 30 s at 72°C);
7 min at 72°C]. Cycle numbers were optimized to ensure
reactions stopped in log phase due to two degenerate posi-
tions in the gITS7 primer. Triplicate PCRs were combined prior
to electrophoresis through ultrapure agarose (Life Technolo-
gies, UK), excision and purification of bands using the
Qiaquick gel extraction kit (Qiagen, USA). Purified products
were quantified using the Quant-iT PicoGreen dsDNA assay
kit (Life Technologies, UK).Samples were merged (equimolar
mixing) into four amplicon libraries (36 samples library−1). Each
library was sequenced on 1/4 plate using the Roche GS FLX +
454 pyrosequencing platform (Hoffman La-Roche, Germany)
by the NERC-Biomolecular Analysis Facility (Centre for
Genomic Research, Liverpool, UK).
Sequence analysis
Sequences were analysed using the SCATA pipeline
(scata.mykopat.slu.se; Ihrmark et al., 2012). Sequences were
filtered by screening for primer sites, and removing sequences
with an average quality score below 20, or a score below 10 at
any position. This resulted in 701 338 high-quality sequences,
which were compared for similarity using BLAST, with a
pairwise alignment scoring function with 1 as penalty for
mismatch, 0 for gap opening and 1 for gap extension.
Homopolymers were collapsed to 3 bp before clustering.
Sequences were clustered by single linkage clustering with
1% maximum distance to nearest neighbour demanded for
sequences to enter clusters. Sequences occurring only once
in the entire data set were excluded. Representative
sequences of all clusters (OTUs) were compared with all
fungal sequences in the UNITE and INSD databases by
BLASTN using the MASSBLASTER function in PLUTOF
(Abarenkov et al., 2010), and taxonomic information for each
OTU obtained using the Galaxy project toolkit (http://
12 J. Hiscox et al.
© 2015 The Authors. Environmental Microbiology published by Society for Applied Microbiology and John Wiley & Sons Ltd,Environmental Microbiology
Location and priority effects in fungi 1965
VC 2015 The Authors. Environmental Microbiology published by Society for Applied Microbiology and John Wiley & Sons Ltd.,Environmental Microbiology, 18, 1954–1969

usegalaxy.org/). Sequence data are archived at NCBI SRA
under accession no. SRP056529.
Statistical analysis
Statistical analyses were performed using R v3.1.0 (R Core
Team, 2013), using the VEGAN package (Oksanen et al.,
2013) unless otherwise stated, and graphs generated using
the package GGPLOT2 (Wickham, 2009).
Operational taxonomic unit counts corresponding to the
pre-colonizer species were removed from the data set.
Samples were excluded if the pre-colonizer accounted for
> 80% of the OTU counts, resulting in the exclusion of two
T. versicolor samples and 36 H. fasciculare samples. This left
insufficient replicates of H. fasciculare samples, so all were
removed.
Samples were rarefied to the lowest OTU count in any one
sample (1321 reads), and clusters corresponding to < 1% of
reads in any one sample (i.e. < 13 reads) removed. Rarefying
data and read deletion did not alter the outcome of signifi-
cance testing between groups. The data were fourth root
transformed, reducing the influence of abundant taxa relative
to less dominant taxa and allowing community-wide assess-
ment of changes in taxon composition (Clarke and Warwick,
2001). Differences in community composition between treat-
ments were visualized using Canonical Analysis of Principal
Coordinates based on Discriminant Analysis (CAPdiscrim).
Distance matrices for sequence data were constructed using
the Bray–Curtis dissimilarity index (Clarke and Warwick,
2001). Fungal diversity estimates (Shannon diversity, Fish-
er’s alpha and Pielou’s evenness), wood pH and soil pH,
were compared using one-way analysis of variance
(ANOVA), with Tukey–Kramer a posteriori tests.
Permutational ANOVA (999 permutations; Anderson, 2001)
assessed whether pre-colonizer species, site and the
species–site interaction resulted in significantly different suc-
cessor communities. Betadisper tests confirmed equal disper-
sion between treatment groups. Pairwise tests were used to
compare differences in successor communities following dif-
ferent pre-colonizer species, and between woodlands, with
P-adjustment (false discovery rate method; Benjamini and
Hochberg, 1995). Operational taxonomic units were
divided into species actively contributing to wood decomposi-
tion (decomposers: basidiomycetes and xylariaceous
ascomycetes), and those purportedly incapable of white or
brown rot, instead living opportunistically off other mycelia or
their extracellular enzyme products (co-colonizers). Permuta-
tional ANOVA was run on both groups separately to
detect whether community structure of decomposer
versus co-colonizer species changed following different pre-
colonizers.
Mantel tests were performed to detect whether community
composition was linked to: position on the site, pH of disks at
the end of the experiment or pH of underlying soil (tests
performed as a correlation between a Euclidean distance
matrix and the Bray–Curtis dissimilarity matrix; Legendre and
Legendre, 1998).
Conflict of interest
The authors declare no conflict of interest.
Acknowledgements
This work was supported by Natural Environment Research
Council grant NE/I01117X/1 (JH, MS, LB, HJR, and CTM)
and studentship NE/L501773/1 (SJ). Thanks to Don A’Bear
and Casey Morris for helping with practical work, to Derek
Schafer for use of his land, to Prof. A. Weightman for the use
of his lab, to Cardiff Council Parks Department for felling
branches, to Nigel Fisher for help in and around Wytham
woods and to Prof. BD Lindahl for advice on data analysis.
References
Abarenkov, K., Nilsson, R.H., Larsson, K.H., Alexander, I.J.,
Eberhardt, U., Erland, S., et al. (2010) The UNITE data-
base for molecular identification of fungi: recent updates
and future perspectives. New Phytol 186: 281–285.
Abrego, N., Garcia-Baquero, G., Halme, P., Ovaskainen, O.,
and Salcedo, I. (2014) Community turnover of wood-
inhabiting fungi across hierarchical spatial scales. PLoS
ONE 9: e103416.
Allison, S.D. (2012) A trait-based approach for modelling
microbial litter decomposition. Ecol Lett 15: 1058–1070.
Anderson, M.J. (2001) A new method for non-parametric
multivariate analysis of variance. Austral Ecol 26: 32–46.
Baldrian, P., and Lindahl, B. (2011) Decomposition in forest
ecosystems: after decades of research still novel findings.
Fungal Ecol 4: 359–361.
Bardgett, R., Freeman, C., and Ostle, N. (2008) Microbial
contributions to climate change through carbon cycle feed-
backs. ISME J 2: 805–814.
Bässler, C., Müller, J., Svoboda, M., Lepšová, A., and Hahn,
C. (2012) Diversity of wood-decaying fungi under different
disturbance regimes – a case study from spruce mountain
forests. Biodivers Conserv 21: 33–49.
Benjamini, Y., and Hochberg, Y. (1995) Controlling the false
discovery rate: a practical and powerful approach to multi-
ple testing. J R Stat Soc Series B Stat Methodol 57: 289–
300.
Berglund, H., Hottola, J., Penttila, R., and Siitonen, J. (2011)
Linking substrate and habitat requirements of wood-
inhabiting fungi to their regional extinction vulnerability.
Ecography 34: 864–875.
Boddy, L. (1993) Saprotrophic cord-forming fungi: welfare
strategies and other ecological aspects. Mycol Res 97:
641–655.
Boddy, L. (1999) Saprotrophic cord-forming fungi: meeting
the challenge of heterogeneous environments. Mycologia
91: 13–32.
Boddy, L. (2000) Interspecific combative interactions
between wood-decaying basidiomycetes. FEMS Microbiol
Ecol 31: 185–194.
Boddy, L. (2001) Fungal community ecology and wood
decomposition processes in angiosperms: from standing
tree to complete decay of coarse woody debris. Ecol Bull
49: 43–56.
Boddy, L., and Heilmann-Clausen, J. (2008) Basidiomycete
community development in temperate angiosperm wood.
In Ecology of Saprotrophic Basidiomycetes, BMS Sympo-
sia Series. Boddy, L., Frankland, J., and van West, P. (eds).
Oxford, UK: Academic Press, Elsevier, pp. 211–237.
Location and priority effects in fungi 13
© 2015 The Authors. Environmental Microbiology published by Society for Applied Microbiology and John Wiley & Sons Ltd,Environmental Microbiology
1966 J. Hiscox et al.
VC 2015 The Authors. Environmental Microbiology published by Society for Applied Microbiology and John Wiley & Sons Ltd.,Environmental Microbiology, 18, 1954–1969

Boddy, L., Owens, E.M., and Chapela, I.H. (1989) Small-
scale variation in decay rate within logs one year after
felling: effects of fungal community structure and moisture
content. FEMS Microbiol Ecol 62: 173–184.
Boddy, L., Hynes, J., Bebber, D.P., and Fricker, M.D. (2009)
Saprotrophic cord systems: dispersal mechanisms in
space and time. Mycoscience 50: 9–19.
Chapin, F.S., McFarland, J., McGuire, A.D., Euskirchen, E.S.,
Ruess, R.W., and Kielland, K. (2009) The changing global
carbon cycle: linking plant-soil carbon dynamics to global
consequences. J Ecol 97: 840–850.
Chase, J.M. (2010) Stochastic community assembly causes
higher biodiversity in more productive environments.
Science 328: 1388–1391.
Clarke, K.R., and Warwick, R.M. (2001) Change in Marine
Communities: An Approach to Statistical Analysis and
Interpretation, 2nd edn. Plymouth, UK: PRIMER-E.
Deacon, L.J., Pryce-Miller, E.J., Frankland, J.C., Bainbridge,
B.W., Moore, P.D., and Robinson, C.H. (2006) Diversity
and function of decomposer fungi from a grassland soil.
Soil Biol Biochem 38: 7–20.
Dickie, I.A., Fukami, T., Wilkie, J.P., Allen, R.B., and
Buchanan, P.K. (2012) Do assembly history effects attenu-
ate from species to ecosystem properties? A field test with
wood-inhabiting fungi. Ecol Lett 15: 133–141.
Edman, M., Gustafsson, M., Stenlid, J., Jonsson, B.G., and
Ericson, L. (2004) Spore deposition of wood decaying
fungi: importance of landscape composition. Ecography
27: 103–111.
Ferris, R., Peace, A.T., and Newton, A.C. (2000) Macrofungal
communities of lowland Scots pine (Pinus sylvestris) and
Norway spruce (Picea abies) plantations in England: rela-
tionships with site factors and stand structure. For Ecol
Manage 131: 255–267.
Fricker, M.D., Boddy, L., and Bebber, D.P. (2008) The inter-
play between topology and function in fungal mycelial net-
works. Topologica 1: 004. doi:10.3731/topologica.1.004.
Fukami, T., Bezemer, T.M., Mortimer, S.R., and van der
Putten, W.H. (2005) Species divergence and trait conver-
gence in experimental plant community assembly. Ecol
Lett 8: 1283–1290.
Fukami, T., Dickie, I.A., Wilkie, J.P., Paulus, B.C., Park, D.,
Roberts, A., et al. (2010) Assembly history dictates eco-
system functioning: evidence from wood decomposer com-
munities. Ecol Lett 13: 675–684.
Gardes, M., and Bruns, T.D. (1993) ITS primers with enhanced
specificity for basidiomycetes: application to the identifica-
tion of mycorrhizae and rusts. Mol Ecol 2: 113–118.
Gonthier, P., Garbelotto, M., Varese, G.C., and Nicolotti, G.
(2001) Relative abundance and potential dispersal range
of intersterility groups of Heterobasidion annosum in pure
and mixed forests. Can J Bot 79: 1057–1065.
Hansen, C.A., Allison, S.D., Bradford, M.A., Wallenstein,
M.D., and Treseder, K.K. (2008) Fungal taxa target differ-
ent carbon sources in forest soil. Ecosystems 11: 1157–
1167.
Heichmann, M., and Reichstein, M. (2008) Terrestrial ecosys-
tem carbon dynamics and climate feedbacks. Nature 451:
289–292.
Hendry, S.J., Boddy, L., and Lonsdale, D. (2002) Abiotic
variables effect differential expression of latent infections
in beech (Fagus sylvatica). New Phytol 155: 449–
460.
Hiscox, J., Savoury, M., Lindahl, B.D., Müller, C.T., Rogers,
H.J., and Boddy, L. (2015) Priority effects during fungal
community establishment in beech wood. ISME J 9: 2246–
2260. doi:10.1038/ismej.2015.38.
Hiscox, J., Savoury, M., Vaughan, I., Müller, C.T., and Boddy,
L. (2015a) Antagonistic fungal interactions influence
carbon dioxide evolution from decomposing wood. Fungal
Ecol 14: 24–32.
Ihrmark, K., Bodecker, I.T.M., Cruz-Martinez, K., Friburg, H.,
Kubartová, A., Schneck, J., et al. (2012) New primers to
amplify the fungal ITS2 region – evaluation by 454-
sequencing of artificial and natural communities. FEMS
Microbiol Ecol 82: 666–677.
Iršenaite, R., and Kutorga, I. (2007) Wood-inhabiting fungi on
pedunculate oak coarse woody debris in relation to sub-
stratum quantity and forest age. Acta Mycol 42: 169–178.
Legendre, P., and Legendre, L. (1998) Numerical Ecology,
2nd English edn. Oxford, UK: Elsevier.
Lindner, D.L., Vasaitis, R., Kubartová, A., Allmér, J.,
Johannesson, H., Banik, M.T., et al. (2011) Initial fungal
colonizer affects mass loss and fungal community devel-
opment in Picea abies logs 6 years after inoculation.
Fungal Ecol 4: 449–460.
McGuire, K.L., and Treseder, K.K. (2010) Microbial commu-
nities and their relevance for ecosystem models: decom-
position as a case study. Soil Biol Biochem 42: 529–535.
Nordén, B., and Paltto, H. (2001) Wood-decay fungi in hazel
wood: species richness correlated to stand age and dead
wood features. Biol Conserv 101: 1–8.
Norros, V., Penttilä, R., Suominen, M., and Ovaskainen, O.
(2012) Dispersal may limit the occurrence of specialist
wood decay fungi at already small spatial scales. Oikos
121: 961–974.
Oksanen, J., Guillame Blanchet, F., Kindt, R., Legendre, P.,
Minchin, P.R., O’Hara, R.B., et al. (2013) Vegan: commu-
nity ecology package. R Package version 2.0-10. URL
http://CRAN.R-project.org/package=vegan.
Olsson, J., Jonsson, B.G., Hjalten, J., and Ericson, L. (2011)
Addition of coarse woody debris – the early succession of
Picea abies logs in managed forests and reserves. Biol
Conserv 144: 1100–1110.
Ottosson, E., Norden, J., Dahlberg, A., Edman, M., Jonsson,
M., Larsson, K.H., et al. (2014) Species associations
during the succession of wood-inhabiting fungal communi-
ties. Fungal Ecol 11: 17–28.
Parfitt, D., Hunt, J., Dockrell, D., Rogers, H.J., and Boddy, L.
(2010) Do all trees carry the seeds of their own destruc-
tion? PCR reveals numerous wood decay fungi latently
present in sapwood of a wide range of angiosperm trees.
Fungal Ecol 3: 338–346.
R Core Team (2013) R: A Language and Environment for
Statistical Computing. Vienna, Austria: R Foundation for
Statistical Computing. URL: http://www.R-project.org/.
Rajala, T., Peltoniemi, M., Hantula, J., Mäkipää, R., and
Pennanen, T. (2011) RNA reveals a succession of active
fungi during the decay of Norway spruce logs. Fungal Ecol
4: 437–448.
Stenlid, J., Penttilä, R., and Dahlberg, A. (2008) Wood
decay basidiomycetes in boreal forests: distribution and
14 J. Hiscox et al.
© 2015 The Authors. Environmental Microbiology published by Society for Applied Microbiology and John Wiley & Sons Ltd,Environmental Microbiology
Location and priority effects in fungi 1967
VC 2015 The Authors. Environmental Microbiology published by Society for Applied Microbiology and John Wiley & Sons Ltd.,Environmental Microbiology, 18, 1954–1969

community development. In Ecology of Saprotrophic
Basidiomycetes. Frankland, J.C., Boddy, L., and van West,
P. (eds). Oxford, UK: British Mycological Society Symposia
Series, Academic Press, Elsevier, pp 211–237.
Tudor, D., Robinson, S.C., and Cooper, P.A. (2013) The
influence of pH on pigment formation by lignicolous fungi.
Int Biodeterior Biodegradation 80: 22–28.
Van der Wal, A., Ottosson, E., and de Boer, W. (2014)
Neglected role of fungal community composition in explain-
ing variation in wood decay rates. Ecology 96: 124–133.
Wardle, D.A. (2002) Communities and Ecosystems: Linking
the Aboveground and Belowground Components. Prince-
ton, NJ, USA: Princeton University Press.
Weslien, J., Djupstrom, L.B., Schroeder, M., and Widenfalk, O.
(2011) Long-term priority effects among insects and fungi
colonizing decaying wood. J Anim Ecol 80: 1155–1162.
Wickham, H. (2009) ggplot2, Elegant Graphics for Data
Analysis. New York, USA: Springer.
Woodward, S., and Boddy, L. (2008) Interactions between
saprotrophic fungi. In Ecology of Saprotrophic
Basidiomycetes, British Mycological Society Symposia
Series. Frankland, J.C., Boddy, L., and van West, P. (eds).
Oxford, UK: Academic Press, Elsevier, pp. 125–141.
Worrall, J.J., Anagnost, S.E., and Zabel, R.A. (1997) Com-
parison of wood decay among diverse lignicolous fungi.
Mycologia 89: 199–219.
Supporting information
Additional Supporting Information may be found in the online
version of this article at the publisher’s website:
Fig. S1. Relationship between wood and soil pH on different
sites.
A. pH within disks after 12 months at different sites, compris-
ing data from all samples (regardless of treatment).
B. pH of soil underneath disks at point of harvest.
C. Correlation between pH within disks and that of the under-
lying soil.
For A and B, bars show the mean pH of all samples from a
site, ± 95% confidence intervals. Different letters indicate sig-
nificant (P < 0.05) differences between pH between sites.
Data were not collected for Wytham site 1 samples.
Fig. S2. Distribution of samples on the field sites. Disks were
placed in the centre of each grid square, in a randomized
control block design (Latin square). Numbers indicate sample
ID tags. Figures show all of the samples put out in the field,
although not all of these were retrieved. Disks were either
uncolonized controls (C), or pre-colonized with V. comedens
(Vc), T. versicolor (Tv) or H. fasciculare (Hf). On Wytham site
1 (Wy1A and Wy1B), samples were placed in a 10 × 10 grid
(25 × 25 m) as part of a larger experiment, whereas on all
other sites samples were arranged in a 6 × 6 grid (15 × 15 m).
Table S1. Re-isolation data arranged by site and pre-
colonizer species. Mismatch can occur between fungi identi-
fied from isolation points and those that were present from
disks (i.e. no invading fungi grew from isolations, but invading
fungi were present following disk incubation). See Table 1 for
site name abbreviations.
Table S2. Taxa recovered by isolation and disk incubation
following uncolonized control (C) disks, or disks pre-colonized
with V. comedens (Vc), T. versicolor (Tv) or H. fasciculare
(Hf). Named taxa were identified by Internal Transcribed
Spacer (ITS) sequencing (Seq), or macroscopic morphologi-
cal similarity to other named cultures (similarity). Where pure
culture or sequencing was not possible, taxa are described as
‘unknown’ groups of similar phenotype or individuals, and their
mycelial morphology described. The recovery method of each
taxon refers to whether it was obtained through re-isolation
onto agar from wood (Isol) or cords (Cords), or as outgrowth
following disk incubation (Disk).
Table S3. Summary OTU statistics following different pre-
colonizer species. Number of OTUs pre- and post-rarefaction
are given for data including and excluding OTUs correspond-
ing to the pre-colonizer species; where there was no pre-
colonizer (Control), data are the same in both instances. Data
are given as total number of occurrences of each OTU
(Counts) and number of OTUs (# OTUs) across all sites. All
subsequent analyses were performed on data from which
pre-colonizer OTUs had been excluded. Operational taxo-
nomic units belonging to the ‘Decomposer’ or ‘Co-colonizer’
communities are defined in Table S7. Results from one-way
ANOVA comparisons of Shannon diversity (H), Fishers’ alpha
(α) and Pielou’s evenness (E) are given as degrees of freedom
(df), the F-statistic and P-value; no significant differences
(P > 0.05) were found in any of these measures between
different pre-colonizers.
Table S4. Variability in OTU profiles between different
species and sites. Betadisper tests were performed to assess
variability in OTU profiles separately for individual species on
different sites (‘Site’), or between different species on the
same site (‘Species’). All tests were performed on fourth root
transformed data, and the degrees of freedom (groups,
residuals), F-statistic and P-value are shown. See Table 1 for
site name abbreviations.
Table S5. Summary OTU statistics for different sites.
Numbers of OTUs pre- and post-rarefaction are given for data
including and excluding OTUs corresponding to the pre-
colonizer species; where there was no pre-colonizer (Control)
data are the same in both instances. All analyses were per-
formed on data with pre-colonizer OTUs excluded. Data are
given as total number of occurrences of each OTU (Counts)
and number of OTUs (# OTUs) across all sites. All subsequent
analyses were performed on data with pre-colonizer OTUs
excluded. Operational taxonomic units belonging to the
‘Decomposer’ or ‘Co-colonizer’ communities are defined in
Table S7. Results from one-way ANOVA comparisons of
Shannon diversity (H), Fishers’ alpha (α) and Pielou’s even-
ness (E) are given as degrees of freedom (df), the F-statistic
and P-value; no significant differences (P > 0.05) were found
in any of these measures between different pre-colonizers.
See Table 1 for site name abbreviations.
Table S6. Pairwise comparisons between different sites,
split by pre-colonizer species. Comparisons were performed
using Adonis/PERMANOVA, following which a P-adjustment
was performed to reduce the effect of false discovery rates
(Benjamini and Holden, 1995); adjusted P-values are shown.
P < 0.05 indicates a significant difference in community com-
position following the same pre-colonizer on different sites.
See Table 1 for site name abbreviations
Table S7. Occurrence and identification of OTUs by pre-
colonizer species across different sites. Each OTU is given
Location and priority effects in fungi 15
© 2015 The Authors. Environmental Microbiology published by Society for Applied Microbiology and John Wiley & Sons Ltd,Environmental Microbiology
1968 J. Hiscox et al.
VC 2015 The Authors. Environmental Microbiology published by Society for Applied Microbiology and John Wiley & Sons Ltd.,Environmental Microbiology, 18, 1954–1969

as a % of the total OTUs detected across all replicates of
each pre-colonizer species on each site. The total number of
OTU counts across all treatments gives a measure of the
overall abundance of each OTU. Operational taxonomic unit
identity was determined using MASSBLASTER, and the taxon
with the best e-value was selected, and the relevant details
are given. Taxonomy was determined by Galaxy454. –, not
detected or data unavailable. Operational taxonomic units
were divided into one of two groups based on their ecological
role: those that are known to directly contribute to wood
decomposition were assigned to the decomposer group (D),
whereas those that are secondary saprotrophs (live off exu-
dates or the mycelium of wood decomposers) assigned to the
co-colonizer group (C). Broadly, the Ascomycota were group
C and the Basidiomycota plus xylariaceous Ascomycota
comprised group D. See Table 1 for site name abbreviations;
C, uncolonized controls; Vc, V. comedens; Tv, T. versicolor;
Hf, H. fasciculare.
Table S8. A. Details of species used. All cultures were
obtained from the Cardiff University Culture Collection. B.
Geodesic distances (km) between sites.
Table S9. Details of primers used. Primers were designed by
Ihrmark and colleagues (2012).
16 J. Hiscox et al.
© 2015 The Authors. Environmental Microbiology published by Society for Applied Microbiology and John Wiley & Sons Ltd,Environmental Microbiology
Location and priority effects in fungi 1969
VC 2015 The Authors. Environmental Microbiology published by Society for Applied Microbiology and John Wiley & Sons Ltd.,Environmental Microbiology, 18, 1954–1969