locational guidance for fish farming …marine fish farms in scottish waters’ provides guidance to...
TRANSCRIPT
Scottish Fisheries Research Report Number 63 / 2002
SCOTTISH EXECUTIVE LOCATIONAL GUIDELINES FORFISH FARMING: PREDICTED LEVELS OF NUTRIENT
ENHANCEMENT AND BENTHIC IMPACT
PA Gillibrand, MJ Gubbins, C Greathead and IM Davies
Fisheries Research Services, Marine Laboratory,ABERDEEN
© Crown copyright 2002
1
ABSTRACT
The Scottish Executive document ‘Locational Guidelines for the Authorisation ofMarine Fish Farms in Scottish Waters’ provides guidance to the aquaculture industryand regulatory bodies on the environmental suitability of coastal areas for fishfarming. This guidance is based on advice from Scottish Natural Heritage andFisheries Research Services (FRS), relating to the relative environmental sensitivityof local areas supporting aquaculture. The purpose of this document is to describethe predictive modelling approach used to inform the FRS component of this advice,through estimation of the levels of nutrient enhancement and benthic impact arisingfrom current marine finfish cultivation in sea lochs (and similar semi-enclosed waterbodies).
A simple box model is used to predict the level of enhancement of soluble nutrientnitrogen from fish farming sources, treating nitrogen as a conservative substance.This model is a function of the flushing rate of a sea loch, the total consentedbiomass of all the finfish farms in the loch and the nitrogen source rate. A massbalance model was used to estimate the rate of release of nitrogen at 48.2 kgN pertonne of salmon produced per year. These data are used to calculate an equilibriumconcentration enhancement (ECE) for nitrogen, expressed in µmol l-1. Non-salmonidspecies are accounted for in this model, by the application of appropriate ‘speciesfactors’ to correct for the different rates of soluble nitrogen release from the farmingof such species.
Benthic impact is estimated using a modified ‘Gowen’ model to predict the area ofseabed impacted by the deposition of organic matter in the form of solid waste fromfinfish farms. Using the modified technique described, the along- and across-lochdispersion of solid waste is estimated for each farm in a sea loch. These distances,together with an estimate of the surface area of the farms are used to predict anelliptical area of seabed impacted by organic carbon deposition. An appropriatedistribution of particle settling velocities and associated quantities of excreted carbonare applied in order to estimate areas of seabed impacted by different levels oforganic carbon deposition within the impacted area. The results of this model areused to estimate the total percentage area of the seabed of a loch impacted by alevel of enhanced organic carbon deposition greater than 0.70 kgC m-2 y-1. Abovethis critical value, it has been shown that the infaunal diversity of sediments isreduced, and the seabed can be considered ‘degraded’.
The models described here predict the relative levels of nutrient enhancement andpercentage areas of seabed degraded by organic carbon deposition for 111 sealochs. The results of both models are scaled from 0 – 5, and the two scaled valuesare added together to provide a single combined index. On the basis of thiscombined index, areas are designated as Category 1, 2 or 3, where Category 1areas are considered to be the most environmentally sensitive to further fish farmingdevelopment due to high predicted levels of nutrient enhancement and / or benthicimpact.
2
BACKGROUND
In October 1999, the Scottish Executive published ‘Locational Guidelines for theAuthorisation of Marine Fish Farms in Scottish Waters’. These guidelines wereissued following the announcement in 1997 that authorisation to permit marine fishfarm developments would be transferred from the Crown Estate (CEC) to Scottishlocal authorities. The purpose of the Locational Guidelines was to facilitate thistransfer by providing guidance to local authorities, other regulatory bodies and theindustry on the future location of marine fish farms. This guidance designatedScottish coastal waters into three Categories, with varying levels of restriction onfurther fish farming development. Definitions of these Categories and the levels ofrestriction they impose on further fish farming development are given in the 1999Locational Guidelines.
The criteria used by the Scottish Executive in designating these areas were basedpartly on advice from Scottish Natural Heritage (SNH) relating to the location ofnatural heritage sensitivities and National Scenic Areas. In addition, FRS providedadvice on the relative environmental sensitivity of semi-enclosed coastal waters (e.g.sea lochs) as a result of discharges from existing fish farming activity in those areas.This sensitivity was estimated using predictive modelling of the level of solublenutrient enhancement and benthic impact in semi-enclosed waters that supportedfish farming activities.
The Scottish Executive Environment and Rural Affairs Department, FreshwaterFisheries, Aquaculture and Marine Environment division (SEERAD FFAME)requested further advice on the relative environmental sensitivity of sea lochssupporting aquaculture, to inform an update of the Locational Guidelines in 2002.The purpose of this document is to outline the predictive modelling approachesapplied by FRS to inform this revision of the Locational Guidelines. Detailed here arethe simple computer-based models used to predict nutrient enhancement andbenthic impact, together with a description of how the output from these models wasused to assign sea lochs (voes etc.) to the different Categories in the revisedLocational Guidelines. Details of the data on which these models are based and theirassumptions are also given.
THE COMPUTER MODELS
Two computer models are used to compare the environmental impacts of fish farmsin different lochs. Both are simple box models and make several simplifyingassumptions about the topography, hydrodynamics and water exchange of the sealoch systems. The first model predicts the potential degree of nutrient enrichment inthe water column due to the emissions from sea cages. The second model uses thesimple Gowen relationship to estimate the area of seabed impacted by deposition ofparticulate carbon from fish farms. Both models are used to assess the cumulativeimpact of all consented finfish farms in each sea loch system. To do this, the modelsrequire information on each loch, in particular the number of fish farms, the locationof each site and the consented maximum biomass of fish present. The models are
3
run routinely for all 111 sea lochs presently included in the FRS sea loch/fish farmenvironmental database, thereby providing a comparative study of the relativedegree of impact in each sea loch system.
Both nutrient and sediment impact models will be described in this report. First,however, the assumptions underpinning both models are explained.
Hydrographic Assumptions
The models represent each sea loch system as a rectangular basin. The physicalcharacteristics of the basin, i.e. length, surface area and volume, have the samevalues as the real system. The depth of the basin, given by dividing the watervolume by the surface area, therefore matches the mean depth of the real system,but does not incorporate details of the natural geomorphology (e.g. sills and deepbasins).
The second major simplification concerns the tidal exchange and flushingmechanism of the loch basin. The predominant exchange mechanism is assumed tobe the semi-diurnal tide. The flushing time of the loch basin can be calculated byassuming that the water volume is replaced by the volume of water entering andleaving on each tide (the “tidal prism”), giving (see Edwards and Sharples, 1986):
TV
A RF =052
0 7.
. . days
where V is the volume of the loch basin (m3), A is the surface area of the loch (m2)and R is the tidal range (m). The factor 0.52 is the number of days per tidal cycle (1tidal cycle = 12.4 hours = 0.52 days), and the factor 0.7 approximates the mean tidalrange from the spring tidal range, R (Edwards and Sharples, 1986).
The tidal prism method of calculating flushing times is known to overestimate theexchange of water and therefore underpredict the flushing time (see, for example,Edwards and Sharples, 1986; Gillibrand and Turrell, 1997a; Gillibrand 2001). Theexchange rate of sea lochs can also be affected by wind strength and direction, andfluctuations in river flow (Gillibrand, in press). However, these variations are difficultto predict and vary from loch to loch. Tidal exchange is a steady and persistentprocess, not subject to meteorological fluctuations, and therefore forms the coreexchange mechanism of these systems. The tidal prism method, therefore, while notcomplete, forms the best available method for estimating the flushing of sea lochs.
The Sea Loch/Fish Farm Database
The information contained within the FRS sealoch database acts as the source datafor the nutrient, carbon loading and dispersion models.
The database comprises two related worksheets, one containing the hydrographicinformation on over 100 sea lochs, the other holding information on individual siteswithin each sea loch, totalling more than 300 finfish sites. Sites in open water
4
locations are not included in the database. The hydrographic information, includingthe length, area, volume, tidal range and flushing time of each system, is taken eitherfrom the Edwards and Sharples catalogue (Edwards and Sharples, 1986) or fromdigitised bathymetric maps of sea lochs not covered in the catalogue. The number offarms in the loch and the total consented biomass for the loch is also included in thisdataset.
The information on individual farm sites within each sea loch includes the maximumbiomass as consented by the Scottish Environment Protection Agency (SEPA), thedistance of the site from the mouth of the loch, lateral position across the loch, monthand year of most recent consent, a database number and the name of the produceror operator. The fish species contained on site is also noted so that differences inwaste discharge can be incorporated in to the models (as discussed later).
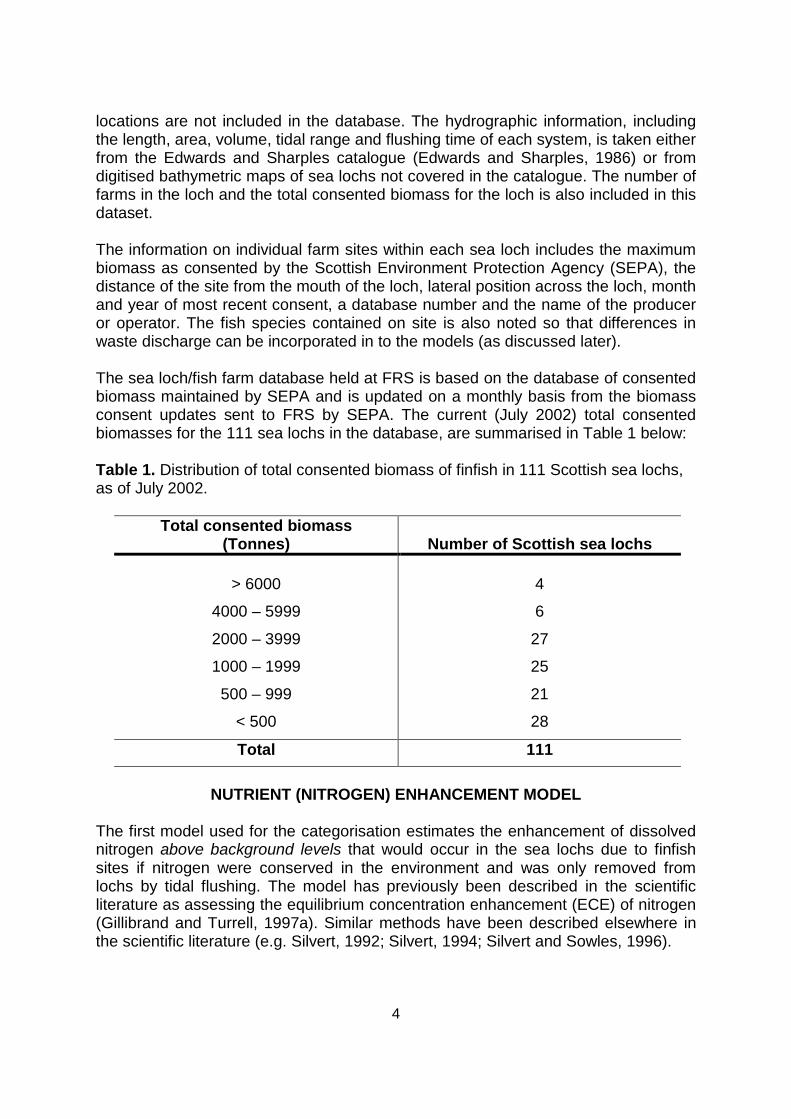
The sea loch/fish farm database held at FRS is based on the database of consentedbiomass maintained by SEPA and is updated on a monthly basis from the biomassconsent updates sent to FRS by SEPA. The current (July 2002) total consentedbiomasses for the 111 sea lochs in the database, are summarised in Table 1 below:
Table 1. Distribution of total consented biomass of finfish in 111 Scottish sea lochs,as of July 2002.
Total consented biomass(Tonnes) Number of Scottish sea lochs
> 6000
4000 – 5999
2000 – 3999
1000 – 1999
500 – 999
< 500
4
6
27
25
21
28
Total 111
NUTRIENT (NITROGEN) ENHANCEMENT MODEL
The first model used for the categorisation estimates the enhancement of dissolvednitrogen above background levels that would occur in the sea lochs due to finfishsites if nitrogen were conserved in the environment and was only removed fromlochs by tidal flushing. The model has previously been described in the scientificliterature as assessing the equilibrium concentration enhancement (ECE) of nitrogen(Gillibrand and Turrell, 1997a). Similar methods have been described elsewhere inthe scientific literature (e.g. Silvert, 1992; Silvert, 1994; Silvert and Sowles, 1996).
5
The model extracts the core physical parameters for every sea loch from thedatabase. These include the basin volume V (m3), flushing time TF (days) and thenumber of consented farms. From the related site database, the model reads in theconsented biomass MS (tonnes) for each site and the species of fish produced.
Calculation of Flushing Rate
The nutrient enhancement is strongly dependent on the flushing rate, Q (m3 y-1), ofthe loch, which is given by
Q V TF= 365. /
where the factor 365 converts the units from m3 d-1 to m3 y-1. The flushing rate, then,is the total quantity of water that is exchanged over a year.
Calculation of the Nitrogen Source
The nutrient considered by the model is nitrogen, mainly in the form of dissolvedammonia but also accounting for nitrogen emitted as particulate waste and re-dissolving into the water column from the seabed. This is equivalent to consideringthat seabed conditions at farms are generally not deteriorating with time. Thecombined source of nitrogen from dissolved and particulate wastes is S = 48.2 kgNper tonne of salmon produced. This value was derived from a mass balance model,used to estimate the release of dissolved and particulate nitrogenous waste fromcultivated salmon (Davies, 2000; Appendix 1). Such an estimate is dependent ondetails such as the stocking, feeding and harvesting strategies employed duringcultivation. This information was derived from the records of a major salmonproducer in Scotland, averaged over a large number of their on-growing sea cagesites (see Appendix 1). Parameters for the mass balance model were based largelyon these real data.
Applying values for feed wastage of 5 % and assuming the diet is 90 % digestible, afarm producing 1000 tonnes of salmon over a 20 month production cycle was foundto achieve a food conversion ratio (FCR) of 1.17 (on a wet weight basis). The meannitrogen content of salmon diets (wet weight) can be estimated at 7.2 % (Nutreco,pers. comm.), and the bulk composition of farmed fish is reported to contain 3.4 %(wet weight) nitrogen (Ackefors & Enell, 1990). Therefore, assuming a total mortalityrate over the 20-month production cycle of 10 %, the amount of nitrogen releasedcan be calculated as the difference between the amount input in the feed and thatincorporated into fish growth. Using this method, the amount of dissolved nitrogenreleased is estimated at 35.6 kgN tonne-1 production, and the amount in particulatewaste (wasted feed plus undigested faecal material) is estimated at 12.6 kgN tonne-1
production. The total nitrogen discharge rate is therefore the sum of the dissolvedand particulate rates, which is 48.2 kgN tonne-1 production. For a more detaileddescription see Appendix 1.
SEPA regulates the finfish industry by consenting a maximum biomass that may beheld on a site at any time. The SEPA database, and therefore the FRS database,
6
consists of consented site biomasses. However, the emission of nutrients to theenvironment is calculated from the mass of fish produced (i.e. grown). There is nosimple relationship relating the consented biomass on site to the production of fish.
For the purposes of this modelling exercise, it is assumed that after salmon smoltsare first put into sea cages, with a negligible biomass, the maximum consentedbiomass is reached during the subsequent twelve months. The mass of fishproduced in the first year is therefore equivalent to the consented biomass. Duringthe second year of the production cycle, the maximum consented biomass issustained whilst fish are being harvested, until eventually the biomass falls away asthe site is cleared for fallowing. It is assumed, therefore, that a mass of fishequivalent to the consented biomass is again grown on the site during the secondyear. In summary, for the purposes of this modelling, the consented biomass isassumed to equate to the annual growth of fish on site (i.e. the total mass of fishproduced on a site over a production cycle could potentially be twice the maximumbiomass).
Since the species produced on site is recorded in the database, the nutrient source,S, can be modified according to the species factors as discussed below (see Table2).
Nitrogen discharge by non-salmonid species
There is a marked trend of diversification of the fish species cultured in Scottishwaters. The industry is still dominated by Atlantic salmon, but interest in otherspecies is expanding quickly. There have been small quantities of trout and turbotproduced for many years, but the main new developments are taking place inhalibut, cod and haddock. Halibut production is expected to have been 189 tonnes in2001, and there are plans to increase production to perhaps 10,000 tonnes in 2010.The cultivation of cod has only recently attained commercial production, although theamount produced is still low. It is likely that the current low level of wild stocks willencourage the establishment of a farmed cod industry, and the industry has plans inplace that could lead to production of around 5000 tonnes in 2005.
For the purposes of the Locational Guidelines, it is necessary to assess the potentialfor the farming of “new” species to release waste to the environment, and to takeaccount of the degree to which the rate of production of waste may differ from that ofsalmon. The approach that has been taken is similar to that described above forsalmon, and to that recommended by OSPAR (Guideline 00/9/2) for quantifying andreporting nitrogen and phosphorus discharges from marine fish farms (OSPAR,2000). Mass balance calculations have been used to estimate the amounts ofnitrogen in dissolved and particulate waste from farms producing “new” species.
The primary variables in such calculations are the Food Conversion Ratio (FCR), thecomposition of the feed, the bulk composition of the fish, the proportions of feed lostas waste pellets and the digestibility of the feed. Davies and Slaski (Appendix 2)undertook an analysis of this type for halibut farming. They estimated that the loss ofnitrogen as dissolved substances was 48 kg tonne-1 of fish produced. In addition, a
7
further 15 % of the feed was indigestible and 5 % was wasted as uneaten pellets,both assumed to have the same composition as the feed. This amounts to loss of afurther 19.1 kg nitrogen per tonne of production. The total discharge of nitrogen istherefore 67.1 kg tonne-1 production.
Similar calculations can be carried out for cod farming. Cod diets differ from those forsalmon and halibut in that they contain lower proportions of lipid and higherproportions of protein. Consequently the average nitrogen content of cod diets isaround 9.3%. A critical factor is the value of the FCR for cod. Reported FCRs for codfarming vary between 0.8 to 1.5. A reasonable value for the industry mean value forthe intensive sea stage of cultivation is 1.1. Calculations similar to those describedabove indicate losses per tonne of production of 20.4 kg of particulate nitrogen and51.9 kg of dissolved nitrogen, a total of 72.3 kg tonne-1.
Turbot are cultivated using diets similar to those for cod (9.3 % N), with reportedFCR values similar to halibut (1.3 as discussed in Appendix 2). Application of simplemass balance models suggests a high nitrogen discharge rate of 86.9 kgN tonne-1.
Haddock have a similar dietary requirement to cod, and as a first approximation aretaken to have the same characteristics of waste discharge. The figures for haddockmust be viewed with caution as cultivation in Scotland is only at an experimentalphase and reliable values for food conversion efficiency are not yet available.
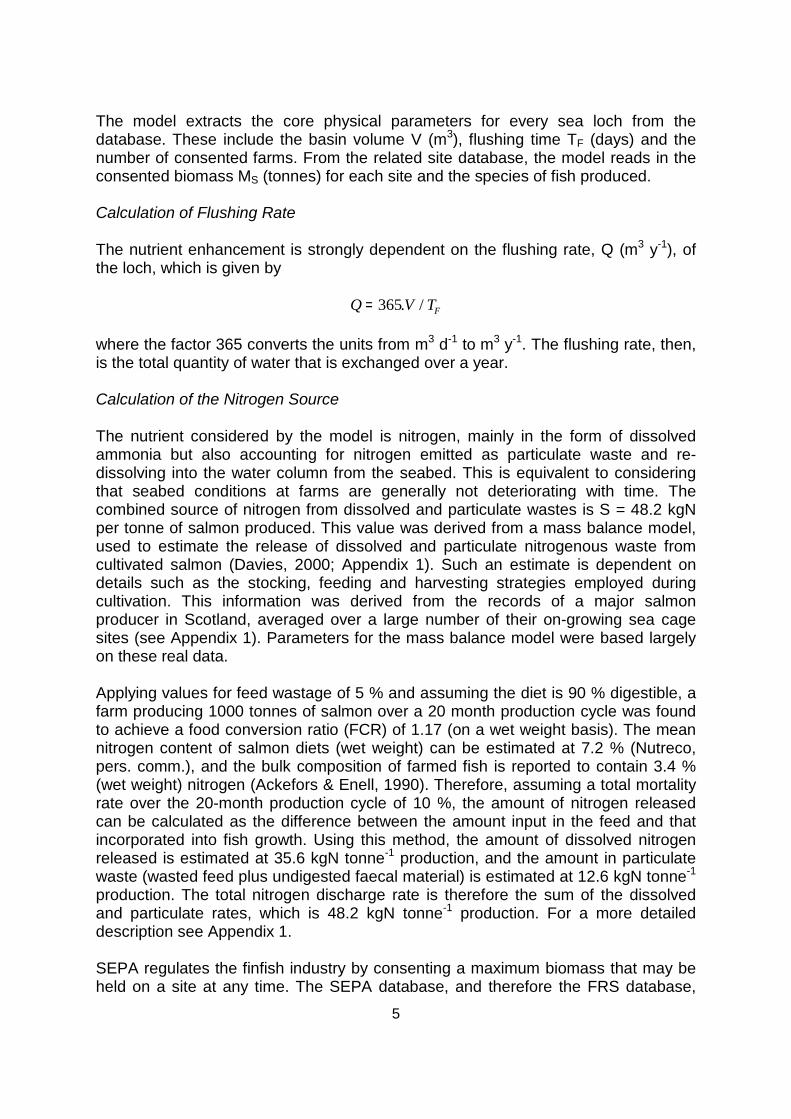
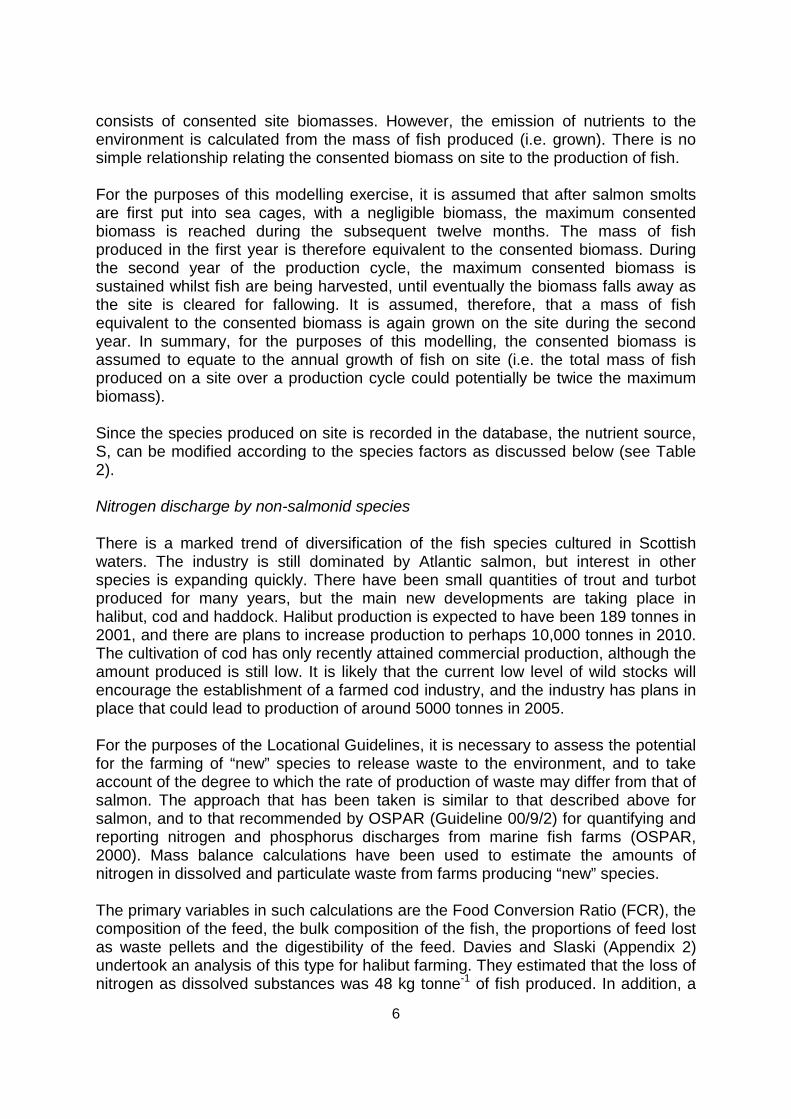
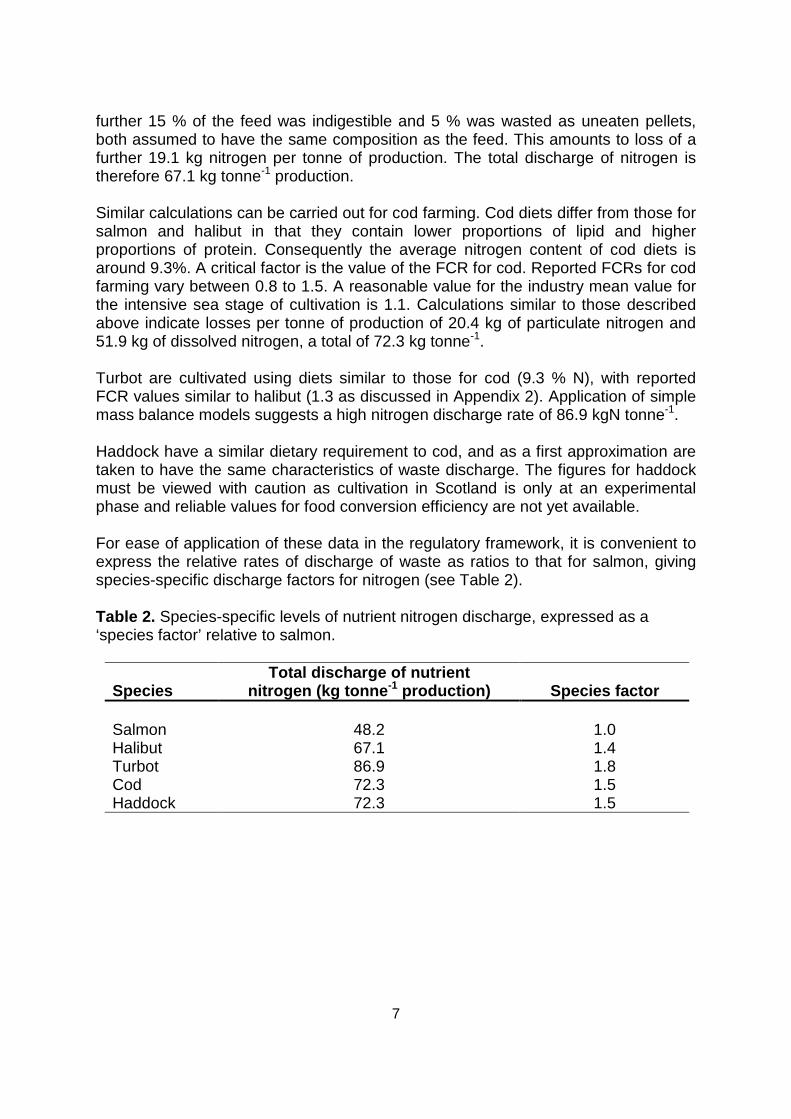
For ease of application of these data in the regulatory framework, it is convenient toexpress the relative rates of discharge of waste as ratios to that for salmon, givingspecies-specific discharge factors for nitrogen (see Table 2).
Table 2. Species-specific levels of nutrient nitrogen discharge, expressed as a‘species factor’ relative to salmon.
SpeciesTotal discharge of nutrient
nitrogen (kg tonne-1 production) Species factor
Salmon 48.2 1.0Halibut 67.1 1.4Turbot 86.9 1.8Cod 72.3 1.5Haddock 72.3 1.5
8
Calculation of the Nutrient Enhancement
The equilibrium concentration enhancement, ECE, is calculated by
ECE S M Q= . /
where M is the total consented biomass of all the finfish farms in the sea loch(tonnes), Q is the flushing rate (m3 y-1) and S the Source rate (total discharge ofnutrient nitrogen, kg tonne-1 production). The ECE units are converted from kg m-3 toµmol l-1, since measurements of dissolved nutrients are traditionally presented inthese units.
The nutrient enhancement model is run for every sea loch in the database and anECE value obtained for each loch. The potential degree of nutrient enrichment foreach loch is therefore assessed and the systems most at risk of overexploitation canbe identified.
CARBON DEPOSITION MODEL
The second model used for the categorisation predicts the cumulative areal extent ofimpact on the seabed due to the carbon deposited from all the finfish sites in eachloch. The model is a modified version of the method known as the “Gowen” model(Gowen and Bradbury, 1987; Gowen et al., 1994) for predicting the dispersion ofparticulate material from a fish cage. Gowen et al. (1994) showed that the dispersiondistance, Dx (m), is given by
D UH wX = /
where U is the water current speed (m s-1), H is the water depth (m) and w is thesettling velocity of the particulate material (m s-1). The distance Dx (m) is the distanceparticles travel from the cage before settling on the seabed.
This approach has been modified to:
(i) allow for a range of settling speeds for fish faecal material,(ii) incorporate, where possible, site-specific water depths,(iii) incorporate estimated site-specific water current speeds based on tidal exchangeof the system,(iv) calculate both Dx and DY, along- and across-loch dispersion distancesrespectively. This allows an elliptical impacted area to be calculated.(v) assign a proportion of the total faecal mass from a farm to each settling speed,based on an observed normal distribution of faecal settling speeds. This allowsareas where deposition exceeds certain critical values to be calculated.
As with the nutrient enhancement model, the benthic impact model takes core datafrom the sea loch database, and is run routinely for every sea loch in the database.Similar simplifications and assumptions to those described above apply, namely that
9
each loch is assumed to be a rectangular basin with physical dimensions of length (Lm), surface area (A m2) and volume (V m3) matching those of the real system. Thetidal range (R m) of the real system is also entered. Relevant site data extractedfrom the database includes the number of farms, the consented biomass of eachfarm (MS tonnes), the distance of each farm from the mouth of the loch (XF m) and, ina limited number of cases, the water depth at the site (HS m).
Results for each sea loch are ranked and indexed. The model therefore provides anindication of the relative degree of impact among all the lochs in the database, inaddition to the indexing and categorisations used for the Locational Guidelines.
Calculation of the Dispersion Distances
For each fish farm site in the database, the model calculates two horizontaldispersion distances, DX and DY, along and across the central axis of the rectangularbasin respectively. The along-loch dispersion distance is given by
D U H wX S S i= . /
where US is the tidal current amplitude at the site (m s-1), HS is the water depth at thesite and wi is the faecal settling velocity (m s-1). The water depth at the site is eitherextracted from the database or, if unavailable in the database, the mean water depthin the basin, H, is used, where H=V/A (m). There presently exists a rollingprogramme of entering the site water depths into the database but at the time ofwriting this is only partially completed. Where the value HS is taken as the meandepth, H, the value HS used by the model is constrained to lie between 15 m < HS <30 m, which are typical water depths beneath salmon farms in Scottish sea lochs.
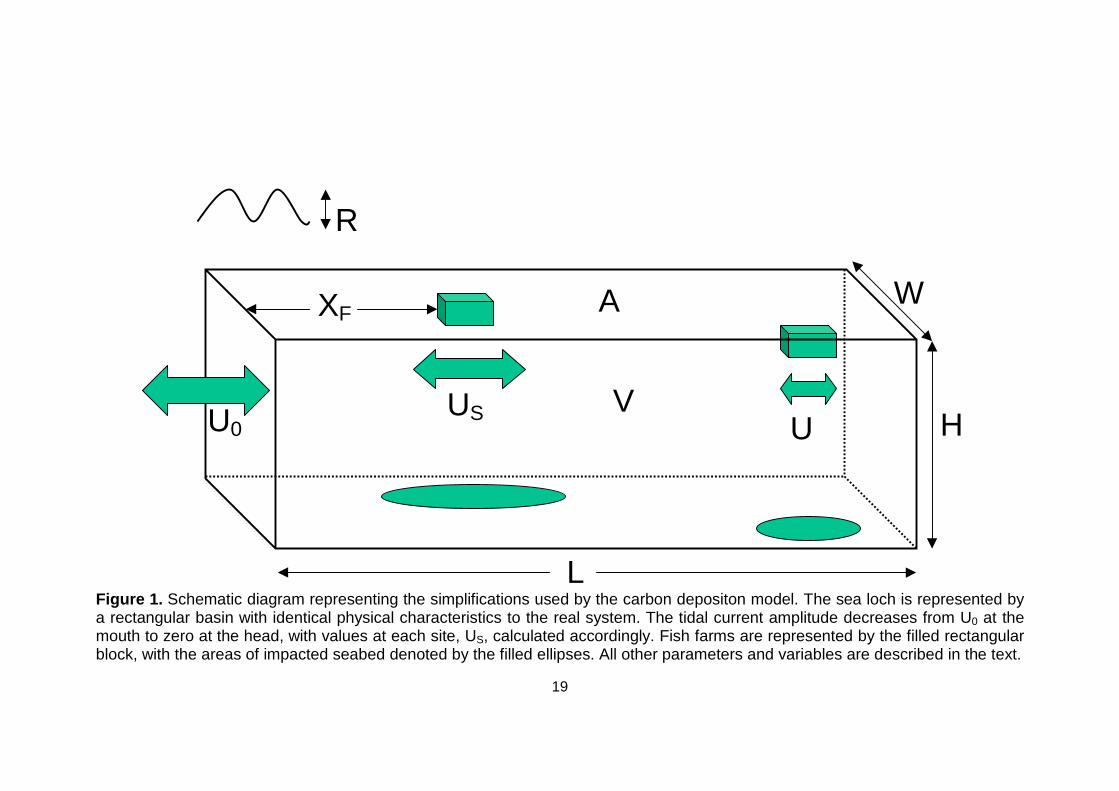
The tidal current amplitude, US, is assumed to decrease with distance from themouth of the loch i.e. tidal currents are weaker towards the head of sea lochs (Fig.1). The amplitude is therefore calculated by
U U L X LS F= −0.( ) /
where U0 is the tidal current amplitude at the mouth of the loch, itself calculated fromthe tidal prism and cross-sectional area of the rectangular basin (XA = V/L m2) i.e.
U A R X PA0 = π. . / ( . )
where P is the period of the semi-diurnal tide (s), R is the tidal range (m) and A thesurface area of loch (m2). The tidal current amplitude is used to calculate thedispersion distance because it provides the furthest distance that particles can travelfrom the cages due to tidal currents. It is assumed that particles are spread evenlyover the area defined by the dispersion distance. The database holds the meanspring tidal range. The effects of the spring-neap cycle are not considered.
It is recognised that these calculations of tidal current amplitudes do not reflect thevariations in tidal current amplitudes observed in real loch systems due to
10
topographic effects. However, these simplifications are adequate and necessary.The aim of these models is not to predict the exact settling distributions of particulatewaste, but to provide a scaling estimate of the impacted area.
Once the settling velocity, wi, is specified, the dispersion distance DX for a site canbe calculated. A range of settling velocities is used in these calculations and will bediscussed in more detail later.
The across-loch dispersion distance, DY, is calculated in a similar fashion to DX andis given by
D V H wY S S i= . /
where VS is the across-loch tidal current amplitude (m s-1). The value of VS cannot becalculated in the same way as US since a peak value in the loch is not known.Instead, the across-loch tidal current amplitude is calculated by scaling the value ofthe along-loch current amplitude according to the width:length ratio of the loch i.e.
V U W LS S= . /
where W is the width of the rectangular basin given by W = A / L (m). The abovecalculation results in a short, wide loch having an across-loch tidal current amplitudecomparative in magnitude to the along-loch amplitude, whereas a long, narrow lochwould have a much weaker across-loch current amplitude and hence smaller across-loch dispersion distance.
The dispersion distances, DX and DY, are then modified to allow for the effect ofhorizontal diffusion, which is an important process in the horizontal dispersion ofparticulate waste material (Gillibrand and Turrell, 1997b). Given a horizontal diffusioncoefficient, KH (m2 s-1), a length scale of dispersion is given by σ K HK t= 2. . , where t(s) is the time scale over which the diffusion acts. In the present application, the timescale is the time that particles spend settling through the water column, given byt H wS i= / . The dispersion distances were therefore incremented by
D D K H w
D D K H wX X H S i
Y Y H S i
= +
= +
2
2
. . /
. . /
with KH set to 0.1 m2 s-1, which is at the lower end of the range of measured valuesfor Scottish inshore waters (Turrell, 1990).
Calculation of Impacted Seabed Area
Silvert (1994, 1996) presented a calculation of the impacted seabed area, AI, where
A A DI F= + π 2
11
where AF is the area of the farm (m2), and D is a single calculated dispersiondistance (m). However, that calculation does not calculate the full extent of the areaimpacted by particles released from throughout the cage area, and a modifiedversion is used here.
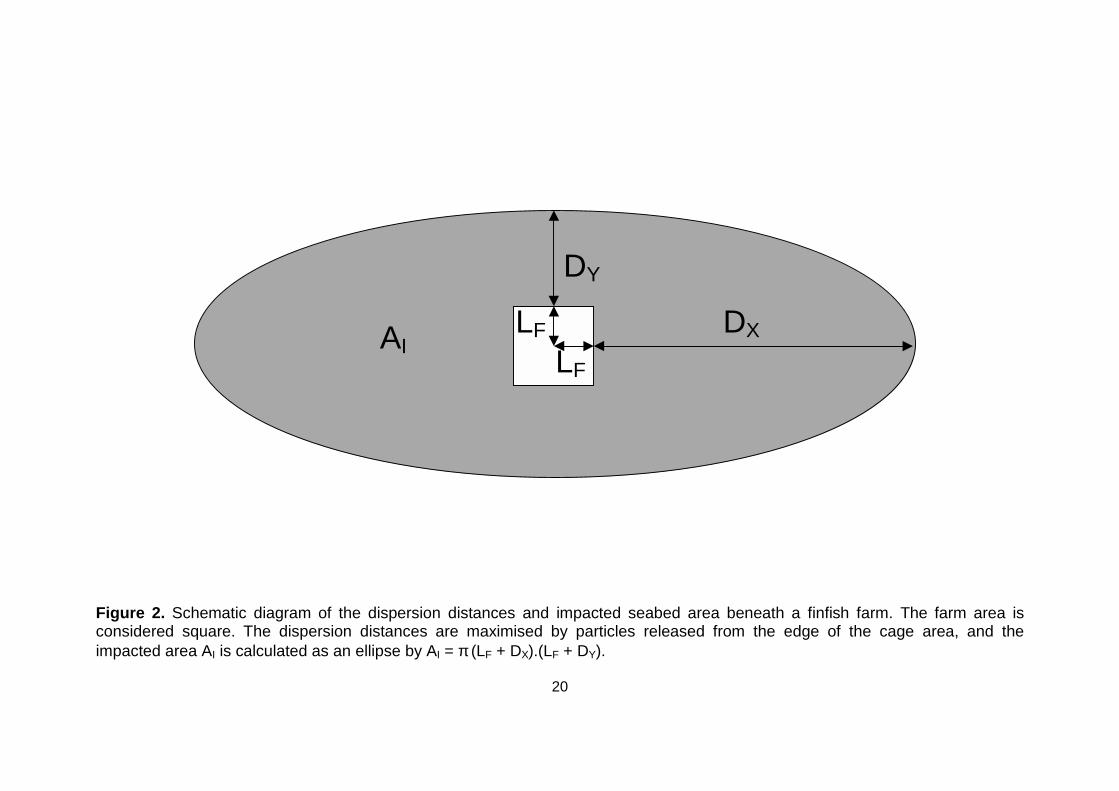
The present model assumes that particles can be excreted by fish at any locationwithin the cage area. The impacted area, therefore, is bounded by particles releasedat the limits of the farm area (Fig. 2). As illustrated, this calculation requires theapproximate dimensions of the farm.
The cage area of the farm, AC, can be estimated from the consented biomass, MS(tonnes), by assuming a stocking density, SD, and net depth, CD, with
AM
S CCS
D D=
.
For the purposes of providing the Locational Guidelines, a stocking density of SD =20 kg m-3 and a net depth of CD = 10 m were assumed. It is recognised that in realitythere is considerable variability in these parameters, but is not practical toincorporate such variability into these simple models. The calculation aboveestimates the total cage area. Since cages are grouped together, the farm area canbe rather greater than the cage area. Based on a group of 12 cages, in a 6x2 array,with 1m wide walkways around each cage, the farm area, AF, was increased by afactor of 30% relative to the cage area calculated above i.e.
A AF C= 13.
The dimensions of the farm, LF (as shown in Fig. 2) are then estimated by
L AF F= 05.
Again this is a significant simplification, but the variation in cage configurationsmakes it necessary to adopt a “typical” relationship.
Given the dimensions of the farm, and the across- and along-loch dispersiondistances, the impacted seabed area, AI(wi), is given by (Fig. 2).
A w L D L DI i F X F Y( ) .( ).( )= + +π
where AI is calculated as an ellipse with a major axis (LF + DX) and minor axis (LF +DY).
The area AI is calculated above for a single faecal settling velocity, wi. By using arange of settling velocities, a number of seabed areas impacted by different sizefaecal pellets can be estimated.
12
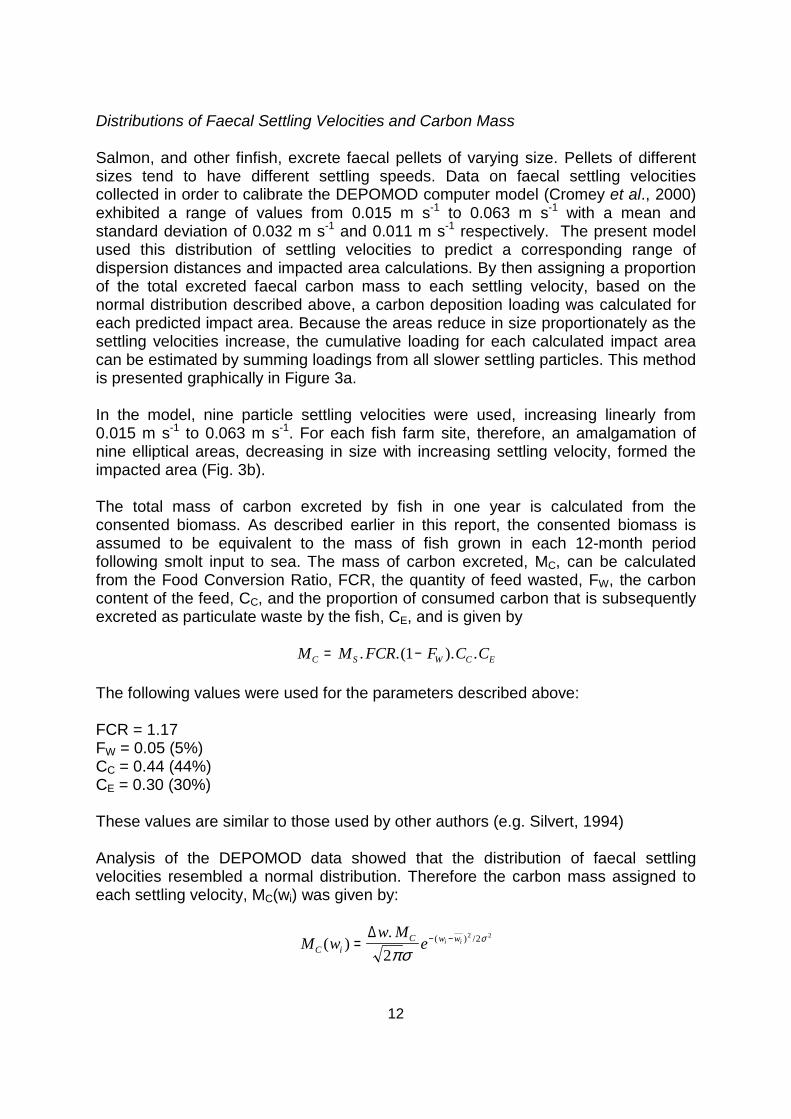
Distributions of Faecal Settling Velocities and Carbon Mass
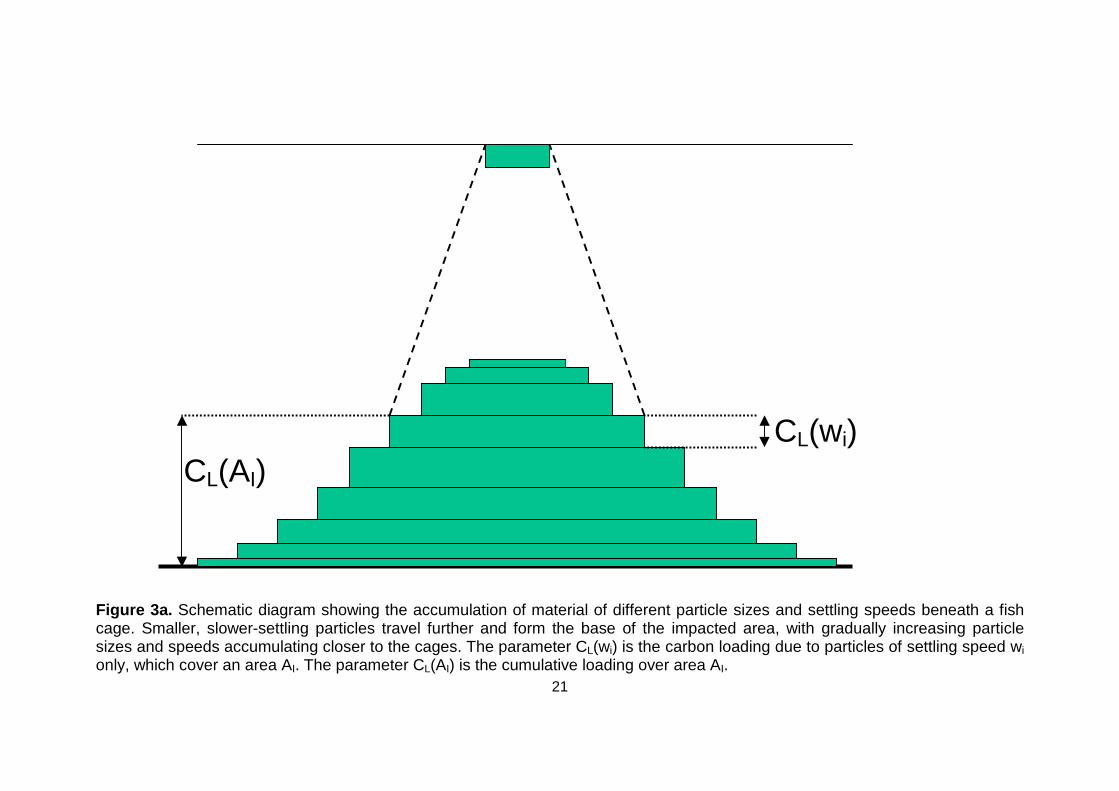
Salmon, and other finfish, excrete faecal pellets of varying size. Pellets of differentsizes tend to have different settling speeds. Data on faecal settling velocitiescollected in order to calibrate the DEPOMOD computer model (Cromey et al., 2000)exhibited a range of values from 0.015 m s-1 to 0.063 m s-1 with a mean andstandard deviation of 0.032 m s-1 and 0.011 m s-1 respectively. The present modelused this distribution of settling velocities to predict a corresponding range ofdispersion distances and impacted area calculations. By then assigning a proportionof the total excreted faecal carbon mass to each settling velocity, based on thenormal distribution described above, a carbon deposition loading was calculated foreach predicted impact area. Because the areas reduce in size proportionately as thesettling velocities increase, the cumulative loading for each calculated impact areacan be estimated by summing loadings from all slower settling particles. This methodis presented graphically in Figure 3a.
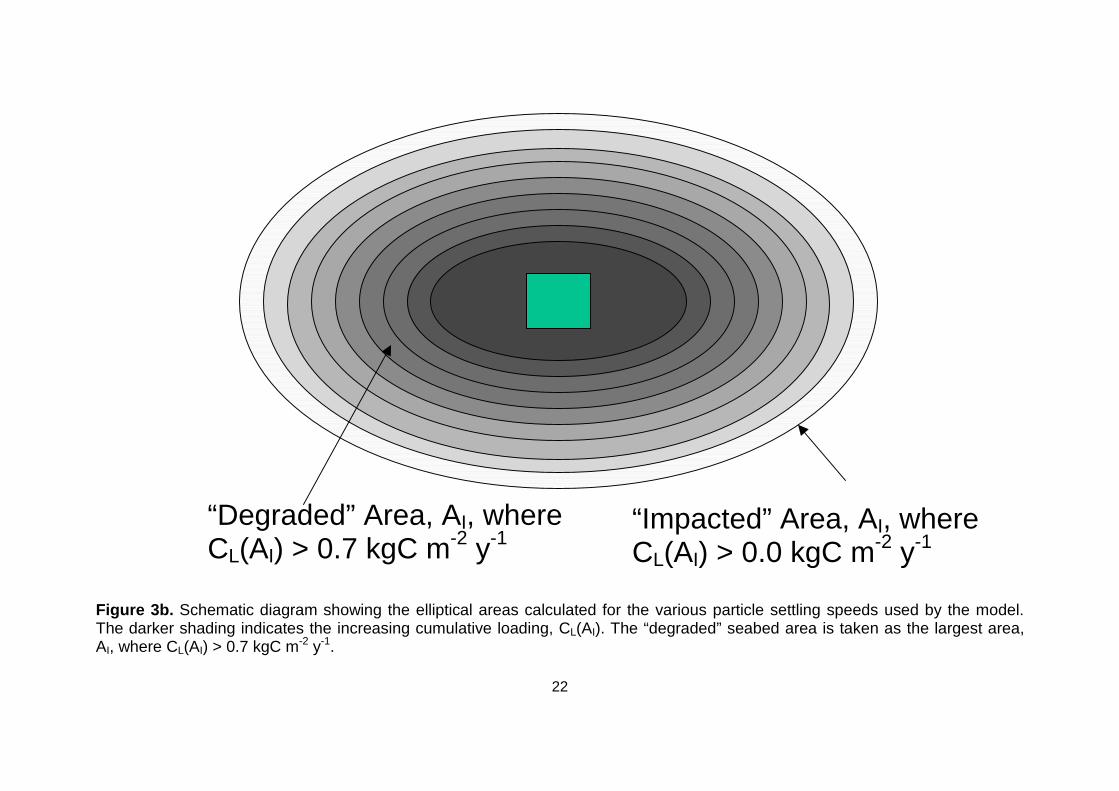
In the model, nine particle settling velocities were used, increasing linearly from0.015 m s-1 to 0.063 m s-1. For each fish farm site, therefore, an amalgamation ofnine elliptical areas, decreasing in size with increasing settling velocity, formed theimpacted area (Fig. 3b).
The total mass of carbon excreted by fish in one year is calculated from theconsented biomass. As described earlier in this report, the consented biomass isassumed to be equivalent to the mass of fish grown in each 12-month periodfollowing smolt input to sea. The mass of carbon excreted, MC, can be calculatedfrom the Food Conversion Ratio, FCR, the quantity of feed wasted, FW, the carboncontent of the feed, CC, and the proportion of consumed carbon that is subsequentlyexcreted as particulate waste by the fish, CE, and is given by
M M FCR F C CC S W C E= −. .( ). .1
The following values were used for the parameters described above:
FCR = 1.17FW = 0.05 (5%)CC = 0.44 (44%)CE = 0.30 (30%)
These values are similar to those used by other authors (e.g. Silvert, 1994)
Analysis of the DEPOMOD data showed that the distribution of faecal settlingvelocities resembled a normal distribution. Therefore the carbon mass assigned toeach settling velocity, MC(wi) was given by:
M ww M
eC iC w wi i( )
. ( ) /= − −∆2
2 22
πσσ
13
where wi is the mean settling velocity (= 0.032 m s-1), � the standard deviation ( =0.011 m s-1) and �w is the settling velocity increment used in the model ( = 0.006 ms-1).
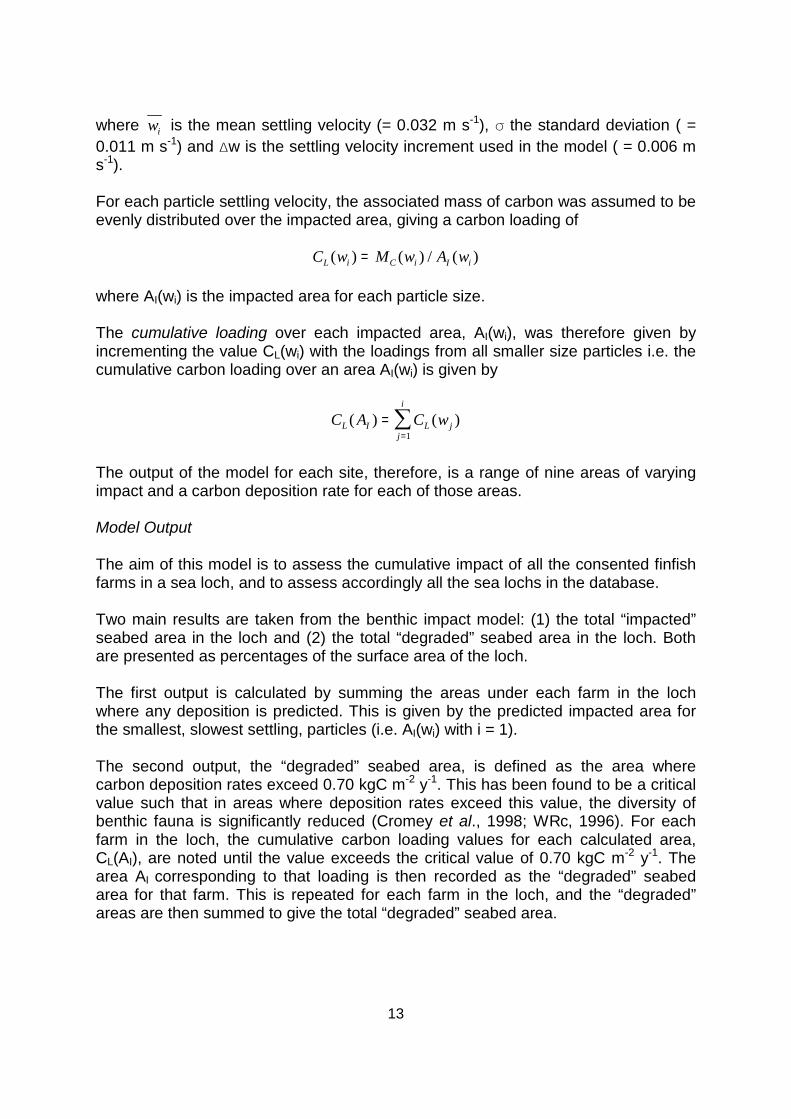
For each particle settling velocity, the associated mass of carbon was assumed to beevenly distributed over the impacted area, giving a carbon loading of
C w M w A wL i C i I i( ) ( ) / ( )=
where AI(wi) is the impacted area for each particle size.
The cumulative loading over each impacted area, AI(wi), was therefore given byincrementing the value CL(wi) with the loadings from all smaller size particles i.e. thecumulative carbon loading over an area AI(wi) is given by
C A C wL I L jj
i
( ) ( )==�
1
The output of the model for each site, therefore, is a range of nine areas of varyingimpact and a carbon deposition rate for each of those areas.
Model Output
The aim of this model is to assess the cumulative impact of all the consented finfishfarms in a sea loch, and to assess accordingly all the sea lochs in the database.
Two main results are taken from the benthic impact model: (1) the total “impacted”seabed area in the loch and (2) the total “degraded” seabed area in the loch. Bothare presented as percentages of the surface area of the loch.
The first output is calculated by summing the areas under each farm in the lochwhere any deposition is predicted. This is given by the predicted impacted area forthe smallest, slowest settling, particles (i.e. AI(wi) with i = 1).
The second output, the “degraded” seabed area, is defined as the area wherecarbon deposition rates exceed 0.70 kgC m-2 y-1. This has been found to be a criticalvalue such that in areas where deposition rates exceed this value, the diversity ofbenthic fauna is significantly reduced (Cromey et al., 1998; WRc, 1996). For eachfarm in the loch, the cumulative carbon loading values for each calculated area,CL(AI), are noted until the value exceeds the critical value of 0.70 kgC m-2 y-1. Thearea AI corresponding to that loading is then recorded as the “degraded” seabedarea for that farm. This is repeated for each farm in the loch, and the “degraded”areas are then summed to give the total “degraded” seabed area.
14
Summary
The total areas of seabed “impacted” and “degraded” by carbon deposition from fishfarms in each loch are estimated by applying a modified version of the “Gowen”model of particulate dispersion. This modified model uses the database of physicalcharacteristics of over 100 sea lochs and site details of over 300 finfish farms locatedin the lochs, making some simplifications and assumptions about the topography andtidal exchange of the lochs.
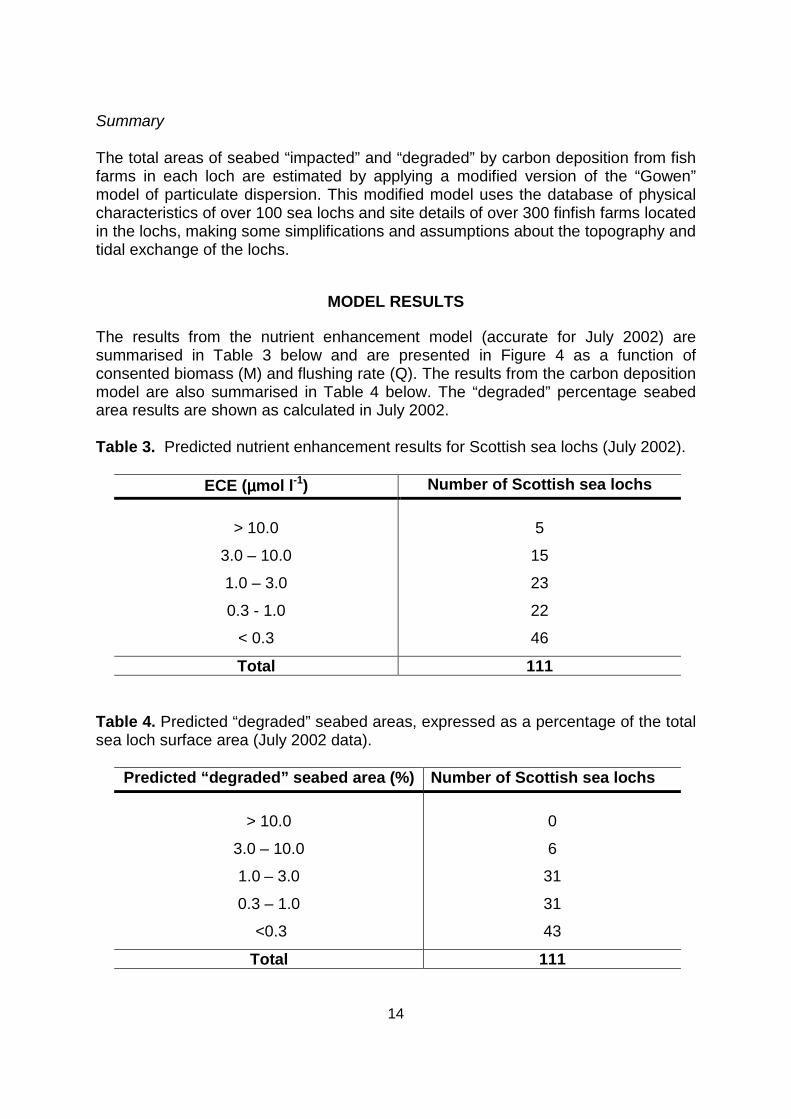
MODEL RESULTS
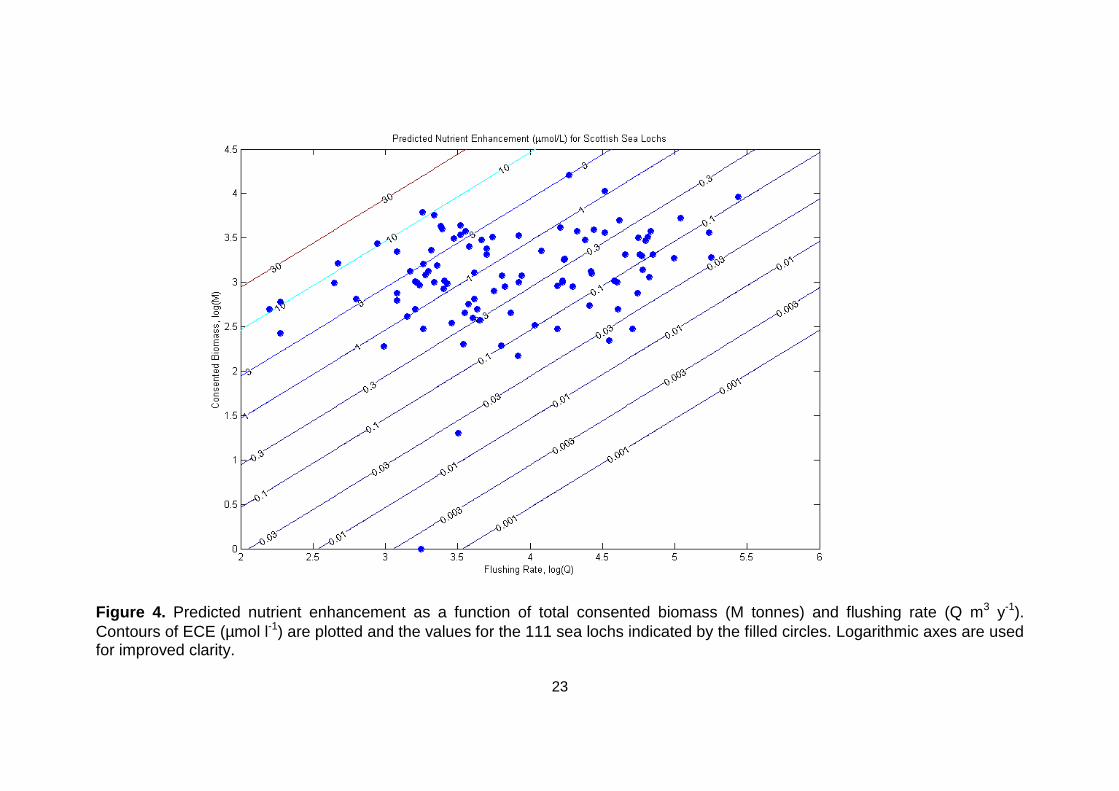
The results from the nutrient enhancement model (accurate for July 2002) aresummarised in Table 3 below and are presented in Figure 4 as a function ofconsented biomass (M) and flushing rate (Q). The results from the carbon depositionmodel are also summarised in Table 4 below. The “degraded” percentage seabedarea results are shown as calculated in July 2002.
Table 3. Predicted nutrient enhancement results for Scottish sea lochs (July 2002).
ECE (µµµµmol l-1) Number of Scottish sea lochs
> 10.0
3.0 – 10.0
1.0 – 3.0
0.3 - 1.0
< 0.3
5
15
23
22
46
Total 111
Table 4. Predicted “degraded” seabed areas, expressed as a percentage of the totalsea loch surface area (July 2002 data).
Predicted “degraded” seabed area (%) Number of Scottish sea lochs
> 10.0
3.0 – 10.0
1.0 – 3.0
0.3 – 1.0
<0.3
0
6
31
31
43
Total 111
15
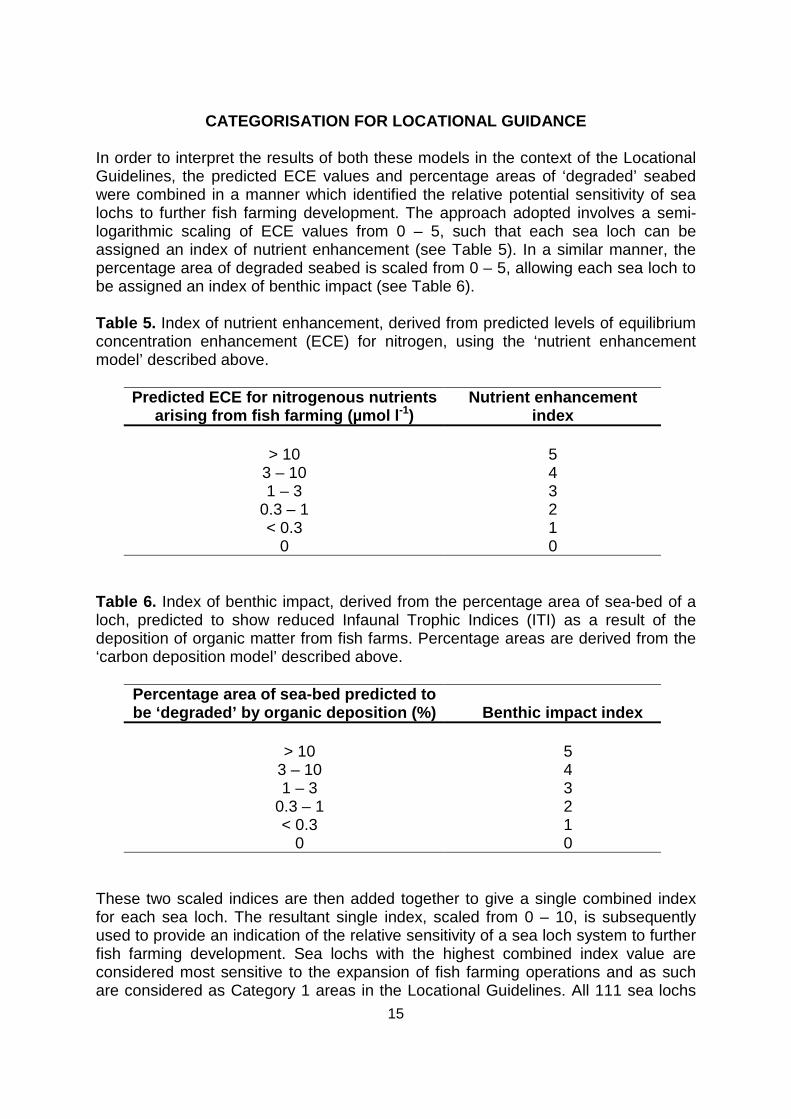
CATEGORISATION FOR LOCATIONAL GUIDANCE
In order to interpret the results of both these models in the context of the LocationalGuidelines, the predicted ECE values and percentage areas of ‘degraded’ seabedwere combined in a manner which identified the relative potential sensitivity of sealochs to further fish farming development. The approach adopted involves a semi-logarithmic scaling of ECE values from 0 – 5, such that each sea loch can beassigned an index of nutrient enhancement (see Table 5). In a similar manner, thepercentage area of degraded seabed is scaled from 0 – 5, allowing each sea loch tobe assigned an index of benthic impact (see Table 6).
Table 5. Index of nutrient enhancement, derived from predicted levels of equilibriumconcentration enhancement (ECE) for nitrogen, using the ‘nutrient enhancementmodel’ described above.
Predicted ECE for nitrogenous nutrientsarising from fish farming (µmol l-1)
Nutrient enhancementindex
> 10 53 – 10 41 – 3 3
0.3 – 1 2< 0.3 1
0 0
Table 6. Index of benthic impact, derived from the percentage area of sea-bed of aloch, predicted to show reduced Infaunal Trophic Indices (ITI) as a result of thedeposition of organic matter from fish farms. Percentage areas are derived from the‘carbon deposition model’ described above.
Percentage area of sea-bed predicted tobe ‘degraded’ by organic deposition (%) Benthic impact index
> 10 53 – 10 41 – 3 3
0.3 – 1 2< 0.3 1
0 0
These two scaled indices are then added together to give a single combined indexfor each sea loch. The resultant single index, scaled from 0 – 10, is subsequentlyused to provide an indication of the relative sensitivity of a sea loch system to furtherfish farming development. Sea lochs with the highest combined index value areconsidered most sensitive to the expansion of fish farming operations and as suchare considered as Category 1 areas in the Locational Guidelines. All 111 sea lochs
16
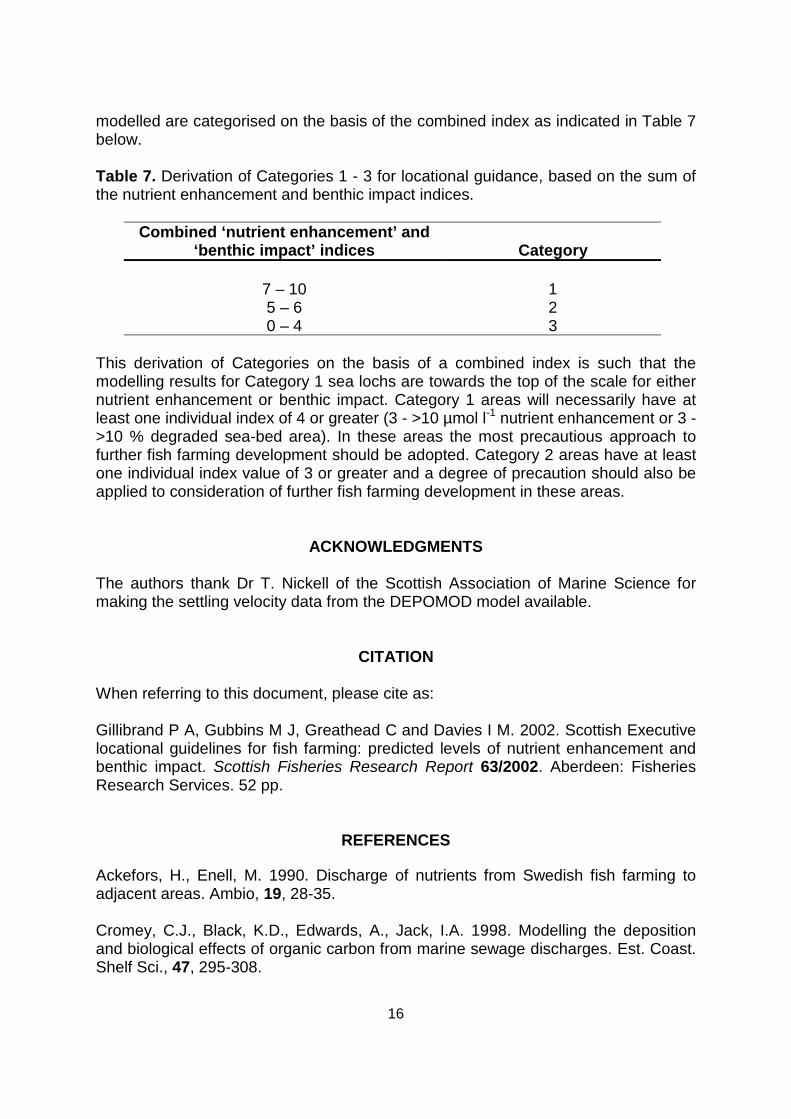
modelled are categorised on the basis of the combined index as indicated in Table 7below.
Table 7. Derivation of Categories 1 - 3 for locational guidance, based on the sum ofthe nutrient enhancement and benthic impact indices.
Combined ‘nutrient enhancement’ and‘benthic impact’ indices Category
7 – 10 15 – 6 20 – 4 3
This derivation of Categories on the basis of a combined index is such that themodelling results for Category 1 sea lochs are towards the top of the scale for eithernutrient enhancement or benthic impact. Category 1 areas will necessarily have atleast one individual index of 4 or greater (3 - >10 µmol l-1 nutrient enhancement or 3 ->10 % degraded sea-bed area). In these areas the most precautious approach tofurther fish farming development should be adopted. Category 2 areas have at leastone individual index value of 3 or greater and a degree of precaution should also beapplied to consideration of further fish farming development in these areas.
ACKNOWLEDGMENTS
The authors thank Dr T. Nickell of the Scottish Association of Marine Science formaking the settling velocity data from the DEPOMOD model available.
CITATION
When referring to this document, please cite as:
Gillibrand P A, Gubbins M J, Greathead C and Davies I M. 2002. Scottish Executivelocational guidelines for fish farming: predicted levels of nutrient enhancement andbenthic impact. Scottish Fisheries Research Report 63/2002. Aberdeen: FisheriesResearch Services. 52 pp.
REFERENCES
Ackefors, H., Enell, M. 1990. Discharge of nutrients from Swedish fish farming toadjacent areas. Ambio, 19, 28-35.
Cromey, C.J., Black, K.D., Edwards, A., Jack, I.A. 1998. Modelling the depositionand biological effects of organic carbon from marine sewage discharges. Est. Coast.Shelf Sci., 47, 295-308.
17
Cromey, C.J., Nickell, T.D., Black, K.D. 2000. DEPOMOD – A model for predictingthe effects of solids deposition from mariculture to the benthos. Dunstaffnage MarineLaboratory, Oban, Scotland, 120 pp.
Davies, I.M. 2000. Waste production by farmed Atlantic salmon (Salmo salar) inScotland. ICES CM 2000/O:01, 12 pp.
Edwards, A. and Sharples, F. 1986. Scottish Sea Lochs - a Catalogue. ScottishMarine Biological Association/Nature Conservancy Council, 110pp.
Gillibrand, P.A. 2001. Calculating exchange times in a Scottish fjord using a two-dimensional, laterally integrated numerical model. Est. Coast. Shelf Sci., 53, 437-449.
Gillibrand, P.A. in press. Observations and model simulations of water circulationand transport in Loch Fyne, a Scottish fjord. FRS report, Marine LaboratoryAberdeen.
Gillibrand, P.A. and Turrell, W.R. 1997a. The use of simple models in the regulationof the impact of fish farms on water quality in Scottish sea lochs. Aquaculture, 159,33-46.
Gillibrand, P.A. and Turrell, W.R. 1997b. Simulating the dispersion and settling ofparticulate material and associated substances from salmon farms. Aberdeen MarineLaboratory Report No. 3/97.
Gowen, R.J. and Bradbury, N.B. 1987. The ecological impact of salmonid farming incoastal waters: a review. Oceanog. Mar. Biol. Ann. Rev., 25, 563-575.
Gowen, R.J., Smyth, D. and Silvert, W. 1994. Modelling the spatial distribution andloading of organic fish farm waste to the seabed. pp. 19-30 in “Modelling BenthicImpacts of Organic Enrichment from marine Aquaculture”, B.T. Hargrave (et.), Can.Tech. Rep. Fish. Aquat. Sci. 1949: xi + 125 pp.
Hargrave, B. T. (Ed.) 1994. Modelling benthic impacts of organic enrichment frommarine aquaculture. an. Tech. Rep. Fish. Aquat. Sci. 1949, Dartmouth, Nova Scotia.xi+125 pages.
OSPAR Commission 2000. Quantification and reporting of nitrogen and phosphorusdischarges/losses from aquaculture plants. Meeting of the OSPAR Commission,Agenda Item 9, Draft Guideline 2. OSPAR 00/9/2, 9 pp.
Silvert, W. 1992. Assessing environmental impacts of finfish aquaculture in marinewaters. Aquaculture, 107, 67-79.
Silvert, W. 1994. Modelling benthic deposition and impacts of organic matter loading.pp. 1-18 in “Modelling Benthic Impacts of Organic Enrichment from marine
18
Aquaculture”, B.T. Hargrave (et.), Can. Tech. Rep. Fish. Aquat. Sci. 1949: xi + 125pp.
Silvert, W. and Sowles, J.W. 1996. Modelling environmental impacts of marine finfishaquaculture. J. Appl. Ichthyol., 12, 75-81.
Turrell, W.R. 1990. Simulation of advection and diffusion of released treatments inScottish sea lochs. Scottish Fisheries Working Paper No. 16/90, FRS MarineLaboratory, Aberdeen.
Turrell, W. R. and Gillibrand, P. A. 1992. Assessing the environmental affect of newand existing fish farms in Scottish sea lochs. Fisheries Research Services ReportNo. 3/92, SOAFD Marine Laboratory, Aberdeen.
WRc 1996. Forecasting the deposition and biological effects of excess organiccarbon from sewage discharges – user manual. Water Research Council plc., P.O.Box 16, Marlow SL7 2HD. 76 pp.
19
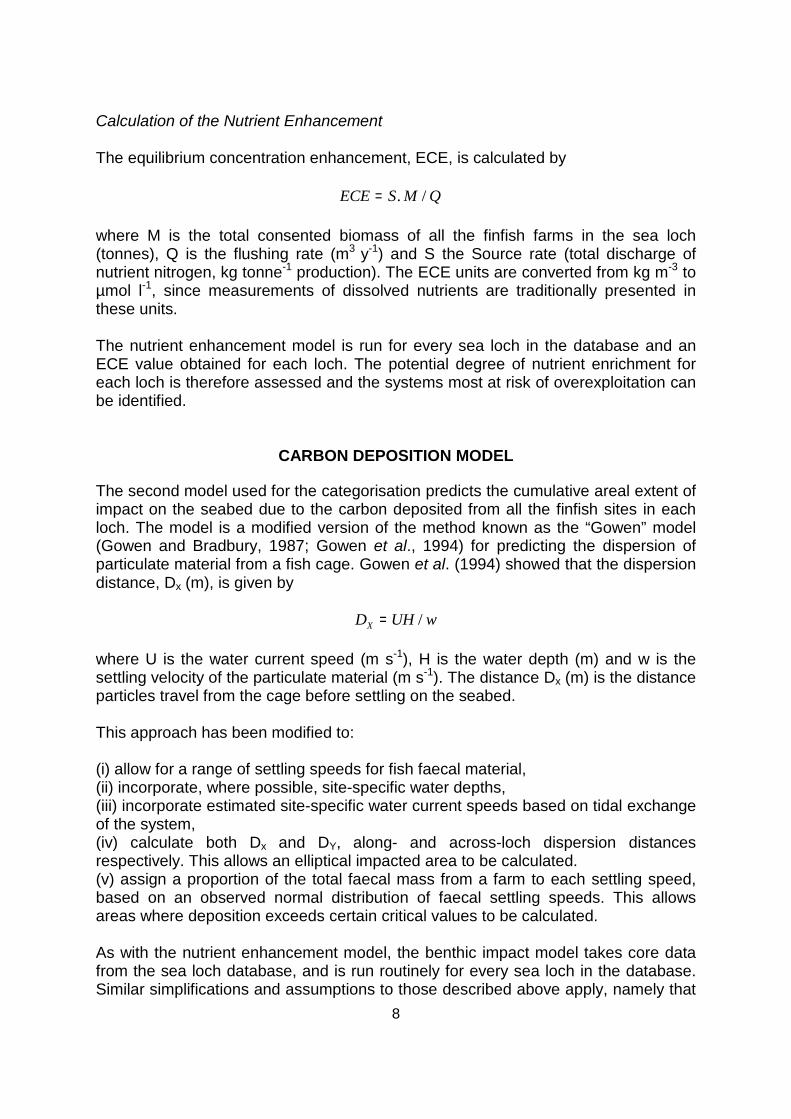
Figure 1. Schematic diagram representing the simplifications used by the carbon depositon model. The sea loch is represented bya rectangular basin with identical physical characteristics to the real system. The tidal current amplitude decreases from U0 at themouth to zero at the head, with values at each site, US, calculated accordingly. Fish farms are represented by the filled rectangularblock, with the areas of impacted seabed denoted by the filled ellipses. All other parameters and variables are described in the text.
U0US U
V
L
A
R
XFW
H
20
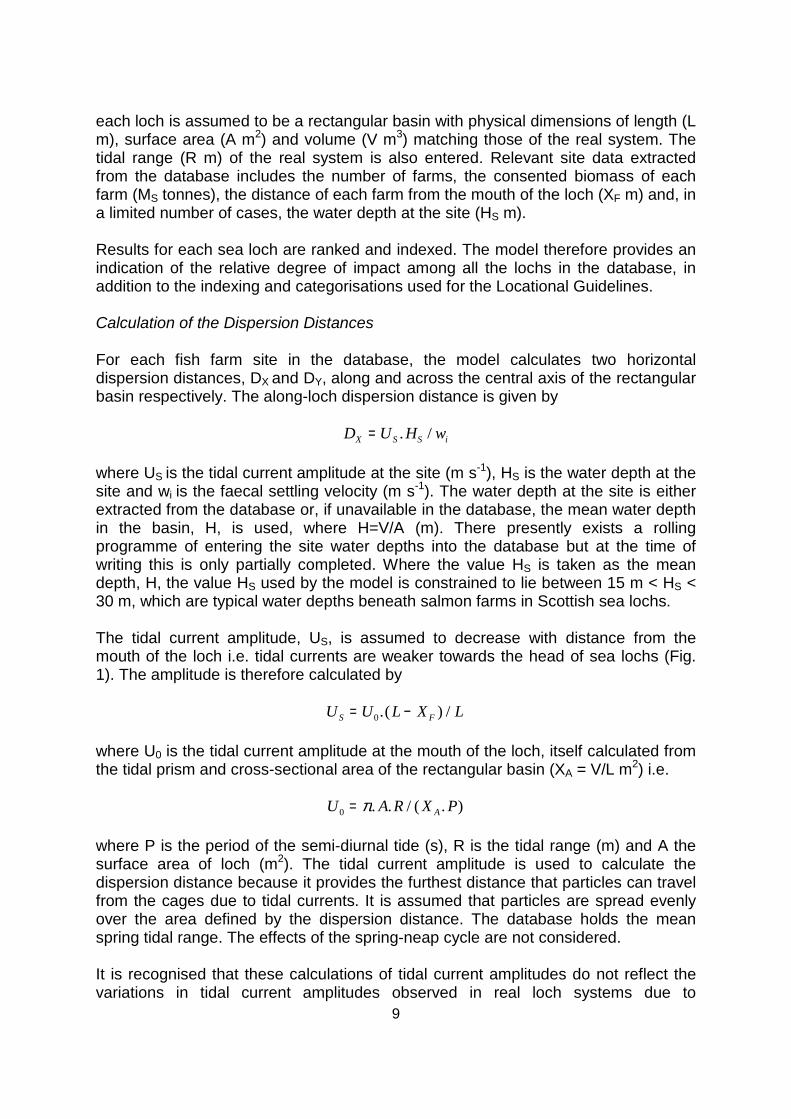
Figure 2. Schematic diagram of the dispersion distances and impacted seabed area beneath a finfish farm. The farm area isconsidered square. The dispersion distances are maximised by particles released from the edge of the cage area, and theimpacted area AI is calculated as an ellipse by AI = π (LF + DX).(LF + DY).
DY
DX
LF
LFAI
21
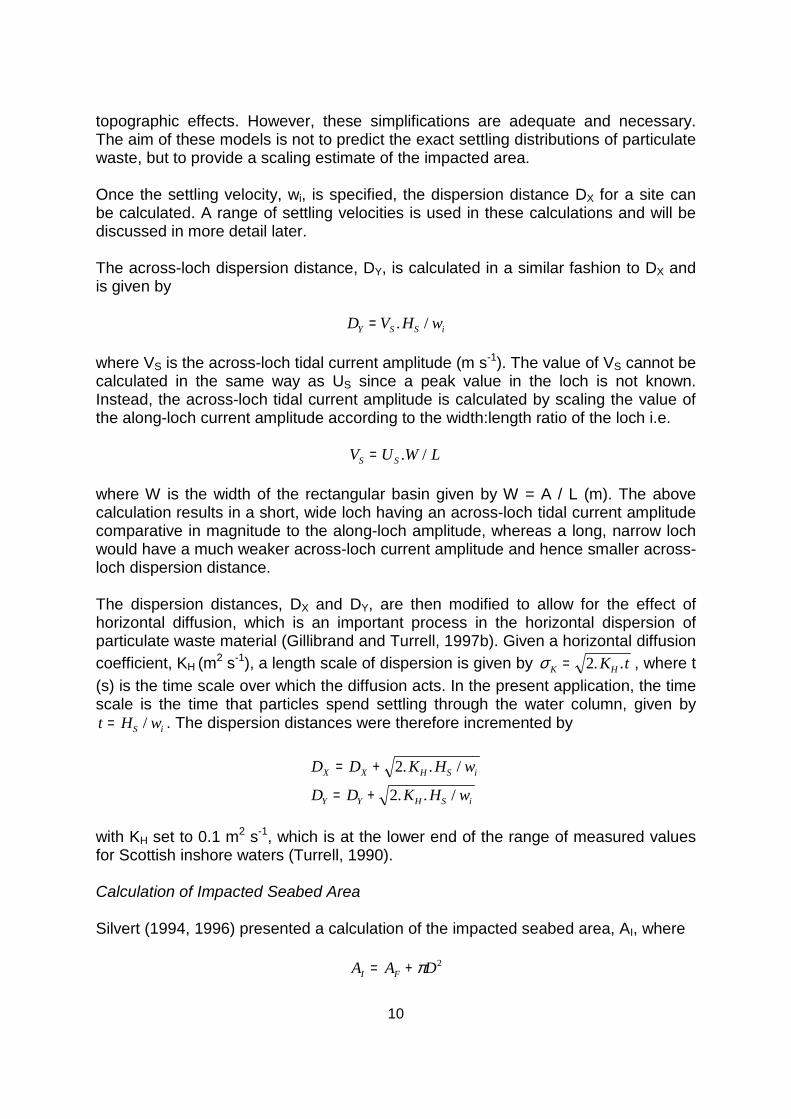
Figure 3a. Schematic diagram showing the accumulation of material of different particle sizes and settling speeds beneath a fishcage. Smaller, slower-settling particles travel further and form the base of the impacted area, with gradually increasing particlesizes and speeds accumulating closer to the cages. The parameter CL(wi) is the carbon loading due to particles of settling speed wionly, which cover an area AI. The parameter CL(AI) is the cumulative loading over area AI.
CL(wi)CL(AI)
22
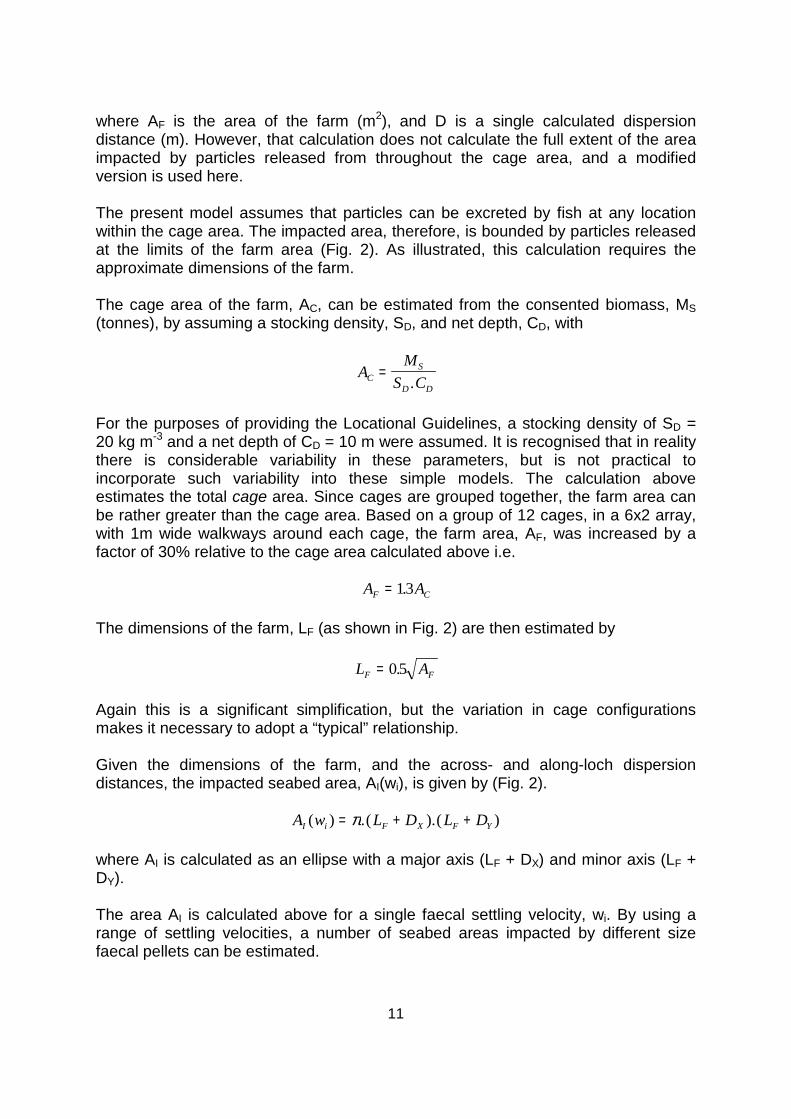
Figure 3b. Schematic diagram showing the elliptical areas calculated for the various particle settling speeds used by the model.The darker shading indicates the increasing cumulative loading, CL(AI). The “degraded” seabed area is taken as the largest area,AI, where CL(AI) > 0.7 kgC m-2 y-1.
“Degraded” Area, AI, whereCL(AI) > 0.7 kgC m-2 y-1
“Impacted” Area, AI, whereCL(AI) > 0.0 kgC m-2 y-1
23
Figure 4. Predicted nutrient enhancement as a function of total consented biomass (M tonnes) and flushing rate (Q m3 y-1).Contours of ECE (µmol l-1) are plotted and the values for the 111 sea lochs indicated by the filled circles. Logarithmic axes are usedfor improved clarity.
24
APPENDIX 1
Not to be cited without prior reference to the authors
International Council for the CM 2000/O:01Exploration of the Sea Sustainable Aquaculture
Development
WASTE PRODUCTION BY FARMED ATLANTIC SALMON(SALMO SALAR) IN SCOTLAND
I.M. Davies
FRS Marine Laboratory, PO Box 101, Victoria Road,Aberdeen, AB11 9DB, Scotland, UK
ABSTRACT
The assessment of the acceptable level of fish farm development in Scottish coastalareas is strongly dependent on the predicted rate of release of nitrogenous nutrientsand particulate organic waste. A simple mass balance model has been used toestimate the rate of production of dissolved and particulate nitrogenous waste bycultivated salmon. The predicted release of dissolved nitrogen is 35-45 kg N/tonneof fish produced, depending upon details of the stocking, feeding and harvestingstrategies adopted. Calculations based upon records from a number of Scottishsalmon farms indicate that the net waste productions during the cultivation of‘normal’ S1 and PP1 (photoperiod modified) smolts are similar.
INTRODUCTION
The most important product of the marine fish cultivation industry in the North-eastAtlantic is the Atlantic salmon, Salmo salar. Production in coastal waters nowexceeds 500,000 tonnes per annum, and the industry continues to make a verysignificant contribution to the economy of rural areas of countries including Scotland,Norway and Ireland. The growth of the industry has been accompanied byincreasingly comprehensive regulatory and monitoring procedures designed toprotect the environment. For example, in Scotland, farms are required to obtainDischarge Consent under the Control of Pollution Act, 1974, which commonly limitfactors such as the tonnage of fish that may be held (or produced), and the amounts

25
of medicines (such as sea lice treatments) that may be used at each site. Thequantities are determined on the basis of a system of environmental qualityobjectives (EQOs) and standards (EQSs) which have been established to ensurethat unacceptable environmental impact does not occur.
An EQO/EQS system can provide a flexible and environmentally sensitive basis forregulation, which takes into account differences (for example in hydrographiccharacteristics, or conservation interests) between individual sites. However, theequity and effectiveness of the system is dependent upon the quality and reliability ofthe scientific information used to predict the degree of environmental impact.
Fish farmers in Scotland are required to obtain leases for suitable sites from theCrown Estate Commissioners and permission to discharge wastes (DischargeConsent under the Control of Pollution Act, 1974, as amended by the EnvironmentAct, 1995) from the Scottish Environment Protection Agency. Applications forLeases are now processed through Local Planning Authorities who can take accountof a wide range of factors. However, the current Policy Guidance Note issued by theUK Government to assist Local Authorities in this task classifies coastal areas, interms of their relative potential for further fish farming development. The criteriaused to establish these categories include natural heritage conservation aspects,and also the current contributions of fish farming to nitrogenous nutrient levels in thewater column, and to organic enrichment of the seabed. Areas where fish farming isalready fairly intense in relation to the characteristics of the receiving environmentare unlikely to be appropriate for further development.
Similarly, the Scottish Environment Protection Agency, in its considerations ofapplications for Discharge Consents, takes account of predicted impacts of fish farmdevelopments on nutrient levels and on the sea bed (SEPA, 1998). Measurement ofnutrient levels is normally part of the routine environmental monitoring required bySEPA, and the predicted scale of impact on the sea bed is the dominant factor usedby SEPA to determine the appropriate tonnage of fish that may be held at each farmsite. Waste production rates are therefore central to estimation of the environmentalcarrying capacity for fish farming, and to the development and regulation of themariculture sector.
There are relatively few recent studies of the production of waste at salmon farms.At the same time, there have been very considerable developments in feedtechnology, for example the movement towards high energy feeds with increasedproportions of lipid and corresponding lower proportions of protein (and thereforeless nitrogen). This has been accompanied by improvements in feed conversionratios (FCR, the ratio of the weight of feed added to the weight of fish produced) fromperhaps 1.6-2.0 to current values of 1.3 or less. As a consequence, the utilisation ofnitrogen in feed is now much more efficient.
The most frequently cited values for the rate of excretion of dissolved nitrogen byfarmed fish are in the range 75-120 kg N/tonne of fish produced (GESAMP, 1996).A typical salmon farm in Scotland would currently utilise feed containing around 42%protein, with an FCR of around 1.3. This is equivalent to feeding 87 kg N/tonne of
26
fish produced. From this simple calculation it is clear that the higher estimates of therate of nutrient release (GESAMP, 1996) cannot reflect current farm practice.
The purpose of this paper is to present estimates of the current rates of nitrogenrelease from marine salmon farms in Scotland. The paper integrates information ontypical current (1997-99) feeding, harvesting etc strategies with a mass balancemodel to provide estimates of waste production resolved into time steps of 4 weeksthroughout the marine phase of the production cycle. Comparisons are also madebetween ‘normal’ S1 smolts which are transferred to the sea in spring (April-May)and photo-period modified smolts which are placed in sea cages during the autumn(PP1, October-December).
METHODS
A simple mass-balance model has been developed to predict the production ofdissolved and particulate waste in salmon farming. In order to undertake themodelling, values have to be selected for a number of basic forcing parameters.These values have been derived initially from a simulation of a salmon farm usingvalues which are considered to be typical of the Scottish industry. The model wasthen applied to records of a major salmon producer in Scotland, averaged over alarge number of their sea sites, using data referring to S1 smolts and PP1 smolts.
The basis of the model is that the dominant source of nitrogen to the fish is the diet,ie that they receive a negligible proportion of their nutrition from natural sources inthe surrounding environment of the farm. The feeding rate varies with size of fishand temperature. A proportion of the feed will be lost from the system as uneatenfeed pellets. Current salmon farming practice limits wastage to no more than 5% ofthe added feed, although reliable data on this are rare.
Of the feed which is ingested, a proportion is not digestible by the fish. Feedmanufacturers typically estimate the digestibility of feed as in excess of 85%,probably close to 90%. The undigested matter is considered to be excreted asfaecal material.
The nitrogen in the digested feed will be partitioned between incorporation into thetissues of the fish as they grow, and released to the environment as dissolvedsubstances (mainly ammonia and dissolved organic compounds). Feed ConversionRatios (FCR, weight of feed used divided by increase in wet weight of fish) arecalculated monthly, from farm records of feed utilised and fish growth indicate. Thebulk composition of farmed fish (Ackefors and Enell, 1990) is taken as 3.4% nitrogen(on a wet weight basis), which permits calculation of the amount of nitrogenincorporated in the fish as they grow.
Allowance is made in the model for mortalities of fish. The pattern of mortalityreflects common experience, with the highest rates of mortality occurring in the threemonths immediately after transfer of smolts to sea. The total mortality over the fullmarine phase is approximately 10%. The harvesting pattern used in the initial
27
simulation again reflects a typical Scottish farm, in which harvesting commenceswhen the mean fish weight reaches approximately 3 kg, and continues for three tofive months.
The amount of nitrogen released as dissolved substances is calculated as thedifference between the amount input in the feed, and the sum of the amounts inparticulate waste (excess pellets plus undigested material) and fish growth.
In the second simulation, real averaged farm records have been used to provideinformation on the main parameters of the model. These parameters include thestaggering of smolt inputs at different sites, the patterns of mortalities, the type offeed used (and therefore its composition), and the feeding rate. The composition ofthe feed varies as the fish grow; post-smolt diets generally contain more protein thandiets fed to larger fish. Allowance is made for harvesting to concentrate on the largerfish in the stocks, and to be spread over a longer time period.
RESULTS
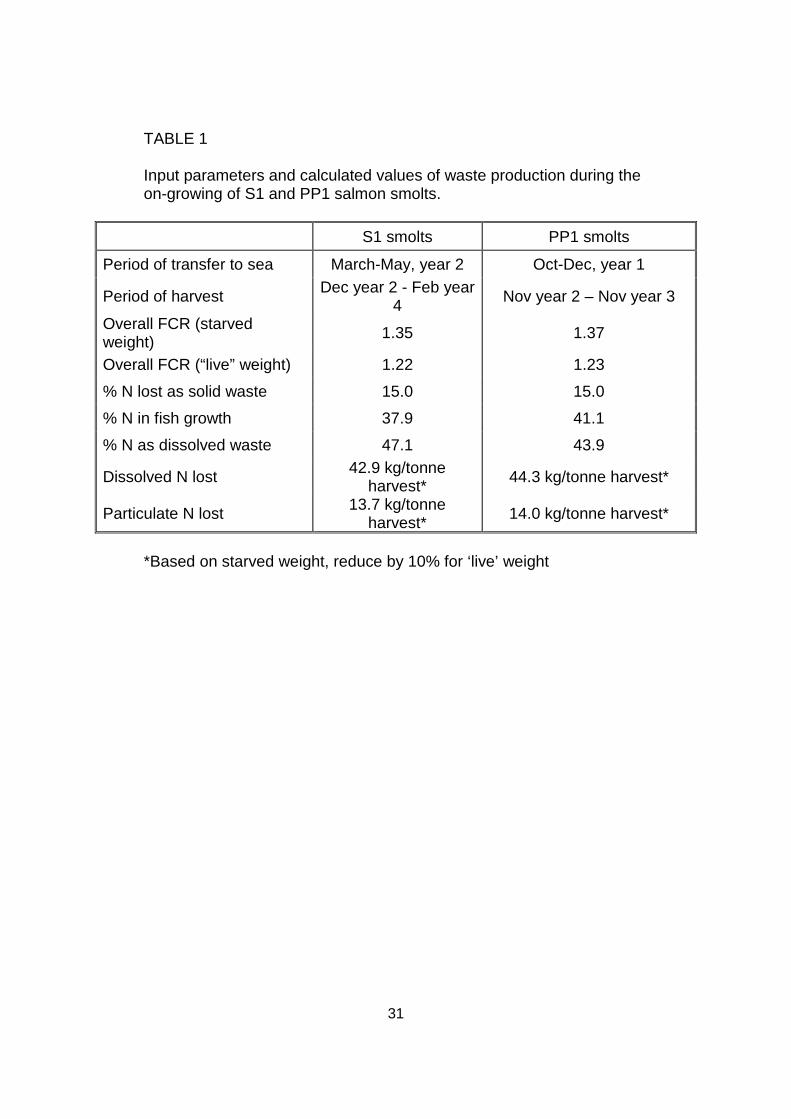
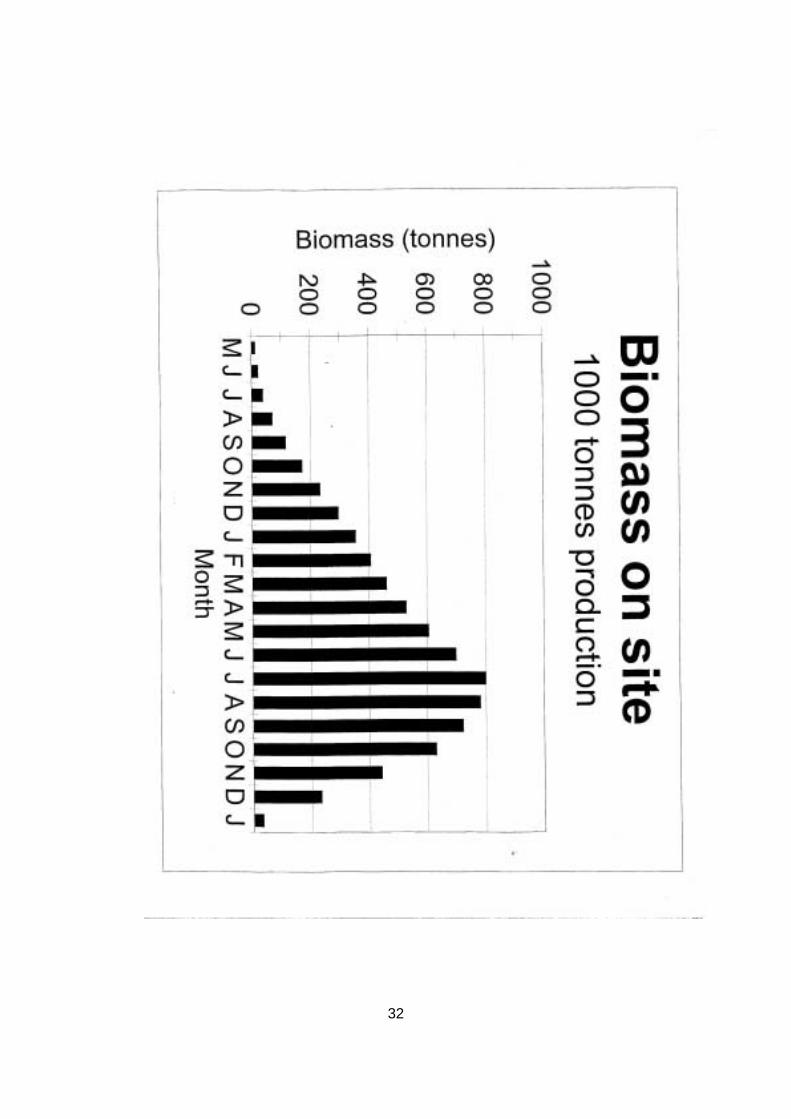
The farm initially simulated by the model produced 1,000 tonnes of salmon from S1smolts using 1,167 tonnes of feed over a period of 20 months, therefore with anoverall FCR (from the transfer to cages to harvest) of 1.17, calculated on total fishweight. Some farms calculate FCR on the weight of fish in harvest condition, after ashort period of starvation, and the above FCR is approximately equivalent to an FCRof 1.29 calculated on starved weight of fish. The maximum rate of feed inputoccurred during the second summer when the fish were in the sea, and ranged from106-115 tonnes per four week period over 12 weeks (Fig. 1). The peak biomass onthe farm occurred over the same period and was 700-800 tonnes (Fig. 2).
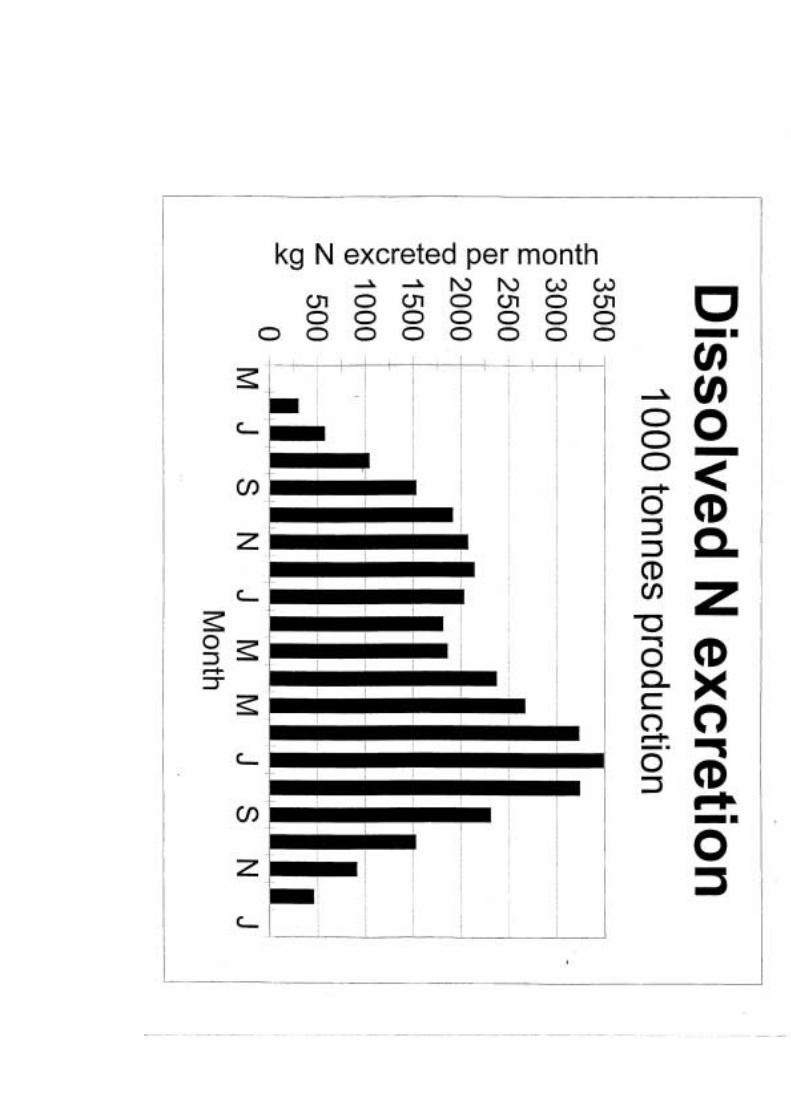
The nitrogen input in the feed was calculated to be partitioned as 15% in particulatewaste, 40.4% retained in fish growth, 1.6% lost as mortalities and 42.3% lost asdissolved waste. The predicted total amount of dissolved nitrogen released over thefull grow-out cycle was 35.6 kgN/t fish produced. The monthly amounts of solid anddissolved waste (Fig. 3) were directly proportional to the amount of feed used,because fixed values were selected for feed wastage, digestibility and FCR.
The sensitivity of the model to variations in the forcing parameters was explored. Adecrease of 5% in either the proportion of waste feed pellets or indigestibilitydecreases the predicted amount of solid waste by 30%, and increases the dissolvednitrogen release by approximately 12%.
Changing the assumed composition of the fish to 3% nitrogen decreased thenitrogen retained by the fish by 12% and increased the dissolved nitrogen loss by11%.
The model was then applied to real records from a group of salmon farms operatedby a major company in the Scottish industry. Calculations were made for S1 smoltsand also for PP1 smolts, ie smolts put to sea during the autumn. The results of the
28
calculations are summarised in Table 1. The efficiencies of feed utilisation and thewaste production are rather similar for salmon production based upon S1 and PP1smolts. In both cases, the proportion of feed nitrogen excreted as dissolved waste isgreater than that in the initial simulation. This arises from a range of factors,including the relatively poor FCR values experienced in small fish which arecontemporaneous with the use of high protein feeds, and the slightly higher rate oflosses as mortalities recorded in the real farm data.
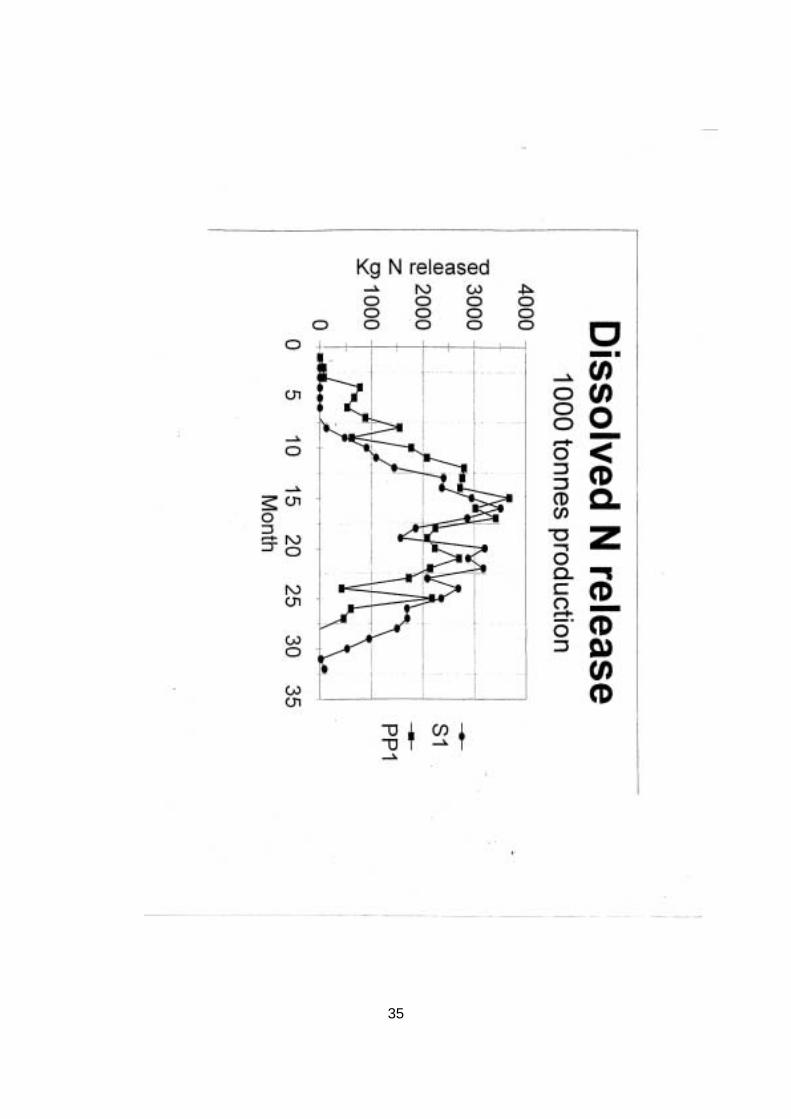
The general temporal patterns of release of dissolved nitrogen by S1 and PP1smolts are rather similar (Fig. 4). Both increase as the rate of feeding increasesduring the first year at sea. Maximum feed utilisation and dissolved nitrogenexcretion occur after the first summer at sea, with a second maximum during thefollowing spring. The second maximum is less marked for the PP1 generation, as bythat time the harvest of the PP1 fish is more advanced than that of the S1 fish, andtherefore less feed is required. The main differences between the temporal patternsis the greater excretion by the PP1 fish during their first winter and spring at sea, iebefore the S1 smolts have gone to sea and during their immediate post-smolt period.Conversely, there is greater excretion by S1 fish in the latter third of their productioncycle, mainly due to the earlier harvest of the PP1 fish.
DISCUSSION
The mass balance approach adopted in this model has been shown to provide arobust estimate of the waste production from modern salmon farms in Scotland usinghigh energy feed. The precise values obtained from the model differ between thesimulation and the calculations based upon real averaged farm data. Clearly thevalues obtained are to a degree dependent upon details of the feeding regime,stocking and harvesting patterns. However, taken over a full growing cycle, therelease of dissolved nitrogen is very likely to be in the range of 35-45 kg/tonne ofproduction, ie much less than the GESAMP (1996) estimates.
Looking to the future, improvements in husbandry and feed technology are likely toreduce the rate of waste production further. The current main areas of improvementare:
a) There may be some room for improvement in the current digestibility values offeed of around 90%, although the inevitable inclusion to a few percent of ashin the feed will provide a limit to the possible maximum digestibility, unlesseconomic methods are found to reduce the ash content.
b) The wider introduction of automatic feeders responsive to the demands of thefish provide several benefits. For example, the fish will not be fed beyondsatiation, and therefore the amount of uneaten feed pellets may be decreasedbelow the 5% assumed in the above calculations. This will reduce the amountof particulate waste, reduce the environmental impact on the sea bed belowthe farms and make a higher proportion of the feed available for assimilationby the fish.
29
Also, they will encourage optimum feeding rates throughout the growing cycle.Traditional feeding regimes for S1 smolts greatly reduce the rate of feedingduring the second winter at sea. There is increasing evidence that feedingrates can be held at higher values at this time, resulting in continuing rapidgrowth and improved FCR values.
c) The almost universal use of vaccination for disease control, and the increasedavailability of a range of sealice treatment chemicals together with strategicapproaches to sea lice control, should improve the overall health andperformance of the salmon stocks.
As a result of these and other developments, it has been the experience in theScottish industry that FCR values have improved by approximately 0.05 per growingcycle. It is anticipated that this pattern will continue. If the FCR can be reduced to1.0, feed wastage to 1%, and indigestibility to 5%, the release rate of dissolvednitrogen would be approximately 33 kg/tonne of production. This may be close tothe limit achievable using the methods currently in use in Scotland, and furthermarked reductions in dissolved nitrogen release may require more innovativeapproaches.
It is beyond the scope of this paper to discuss in any detail the fate of the nitrogenreleased from the farmed salmon. The models do not attempt to partition dissolvednitrogen between ammonia, urea and other soluble compounds. The nature of thispartitioning will influence the subsequent utilisation of the nitrogen by the algal (microand macro) and microbial communities.
CONCLUSION
Simple mass balance models can be used to estimate the rate of production ofdissolved and particulate waste by cultivated salmon. Calculations based on asingle simulated farm, and on data from a multi-site business in Scotland, indicatethat the estimates are robust to changes in input parameters within reasonableranges for the Scottish salmon industry. Comparison with established estimatesindicates that current feed technology and husbandry methods result in acomparatively low rate of nitrogen release to the surrounding environment. Themodels do not attempt to partition dissolved nitrogen between ammonia, urea andother soluble compounds. The nature of this partitioning will influence thesubsequent utilisation of the nitrogen by the algal (micro and macro) and microbialcommunities.
REFERENCES
Ackefors, H. and Enell, M. 1990. Discharge of nutrients from Swedish fish farmingto adjacent sea areas. Ambio, 19, 28-35.

30
GESAMP, 1996. Monitoring the ecological effects of coastal aquaculture wastes.Joint Group of Experts on the Scientific Aspects of Marine EnvironmentalProtection. No 57, FAO, Rome.
SEPA, 1998. Regulation and monitoring of marine cage fish farming in Scotland.Scottish Environment Protection Agency, Stirling, UK.
31
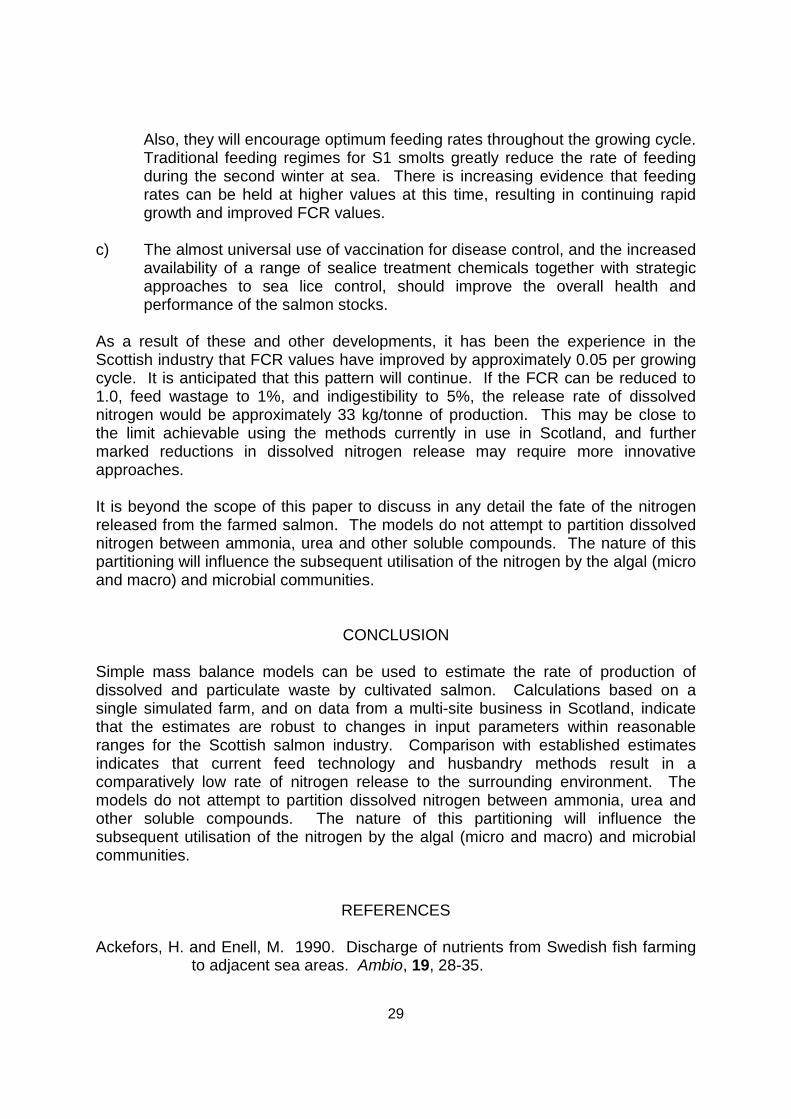
TABLE 1
Input parameters and calculated values of waste production during theon-growing of S1 and PP1 salmon smolts.
S1 smolts PP1 smolts
Period of transfer to sea March-May, year 2 Oct-Dec, year 1
Period of harvest Dec year 2 - Feb year4 Nov year 2 – Nov year 3
Overall FCR (starvedweight) 1.35 1.37
Overall FCR (“live” weight) 1.22 1.23% N lost as solid waste 15.0 15.0% N in fish growth 37.9 41.1% N as dissolved waste 47.1 43.9
Dissolved N lost 42.9 kg/tonneharvest* 44.3 kg/tonne harvest*
Particulate N lost 13.7 kg/tonneharvest* 14.0 kg/tonne harvest*
*Based on starved weight, reduce by 10% for ‘live’ weight
32
33
34
35
36
LIST OF FIGURES
Figure 1. Modelled monthly biomass of salmon on site at a farmproducing 1,000 tonnes per growing cycle.
Figure 2. Modelled monthly feed input to salmon at a farmproducing 1,000 tonnes per growing cycle.
Figure 3. Modelled monthly excretion of dissolved nitrogencompounds by salmon at a farm producing 1,000 tonnesper growing cycle
Figure 4. Modelled monthly excretion of dissolved nitrogencompounds by salmon at farms producing 1,000 tonnesper growing cycle, starting with S1 or PP1 smolts. Timeis expressed in four week periods, beginning period 1 inOctober, when the first PP1 smolts
37
APPENDIX 2
Waste production by farmed Atlantic halibut(Hippoglossus hippoglossus L.)
Ian M Davies1* and Richard J Slaski2
1FRS Marine Laboratory, PO Box 101, Victoria Road, Aberdeen, AB11 9DB2Richard J Slaski, British Halibut Association, 10 Main Road, Wybunbury,
Nantwich, Cheshire, CW5 7NA
Abstract
The assessment of the acceptable level of fish farmdevelopment in Scottish coastal areas is strongly dependent on thepredicted rate of release of nitrogenous nutrients and particulateorganic waste. A mass balance model of four week resolution hasbeen used to estimate the rate of production of dissolved andparticulate waste by cultivated halibut. The predicted release ofdissolved nitrogen is 48 kg N/tonne of fish produced and of particulateorganic waste is 150-200 kg/tonne production. Modelled biomass-specific rates varied within a range of a factor of about three during thegrowing cycle, averaging 8.3 mg dissolved N/kg biomass of fish/hr and28.8 mg/kg/hr of faeces. There is experimental evidence to indicatepotential for future developments to lead to significant improvements infeed utilisation by halibut in cages, and an accompanying reduction inwaste output. Comparison with experimental data indicate areaswhere discrepancies between model and measured values suggestthat further studies are required in order to more fully inform regulatoryprocesses. These areas include the partitioning of dissolved nitrogenbetween ammonia, urea and other soluble compounds, and the effectsof growth rate and feed utilisation efficiency on waste production.
*Corresponding author. Tel: +44 1224 876544; Fax: +44 1224 295511; E-mail: [email protected]
38
1. Introduction
Since its inception, the mainstay of the Scottish marine fishcultivation industry has been the Atlantic salmon, Salmo salar.Production in coastal waters now exceeds 100,000 tonnes per annum(FRS, 1998), and has made a very considerable impact on economicactivity in remote areas of mainland Scotland and the island groups.The gradual reduction in the price of salmon, limited availability ofsuitable new sites, and other factors, including regulatory matters, haveled the industry to seek opportunities for diversification.
More than 10 years ago, interest began to develop in thecultivation of the Atlantic halibut, Hippoglossus hippoglossus. Catchesof wild halibut have generally declined, and its high value, good marketdemand, and potential for rapid growth make it an attractive species formariculture (Forster, 1999).
Technical and commercial development has been fosteredthrough the British Halibut Association. Although difficulties are stillencountered at the first feeding stage of larvae and at metamorphosisfrom pelagic larvae to flattened benthic fry (Shields et al., 1999), it isanticipated that commercial production of around 100 tonnes perannum may be achieved by 2000, and 10,000 tonnes by 2010 (R.Slaski, pers com).
a) Production processUnlike salmon, halibut is a fully marine species. Hatcheries are
required to keep broodfish, and rear juveniles for up to 12 months fromeggs through yolk-sac larval, feeding larval, and fry stages to juvenilesof 100-200 g which are suitable for transfer to sea cages. The seacages currently used are converted salmon equipment, with theaddition of a taut tarpaulin covering all but the centre of the bottom ofthe cage. The cages are commonly only around 3 metres deep, andthe requirement for particularly sheltered waters to minimise movementof the cage bottom reduces the extent of competition with salmoncultivation for suitable sites. Halibut in sea cages are typically fed onpelleted diets which have been specially formulated for the species. Asthe industry expands and understanding of the nutritional requirementsof halibut continues to improve, it is likely that there will be furtherdevelopment in these formulations. The grow-out period is currentlyaround 30 months (3-4.5 kg fish), compared to 15-22 months forsalmon.
b) RegulationOne of the potential constraints on the development of halibut
cultivation in Scotland is the need to obtain leases for suitable sitesfrom the Crown Estate Commissioners and permission to dischargewastes (Discharge Consent under the Control of Pollution Act, 1974, as
39
amended by the Environment Act, 1995). Applications for Leases arenow processed through Local Planning Authorities who can takeaccount of a wide range of factors. However, the current PolicyGuidance Note issued by Government to assist Local Authorities in thistask identifies three categories of coastal area, in terms of their relativepotential for further fish farming development. The criteria used toestablish these categories include natural heritage conservationaspects, and also the current contributions of fish farming tonitrogenous nutrient levels in the water column, and to organicenrichment of the sea bed. Areas where fish farming is already fairlyintense in relation to the characteristics of the receiving environmentare unlikely to be appropriate for further development.
Similarly, the Scottish Environment Protection Agency (SEPA) inits considerations of applications for Discharge Consents, takesaccount of predicted impacts of fish farm developments on nutrientlevels and on the sea bed (SEPA, 1998). Measurement of nutrientlevels in sea water is normally part of the routine environmentalmonitoring required by SEPA, and the predicted scale of impact on thesea bed is the dominant factor used by SEPA to determine theappropriate tonnage of fish that may be held at each farm site. Wasteproduction rates are therefore central to estimation of theenvironmental carrying capacity for fish farming, and to thedevelopment and regulation of the mariculture sector.
The historical emphasis in Scotland on salmon cultivation hasmeant that assessments of applications for fish farms, for example inrelation to Environmental Quality Standards, are normally carried outusing waste discharge amounts and rates as would be predicted forsalmon cultivation units. However, the lower feeding rates (normally<1% body weight per day) used in halibut farming than in salmonfarming (1-2% body weight per day in smaller fish), and the longergrow-out periods, suggest that waste production rates may besignificantly different in halibut cultivation than in salmon cultivation.The purpose of this paper is to present model-based predictions ofnitrogenous waste production in halibut cultivation in cages, to makecomparisons with the limited published information, and to identifyareas where additional research is required.
c) Predicted waste productionA mass-balance model has been developed to predict the
production of dissolved and particulate waste in halibut farming. Inorder to undertake the modelling, values have to be selected for anumber of basic forcing parameters.
The basis of the model is that the dominant source of nitrogen tothe fish is through the diet, ie they receive a negligible proportion oftheir nutrition from natural sources in the surrounding environment ofthe farm. A typical halibut on-growing diet has 48% protein containing6.25% nitrogen.
40
A proportion of the feed will be lost from the system as uneatenfeed pellets. Current salmon farming practice limits this to no morethan 5% of the added feed. The presence of the tarpaulin at thebottom of halibut cages may retain excess pellets longer than opennetting, giving the fish more opportunity to ingest the pellets that wouldotherwise have fallen through the cage. In the absence of publisheddata, 5% loss as uneaten pellets has been assumed.
Of the feed which is ingested, a proportion will not be digestibleby the fish. The feed manufacturer (Trouw Aquaculture, pers. comm.)estimates that 15% may be undigested, and this will be excreted asfaecal material. Berge et al. (1999) measured digestibility coefficientsof 84-86% for nitrogen in two types of feed.
The nitrogen in the digested feed will be partitioned betweenincorporation into the tissues of the fish as they grow, and released tothe environment as dissolved substances (mainly ammonia anddissolved organic compounds). The estimated likely Feed ConversionRatio (FCR, weight of feed used divided by wet weight of fishproduced) over a full growth cycle is 1.3, and FCRs of 0.8-1.2 havebeen measured for halibut in commercial cage cultivation of100-1,000 g (D. Mitchell, pers comm.). Published data for feedefficiency ratios (wet weight of fish produced divided by the weight offeed used) for halibut of 5-500 g in tanks (Aksnes et al., 1996; Berge etal., 1999) range between 1.18 and 1.50 (equivalent to FCR of 0.67-0.85), depending on diet and other factors, but generally group around1.25-1.30. These data indicate that halibut have the potential, incommon with some other flatfish, such as turbot Scophthalmusmaximus (Nijhof, 1994) to convert feed with very high efficiency underoptimum conditions. These data are not inconsistent with data forturbot in commercial production (R. Slaski, unpub) which indicate FCRsof around 1.0 in juveniles and 1.6 in pre-harvest fish (although this willhave been influenced by early maturity in males), with a value over theproduction cycle of 1.3. It was decided to utilise a fixed value for theFCR of 1.3 (the effect of variations of this figure will be discussed later).The bulk composition of farmed fish (Ackefors and Enell, 1990) wastaken as 3% nitrogen (on a wet weight basis). Berge et al. (1999)report mean whole body protein values of 16.5% in halibut raised intanks, equivalent to 2.64% nitrogen.
The amount of nitrogen released as dissolved substances iscalculated as the difference between the amount input in the feed, andthe sum of the amounts in particulate waste (excess pellets plusundigested material) and fish growth.
2. Results
The farm simulated by the model produced 162 tonnes of fishfrom 202 tonnes of feed over a period of 31 months, with an FCR (fromthe transfer to cages to harvest) of 1.31. The maximum rate of feed
41
input was 18 tonnes per four week period (Fig. 1), and the peakbiomass on the farm was 129 tonnes of fish (Fig. 2). The feeding ratevaried seasonally from 0.8% of body weight per day in the firstsummer, to 0.3% in the second winter (Fig. 3).
The nitrogen input in the feed was calculated to be partitionedas 19.5% in particulate waste, 30% retained in fish growth, and 50.5%lost as dissolved waste. The predicted total amount of dissolvednitrogen released over the full grow-out cycle was 47.8 kgN/t fishproduced. The monthly amounts of solid and dissolved waste (Fig. 4)were directly proportional to the amount of feed used, because fixedvalues were selected for feed wastage, digestibility and FCR.
The sensitivity of the model to variations in the forcingparameters was explored. A decrease of 5% in either the proportion ofwaste feed pellets or indigestibility decreases the predicted amount ofsolid waste by 20%, and increases the dissolved nitrogen release by10%.
Changing the assumed composition of the fish to 2.64%nitrogen (cf Berge et al., 1999), decreased the nitrogen retained by thefish by 12% and increased the dissolved nitrogen loss by 3.5%.
Variation of the FCR between 1.1 and 1.5 changed the predictedproduction of fish from 188 to 140 tonnes. The predicted release ofdissolved N varied between 44% and 54% of the nitrogen added withfeed. The mass specific release increased from 36.2 kg N/t to 59.0 kg/tof fish produced.
3. Discussion
a) Dissolved waste productionSkelton (1998) undertook a two month nutrient study of halibut
of approximately 250 g initial weight. Fish were held in tanks and fedsemi-continuously for 18 hours per day by automatic feeders, whichdispensed rations of 0.5% and 3% body weight per day. Feedconsumption was very incomplete, and the overall FCR values (2.4 and6.1 respectively) were high. Consequently, particulate wastedominated the nutrient budgets. However, losses of dissolved nitrogenamounted to 20.5 and 16.0 kgN/t of fish production respectively, 43%and 33% of the rates predicted by the model described above.Similarly, the modelled ratio between dissolved waste nitrogen andnitrogen in fish is 1.66, while Skelton’s values are 0.68 and 0.53.
Other workers have generally achieved lower FCR values.Helland and Grisdale-Helland (1998) reported that the retention ofnitrogen by halibut in tanks was not affected by a variation of 9% indietary protein, averaging 41% of the ingested nitrogen. Berge et al.(1999) reported that halibut in tanks retained 43-47% of the ingestednitrogen and 51-56% of the digested nitrogen. The comparablemodelled values are 30% and 37% respectively. Recalculation of theirdata indicate losses of 36-39 kg N/t of fish production, which lie
42
between the values measured by Skelton (1998) and the modelledvalues.
In relation to the potential of dissolved nitrogenous wastes toincrease primary production, the proportion of available (inorganic)nitrogen in the effluent is important. Skelton found that ammonia madeup 29% and 22% of the dissolved nitrogen, while the rest was notpresent as nitrate or nitrite, and was probably in organic compounds(which may include urea). In comparison, Bergheim (1984) reportedthat one third of the dissolved nitrogen excreted by salmon was in theform of ammonia. Dosdat et al. (1996) found that 4-6% of the ingestedN was excreted as urea by five teleost species. Turbot excreted 20%of the ingested N as ammonia, while the other species excreted 30-38% as ammonia. There is therefore considerable uncertainty in thelikely partitioning of excreted dissolved nitrogen between ammonia,urea and other organic compounds, and hence in the availability of thisnitrogen to primary producers. The ability of the environment toassimilate (through various processes, including dilution andremineralisation) of nitrogenous waste is dependent on the rate ofsupply of these materials. The model predicts that dissolved nitrogenrelease rates of between 4 and 14 mg N/kg biomass of fish/hr,depending upon season (feeding rate), with a mean value of 8.3mgN/kg/hr (Fig. 5). This is broadly consistent with mean values of 5.4and 7.5 mgN/kg/hr (fed fish) calculated from Berge et al. (1999) andwith mean rates of output of ammoniacal nitrogen of 2.3 and 5.1mgN/kg/hr for starved and fed halibut respectively (Davenport et al.,1990). Similar values have been reported for other flatfish includinglemon sole, Microstomus kitt (Davenport et al., 1990) and commondab, Limanda limanda (Sayer and Davenport, 1987). Dosdat et al.(1996) reported values for five species of fish ranging from 10-19mgN/kg/hr in fish feeding at 1.5% body weight per day, and 3.1-6.3mgN/kg/hr at 0.5% body weight per day. Turbot excreted significantlyless ammonia than the other species studied. The average ratesmeasured by Skelton (1998) of 0.5 and 0.7 mg/kg/hr of ammoniacalnitrogen and 1.8-3.4 mg/kg/hr of total dissolved nitrogen are lower thanthe modelled rates, and towards the lower end of the general rangesreported from other experimental studies.
There are therefore differences between the measured andmodelled rates of dissolved nitrogen release by farmed halibut. Themeasured values, mostly from experimental systems in which fish aregrowing rapidly and with high feed efficiency, are generally lower thanthe modelled rates (47 kg N/t fish produced, 4-12 mg N/kg/hr), butmainly within a factor of two of these values. Approximately one thirdof this loss is probably in inorganic form (ammonia), with the restincorporated in dissolved organic compounds. The modelled valuesmay therefore represent possible maximum values.
43
b) Solid waste productionThe proportion of indigestable material in the feed is a forcing
parameter of the model, and was set at 15%, in accordance with thefeed manufacturer’s estimate. From this, the discharge of faecalmatter can be estimated from the amount of feed supplied less thewastage of uneaten pellets. This is equivalent to 0.18 tonnes oforganic matter per tonne of fish production. The mean rate ofproduction of faeces was 28.8 mg/kg/hr, and ranged seasonallybetween 15.9 and 46.7 mg/kg/hr (Fig. 6). The inclusion of excess feedpellets at a wastage rate of 5% increases the modelled values for solidwaste production by 35%.
There are few published data on the production of faeces byhalibut. Grisdale-Helland and Helland (1998) reported digestibilitycoefficients for protein of 82-86% and of organic matter of 76-86%.Their fish excreted 0.12-0.21 tonnes of organic matter per tonne weightgain of fish (which encompasses the modelled value) and they notedthat the use of feeds containing higher concentrations of carbohydrate(e.g. 16-17% starch) resulted in greater production of faecal organicmatter.
There is therefore general agreement between experimental andmodel studies indicating that current feeds contain about 85% of matterdigestible by halibut, and that faecal waste organic matter will beexcreted at a rate of 0.15-0.20 tonnes per tonne of fish production.The excretion rate will vary markedly between about 15 and 50 mg/kgof fish biomass per hour (mean 30 mg/kg/hr) according to the feedingrate. The very low feed conversion ratios that have been achieved byhalibut (and some other flatfish species) under optimised conditions intank culture suggest that there may be considerable scope forimprovement in the performance of halibut in cages beyond that whichis currently expected to be achieved in Scotland. Such improvementswould be accompanied by reductions in the amount of waste produced,and therefore the rates calculated in this report may approach themaximum rates likely to occur in commercial production.
44
Conclusion
Data are now available to allow simple mass balance models tobe used to estimate the rate of production of dissolved and particulatewaste by cultivated halibut. Comparison with experimental dataindicate the main areas where discrepancies between model andmeasured values indicate further studies are required in order to morefully inform regulatory processes. These include the partitioning ofdissolved nitrogen between ammonia, urea and other solublecompounds, and the effects of growth rate and feed utilisationefficiency on waste production.
References
Ackefors, H., Enell, M., 1990. Discharge of nutrients from Swedish fishfarming to adjacent sea areas. Ambio 19, 28-35.
Aksnes, A., Hjertnes, T., Opstvedt, J., 1996. Effect of dietary proteinlevel on growth and carcass composition in Atlantic halibut(Hippoglossus hippoglossus L.). Aquaculture 145, 225-253.
Berge, G.M., Grisdale-Helland, B., Helland, S.J., 1999. Soy proteinconcentrate in diets for Atlantic halibut (Hippoglossushippoglossus). Aquaculture 178, 139-148.
Bergheim, A., Hustneit, H., Kittelsen, A., Selmer-Olsen, A.E., 1984.Estimated pollution loadings from Norwegian fish farms. II.Investigations 1980-1981. Aquaculture 36, 158-168.
Davenport, J., Kjorsvik, E., Haug, T., 1990. Appetite, gut transit,oxygen uptake and nitrogen excretion in captive Atlantic halibut,Hippoglossus hippoglossus L., and lemon sole, Microstomus kitt(Walbaum). Aquaculture 90, 267-277.
Dosdat, A., Servais, F., Metailler, R., Huelvan C., Desbruyeres, E.,1996. Comparison of nitrogenous losses in five teleost fishspecies. Aquaculture 141, 107-127.
Forster, J., 1999. Halibut Farming – Its development and likely impacton the market for wild Alaska halibut. State of Alaska, Divisionof Trade and Development, Alaska Department of Commerceand Economic Development, February 1999.
FRS, 1998. Scottish fish farms, annual production survey, 1997.Fisheries Research Services Marine Laboratory, Aberdeen, 36pp.
45
Grisdale-Helland, B., Helland, S.J., 1998. Macronutrient utilisation byAtlantic halibut (Hippoglossus hippoglossus): diet digestibilityand growth of 1 kg fish. Aquaculture 166, 57-65.
Helland, S.J., Grisdale-Helland, B., 1998. Growth, feed utilisation andbody composition of juvenile Atlantic halibut (Hippoglossushippoglossus) fed diets differing in the ratio between themacronutrients. Aquaculture 166, 49-56.
Nijhof, J., 1994. Research on nutrition and growth in the culture of postlarval turbot (Scophthalmus maximus L.). In: Lavens, P.,Remmerswaal, R.A.M. (Eds), Turbot culture: Problems andprospects. European Aquaculture Society, Special PublicationNo 22, Gent, Belgium.
Sayer, M.D.J., Davenport, J., 1987. The relative importance of the gillsto ammonia and urea excretion in five seawater and onefreshwater teleost species. J. Fish Biol. 31, 561 - 570.
SEPA, 1998. Regulation and monitoring of marine cage fish farming inScotland. Scottish Environment Protection Agency, Stirling, UK.
Shields, R.J., Gara, B., Gillespie, M.J.S., 1999. A UK perspective onintensive hatchery rearing methods for Atlantic Halibut(Hippoglossus hippoglosus L.). Aquaculture 176 (1-2), 15-25.
Skelton, L., 1998. Nitrogen and phosphorus budgets for Atlantichalibut (Hippoglossus hippoglossus) fed with low or high feedrations. MSc thesis, unpub. Napier University, Edinburgh, 90pp.
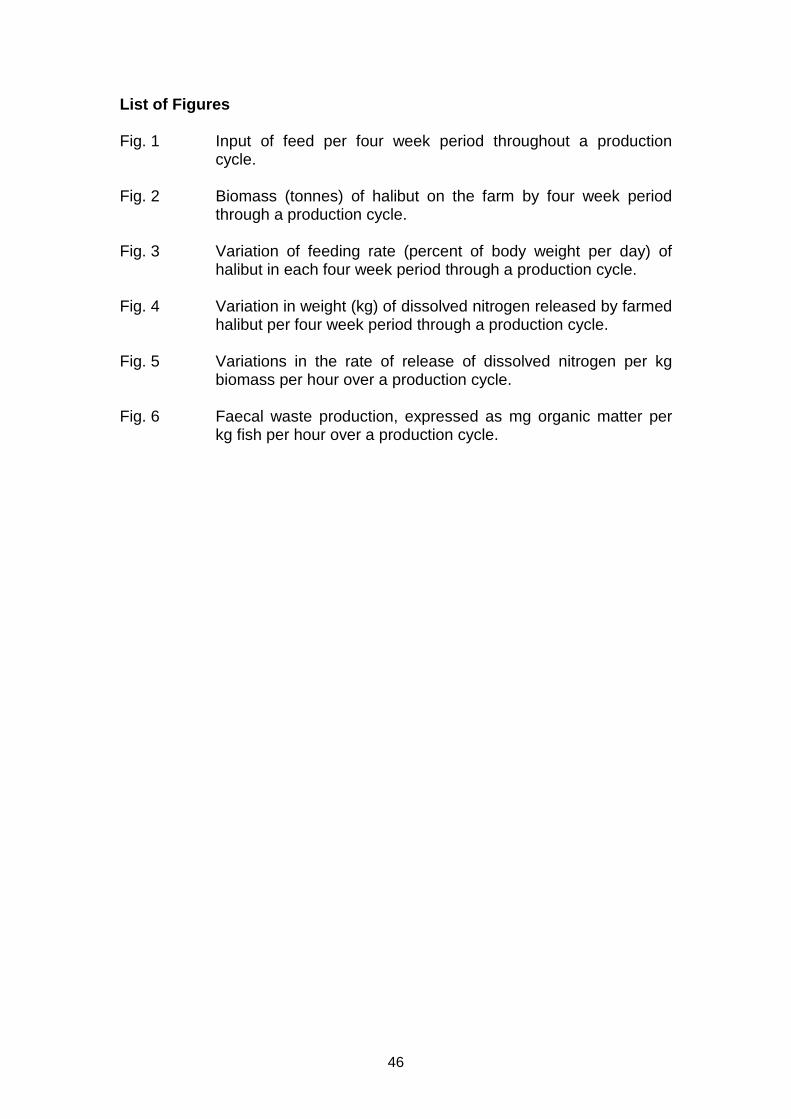
46
List of Figures
Fig. 1 Input of feed per four week period throughout a productioncycle.
Fig. 2 Biomass (tonnes) of halibut on the farm by four week periodthrough a production cycle.
Fig. 3 Variation of feeding rate (percent of body weight per day) ofhalibut in each four week period through a production cycle.
Fig. 4 Variation in weight (kg) of dissolved nitrogen released by farmedhalibut per four week period through a production cycle.
Fig. 5 Variations in the rate of release of dissolved nitrogen per kgbiomass per hour over a production cycle.
Fig. 6 Faecal waste production, expressed as mg organic matter perkg fish per hour over a production cycle.
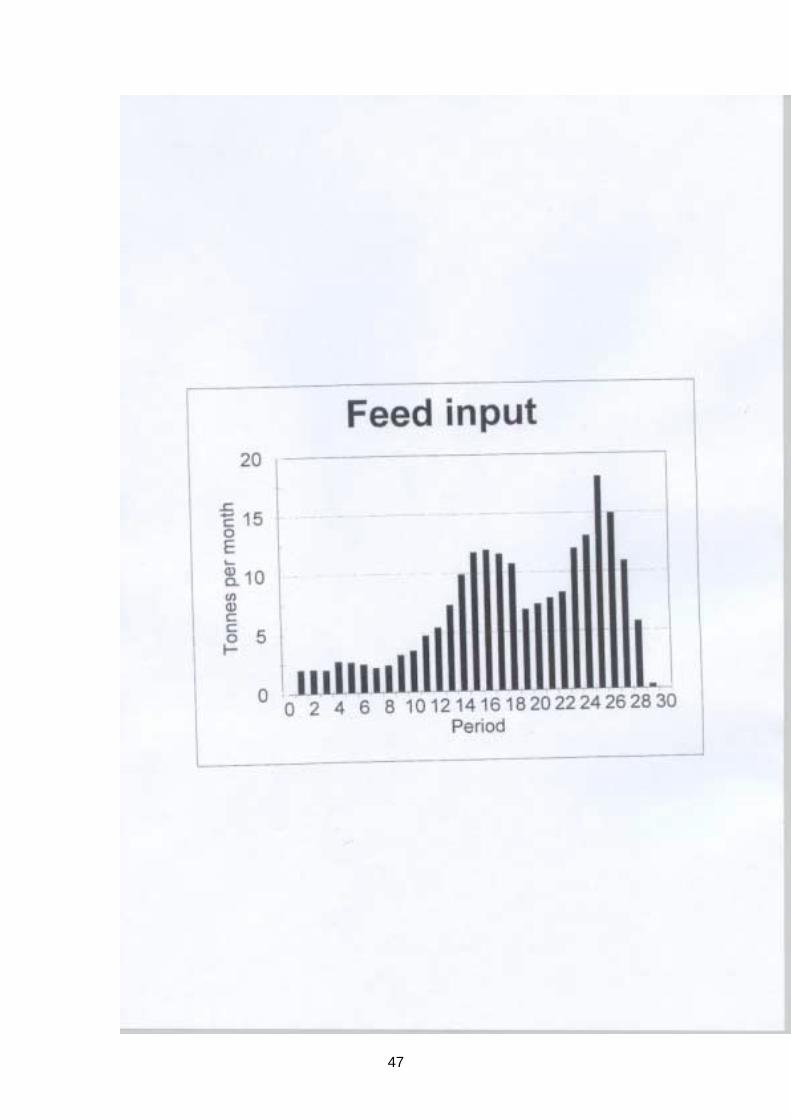
47
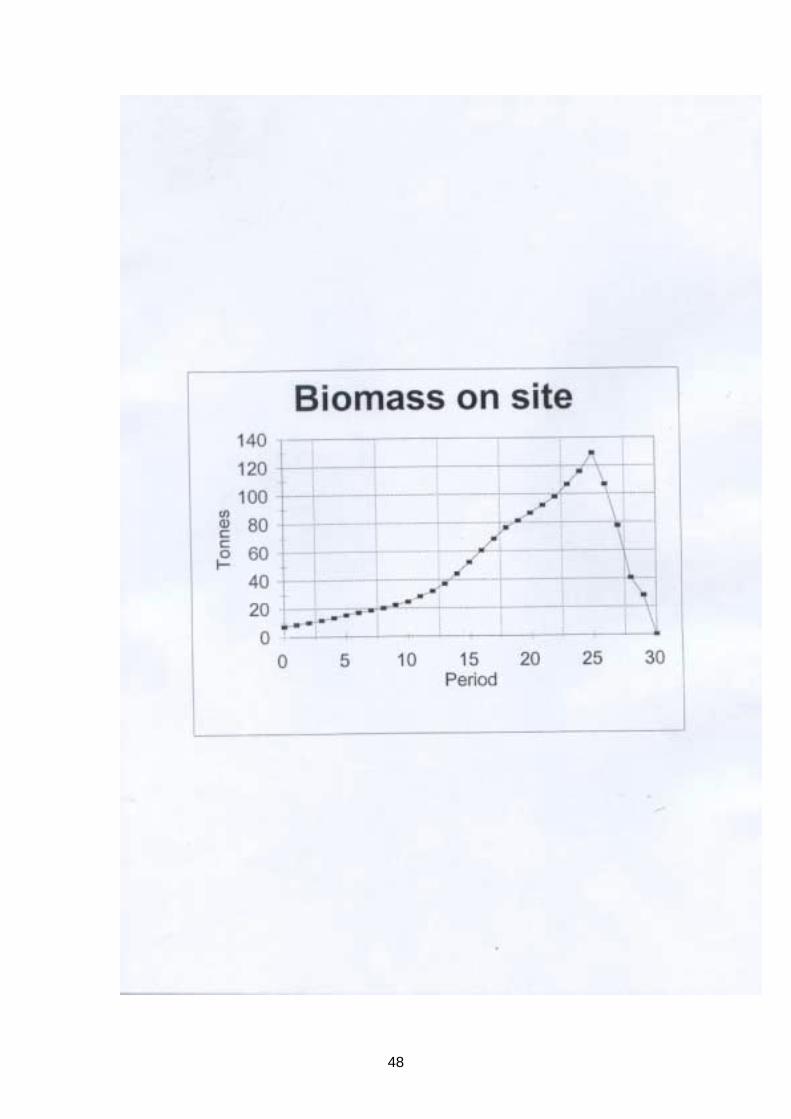
48
49
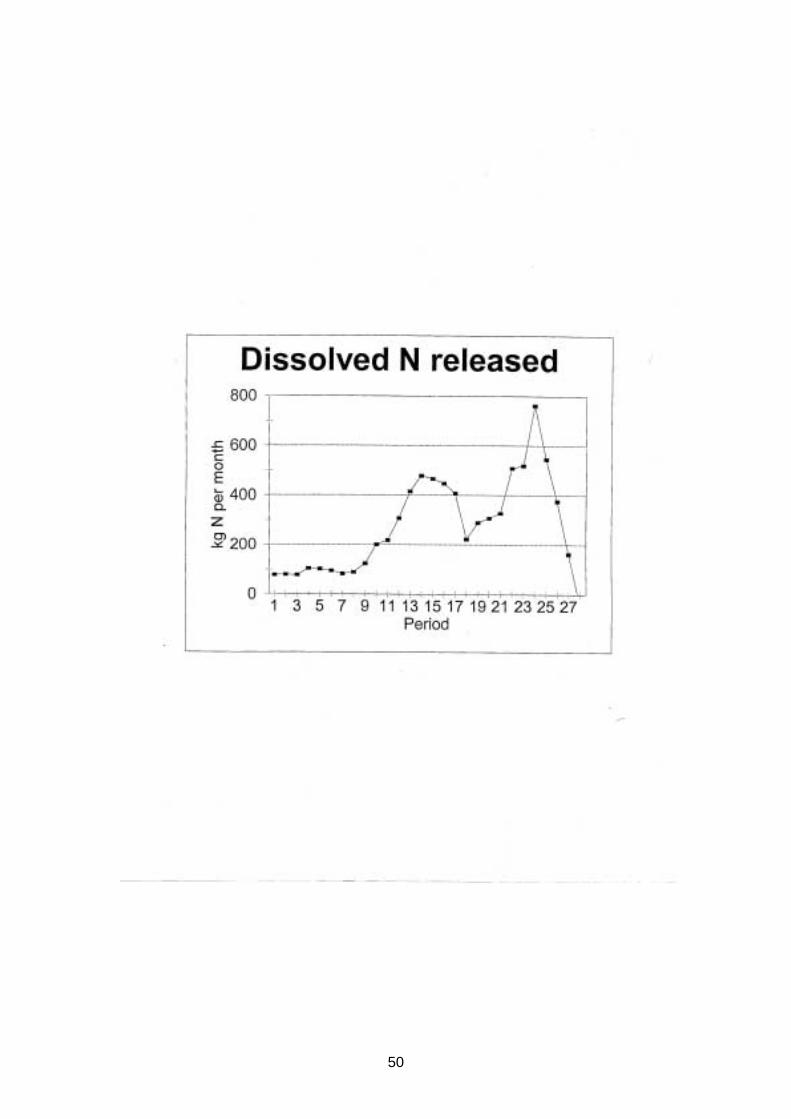
50
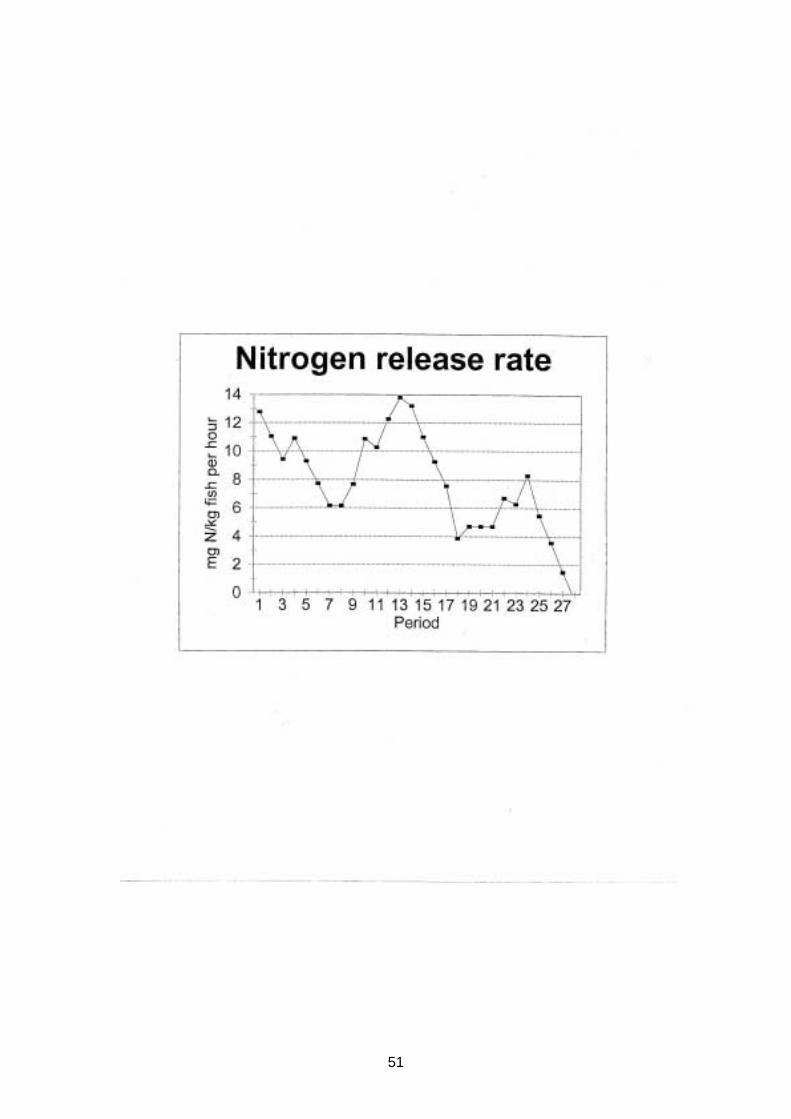
51
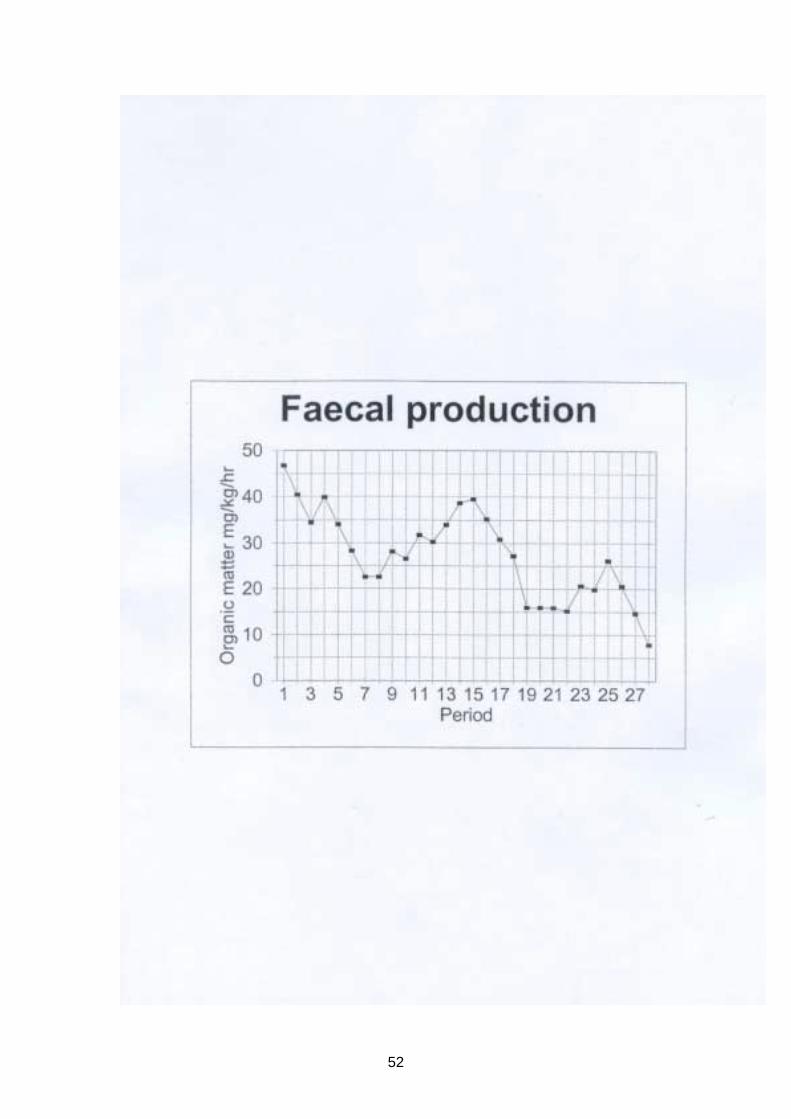
52