locked-in during lock-down:undergraduate life on the
TRANSCRIPT

Locked-In during Lock-Down:Undergraduate Life on the Internet in a PandemicAlisha UkaniUC San Diego
San Diego, California, [email protected]
Ariana MirianUC San Diego
San Diego, California, [email protected]
Alex C. SnoerenUC San Diego
San Diego, California, [email protected]
ABSTRACTGovernments around the world enacted stay-at-home orders inresponse to the COVID-19 pandemic, which changed many aspectsof life, including how people interacted with the Internet. Thesedraconian restrictions on in-person social interactions were perhapsmost acutely felt by people living alone. We study the changes innetwork traffic of one such population, students remaining in the(single-occupancy) on-campus dormitories at a large residentialeducational institution during the onset and initial few months ofthe lock-down. Specifically, we analyze how students shifted theironline work and leisure behaviors at an application level. Further,we segment the population into domestic and international students,and find that even within these two broad sub-populations, thereare significant differences in Internet-based behavior. Our workprovides a focused lens on pandemic Internet usage, examiningboth 1) a concentrated user population and 2) the differing impactsof a global pandemic on disparate sub-populations.
CCS CONCEPTS• Networks→ Network measurement; Public Internet; • In-formation systems→Web applications.ACM Reference Format:Alisha Ukani, Ariana Mirian, and Alex C. Snoeren. 2021. Locked-In duringLock-Down: Undergraduate Life on the Internet in a Pandemic. In ACMInternet Measurement Conference (IMC ’21), November 2–4, 2021, VirtualEvent, USA. ACM, New York, NY, USA, 7 pages. https://doi.org/10.1145/3487552.3487828
1 INTRODUCTIONThe COVID-19 pandemic disrupted many aspects of life acrossthe globe, but perhaps the most significant impact was felt bythose under government-mandated stay-at-home orders. Whileenforcement varied widely across jurisdictions, many impactedpopulations were forced to spend almost all of their time in theirresidence, with little-to-no in-person social interactions. Whilesuch circumstances have occurred in the past, rarely have theyapplied to such privileged populations, with so little notice, andfor such extended periods of time. Moreover, for those individualsliving alone in Internet-connected homes, the pandemic presents aPermission to make digital or hard copies of part or all of this work for personal orclassroom use is granted without fee provided that copies are not made or distributedfor profit or commercial advantage and that copies bear this notice and the full citationon the first page. Copyrights for third-party components of this work must be honored.For all other uses, contact the owner/author(s).IMC ’21, November 2–4, 2021, Virtual Event, USA© 2021 Copyright held by the owner/author(s).ACM ISBN 978-1-4503-9129-0/21/11.https://doi.org/10.1145/3487552.3487828
unique opportunity to study the (changing) role that the Internet—and various application classes in particular—plays when it providesthe main form of outside interaction in their lives.
We present the first measurement study of a pandemic-inducednatural experiment: “How does university students’ Internet usagechangewhen they are forced to remain in their individual residenceswith almost no in-person contact?” In particular, we report on thenetwork usage of several thousand mostly undergraduate studentsat UC San Diego, a major residential research university over afour-month period before, during, and after the onset of COVID-19.These students were in a very real sense “trapped” in their dormroom for the duration of the academic term and ostensibly hadnowhere to go, as the university asked all residents to return homeshortly after the World Health Organization (WHO) declared apandemic (and international air travel ground to a halt), but beforethe issuance of a region-wide stay-at-home-order.
The Internet was likely the dominant—if not exclusive—meansof interaction for the vast majority of these students. While cam-pus policies regarding student movement varied during the fourmonths of our study, congregating in groups larger than three wasforbidden once the lock-down began, as were on-campus visitors.Though the university provides cable TV service, and many if notall students have cell phones (there are no land-line phones inthe dormitories), TV is a one-way medium, and most modern cellphones preferentially operate on WiFi when available. We assumethat students’ phone-based Internet activity is captured by our net-work tap, although we cannot exclude that some students may haveused their own, self-paid cellular data plans (or other, more fringetechnologies) for portions of their connectivity.
Within this captive audience, we analyze Internet usage both inaggregate and across application classes. In particular, we are ableto understand how work and leisure changed for many of thesestudents at an application level, and provide a finer granularity ofanalysis than previous work. Classes at the university transitionedto an online modality shortly after the beginning of the pandemic,so the students’ in-class engagement is well captured by their useof UC San Diego’s favored tool, Zoom. Recreationally, we are ableto segregate traffic by device type, and identify a large numberof IoT devices and game consoles. Moreover, by geolocating thesites they visit, we are able to segregate the student population into(presumed) domestic and international students, and report upondifferences in their behaviors.
Overall, we find several distinct trends. While aggregate networktraffic initially spikes in April near the beginning of the pandemic,it returns to near pre-pandemic levels by May, although not for allapplications. Moreover, we find that international students spendless time on US-based social media applications than their domestic

IMC ’21, November 2–4, 2021, Virtual Event, USA Ukani, Mirian, and Snoeren
counterparts, but spend more time on Steam, which highlightsthe importance of separating sub-populations within analyses. Insum, our study adds a unique additional perspective to the growingcorpus of COVID-19 Internet measurements.
2 RELATEDWORKA great deal has been published about Internet traffic during theCOVID-19 pandemic, but generally from the perspective of largenetwork or service operators. Their network-wide, or, conversely,service-only vantage points prevent them from painting a coherentpicture regarding the network activities of any particular user group.Perhaps the most comprehensive published report uses ISP and IXPdata to study how the volume of different traffic classes changedthroughout the pandemic [7]. Some of their overall findings—suchas the convergence of diurnal patterns to that of pre-pandemicweekends—are not apparent in our population, while others—likethe increase in gaming and video conferencing—are clearly visible.We frequently present our results in a similar style, and, whererelevant and possible, report over the same time periods (e.g., wereport traffic volume for the same four weeks, substituting the weekof May 14, 2020 for June 18, 2020 to stay within our academic term).
Others have also reported on network traffic at educational in-stitutions, notably Favale et al. [6], who focus on the prevalence ofremote-work tools such as VPNs, Microsoft Teams, and their uni-versity’s custom teaching software. However, their study reportson the traffic of the entire university population across multiplecampuses, not just residents; staff and faculty presumably were notliving in their offices during the pandemic. While we find a similardramatic uptick in educational technology tools, we are able toreport on the recreational aspect of students’ activities as well.
Network and service operators have published both the impactsof the pandemic on their services and their reactions to them [3,10, 12]. Indeed, most reports—both in the peer-reviewed literatureand the blogosphere—suggest the network itself held up well underthe changing demand. For example, a study of Italian networkoperators [4] found that they were proactive in expanding networkcapacity, primarily through an increase in hardware resources, inorder to match increased demand. A study examining the responseof ISP providers in the United States affirms this increase in traffic,but notes that network utilization returns to pre-pandemic levels inpart due to ISP capacity augmentation [11]. While we similarly finda marked increased in per-capita demand among students after thecampus shutdown, the sharp decline in residential user populationled to a decrease in overall network traffic.
The use of social media during COVID-19 has also been studiedin an analysis of YouTube video sharing on Twitter [13]. This anal-ysis finds a high negative correlation between media sharing andmobility; we similarly find that our “trapped” users greatly increasetheir social media and overall Internet usage.
3 DATA SOURCESOur study focuses on the devices used by the residential campuspopulation (primarily undergraduates) at UC San Diego betweenFebruary 1, 2020 to May 31, 2020. A range of circumstances, notablythe quick onset of pandemic travel restrictions and lock-downs, leftmany undergraduates trapped on campus where they were required
to isolate in their on-campus residences. This situation provides aunique context for analyzing Internet-traffic usage which we wereable to investigate using a passive monitoring infrastructure alreadyin place at UC San Diego [5].
There are three primary components that serve as inputs for ourdata set: 1) raw bidirectional network traffic from the campus net-work, 2) DHCP logs, and 3) DNS resolutions. The raw network trafficis mirrored from a switch connecting the on-campus residences tothe campus backbone, but specifically excludes traffic from certainnetworks due to high traffic volumes; excluded networks includeparts of UC San Diego, Google Cloud, Amazon, Microsoft Azure,Riot Games, Twitch, Qualys, and Apple.
The system uses Zeek [17] to extract flows from the set of con-nections between each device and remote server. Devices in thenetwork are assigned dynamic, temporary IP addresses by DHCP,which we normalize using contemporaneous DHCP logs to convertthese dynamic IP address to per-device MAC addresses. To protectuser privacy, the IP and MAC addresses for the devices we study areanonymized, and the raw data is discarded after being processed.As well, to avoid analyzing traffic from campus visitors we discardinformation for devices that appear on the network for fewer than14 days. In addition, we use contemporaneous DNS logs to convertremote IP addresses (i.e., the servers communicating with the de-vices we study) to domain names (hence, allowing us to distinguishbetween different services in use). Finally, we classify individualon-campus MAC devices as being desktop, mobile or IoT devicesusing multiple heuristics, including analysis of User-Agent stringsand organizationally unique identifiers (OUIs) extracted from trafficdata. For IoT devices specifically, we employ the methods devisedby Saidi et al. with a threshold of 0.5 [15]. Such heuristics are in-herently imperfect, so to estimate the error in our approach wemanually reviewed 100 random devices in our dataset and verifiedthat 84 were correctly classified.1 Further details about this col-lection pipeline, including the device classification approach, areprovided by Dekoven et al. [5]. Our data collection and privacycontrols have been reviewed and approved by a range of campusoversight entities including UC San Diego’s institutional reviewboard (IRB), our campus-wide cybersecurity governance committee,and our campus network operations and cybersecurity groups. Inparticular, because we do not collect identifiable information aboutindividual users and report results in aggregate, our study has beendeclared exempt by our IRB.
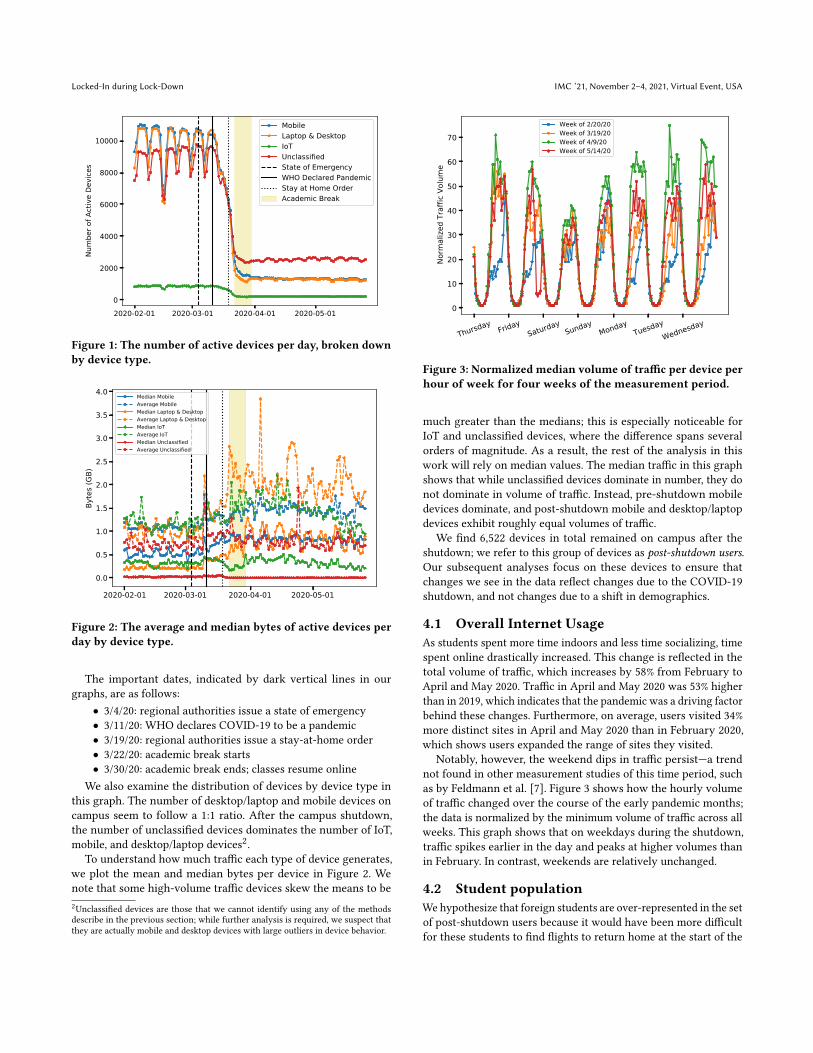
4 AGGREGATE ANALYSISFirst, we analyze population-level changes and explain how thataffects our subsequent analysis. Many students left campus duringMarch 2020, as seen in Figure 1. This graph plots the number ofdevices active for each day; devices are more likely to have networkactivity on weekdays than weekends, creating regular dips andspikes. However, this graph shows that students started leavingcampus even before classes became fully remote. Before the shut-down, there was a peak of 32,019 active devices; this dipped to alow of 4,973 active devices during the shutdown.1Only two devices in this sample were affirmatively misclassified (e.g. labeling a deviceas laptop when it was actually a desktop) and the dominant source of error (14 devices)was omission (i.e., devices conservatively classified as”unknown”).
Locked-In during Lock-Down IMC ’21, November 2–4, 2021, Virtual Event, USA
2020-02-01 2020-03-01 2020-04-01 2020-05-010
2000
4000
6000
8000
10000
Num
ber o
f Act
ive
Devi
ces
MobileLaptop & DesktopIoTUnclassifiedState of EmergencyWHO Declared PandemicStay at Home OrderAcademic Break
Figure 1: The number of active devices per day, broken downby device type.
2020-02-01 2020-03-01 2020-04-01 2020-05-01
0.0
0.5
1.0
1.5
2.0
2.5
3.0
3.5
4.0
Byte
s (GB
)
Median MobileAverage MobileMedian Laptop & DesktopAverage Laptop & DesktopMedian IoTAverage IoTMedian UnclassifiedAverage Unclassified
Figure 2: The average and median bytes of active devices perday by device type.
The important dates, indicated by dark vertical lines in ourgraphs, are as follows:
• 3/4/20: regional authorities issue a state of emergency• 3/11/20: WHO declares COVID-19 to be a pandemic• 3/19/20: regional authorities issue a stay-at-home order• 3/22/20: academic break starts• 3/30/20: academic break ends; classes resume online
We also examine the distribution of devices by device type inthis graph. The number of desktop/laptop and mobile devices oncampus seem to follow a 1:1 ratio. After the campus shutdown,the number of unclassified devices dominates the number of IoT,mobile, and desktop/laptop devices2.
To understand how much traffic each type of device generates,we plot the mean and median bytes per device in Figure 2. Wenote that some high-volume traffic devices skew the means to be2Unclassified devices are those that we cannot identify using any of the methodsdescribe in the previous section; while further analysis is required, we suspect thatthey are actually mobile and desktop devices with large outliers in device behavior.
Thursday FridaySaturday
SundayMonday
TuesdayWednesday
0
10
20
30
40
50
60
70
Norm
alize
d Tr
affic
Vol
ume
Week of 2/20/20Week of 3/19/20Week of 4/9/20Week of 5/14/20
Figure 3: Normalized median volume of traffic per device perhour of week for four weeks of the measurement period.
much greater than the medians; this is especially noticeable forIoT and unclassified devices, where the difference spans severalorders of magnitude. As a result, the rest of the analysis in thiswork will rely on median values. The median traffic in this graphshows that while unclassified devices dominate in number, they donot dominate in volume of traffic. Instead, pre-shutdown mobiledevices dominate, and post-shutdown mobile and desktop/laptopdevices exhibit roughly equal volumes of traffic.
We find 6,522 devices in total remained on campus after theshutdown; we refer to this group of devices as post-shutdown users.Our subsequent analyses focus on these devices to ensure thatchanges we see in the data reflect changes due to the COVID-19shutdown, and not changes due to a shift in demographics.
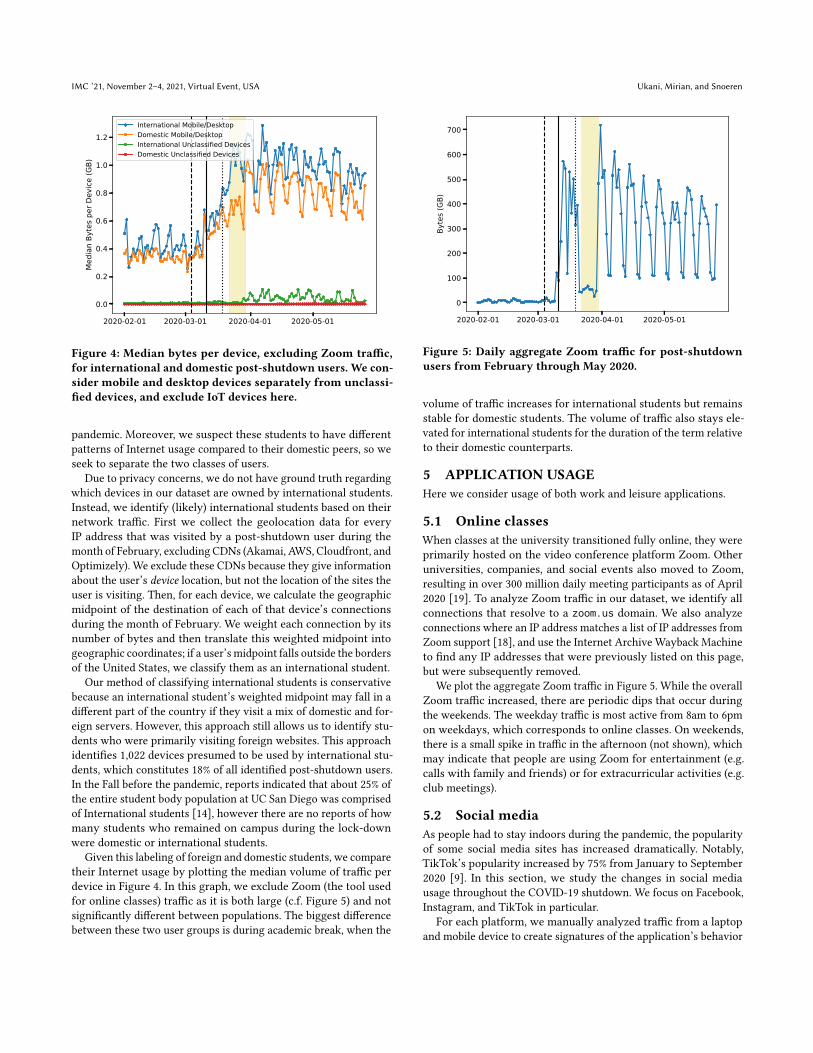
4.1 Overall Internet UsageAs students spent more time indoors and less time socializing, timespent online drastically increased. This change is reflected in thetotal volume of traffic, which increases by 58% from February toApril and May 2020. Traffic in April and May 2020 was 53% higherthan in 2019, which indicates that the pandemic was a driving factorbehind these changes. Furthermore, on average, users visited 34%more distinct sites in April and May 2020 than in February 2020,which shows users expanded the range of sites they visited.
Notably, however, the weekend dips in traffic persist—a trendnot found in other measurement studies of this time period, suchas by Feldmann et al. [7]. Figure 3 shows how the hourly volumeof traffic changed over the course of the early pandemic months;the data is normalized by the minimum volume of traffic across allweeks. This graph shows that on weekdays during the shutdown,traffic spikes earlier in the day and peaks at higher volumes thanin February. In contrast, weekends are relatively unchanged.
4.2 Student populationWe hypothesize that foreign students are over-represented in the setof post-shutdown users because it would have been more difficultfor these students to find flights to return home at the start of the
IMC ’21, November 2–4, 2021, Virtual Event, USA Ukani, Mirian, and Snoeren
2020-02-01 2020-03-01 2020-04-01 2020-05-01
0.0
0.2
0.4
0.6
0.8
1.0
1.2
Med
ian
Byte
s per
Dev
ice (G
B)
International Mobile/DesktopDomestic Mobile/DesktopInternational Unclassified DevicesDomestic Unclassified Devices
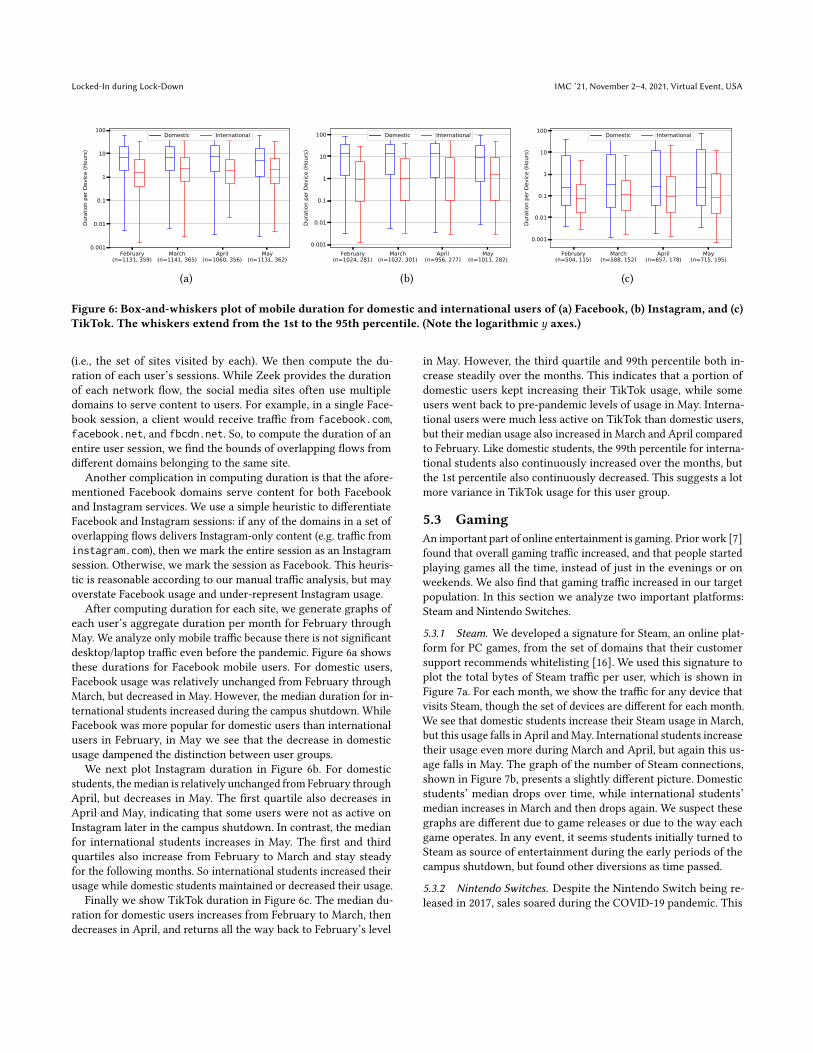
Figure 4: Median bytes per device, excluding Zoom traffic,for international and domestic post-shutdown users. We con-sider mobile and desktop devices separately from unclassi-fied devices, and exclude IoT devices here.
pandemic. Moreover, we suspect these students to have differentpatterns of Internet usage compared to their domestic peers, so weseek to separate the two classes of users.
Due to privacy concerns, we do not have ground truth regardingwhich devices in our dataset are owned by international students.Instead, we identify (likely) international students based on theirnetwork traffic. First we collect the geolocation data for everyIP address that was visited by a post-shutdown user during themonth of February, excluding CDNs (Akamai, AWS, Cloudfront, andOptimizely). We exclude these CDNs because they give informationabout the user’s device location, but not the location of the sites theuser is visiting. Then, for each device, we calculate the geographicmidpoint of the destination of each of that device’s connectionsduring the month of February. We weight each connection by itsnumber of bytes and then translate this weighted midpoint intogeographic coordinates; if a user’s midpoint falls outside the bordersof the United States, we classify them as an international student.
Our method of classifying international students is conservativebecause an international student’s weighted midpoint may fall in adifferent part of the country if they visit a mix of domestic and for-eign servers. However, this approach still allows us to identify stu-dents who were primarily visiting foreign websites. This approachidentifies 1,022 devices presumed to be used by international stu-dents, which constitutes 18% of all identified post-shutdown users.In the Fall before the pandemic, reports indicated that about 25% ofthe entire student body population at UC San Diego was comprisedof International students [14], however there are no reports of howmany students who remained on campus during the lock-downwere domestic or international students.
Given this labeling of foreign and domestic students, we comparetheir Internet usage by plotting the median volume of traffic perdevice in Figure 4. In this graph, we exclude Zoom (the tool usedfor online classes) traffic as it is both large (c.f. Figure 5) and notsignificantly different between populations. The biggest differencebetween these two user groups is during academic break, when the
2020-02-01 2020-03-01 2020-04-01 2020-05-01
0
100
200
300
400
500
600
700
Byte
s (GB
)
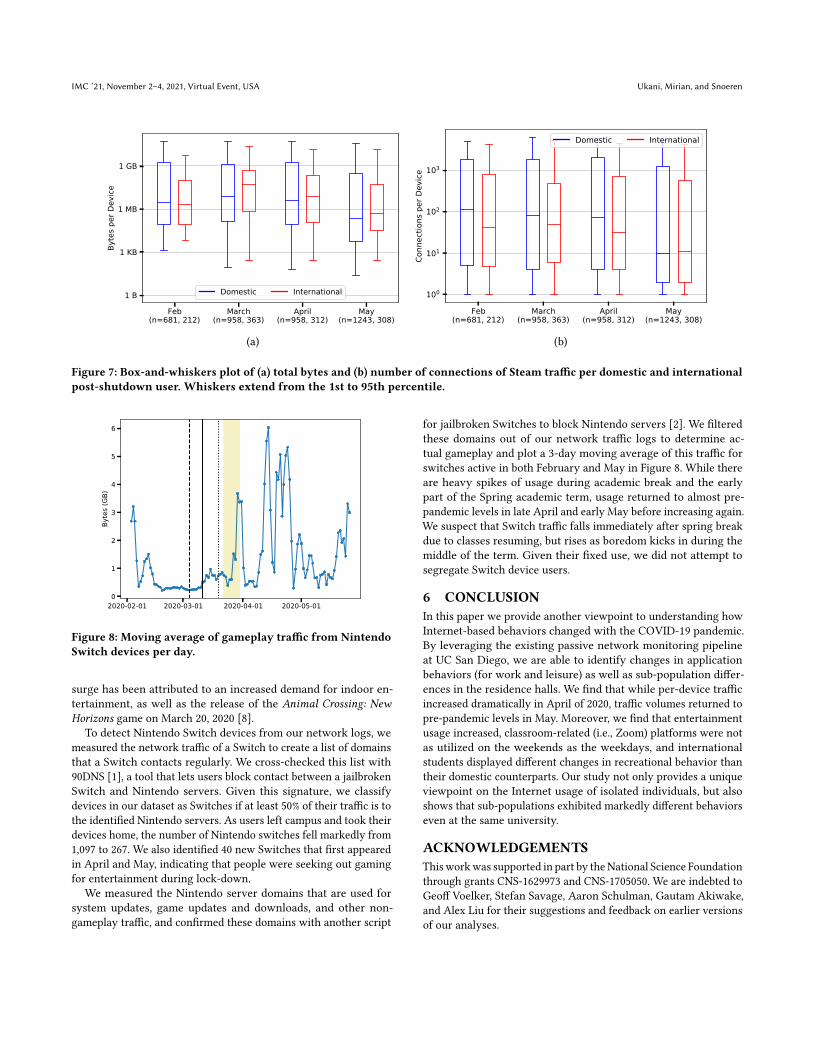
Figure 5: Daily aggregate Zoom traffic for post-shutdownusers from February through May 2020.
volume of traffic increases for international students but remainsstable for domestic students. The volume of traffic also stays ele-vated for international students for the duration of the term relativeto their domestic counterparts.
5 APPLICATION USAGEHere we consider usage of both work and leisure applications.
5.1 Online classesWhen classes at the university transitioned fully online, they wereprimarily hosted on the video conference platform Zoom. Otheruniversities, companies, and social events also moved to Zoom,resulting in over 300 million daily meeting participants as of April2020 [19]. To analyze Zoom traffic in our dataset, we identify allconnections that resolve to a zoom.us domain. We also analyzeconnections where an IP address matches a list of IP addresses fromZoom support [18], and use the Internet Archive Wayback Machineto find any IP addresses that were previously listed on this page,but were subsequently removed.
We plot the aggregate Zoom traffic in Figure 5. While the overallZoom traffic increased, there are periodic dips that occur duringthe weekends. The weekday traffic is most active from 8am to 6pmon weekdays, which corresponds to online classes. On weekends,there is a small spike in traffic in the afternoon (not shown), whichmay indicate that people are using Zoom for entertainment (e.g.calls with family and friends) or for extracurricular activities (e.g.club meetings).
5.2 Social mediaAs people had to stay indoors during the pandemic, the popularityof some social media sites has increased dramatically. Notably,TikTok’s popularity increased by 75% from January to September2020 [9]. In this section, we study the changes in social mediausage throughout the COVID-19 shutdown. We focus on Facebook,Instagram, and TikTok in particular.
For each platform, we manually analyzed traffic from a laptopand mobile device to create signatures of the application’s behavior
Locked-In during Lock-Down IMC ’21, November 2–4, 2021, Virtual Event, USA
February(n=1131, 359)
March(n=1141, 365)
April(n=1060, 356)
May(n=1131, 362)
0.001
0.01
0.1
1
10
100
Dura
tion
per D
evice
(Hou
rs)
Domestic International
(a)
February(n=1024, 281)
March(n=1032, 301)
April(n=956, 277)
May(n=1011, 282)
0.001
0.01
0.1
1
10
100
Dura
tion
per D
evice
(Hou
rs)
Domestic International
(b)
February(n=504, 115)
March(n=588, 152)
April(n=657, 178)
May(n=715, 195)
0.001
0.01
0.1
1
10
100
Dura
tion
per D
evice
(Hou
rs)
Domestic International
(c)
Figure 6: Box-and-whiskers plot of mobile duration for domestic and international users of (a) Facebook, (b) Instagram, and (c)TikTok. The whiskers extend from the 1st to the 95th percentile. (Note the logarithmic 𝑦 axes.)
(i.e., the set of sites visited by each). We then compute the du-ration of each user’s sessions. While Zeek provides the durationof each network flow, the social media sites often use multipledomains to serve content to users. For example, in a single Face-book session, a client would receive traffic from facebook.com,facebook.net, and fbcdn.net. So, to compute the duration of anentire user session, we find the bounds of overlapping flows fromdifferent domains belonging to the same site.
Another complication in computing duration is that the afore-mentioned Facebook domains serve content for both Facebookand Instagram services. We use a simple heuristic to differentiateFacebook and Instagram sessions: if any of the domains in a set ofoverlapping flows delivers Instagram-only content (e.g. traffic frominstagram.com), then we mark the entire session as an Instagramsession. Otherwise, we mark the session as Facebook. This heuris-tic is reasonable according to our manual traffic analysis, but mayoverstate Facebook usage and under-represent Instagram usage.
After computing duration for each site, we generate graphs ofeach user’s aggregate duration per month for February throughMay. We analyze only mobile traffic because there is not significantdesktop/laptop traffic even before the pandemic. Figure 6a showsthese durations for Facebook mobile users. For domestic users,Facebook usage was relatively unchanged from February throughMarch, but decreased in May. However, the median duration for in-ternational students increased during the campus shutdown. WhileFacebook was more popular for domestic users than internationalusers in February, in May we see that the decrease in domesticusage dampened the distinction between user groups.
We next plot Instagram duration in Figure 6b. For domesticstudents, themedian is relatively unchanged from February throughApril, but decreases in May. The first quartile also decreases inApril and May, indicating that some users were not as active onInstagram later in the campus shutdown. In contrast, the medianfor international students increases in May. The first and thirdquartiles also increase from February to March and stay steadyfor the following months. So international students increased theirusage while domestic students maintained or decreased their usage.
Finally we show TikTok duration in Figure 6c. The median du-ration for domestic users increases from February to March, thendecreases in April, and returns all the way back to February’s level
in May. However, the third quartile and 99th percentile both in-crease steadily over the months. This indicates that a portion ofdomestic users kept increasing their TikTok usage, while someusers went back to pre-pandemic levels of usage in May. Interna-tional users were much less active on TikTok than domestic users,but their median usage also increased in March and April comparedto February. Like domestic students, the 99th percentile for interna-tional students also continuously increased over the months, butthe 1st percentile also continuously decreased. This suggests a lotmore variance in TikTok usage for this user group.
5.3 GamingAn important part of online entertainment is gaming. Prior work [7]found that overall gaming traffic increased, and that people startedplaying games all the time, instead of just in the evenings or onweekends. We also find that gaming traffic increased in our targetpopulation. In this section we analyze two important platforms:Steam and Nintendo Switches.
5.3.1 Steam. We developed a signature for Steam, an online plat-form for PC games, from the set of domains that their customersupport recommends whitelisting [16]. We used this signature toplot the total bytes of Steam traffic per user, which is shown inFigure 7a. For each month, we show the traffic for any device thatvisits Steam, though the set of devices are different for each month.We see that domestic students increase their Steam usage in March,but this usage falls in April andMay. International students increasetheir usage even more during March and April, but again this us-age falls in May. The graph of the number of Steam connections,shown in Figure 7b, presents a slightly different picture. Domesticstudents’ median drops over time, while international students’median increases in March and then drops again. We suspect thesegraphs are different due to game releases or due to the way eachgame operates. In any event, it seems students initially turned toSteam as source of entertainment during the early periods of thecampus shutdown, but found other diversions as time passed.
5.3.2 Nintendo Switches. Despite the Nintendo Switch being re-leased in 2017, sales soared during the COVID-19 pandemic. This
IMC ’21, November 2–4, 2021, Virtual Event, USA Ukani, Mirian, and Snoeren
Feb(n=681, 212)
March(n=958, 363)
April(n=958, 312)
May(n=1243, 308)
1 B
1 KB
1 MB
1 GB
Byte
s per
Dev
ice
Domestic International
(a)
Feb(n=681, 212)
March(n=958, 363)
April(n=958, 312)
May(n=1243, 308)
100
101
102
103
Conn
ectio
ns p
er D
evice
Domestic International
(b)
Figure 7: Box-and-whiskers plot of (a) total bytes and (b) number of connections of Steam traffic per domestic and internationalpost-shutdown user. Whiskers extend from the 1st to 95th percentile.
2020-02-01 2020-03-01 2020-04-01 2020-05-010
1
2
3
4
5
6
Byte
s (GB
)
Figure 8: Moving average of gameplay traffic from NintendoSwitch devices per day.
surge has been attributed to an increased demand for indoor en-tertainment, as well as the release of the Animal Crossing: NewHorizons game on March 20, 2020 [8].
To detect Nintendo Switch devices from our network logs, wemeasured the network traffic of a Switch to create a list of domainsthat a Switch contacts regularly. We cross-checked this list with90DNS [1], a tool that lets users block contact between a jailbrokenSwitch and Nintendo servers. Given this signature, we classifydevices in our dataset as Switches if at least 50% of their traffic is tothe identified Nintendo servers. As users left campus and took theirdevices home, the number of Nintendo switches fell markedly from1,097 to 267. We also identified 40 new Switches that first appearedin April and May, indicating that people were seeking out gamingfor entertainment during lock-down.
We measured the Nintendo server domains that are used forsystem updates, game updates and downloads, and other non-gameplay traffic, and confirmed these domains with another script
for jailbroken Switches to block Nintendo servers [2]. We filteredthese domains out of our network traffic logs to determine ac-tual gameplay and plot a 3-day moving average of this traffic forswitches active in both February and May in Figure 8. While thereare heavy spikes of usage during academic break and the earlypart of the Spring academic term, usage returned to almost pre-pandemic levels in late April and early May before increasing again.We suspect that Switch traffic falls immediately after spring breakdue to classes resuming, but rises as boredom kicks in during themiddle of the term. Given their fixed use, we did not attempt tosegregate Switch device users.
6 CONCLUSIONIn this paper we provide another viewpoint to understanding howInternet-based behaviors changed with the COVID-19 pandemic.By leveraging the existing passive network monitoring pipelineat UC San Diego, we are able to identify changes in applicationbehaviors (for work and leisure) as well as sub-population differ-ences in the residence halls. We find that while per-device trafficincreased dramatically in April of 2020, traffic volumes returned topre-pandemic levels in May. Moreover, we find that entertainmentusage increased, classroom-related (i.e., Zoom) platforms were notas utilized on the weekends as the weekdays, and internationalstudents displayed different changes in recreational behavior thantheir domestic counterparts. Our study not only provides a uniqueviewpoint on the Internet usage of isolated individuals, but alsoshows that sub-populations exhibited markedly different behaviorseven at the same university.
ACKNOWLEDGEMENTSThis workwas supported in part by the National Science Foundationthrough grants CNS-1629973 and CNS-1705050. We are indebted toGeoff Voelker, Stefan Savage, Aaron Schulman, Gautam Akiwake,and Alex Liu for their suggestions and feedback on earlier versionsof our analyses.

Locked-In during Lock-Down IMC ’21, November 2–4, 2021, Virtual Event, USA
REFERENCES[1] 90dns. http://gitlab.com/a/90dns.[2] Switchblockerforpihole. http://github.com/buggerman/SwitchBlockerForPiHole.[3] Timm Böttger, Ghida Ibrahim, and Ben Vallis. How the Internet reacted to Covid-
19: A perspective from Facebook’s edge network. In Proceedings of the ACMInternet Measurement Conference, IMC ’20, page 34–41, New York, NY, USA, 2020.Association for Computing Machinery.
[4] Massimo Candela and Antonio Prado. Italian operators’ response to the COVID-19 pandemic. SIGCOMM Comput. Commun. Rev., 51(1):26–31, March 2021.
[5] Louis F. DeKoven, Audrey Randall, Ariana Mirian, Gautam Akiwate, Ansel Blume,Lawrence K. Saul, Aaron Schulman, Geoffrey M. Voelker, and Stefan Savage.Measuring security practices and how they impact security. In Proceedings of theInternet Measurement Conference, IMC ’19, page 36–49, New York, NY, USA, 2019.Association for Computing Machinery.
[6] Thomas Favale, Francesca Soro, Martino Trevisan, Idilio Drago, and Marco Mellia.Campus traffic and e-learning during COVID-19 pandemic. Computer Networks,176:107290, 2020.
[7] Anja Feldmann, Oliver Gasser, Franziska Lichtblau, Enric Pujol, Ingmar Poese,Christoph Dietzel, Daniel Wagner, Matthias Wichtlhuber, Juan Tapiador, NarseoVallina-Rodriguez, Oliver Hohlfeld, and Georgios Smaragdakis. The lockdowneffect: Implications of the COVID-19 pandemic on internet traffic. In Proceedingsof the ACM Internet Measurement Conference, IMC ’20, page 1–18, New York, NY,USA, 2020. Association for Computing Machinery.
[8] Tom Huddleston. How ‘Animal Crossing’ and the coronavirus pandemic madethe Nintendo Switch fly off shelves, Jun 2020.
[9] John Koetsier. Massive TikTok Growth: Up 75% This Year, Now 33X More UsersThan Nearest Direct Competitor, September 2020.
[10] Craig Labovitz. Effects of COVID-19 lockdowns on service provider networks.https://youtu.be/lg-YHkWFjIE, 2020.
[11] Shinan Liu, Paul Schmitt, Francesco Bronzino, and Nick Feamster. Characterizingservice provider response to the covid-19 pandemic in the united states. InPassive and Active Measurement, pages 20–38, Cham, 2021. Springer InternationalPublishing.
[12] Andra Lutu, Diego Perino, Marcelo Bagnulo, Enrique Frias-Martinez, and JavadKhangosstar. A characterization of the COVID-19 pandemic impact on a mobilenetwork operator traffic. In Proceedings of the ACM Internet Measurement Confer-ence, IMC ’20, page 19–33, New York, NY, USA, 2020. Association for ComputingMachinery.
[13] Yelena Mejova and Nicolas Kourtellis. Youtubing at home: Media sharing behav-ior change as proxy for mobility around COVID-19 lockdowns. In 13th ACMConference on Web Science, WebSci ’21. Association for Computing Machinery,2021.
[14] Gary Robbins. Uc san diego’s foreign enrollment hits record. the pandemicmay stop it from going higher. https://www.sandiegouniontribune.com/news/education/story/2020-11-16/uc-san-diego-foreign-student-enrollment, 2020.
[15] Said Jawad Saidi, Anna Maria Mandalari, Roman Kolcun, Hamed Haddadi,Daniel J. Dubois, David Choffnes, Georgios Smaragdakis, and Anja Feldmann. Ahaystack full of needles: Scalable detection of iot devices in the wild. In Proceed-ings of the ACM Internet Measurement Conference, IMC ’20, New York, NY, USA,2020. Association for Computing Machinery.
[16] Steam Support. Required ports for steam. https://support.steampowered.com/kb_article.php?ref=8571-GLVN-8711.
[17] Zeek. Zeek protocol analyzers website. https://docs.zeek.org/en/current/script-reference/proto-analyzers.html.
[18] Zoom. Network firewall or proxy server settings for Zoom.[19] Zoom. 90-day security plan progress report: April 22, April 2020.