locotorp :rebmun 4d 10cq90002 tnemtaert ni stneitap htiw
TRANSCRIPT

Protocol number: D419QC00002
Document title: A Phase II, Open-Label, Multi-Arm Study to
Determine the Preliminary Efficacy of Novel Combinations of
Treatment in Patients with Platinum Refractory Extensive-Stage
Small-Cell Lung Cancer (BALTIC)
NCT number: NCT02937818
Version number: 4.0
Date of the document: 12 April 2019
PPD
PPD
PPD
PPD
PPDPPD
PPD
PPD

Statistical Analysis Plan Study Code D419QC00002 Edition Number 4.0 Date 12 Apr 2019
2
TABLE OF CONTENTS PAGE
TITLE PAGE ........................................................................................................... 1
TABLE OF CONTENTS ......................................................................................... 2
LIST OF ABBREVIATIONS .................................................................................. 6
AMENDMENT HISTORY ..................................................................................... 9
1. STUDY DETAILS ................................................................................................. 10
1.1 Study objectives ..................................................................................................... 10 1.1.1 Primary objective ................................................................................................... 10
1.1.2 Secondary objectives ............................................................................................. 10 1.1.3 Safety objectives .................................................................................................... 10 1.1.4 Exploratory objectives ........................................................................................... 10
1.2 Study design ........................................................................................................... 12
1.3 Number of patients ................................................................................................. 15
2. ANALYSIS SETS ................................................................................................. 15
2.1 Definition of analysis sets ...................................................................................... 15
2.1.1 Full analysis set ...................................................................................................... 15 2.1.2 PK analysis set ....................................................................................................... 15
2.2 Protocol deviations ................................................................................................. 16
3. PRIMARY AND SECONDARY VARIABLES ................................................... 17
3.1 Efficacy .................................................................................................................. 17 3.1.1 Derivation of RECIST visit responses ................................................................... 17 3.1.1.1 Target lesions ......................................................................................................... 19 3.1.1.2 Non-target lesions and new lesions ........................................................................ 24 3.1.1.3 Overall visit response ............................................................................................. 26
3.2 Efficacy variables ................................................................................................... 26 3.2.1 Primary endpoint .................................................................................................... 26 3.2.1.1 Objective response rate .......................................................................................... 26 3.2.2 Secondary endpoints .............................................................................................. 27 3.2.2.1 Duration of response .............................................................................................. 27 3.2.2.2 Disease control rate ................................................................................................ 28
Statistical Analysis Plan Study Code D419QC00002 Edition Number 4.0 Date 12 Apr 2019
3
3.2.2.3 Time to response .................................................................................................... 28
3.2.2.4 Progression-free survival ....................................................................................... 28
3.2.2.5 Overall survival ...................................................................................................... 30
3.3 Safety variables ...................................................................................................... 30
3.3.1 Adverse events ....................................................................................................... 30
3.3.2 Adverse events of special interest .......................................................................... 31
3.3.3 Duration of exposure .............................................................................................. 31
3.3.4 Dose intensity ......................................................................................................... 32
3.3.5 ECG ........................................................................................................................ 33
3.3.6 Vital signs .............................................................................................................. 33
3.3.7 General considerations for safety assessments ...................................................... 34
3.4 Biomarker variables ............................................................................................... 36
3.5 Pharmacokinetics and immunogenicity variables .................................................. 36
3.5.1 Pharmacokinetic analysis ....................................................................................... 36
3.5.2 Immunogenicity analysis ....................................................................................... 37
4. ANALYSIS METHODS ....................................................................................... 37
4.1 General principles .................................................................................................. 37
4.2 Analysis methods ................................................................................................... 38
4.2.1 Patient disposition .................................................................................................. 38
4.2.2 Protocol deviations ................................................................................................. 38
4.2.3 Demographics and other baseline characteristics .................................................. 38
4.2.4 Medical history ...................................................................................................... 39
4.2.5 Disease history ....................................................................................................... 39
4.2.6 Concomitant medication ........................................................................................ 39
4.2.7 Exposure ................................................................................................................ 40 4.2.8 Efficacy .................................................................................................................. 40
4.2.8.1 Objective response rate .......................................................................................... 40
4.2.8.2 Duration of response .............................................................................................. 40
4.2.8.3 Disease control rate ................................................................................................ 40
4.2.8.4 Time to response .................................................................................................... 41
4.2.8.5 Progression-free survival ....................................................................................... 41
4.2.8.6 Overall survival ...................................................................................................... 41
4.2.9 Sensitivity analyses ................................................................................................ 41
4.2.10 Safety ..................................................................................................................... 42
4.2.10.1 Adverse events ....................................................................................................... 42
4.2.10.2 Laboratory evaluations ........................................................................................... 44
4.2.10.3 ECG assessments ................................................................................................... 45
4.2.10.4 Vital signs and weight ............................................................................................ 46
4.2.10.5 ECOG performance status ..................................................................................... 46
4.2.12 Pharmacokinetics and immunogenicity ................................................................. 46 4.2.12.1 Pharmacokinetic data ............................................................................................. 46
4.2.12.2 Immunogenicity data ............................................................................................. 47
CCI

Statistical Analysis Plan Study Code D419QC00002 Edition Number 4.0 Date 12 Apr 2019
4
5. INTERIM ANALYSES ......................................................................................... 47
6. CHANGES OF ANALYSIS FROM PROTOCOL (NOT APPLICABLE) .......... 48
7. REFERENCES (NOT APPLICABLE) ................................................................. 48
8. APPENDIX – PROTOCOL DEVIATION INSTRUCTIONS .............................. 48

Statistical Analysis Plan Study Code D419QC00002 Edition Number 4.0 Date 12 Apr 2019
5
LIST OF TABLES
Table 1 Summary of outcome variables and analysis populations ........................ 15
Table 2 TL visit responses ................................................................................... 20
Table 3 NTL visit responses ................................................................................ 24
Table 4 Overall visit response .............................................................................. 26
Table 5
LIST OF FIGURES
Figure 1 Overall study design ................................................................................. 13
CCI

Statistical Analysis Plan Study Code D419QC00002 Edition Number 4.0 Date 12 Apr 2019
6
LIST OF ABBREVIATIONS
Abbreviation or special term
Explanation
ADAs Antidrug antibodies AE(s) Adverse event(s) AESI(s) Adverse event(s) of special interest AJCC American Joint Committee on Cancer
ALT Alanine aminotransferase AST Aspartate aminotransferase ATC Anatomical Therapeutic Chemical AUC Area under the curve BID Twice daily BMI Body mass index BoR Best objective response BP Blood pressure CBDP Carboplatin
CI(s) Confidence interval(s) CR Complete response CrCl Creatinine clearance
CSP Clinical study protocol
CSR Clinical study report CT Computed tomography
CTC Common toxicity criteria
CTCAE Common Terminology Criteria for Adverse Events DLL3 Delta-Like 3 (Drosophila) DNA Deoxyribonucleic acid DCO Data cut-off
DCR Disease control rate DoR Duration of response
CCI
CCI

Statistical Analysis Plan Study Code D419QC00002 Edition Number 4.0 Date 12 Apr 2019
7
Abbreviation or special term
Explanation
ECG Electrocardiogram ECOG Eastern Cooperative Oncology Group eCRF Electronic case report form ED-SCLC Extensive-stage small cell lung cancer FAS Full Analysis Set
GFR Glomerular filtration rate
GGT Gamma-glutamyl transferase/gamma-glutamyl transpeptidase
IFN Interferon IPDs Important protocol deviations
IV Intravenous KM Kaplan-Meier LD Longest diameter MDS/AML Myelodysplastic syndrome/acute myeloid leukaemia
MedDRA Medical Dictionary for Regulatory Activities MRI Magnetic resonance imaging NA Not applicable NE Not evaluable NED No evidence of disease NTL(s) Non-target lesion(s) ORR Objective response rate OS Overall survival p53 Tumour protein 53 PD Progressive disease PD-L1 Programmed cell death ligand 1 PFS Progression-free survival PK Pharmacokinetics PO By mouth PR Partial response PS Performance status
CCI

Statistical Analysis Plan Study Code D419QC00002 Edition Number 4.0 Date 12 Apr 2019
8
Abbreviation or special term
Explanation
PT Preferred term q3w Every three weeks q4w Every four weeks QD Once a day QTcF Fridericia QTc correction RDI Relative dose intensity RECIST 1.1 Response Evaluation Criteria in Solid Tumours, version 1.1 RR Interval between the R spikes of 2 consecutive complexes on an ECG
SAE(s) Serious adverse event(s) SD Stable disease SOC System organ class T3 Triiodothyronine
T4 Thyroxine
TL(s) Target lesion(s)
TSH Thyroid-stimulating hormone
TTR Time to response
ULN Upper limit of normal WHO World Health Organization
CCI

Statistical Analysis Plan Study Code D419QC00002 Edition Number 4.0 Date 12 Apr 2019
9
AMENDMENT HISTORY
Date Brief description of change
30 November 2016 N/A
16 January 2017
Updated after the CRM
18 January 2017
Updated after medics’ comments
15 February 2017 Additional sensitivity analysis was added
22 May 2017 Amended as per protocol amendment 1 (protocol version 2.0 dated 30 March 2017)
30 June 2017 Updated after medic’s comments
25 August 2018 Amended as per protocol amendment (protocol version 4.0 dated 25 June 2018) due to addition of Arm C and Arm A expansion
18 February 2019 Revise the definition of important protocol deviations and the visit window for safety assessments.
12 April 2019 Revise the definition of important protocol deviation: Baseline RECIST 1.1 scan more than 42 days before start date of study treatment (Deviation 3)

Statistical Analysis Plan Study Code D419QC00002 Edition Number 4.0 Date 12 Apr 2019
10
1. STUDY DETAILS
1.1 Study objectives 1.1.1 Primary objective
Primary Objective: Outcome Measure: To assess the preliminary efficacy of each treatment arm in terms of objective response rate (ORR)
ORR using Investigator assessments according to Response Evaluation Criteria in Solid Tumours, version 1.1 (RECIST 1.1)
1.1.2 Secondary objectives
Secondary Objective: Outcome Measure: To further assess the preliminary efficacy of each treatment arm in terms of duration of response (DoR), disease control rate (DCR), time to response (TTR), progression-free survival (PFS), and overall survival (OS)
DoR, DCR, TTR, and PFS using Investigator assessments according to RECIST 1.1 OS
To assess the pharmacokinetics (PK) of novel combination treatments (Arm A stage 1 and 2 only, Arms B and C only)
Concentration of novel combination treatments in blood
1.1.3 Safety objectives
Safety Objective: Outcome Measure: To assess the safety and tolerability profile of each treatment arm
Adverse events (AEs); physical examinations; vital signs, including blood pressure (BP) and pulse; electrocardiograms (ECGs); and laboratory findings, including clinical chemistry, haematology, and urinalysis
1.1.4 Exploratory objectives
Exploratory Objective: Outcome Measure:
CCI CCI

Statistical Analysis Plan Study Code D419QC00002 Edition Number 4.0 Date 12 Apr 2019
11
Exploratory Objective: Outcome Measure:
)
CCI CCI
CCI CCI
CCI CCI
CCI CCI
CCI CCI
CCI CCI
CCI CCI
CCI CCI
CCI CCI

Statistical Analysis Plan Study Code D419QC00002 Edition Number 4.0 Date 12 Apr 2019
12
Exploratory Objective: Outcome Measure:
1.2 Study design This is a Phase II, open-label, multi-drug, multi-center, multi-arm study to determine the preliminary efficacy of novel combinations of treatment in patients with Extensive-stage disease small-cell lung cancer (ED-SCLC) who have refractory or resistant disease, defined as patients who progress during first-line platinum-based chemotherapy or those who progress within 90 days after completing first-line platinum-based chemotherapy.
This multi-arm study initially opened with 2 arms (Arms A and B), and an additional arm (Arm C) was added in version 3; additional arms may be opened provided there is compelling rationale for the combination and a safe and tolerable dose and schedule have been determined from ongoing Phase I studies.The 3 experimental arms are:
Arm A: Durvalumab 1500 mg + tremelimumab 75 mg via intravenous (IV) infusion every 4 weeks (q4w), starting on Week 0, for up to a total of 4 doses/cycles) followed by durvalumab monotherapy 1500 mg via IV infusion q4w, starting after completion of the 4th cycle of combination treatment until confirmed progressive disease (PD) and Investigator confirmation that the patient is no longer receiving clinical benefit from the treatment, or for other discontinuation criteria. If a patient’s weight falls to 30 kg or less, the patient should receive weight-based dosing after discussion between Investigator and Study Physician, until the weight improves to > 30 kg, at which point
CCI CCI
CCI CCI
CCI CCI
CCI CCI
CCI CCI

Statistical Analysis Plan Study Code D419QC00002 Edition Number 4.0 Date 12 Apr 2019
13
the patient should start receiving the fixed dosing of durvalumab 1500mg and 75mg tremelimumab q4w (during the combination phase of treatment). The equivalent weight based doses to the fixed doses are 20 mg/kg of durvalumab and 1 mg/kg tremelimumab q4w.
Arm B: AZD1775 225 mg twice daily (BID) by mouth (PO) for 2.5 days from Day 1 + Carboplatin (CBDP) area under the curve (AUC) 5 Day 1 IV; every 3 weeks (q3w) until PD.
The CBDP dose will be calculated using the Calvert formula based on the patient’s Glomerular filtration rate (GFR), which is estimated by using the Creatinine Clearance (CrCl). Calvert formula: CBDP dose (mg) = target AUC × (GFR + 25) where CrCl (GFR) = [(140 – age) × (wt. in kg)] × F / (72 × serum creatinine [mg/dL]), where F = 0.85 for females and F =1 for males.
Arm C: AZD6738 160 mg once daily (QD) days 1-7 + olaparib 300 mg BID days 1-28; every 4 weeks (q4w) until PD.
The schematic diagram of the study design of each treatment arm is shown in
Figure 1 below.
Figure 1 Overall study design

Statistical Analysis Plan Study Code D419QC00002 Edition Number 4.0 Date 12 Apr 2019
14
Note: Arm A = durvalumab + tremelimumab followed by durvalumab monotherapy; Arm B = AZD1775 + carboplatin [CBDP]; Arm C = AZD6738 + olaparib; ED-SCLC: Extensive-stage disease small-cell lung cancer; ORR: Objective response rate; OS: Overall survival; PFS: Progression-free survival
This study will enroll up to 40 eligible patients in each treatment arm. Stage 1 will initially enroll a minimum of 10 patients; after a minimum of 12 weeks an interim analysis will be performed, which will determine whether recruitment should expand to the second stage (an additional 10 patients for a total of 20 eligible patients) or stop. If the results of the primary ORR from the completed 2nd stage are encouraging the Review Committee could recommend expansion to add up to an additional 20 eligible subjects (for a total of 40 eligible patients), to further explore the findings. There is no randomization in the study. All patients in the study will be followed for preliminary efficacy, safety and tolerability of each treatment arm as per the study plan.
All patients should be assessed as described in the study plan until PD and Investigator confirmation that the patient is no longer receiving clinical benefit from the treatment, or for other discontinuation criteria. Then all patients should be followed up for overall survival.

Statistical Analysis Plan Study Code D419QC00002 Edition Number 4.0 Date 12 Apr 2019
15
1.3 Number of patients This study will enroll up to 40 eligible patients in each treatment arm.
The table below shows the 2-sided exact 95% confidence intervals (CI) for the ORR of a treatment arm at each stage of the study, assuming the observed ORR is % or %:
ORR % %
Stage 1 (10 patients) ( %, %) ( %, %)
Stage 2 (20 patients in total)) ( %, %) ( %, 3%)
Expansion (40 patients in total) ( %, %) ( %, %)
2. ANALYSIS SETS
2.1 Definition of analysis sets Definitions of the analysis sets for each outcome variable are provided in Table 1.
Table 1 Summary of outcome variables and analysis populations
Outcome variable Population Efficacy data
ORR, DoR, DCR, TTR, PFS, and OS Full analysis set Demography Full analysis set
PK data PK analysis set Safety data
Exposure Full analysis set AEs including AESI Full analysis set
Laboratory measurements Full analysis set Vital signs Full analysis set
ECGs Full analysis set
2.1.1 Full analysis set The Full Analysis Set (FAS) will include all treated patients. Patients who were enrolled but did not subsequently go on to receive investigational product are not included in the FAS. There is no separate Safety Analysis Set because all treated patients are included in the Full Analysis set and analysed for safety.
2.1.2 PK analysis set All patients who received at least one dose of study treatment per the protocol for whom any post-dose data are available and who do not violate or deviate from the protocol in ways that
CCI CCI
CCI CCI
CCI CCI CCI
CCI CCI
CCI
CCI
CCI CCI
CCI CCICCI

Statistical Analysis Plan Study Code D419QC00002 Edition Number 4.0 Date 12 Apr 2019
16
would significantly affect the PK analyses will be included in the PK Analysis Set. The population will be defined by the Study Physician, Pharmacokineticist, and Statistician prior to any analyses being performed.
2.2 Protocol deviations Eligibility criteria deviations are deviations from the protocol inclusion and exclusion criteria. Post-entry deviations are deviations from the protocol that occurred after the patient was assigned to study treatment. Protocol deviations are classified as major and minor during the study and will be reviewed by the study statistician and study physician to determine importance (i.e. whether the deviation could impact the study results for that patient).
Important protocol deviations (IPDs) are defined as a subset of protocol deviations that may significantly affect the completeness, accuracy, and/or reliability of the study data or that may significantly affect safety.
The following general categories will be considered important deviations which may be listed and discussed in the clinical study report (CSR) as appropriate for the study:
Study medication is not administered according to the CSP, i.e, overdose, wrong dose, wrong drug (Deviation 1).
Patients who deviate from key entry criteria per the Clinical Study Protocol (CSP) (Deviation 2)
Baseline RECIST 1.1 scan more than 42 days before start date of study treatment (Deviation 3)
No baseline RECIST 1.1 assessment on or before start of study treatment (Deviation 4) Prohibited medication deviation (including other anticancer agents) (Deviation 5).
Please refer to protocol sections 18.7 and 28.7 for those medications that are detailed as being ‘excluded’ from permitted use during the study for each arm. These will be used as guiding principle for the physician review of all medications prior to database lock.
Tumor assessment is not done according to Protocol or RECIST 1.1 Criteria (Deviation 6).
If any patients have any other protocol deviations, which are considered important by the study team, these will also be described.
Patients who violate or deviate from the protocol in ways that would significantly affect the PK analysis such as out sampling window or vomiting after taking oral drug will be excluded from the PK Analysis Set according to PK scientist opinion after reviewing PK data.
Determination of the important deviations above will be based on monitoring notes and where feasible programmatic determination from the clinical database.

Statistical Analysis Plan Study Code D419QC00002 Edition Number 4.0 Date 12 Apr 2019
17
The final classification of important protocol deviations will be made by the study physician in collaboration with the study statistician prior to database lock or data cut-off. Important protocol deviations will be listed and summarised separately by treatment arm.
For a detailed description of Protocol Deviation (PD) collection process and classification please see Annex 1 – Protocol Deviation Instructions.
3. PRIMARY AND SECONDARY VARIABLES
3.1 Efficacy 3.1.1 Derivation of RECIST visit responses From the investigators review of the imaging scans, the RECIST tumour response data will be used to determine each patient’s visit response according to RECIST 1.1. It will also be used to determine if and when a patient has progressed in accordance with RECIST 1.1.
Baseline radiological tumour assessments should be performed no more than 28 days before the start of study treatment, and ideally as close as possible to the start of study treatment. The RECIST 1.1 assessments of baseline images identify target (defined measurable) and non-target lesions, and each lesion (and any new lesion) is evaluated in subsequent on-treatment follow-up images. This allows determination of follow-up target lesion response, non-target lesion response, and overall time point tumour responses (complete response [CR], partial response [PR], stable disease [SD], progressive disease [PD], or not evaluable [NE]).
Efficacy for all patients (both treatment arms) will be assessed on images collected either every 6 or 8 weeks ± 1 week (dependent on treatment arm) until confirmed objective disease progression or when the patient has been taken off-study. Tumour assessments specific to each treatment arm are performed at the following time points:
Arm A: at baseline and at Week 8, Week 12 and then every 8 weeks ± 1 week until confirmed objective disease progression or off-study. For patients treated beyond progression RECIST 1.1 assessments will continue every 8 weeks until the patient no longer experiences clinical benefit.
Arm B: at baseline and then every 6 weeks ± 1 week until objective disease progression or off-study.
Arm C: at baseline and at Week 8, Week 12 and then every 8 weeks ± 1 week, from the first day of investigational drug administration for the first 72 weeks, then every 12 weeks ± 1 week thereafter, until disease progression.

Statistical Analysis Plan Study Code D419QC00002 Edition Number 4.0 Date 12 Apr 2019
18
In the absence of significant clinical deterioration, or in the case of any doubt, treatment with study drug may continue between the initial assessment of progression and a subsequent scan to confirm progression.
If an unscheduled assessment is performed and the patient has not progressed, every attempt should be made to perform the subsequent assessments at their scheduled visits. This schedule is to be followed in order to minimize any unintentional bias caused by some patients being assessed at a different frequency than other patients.
If a patient discontinues treatment (and/or receives a subsequent anticancer therapy) prior to radiologic progression, then the patient should continue to be followed with scheduled imaging until confirmed objective disease progression.
According to RECIST 1.1, objective tumour response (CR or PR) should be confirmed preferably at the next scheduled imaging visit and not less than 4 weeks after the visit when the response was last observed.
At each visit, patients will be programmatically assigned an overall visit response of CR, PR, SD or PD using the information from TLs, NTLs and new lesions and depending on the status of their disease compared with baseline and previous assessments. If a patient has had a tumour assessment which cannot be evaluated, then the patient will be assigned a visit response of NE (unless there is evidence of progression, in which case the response will be assigned as PD).
All RECIST 1.1 assessments, scheduled or unscheduled, will be included in the calculations. This is also regardless of whether a patient discontinues study treatment or receives another anti-cancer therapy.
Arm A only
For the immunotherapy arm only (Arm A: durvalumab + tremelimumab followed by durvalumab monotherapy), a confirmatory scan is required following the prior demonstration of PD. The confirmatory scan should occur preferably at the next scheduled visit and no earlier than 4 weeks following the date the criteria for response were first met or after the prior assessment of PD. Confirmation of progression guidelines are set for the following reasons:
for patient management and treatment decisions in the absence of significant clinical deterioration, to promote the collection of
additional scans after the first radiologic RECIST 1.1 assessment of progressive disease (PD) in order to distinguish pseudo-progression from true radiologic progression, also known as RECIST 1.1 modified for confirmation of progression.
Confirmed objective disease progression refers to either of the following scenarios: 1. Clinical progression/deterioration followed by a radiologic verification scan (PD by RECIST 1.1) or 2. In the absence of significant clinical deterioration, radiologic PD by RECIST 1.1 followed by a second radiologic confirmation scan with PD assessed according to specific confirmation of

Statistical Analysis Plan Study Code D419QC00002 Edition Number 4.0 Date 12 Apr 2019
19
progression criteria listed below. RECIST 1.1 modified for confirmation of progression refers to the second scenario above. The confirmation scan should occur preferably at the next scheduled imaging visit and no earlier than 4 weeks following the date of the immediate prior assessment of RECIST 1.1 PD.
Immediate prior radiologic progression in the confirmatory scan would be considered confirmed if the following criteria are met with the confirmatory scan:
≥20% increase in the sum diameters of target lesions (TLs) compared with the nadir at two consecutive visits, with an absolute increase of at least 5mm in sum of diameters compared to nadir,
and/or significant progression (worsening) of non-target lesions (NTLs) and/or of pre-existing new lesions at the confirmatory scan time point compared with the immediate prior time point (Note: Pre-existing new lesions are evaluated as NTLs at the confirmatory scan time-point),
and/or additional new unequivocal lesions at the confirmatory scan time point.
Note: In order to have confirmed objective disease progression, there should be two consecutive PD’s, the first PD by RECIST 1.1 and the second PD using the confirmation of progression criteria (above). If the first PD by RECIST 1.1 is not confirmed, continue with assessments until the next PD by RECIST 1.1, which in turn will need its own immediate subsequent confirmation scan.
In the absence of significant clinical deterioration, treatment with study drug may continue between the initial assessment of progression and the scan to confirm progression.
If the confirmation scan confirms progression, then the date of the prior scan with PD should be declared as the date of progression.
If progression is not confirmed, in the absence of significant clinical deterioration, then the patient should continue study drug and on-treatment assessments until the next PD which will also require a follow-up confirmation scan. If the first PD is not confirmed by the immediate next scan, then the Investigator should not change the PD assessment of the first scan.
If a patient discontinues treatment (and/or receives a subsequent anticancer therapy) prior to radiologic progression, then the patient should still continue to be followed until confirmed objective disease progression.
3.1.1.1 Target lesions Measurable disease is defined as having at least one measurable (by RECIST 1.1) lesion, that has not been previously irradiated, which is ≥10 mm in the longest diameter (except lymph nodes, which must have short axis ≥15 mm) with computed tomography (CT) or magnetic resonance imaging (MRI) and which is suitable for accurate repeated measurements.

Statistical Analysis Plan Study Code D419QC00002 Edition Number 4.0 Date 12 Apr 2019
20
A patient can have a maximum of five measurable lesions, with a maximum of two lesions per organ (representative of all lesions involved suitable for accurate repeated measurements) and these are referred to as TLs at baseline. If more than one baseline scan is recorded then measurements from the one that is closest and prior to start of study treatment will be used to define the baseline sum of TLs. It may be the case that, on occasion, the largest lesion does not lend itself to reproducible measurement in which circumstance the next largest lesion, which can be measured reproducibly, should be selected.
All other lesions (or sites of disease) not recorded as TL should be identified as NTL at baseline. Measurements are not required for these lesions, but their status should be followed at subsequent visits.
Table 2 provides the definitions of the criteria used to determine objective tumour visit response for TL.
Table 2 TL visit responses
Visit Responses Description CR Disappearance of all TLs since baseline. Any pathological lymph nodes
selected as TLs must have a reduction in short axis to <10 mm. PR At least a 30% decrease in the sum of the diameters of TLs, taking as
reference the baseline sum of diameters as long as criteria for PD are not met.
SD Neither sufficient shrinkage to qualify for PR nor sufficient increase to qualify for PD.
PD At least a 20% increase in the sum of the diameters of TLs, taking as reference the smallest sum on study (this includes the baseline sum if that is the smallest on the study). In addition to the relative increase of at least 20%, the sum must also demonstrate an absolute increase of at least 5 mm.
NE Only relevant if any of the TLs were not assessed or not evaluable or had a lesion intervention at this visit. Note: If the sum of diameters meets the progressive disease criteria, progressive disease overrides not evaluable as a TL response.
NA No TLs are recorded at baseline. CR: Complete response, NA: Not applicable, NE: Not evaluable, PD: Progressive disease, PR: Partial response, SD: Stable disease, TL: Target lesion.
Rounding of TL data
For calculation of PD and PR for TLs, percentage changes from baseline and previous minimum should be rounded to 1 decimal place before assigning a TL response. For example, 19.95% should be rounded to 20.0% but 19.94% should be rounded to 19.9%.
Missing TL data
Statistical Analysis Plan Study Code D419QC00002 Edition Number 4.0 Date 12 Apr 2019
21
For a visit to be evaluable, all TL measurements should be recorded. However, a visit response of PD should still be assigned if any of the following occurred:
A new lesion is recorded
A NTL visit response of PD is recorded
The sum of TLs is sufficiently increased to result in a 20% increase, and an absolute increase of ≥5 mm, from nadir even assuming the non-recorded TLs have disappeared.
The nadir (i.e., smallest measurement) can only be taken from assessments where all the TLs had a longest diameter (LD) recorded.
Lymph nodes
For lymph nodes, if the size reduces to <10 mm, these are considered non-pathological.
However, a size will still be measured and this size should still be used to determine the TL visit response as normal. In the special case where all lymph nodes are <10 mm and all other TLs are 0 mm, then although the sum may be >0 mm, the calculation of TL response should be over-written as a CR.
TL visit responses subsequent to CR
A CR response can only be followed by CR, PD or NE. If a CR has occurred then the following rules at the subsequent visits must be applied:
Step 1: If all lesions meet the CR criteria (i.e., 0 mm or <10 mm for lymph nodes), the response will be set to CR irrespective of whether the criteria for PD of TL is also met for lymph node (i.e., if a lymph node LD increases by 20% but remains <10 mm).
Step 2: If some lesion measurements are missing but all other lesions meet the CR criteria (i.e., 0 mm or <10 mm for lymph nodes), the response will be set to NE irrespective of whether the criteria for PD is also met when referencing the sum of TL diameters.
Step 3: If not all lesions meet the CR criteria, and the sum of lesions meets the criteria for PD, the response will be set to PD.
Step 4: If, after steps 1 through 3, a response can still not be determined, the response will be set to remain as CR.
TL too big to measure
If a TL becomes too big to measure, this should be indicated in the database and an estimated size (‘x’) above which it cannot be accurately measured should be recorded. If using a value of x in the calculation of TL response would not give an overall visit response of PD, then this

Statistical Analysis Plan Study Code D419QC00002 Edition Number 4.0 Date 12 Apr 2019
22
will be flagged and reviewed by the study team. It is expected that a visit response of PD will remain in the vast majority of cases.
TL too small to measure
If a TL becomes too small to measure, a value of 5 mm will be entered into the database and used in TL calculations, unless the radiologist has indicated and entered a smaller value that can be reliably measured. If a TL response of PD results then this will be reviewed by the study team.
Irradiated lesions/lesion intervention
Previously irradiated lesions (i.e., lesion irradiated prior to entry into the study) should be recorded as NTLs and should not form part of the TL assessment.
Any TL (including lymph nodes) which has had intervention during the study (for example, irradiation/palliative surgery/embolization) should be handled in the following way and once a lesion has had intervention then it should be treated as having intervention for the remainder of the study, noting that an intervention will most likely shrink the size of tumours:
Step 1: the diameters of the TLs (including the lesions that have had intervention) will be summed and the calculation will be performed in the usual manner. If the visit response is PD this will remain as a valid response category.
Step 2: If there was no evidence of progression after step 1, treat the lesion diameter (for those lesions with intervention) as missing and, if ≤1/3 of the TLs have missing measurements, scale up as described in the scaling section below. If the scaling results in a visit response of PD then the patient would be assigned a TL response of PD.
Step 3: If after both steps PD has not been assigned, then, if appropriate (ie, if ≤1/3 of the TLs have missing measurements), the scaled sum of diameters as calculated in Step 2 should be used, and PR or SD then assigned as the visit response. Patients with intervention are evaluable for CR as long as all non-intervened lesions are 0 (or <10 mm for lymph nodes) and the lesions that have been subject to intervention also has a value of 0 recorded. If scaling up is not appropriate due to too few non-missing measurements then the visit response will be set to NE.
At subsequent visits the above steps will be repeated to determine the TL and overall visit response. When calculating the previous minimum, lesions with intervention should be treated as missing and scaled up (as per step 2 above).
Scaling (applicable only for irradiated lesions/lesion intervention)
If >1/3 of TL measurements are missing (because of intervention) then the TL response will be NE, unless the sum of diameters of non-missing TL would result in PD (ie, if using a value

Statistical Analysis Plan Study Code D419QC00002 Edition Number 4.0 Date 12 Apr 2019
23
of 0 for missing lesions, the sum of diameters has still increased by 20% or more compared to nadir and the sum of TLs has increased by ≥5 mm from nadir).
If ≤1/3 of the TL measurements are missing (because of intervention) then the results will be scaled up (based on the sizes at the nadir visit to give an estimated sum of diameters) and this will be used in calculations; this is equivalent to comparing the visit sum of diameters of the non-missing lesions to the nadir sum of diameters excluding the lesions with missing measurements.
Example of scaling
Lesion Longest diameter at nadir visit Longest diameter at follow-up visit 1 7.2 7.1 2 6.7 6.4 3 4.3 4.0 4 8.6 8.5 5 2.5 intervention Sum 29.3 26
Lesion 5 is missing at the follow-up visit.
The sum of lesions 1 to 4 at the follow-up visit is 26 cm. The sum of the corresponding lesions at the nadir visit is 26.8 cm.
Scale up as follows to give an estimated TL sum of 28.4 cm:
26
26.8× 29.3 = 28.4 cm
CR will not be allowed as a TL response for visits where there is missing data. Only PR, SD or PD (or NE) could be assigned as the TL visit response in these cases. However, for visits with 1/3 lesion assessments not recorded, the scaled up sum of TLs diameters will be included when defining the nadir value for the assessment of progression.
Lesions that split
If a TL splits into two or more parts, then the LDs of the split lesions should be summed and reported as the LD for the lesion that split.
Lesions that merge
If two or more TLs merge, then the LD of the merged lesion should be recorded for one of the TL sizes and the other TL size(s) should be recorded as 0 mm.
Change in method of assessment of TLs

Statistical Analysis Plan Study Code D419QC00002 Edition Number 4.0 Date 12 Apr 2019
24
CT, MRI and clinical examination are the only methods of assessment that can be used within a trial, with CT and MRI being the preferred methods and clinical examination only used in special cases. If a change in method of assessment occurs between CT and MRI this will be considered acceptable and no adjustment within the programming is needed.
If a change in method involves clinical examination (eg, CT changes to clinical examination or vice versa), any affected lesions should be treated as missing. The TL visit response may still be evaluable if the number of missing TL measurements at a visit is ≤1/3 of the total number of TLs.
3.1.1.2 Non-target lesions and new lesions At each visit, an overall assessment of the NTL response should be recorded by the Investigator. Table 3 provides the definitions of the criteria used to determine and record overall response for NTLs at the investigational site at each visit.
NTL response will be derived based on the investigator’s overall assessment of NTLs as follows:
Table 3 NTL visit responses
Visit Responses Description CR Disappearance of all NTLs since baseline. All lymph nodes must be
non-pathological in size (<10 mm short axis). Non CR/Non PD Persistence of one or more NTLs (with no evidence of progression). PD Unequivocal progression of existing NTLs. Unequivocal progression
may be due to an important progression in one lesion only or in several lesions. In all cases, the progression MUST be clinically significant for the physician to consider changing (or stopping) therapy.
NE Only relevant when one or some of the NTLs were not assessed and, in the Investigator’s opinion, they are not able to provide an evaluable overall NTL assessment at this visit. Note: For patients without TLs at baseline, this is relevant if any of the NTLs were not assessed at this visit and the progression criteria have not been met.
NA Only relevant if there are no NTLs at baseline. CR Complete response, NA Not applicable, NE Not evaluable, PD Progressive disease, NTL Non-target lesion
To achieve ‘unequivocal progression’ on the basis of NTLs, there must be an overall level of substantial worsening in non-target disease such that, even in presence of SD or PR in TLs, the overall tumour burden has increased sufficiently to merit a determination of progression. A modest ‘increase’ in the size of one or more NTLs is usually not sufficient to qualify for unequivocal progression status.

Statistical Analysis Plan Study Code D419QC00002 Edition Number 4.0 Date 12 Apr 2019
25
Details of any new lesions will also be recorded with the date of assessment. The presence of one or more new lesions is assessed as progression.
A lesion identified at a follow up assessment in an anatomical location that was not scanned at baseline is considered as a new lesion and will indicate disease progression.
The finding of a new lesion should be unequivocal: ie, not attributable to differences in scanning technique, change in imaging modality, or findings thought to represent something other than tumour.
New lesions will be identified via a Yes/No tick box. The absence and presence of new lesions at each visit should be listed alongside the TL and NTL visit responses.
A new lesion indicates progression so the overall visit response will be PD irrespective of the TL and NTL response.
If the question ‘Any new lesions since baseline’ has not been answered with Yes or No and the new lesion details are blank, this is not evidence that no new lesions are present and should be treated as NE in the derivation of overall visit response.
Symptomatic progression is not a descriptor for progression of NTLs: it is a reason for stopping study therapy and will not be included in any assessment of NTLs.
Patients with ‘symptomatic progression’ requiring discontinuation of treatment without objective evidence of disease progression at that time should continue to undergo tumour assessments, where possible, until objective disease progression is observed.

Statistical Analysis Plan Study Code D419QC00002 Edition Number 4.0 Date 12 Apr 2019
26
3.1.1.3 Overall visit response Table 4 defines how the previously defined TL and NTL visit responses will be combined with new lesion information to give an overall visit response.
Table 4 Overall visit response
Target lesions Non-target lesions New lesions Overall visit response
CR CR (or NA) No CR CR Non CR/Non PD or NE No (or NE) PR PR Non PD or NE No (or NE) PR SD Non PD or NE No (or NE) SD PD Any Any PD Any PD Any PD Any Any Yes PD NE Non PD No NE NA CR No CR NA Non CR/Non PD No SD NA NE No (or NE) NE NA NA No (or NE) NED
CR Complete response, NA Not applicable (only relevant if there were no NTLs at baseline), NE Not evaluable, NED No evidence of disease, PD Progressive disease, PR Partial response, SD Stable disease.
3.2 Efficacy variables 3.2.1 Primary endpoint 3.2.1.1 Objective response rate ORR is defined as the number (%) of patients with a confirmed investigator-assessed objective response of CR or PR and will based on patients in the FAS.
A confirmed response of CR/PR means that a response of CR/PR is recorded at one visit and confirmed by repeat imaging, preferably at the next regularly scheduled imaging visit, and not less than four weeks after the visit when the response was first observed, with no evidence of progression between the initial and CR/PR confirmation visit. Therefore, data obtained up to first progression (including unconfirmed), or the last evaluable assessment in the absence of progression, will be included in the assessment of ORR. Any patient who discontinues treatment without progression, receives a subsequent therapy, and then responds will not be included as a responder for the ORR (ie, both visits contributing to a response must be prior to subsequent therapy for the patient to be considered as a responder).
The denominator for ORR will be all patients in the FAS for the primary analysis.

Statistical Analysis Plan Study Code D419QC00002 Edition Number 4.0 Date 12 Apr 2019
27
A sensitivity analysis will be performed by assessing the ORR using the RECIST 1.1 – with data obtained up until progression, or the last evaluable assessment in the absence of progression, as for primary analysis - within a subgroup of FAS with baseline and at least one post-baseline RECIST 1.1 assessment. In this analysis, the denominator for the calculation of ORR will include those patients in the FAS who have baseline and at least one post-baseline RECIST 1.1 assessment.
3.2.2 Secondary endpoints 3.2.2.1 Duration of response DoR (per RECIST 1.1 according to the Investigator’s assessment) is defined as the time from the date of first documented response (which is subsequently confirmed) until the date of documented progression, or death in the absence of disease progression, in months and is calculated as follows:
𝐷𝑜𝑅 = 𝑑𝑎𝑡𝑒 𝑜𝑓 𝑃𝐹𝑆 𝑒𝑣𝑒𝑛𝑡 𝑜𝑟 𝑐𝑒𝑛𝑠𝑜𝑟𝑖𝑛𝑔 − 𝑑𝑎𝑡𝑒 𝑜𝑓 𝑓𝑖𝑟𝑠𝑡 𝑟𝑒𝑠𝑝𝑜𝑛𝑠𝑒 + 1
30.4375
The time of the initial response will be defined as the latest of the dates contributing toward the first visit response of CR or PR.
If a patient does not progress following a response, then their DoR will use the PFS censoring time (see section 3.2.2.4). DoR will not be defined for those patients who do not have documented response (which is subsequently confirmed).
Sensitivity analyses of DoR may be performed based on Investigator assessment according to RECIST 1.1 modified for confirmation of progression, as described for ORR in section 3.2.1.1.

Statistical Analysis Plan Study Code D419QC00002 Edition Number 4.0 Date 12 Apr 2019
28
3.2.2.2 Disease control rate DCR at 12 weeks is defined as the percentage of patients who have a best objective response of CR or PR in the first 13 weeks (to allow for a late assessment within the assessment window) or who have demonstrated SD for a minimum interval of 11 weeks (to allow for an early assessment within the assessment window) following the start of study treatment.
DCR will be determined programmatically based on RECIST 1.1 using site Investigator data and all data up until the first progression event.
Sensitivity analyses of DCR may be performed based on Investigator assessment according to RECIST 1.1 modified for confirmation of progression, as described in section 3.2.1.1.
3.2.2.3 Time to response TTR (per RECIST 1.1 as assessed by the Investigator) is defined as the time from the date of first dose until the first date of documented response (which is subsequently confirmed), in months and is calculated as follows:
𝑇𝑇𝑅 = date of DoR event – date of first dose + 1
30.4375
The date of first documented response should coincide with that used for the RECIST 1.1 DoR endpoint (see section 3.2.2.1).
TTR will not be defined for those patients who do not have documented response (which is subsequently confirmed).
3.2.2.4 Progression-free survival PFS (per RECIST 1.1 according to the Investigator’s assessment) is defined as the time from the date of the first dose of study treatment until the date of objective disease progression or death (by any cause in the absence of progression) regardless of whether the patient withdraws from allocated therapy or receives another anti-cancer therapy prior to progression, in months and is calculated as follows:
𝑃𝐹𝑆 = 𝑑𝑎𝑡𝑒 𝑜𝑓 𝑜𝑏𝑗𝑒𝑐𝑡𝑖𝑣𝑒 𝑑𝑖𝑠𝑒𝑎𝑠𝑒 𝑝𝑟𝑜𝑔𝑟𝑒𝑠𝑠𝑖𝑜𝑛 𝑜𝑟 𝑐𝑒𝑛𝑠𝑜𝑟𝑖𝑛𝑔 − 𝑑𝑎𝑡𝑒 𝑜𝑓 𝑓𝑖𝑟𝑠𝑡 𝑑𝑜𝑠𝑒 + 1
30.4375
Patients who have not progressed or died at the date of data cut-off (DCO) will be censored at the time of the latest date of assessment from their last evaluable RECIST 1.1 assessment.
However, if the patient progresses or dies after two or more missed visits, the patient will be censored at the time of the latest evaluable RECIST 1.1 assessment.

Statistical Analysis Plan Study Code D419QC00002 Edition Number 4.0 Date 12 Apr 2019
29
Given that the scheduled tumour assessment scheme differs by treatment arm (see Section 3.1), the definition of two missed visits will change.
Arm A
Up to and including Week 12, two missing visits will equate to 14 weeks (12 weeks +2 x1 weeks for visit window)).
From Week 12 onwards (when the scheduling is every eight-weekly assessments), two missing visits will equate to 18 weeks (i.e. 2 × 8 weeks + 2 x 1 week for visit window = 18 weeks).
Arm B
From Day 1 onwards (when the scheduling is every six-weekly assessments), two missing visits will equate to 14 weeks (i.e. 2 × 6 weeks + 2 x 1 week for visit window = 14 weeks).
Arm C
Up to and including Week 12, two missing visits will equate to 14 weeks (12 weeks + 2 x 1 week for visit window).
From Week 12 to Week 72 (inclusive) (when the scheduling is every eight-weekly assessments), two missing visits will equate to 18 weeks (i.e. 2 × 8 weeks + 2 x 1 week for visit window = 18 weeks).
From Week 72 onwards (when the scheduling is every twelve-weekly assessments), two missing visits will equate to 26 weeks (i.e. 2 × 12 weeks + 2 x 1 week for visit window = 26 weeks).
If the patient has no evaluable visits or does not have baseline data, they will be censored at Study Day 1 unless they die within two visits of baseline (12 weeks + 2 weeks allowing for a late assessment within the visit window, for Arm A, Arm B and Arm C).
The PFS time will always be derived based on scan/assessment dates not visit dates.
RECIST 1.1 assessments/scans contributing towards a particular visit may be performed on different dates. The following rules will be applied:
Date of progression will be determined based on the earliest of the dates of the component that triggered the progression on the first set of scans that indicate progression.
When censoring a patient for PFS, the patient will be censored at the latest of the dates contributing to a particular overall visit assessment.
In the absence of clinically significant deterioration, the investigational site is advised to continue the patients on their respective treatments until progression has been confirmed.

Statistical Analysis Plan Study Code D419QC00002 Edition Number 4.0 Date 12 Apr 2019
30
Sensitivity analyses of PFS may be performed based on Investigator assessment according to RECIST 1.1 modified for confirmation of progression, as described in section 3.2.1.1.
3.2.2.5 Overall survival OS is defined as the time from the date of the first dose of study treatment until death due to any cause, in months and is calculated as follows:
𝑂𝑆 = 𝑑𝑎𝑡𝑒 𝑜𝑓 𝑑𝑒𝑎𝑡ℎ 𝑜𝑟 𝑐𝑒𝑛𝑠𝑜𝑟𝑖𝑛𝑔 − 𝑑𝑎𝑡𝑒 𝑜𝑓 𝑓𝑖𝑟𝑠𝑡 𝑑𝑜𝑠𝑒 + 1
30.4375
Any patient not known to have died before the date of DCO for the analysis will be censored at the date last known alive, or DCO.
Note: Survival calls will be made in the week following the date of data cut-off for the analysis, and if patients are confirmed to be alive or if the death date is post the data cut-off date, these patients will be censored at the date of data cut-off. Death dates may be found by checking publicly available death registries.
3.3 Safety variables Safety and tolerability will be assessed in terms of AEs (including serious adverse events [SAEs]), deaths, laboratory data (including clinical chemistry, hematology and urinalysis), vital signs, ECGs and exposure. These will be collected for all patients.
Data from all cycles of treatment will be combined and the safety data will be presented by treatment arm.
The FAS will be used for reporting of safety data.
3.3.1 Adverse events AEs and SAEs will be collected from the time the informed consent is signed throughout the treatment period, and up to the follow-up period, ie 90 days after the last dose of durvalumab or tremelimumab for patients in Arm A; 30 days after the last dose of AZD1775 or CBDP for patients in Arm B; 30 days after the last dose of AZD6738 or olaparib for patients in Arm C.
On treatment, or treatment-emergent, AEs are defined as any AEs that started after the first dose of study treatment or started prior to treatment dosing that worsen following exposure to treatment, through 90 days after the last dose of durvalumab or tremelimumab for Arm A, up to 30 days after the last dose of AZD1775 or CBDP for Arm B, and up to 30 days after the last dose of AZD6738 or olaparib for Arm C.
The latest version of Medical Dictionary for Regulatory Activities (MedDRA) will be used to code the AEs. AEs will be graded according to the National Cancer Institute Common Terminology Criteria for AEs ([CTCAE] Version 4.03).

Statistical Analysis Plan Study Code D419QC00002 Edition Number 4.0 Date 12 Apr 2019
31
3.3.2 Adverse events of special interest AESIs for durvalumab ± tremelimumab include but are not limited to events with a potential inflammatory or immune-mediated mechanism and which may require more frequent monitoring and/or interventions such as steroids, immunosuppressants, and/or hormone replacement therapy. These AESIs are being closely monitored in clinical studies with durvalumab monotherapy and combination therapy.
AESIs for olaparib include but are not limited to events with myelodysplastic syndrome/acute myeloid leukaemia (MDS/AML), new primary malignancies other than MDS/AML, and pneumonitis. Astrazeneca medical team will review the AE data, flag the AESIs and send the listed preferred terms to PAREXEL programmer to merge to back to AE dataset.
3.3.3 Duration of exposure Exposure will be reported separately for each treatment arm. The duration of exposure will be calculated by date of the last dose – date of the first dose + # of days in the drug cycle - # of dosing days per each study drug as below. .
Intended exposure time (days) of durvalumab will be calculated as follows:
the total treatment period from the date of first dose of durvalumab to the earliest of (last dose date of durvalumab + 27 days, death date, DCO)
Intended exposure time (days) of tremelimumab will be calculated as follows:
the total treatment period from the date of first dose of tremelimumab to the earliest of (last dose date of tremelimumab + 27 days, death date, DCO)
Intended exposure time (days) of AZD1775 will be calculated as follows:
the total treatment period from the date of first dose of AZD1775 to the earliest of (last dose date of AZD1775 + 18 days, death date)
Intended exposure time (days) of CBDP will be calculated as follows:
the total treatment period from the date of first dose of CBDP to the earliest of (last dose date of CBDP + 20 days, death date)
Intended exposure time (days) of AZD6738 will be calculated as follows:
the total treatment period from the date of first dose of AZD6738 to the earliest of (last dose date of AZD6738 + 21 days, death date, DCO)
Intended exposure time (days) of olaparib will be calculated as follows:
the total treatment period from the date of first dose of olaparib to the earliest of (last dose date of olaparib, death date, DCO)
Statistical Analysis Plan Study Code D419QC00002 Edition Number 4.0 Date 12 Apr 2019
32
Exposure will also be measured by the number of cycles initiated. A cycle of durvalumab and tremelimumab corresponds to a period of 28 days (ie, four weeks); for AZD1775 and CBDP, a cycle corresponds to a period of 21 days (ie, three weeks); for AZD6738 and olaparib, a cycle corresponds to a period of 28 days (ie, four weeks). If a cycle is prolonged for any reason, this should still be counted as one cycle. A cycle will be counted if treatment is started even if the full dose is not delivered.
3.3.4 Dose intensity Dose intensity will be derived separately for each treatment arm for the initial treatment period and the re-treatment period for the immunotherapy agents (durvalumab/tremelimumab) as well as for AZD1775, CBDP, AZD6738 and olaparib. Relative dose intensity (RDI) is the percentage of the actual total dose delivered relative to the intended total dose through to a treatment duration. RDI will be defined as follows:
𝑅𝐷𝐼 (%) = 100 × 𝑑
𝐷
where d is the actual cumulative dose delivered up to the actual last day of dosing and will be calculated by summing doses for each drug and each patient; and D is the intended cumulative dose up to the actual last day of dosing. D is the total dose that would be delivered and will be calculated for each drug and each patient by planned dose * planned number of doses in the corresponding duration of each study drug. Laboratory variables
Laboratory data will be collected throughout the study, from screening to the follow-up visits as per study plan for each treatment arm described in the protocol. These include blood and urine samples for determination of clinical chemistry, haematology, and urinalysis (see Appendix A, Appendix B and Appendix C of the protocol). For the definition of baseline and the derivation of post baseline visit values considering visit window and how to handle multiple records, derivation rules as described in Section 3.3.7 will be used.
Original ranges and units from local labs will be recorded and presented in data listings. The low (below range), normal (within range or on limits of range) and high (above range) will be derived based on the original ranges.
All lab values and ranges will be converted to values in SI units at database (e.g., SDTM). All the lab data summaries will be based on the SI values.
Change from baseline in clinical chemistry (including liver function tests, serum amylase/lipase, Alanine aminotransferase (ALT), Aspartate aminotransferase (AST), Triiodothyronine (T3), Thyroxine (T4), Thyroid-stimulating hormone (TSH)) and hematology variables will be calculated for each post-dose visit on treatment. Common toxicity criteria (CTC) grades will be derived according to the CTCAE document (version 4.03).The

Statistical Analysis Plan Study Code D419QC00002 Edition Number 4.0 Date 12 Apr 2019
33
following parameters have CTC grades defined for both high and low values, so high and low CTC grades will be calculated: bicarbonate, haemoglobin, leucocytes, platelets, neutrophils, lymphocytes, TSH, T3, T4, potassium, sodium, magnesium, glucose and corrected calcium.
Corrected calcium (mmol/L) will be derived using the following formula (where total calcium is measured in mmol/L and albumin is measured in G/L):
𝐶𝑜𝑟𝑟𝑒𝑐𝑡𝑒𝑑 𝑐𝑎𝑙𝑐𝑖𝑢𝑚 = 𝑇𝑜𝑡𝑎𝑙 𝑐𝑎𝑙𝑐𝑖𝑢𝑚 + (40 − 𝑎𝑙𝑏𝑢𝑚𝑖𝑛) × 0.02
The maximum (or minimum) on-treatment value (depending on the direction of an adverse effect) will be defined for each laboratory parameter as the maximum (or minimum) post-dose value at any time.
3.3.5 ECG Arm A
Only baseline ECG will be performed routinely, and ECGs will only be collected if clinically indicated throughout the study. Therefore no formal reporting of ECG data will be performed for Arm A.
Arms B and C
ECG data obtained up until the 30 days from date of last dose of study treatments will be used for reporting. For the derivation of post-baseline visit values, considering visit windows, and to handle multiple records present in any visit window, derivation rules as described in Section 3.3.7 will be used.
The Fridericia QTc correction (QTcF) will be used by Investigators to enter the corrected QT and it will be calculated as follows (where RR is in seconds):
𝑄𝑇𝑐𝐹 = 𝑄𝑇
√𝑅𝑅3
3.3.6 Vital signs Vital signs data (blood pressure, pulse, temperature, and respiration rate) obtained up until the 30 days from the date of last dose of study treatments will be used for reporting. Change from baseline in vital signs variables will be calculated for each post-dose visit on treatment. For derivation of post-baseline visit values, considering visit window, and to handle multiple records, derivation rules as described in Section 3.3.7 will be used.
The denominator in vital signs summaries should include only those patients with recorded data.

Statistical Analysis Plan Study Code D419QC00002 Edition Number 4.0 Date 12 Apr 2019
34
3.3.7 General considerations for safety assessments Time windows will need defining for any presentations that summarise values by visit. The following conventions should also apply:
The time windows should be exhaustive so that data recorded at any time point has the potential to be summarised. Inclusion within the time window should be based on the actual date and not the intended date of the visit.
All unscheduled visit data should have the potential to be included in the summaries.
The window for the visits following baseline will be constructed in such a way that the upper limit of the interval falls half way between the two visits (the lower limit of the first post-baseline visit will be Day 2). If an even number of days exists between two consecutive visits then the upper limit will be taken as the midpoint value minus one day.
For summaries showing the maximum or minimum values, the maximum/minimum value recorded on treatment will be used (regardless of where it falls in an interval).
Listings should display all values contributing to a time point for a patient.
For visit-based summaries, if there is more than one value per patient within a time window then the value closest to the planned study day should be summarised, or the earlier in the event the values are equidistant from the planned study day. The listings should highlight the value for that patient that went into the summary table, wherever feasible.
For summaries at a patient level, all values should be included, regardless of whether they appear in a corresponding visit based summary, when deriving a patient level statistic such as a maximum.
The visit windows of safety assessments for ARM A, ARM B and ARM C per protocol scheduled visit:
ARM A:
Avisit Avisitn Target Day Window SCREENING 1 Day -28 to -1 CYCLE 1 2 1 Day 1* CYCLE 2 3 29 Day 2 to 14 +28 CYCLE 3 4 57 Day 15 +28 to 14 +28 +28 CYCLE 4 5 85 Day 15 +28 +28 to 14 +28 +28 +28 ….. Last visit: CYCLEx
x xxxxx (target date-cycle days/2) to (target date+ LDD+30-15).

Statistical Analysis Plan Study Code D419QC00002 Edition Number 4.0 Date 12 Apr 2019
35
Follow-up 98 Date of last dose +30
Date of last dose +15 to Date of last dose +30 +28
*If the CYCLE 1 value is missing use the value in the SCREENING.
ARM B:
Avisit Avisitn Target Day Window SCREENING 1 Day -28 to -1 C1D1 2 1 Day 1 C1D3 3 3 Day 2 to 5 C1D8 4 8 Day 6 to 11 C1D15 5 15 Day 12 to 18 C2D1 6 22 Day 19 to 25 C2D8 7 29 Day 26 to 35 C3D1 8 43 Day 36 to 44 C3D3 9 45 Day 45 to 47 C3D8 10 50 Day 48 to 56 C4D1 11 43 +21 Day 36 +21 to 44 +21 C4D3 12 45+21 Day 45 +21 to 47 +21 C4D8 13 50+21 Day 48 +21 to 56 +21 ….. Last visit: CxDy x xxxxx (target date-cycle days/2) to
(target date+ LDD+30-15). Follow-up 98 Date of last
dose +30 Date of last dose +15 to Date of last dose +30 +28
CxDy: Cycle x Day y, i.e., C1D1=Cycle 1 Day 1
ARM C:
Avisit Avisitn Target Day Window SCREENING 1 Day -28 to -1 C1D1 2 1 Day 1 C1D7 3 7 Day 2 to 11 C1D15 4 15 Day 12 to 22 C2D1 5 29 Day 23 to 43 C3D1 6 29 + 28 Day 44 to 71 C4D1 7 29 + 28 +28 Day 44+28 to 71+28 ….. Last visit: CxDy x xxxxx (target date-cycle days/2) to
(target date+ LDD+30-15). Follow-up 98 Date of last
dose +30 Date of last dose +15 to Date of last dose +30 +28
CxDy: Cycle x Day y, i.e., C1D1=Cycle 1 Day 1

Statistical Analysis Plan Study Code D419QC00002 Edition Number 4.0 Date 12 Apr 2019
36
Not all the safety assessments follow the protocol scheduled visits. For a particular assessment for an example, ECG, following algorism will be applied for deriving the visit window:
Lower border for X assessment: Min_X = Max_(X-1) +1
Diff_X = Day (Assessment_(X+1) – Day (Assessment_X)
Higher border for X assessment: Max_X = Day (Assessment_X) +
(Diff_X/2) -1 if Diff_X is an even number,
Or Integer part of (Diff_X/2) if Diff_X is an odd number
Baseline will be defined as the last non-missing measurement prior to dosing with study treatment. For laboratory data, any assessments made on Study Day 1, when time is not captured, will be considered pre-dose. Alternatively, if two visits are equally eligible to assess patient status at baseline (eg, screening and baseline assessments both on the same date prior to first dose with no washout or other intervention in the screening period), the average can be taken as a baseline value. Where safety data are summarised over time, study day will be calculated in relation to date of first study treatment.
Missing safety data, other than for partial dates, will generally not be imputed. However, safety assessment values of the form of “<x” (i.e., below the lower limit of quantification) or >x (i.e., above the upper limit of quantification) will be imputed as “x” in the calculation of summary statistics but displayed as “<x” or “>x” in the listings.
3.4 Biomarker variables Summaries and analyses for exploratory biomarkers will be documented in a separate analysis plan and will be reported in a separate report outside the clinical study report (CSR). The results of this biomarker research may be pooled with biomarker data from other studies to generate hypotheses to be tested in future research.
3.5 Pharmacokinetics and immunogenicity variables 3.5.1 Pharmacokinetic analysis Concentration data and summary statistics will be tabulated by nominal visit/timepoint for both treatment arms. Samples below the lower limit of quantification will be treated as missing in the analyses.
A population PK analysis is not planned for this study given the sparse PK sampling. However the PK, pharmacodynamics, safety and efficacy data collected in this study may be combined with similar data from other studies and explored using population PK and/or PK-pharmacodynamic analysis approach.

Statistical Analysis Plan Study Code D419QC00002 Edition Number 4.0 Date 12 Apr 2019
37
3.5.2 Immunogenicity analysis For Arm A only, immunogenicity samples will be measured for the presence of ADAs and ADA-neutralizing antibodies for durvalumab and tremelimumab using validated assays. ADA assessments will be conducted utilizing a tiered approach (screen, confirm, titer).
4. ANALYSIS METHODS
4.1 General principles The following general principles will be followed throughout the study:
All analyses will be descriptive, and no inferential analysis will be performed based on statistical tests. All evaluations will be exploratory in nature.
All summaries will be presented by treatment arm.
Continuous variables will be summarised by the number of observations, mean, standard deviation, median, minimum, and maximum. Categorical variables will be summarised by frequency counts and percentages for each category.
Unless otherwise stated, percentages will be calculated out of the population total for the corresponding treatment arm.
The minimum and maximum will be reported to the same number of decimal places as the raw data recorded in the database. The mean and median will be reported to one more decimal place, and the standard deviation will be reported to two more decimal places, than the raw data recorded in the database.
Percentages will be presented to one decimal place.
SAS® version 9.3 will be used for all analyses.
For time interval analyses in months, duration in months will be calculated as total duration in days/30.4375.
Study Day 1 is defined as the date of first dose of study treatment. For visits (or events) that occur on or after first dose, study day is defined as (date of visit [event] - date of first dose of study treatment + 1). For visits (or events) that occur prior to first dose, study day is defined as (date of visit [event] - date of first dose of study treatment). There is no Study Day 0.
Baseline is defined as the last assessment of the variable under consideration prior to the intake of the first dose of study treatment, except for efficacy variables. For efficacy variables, baseline is defined as the last visit prior to first dose of study treatment.

Statistical Analysis Plan Study Code D419QC00002 Edition Number 4.0 Date 12 Apr 2019
38
All data collected will be listed. Efficacy and safety data will be summarised and analysed based on the FAS. PK data will be summarised and analysed based on the PK Analysis Set.
The primary analysis of ORR will occur approximately 12 weeks after the last patient has initiated treatment. All study endpoints will be analysed at this time with the exception of OS. A final analysis of OS will take place when approximately 75% maturity for OS events is achieved or as determined by the Sponsor.
4.2 Analysis methods 4.2.1 Patient disposition The total number of patients screened, including screening failures, enrolled (i.e. patients with informed consent) consisting of patients assigned to treatment and patients not assigned to treatment, patients who received any study treatment and patients who did not receive any study treatment, patients who completed treatment and patients who discontinued treatment will be summarised. In addition, the number of patients in the FAS will also be provided.
The number and percentage of patients who discontinued treatment and the main reason for discontinuation as well as the number of patients included in the analysis populations and the number of patients recruited by country and center will be also presented.
4.2.2 Protocol deviations All identified important protocol deviations will be listed and summarised for the FAS. All protocol deviations will be defined by the study team and identified and classified as important or not important before database lock.
4.2.3 Demographics and other baseline characteristics Demographic and baseline patient characteristics (age, gender, race, ethnicity, height, weight[kg], weight group [<70, ≥70 – ≤90, >90], body mass index [BMI], Eastern Cooperative Oncology Group (ECOG) performance status (PS), previous cancer therapy, smoking history) will be summarised for the FAS.
Descriptive statistics will be presented for the continuous variables and total counts and percentages of patients will be presented for the categorical variables.
Additionally, the following variables will be summarised:
Age as a continuous variable Age by
o class (<50; ≥50 - <65; ≥65 - <75; ≥75 - <80, ≥80) and o class (<65; ≥65)

Statistical Analysis Plan Study Code D419QC00002 Edition Number 4.0 Date 12 Apr 2019
39
4.2.4 Medical history Relevant medical history (past and current) and relevant surgical history will be coded using the latest version of MedDRA.
All medical history will be summarised (number and percentage of patients) for the FAS by system organ class (SOC) and preferred term (PT).
All relevant surgical history will be summarised similarly.
4.2.5 Disease history The following disease characteristics will be summarised for all patients in the FAS (unless specified otherwise):
Disease characteristics at baseline (time from diagnosis to first dose of study treatment [months], American Joint Committee on Cancer [AJCC] stage, primary tumour location, histology type, best response to previous therapy [CR, PR, SD, PD, NE, NA])
Extent of disease upon entry to study [site of metastatic disease] Previous disease-related treatment modalities Number of regimens of previous chemotherapy
4.2.6 Concomitant medication Prior and concomitant medications are defined as follows:
Prior medications are medications taken prior to or during screening with a stop date prior to the first dose of study treatment
Concomitant medications are medications with a stop date on or after the date of first dose of study treatment (and could have started prior to or during treatment).
The medication with missing or partial medication stop date will be considered as concomitant medication. Concomitant medication will be summarised using frequency tables by Anatomical therapeutic chemical (ATC) classification code (based on World Health Organization [WHO] classification).
Concomitant medication data will be reviewed by Astrazeneca clinical team and prohibited concomitant medications will be identified and flagged.
Moreover, the following concomitant medications or therapies will be listeded:
Disallowed concomitant medications (other anti-cancer therapies, investigational agents, and radiotherapy should not be given while the patient is on study drug)
Post-treatment anti-cancer therapies (post-treatment medications are those with a start date after the last dose date of study treatment)

Statistical Analysis Plan Study Code D419QC00002 Edition Number 4.0 Date 12 Apr 2019
40
4.2.7 Exposure The following summaries will be produced for the FAS:
Total (or intended) duration of exposure to study treatments, by each treatment Actual duration of exposure to study treatments, by each treatment Number of cycles of study treatments initiated, by each treatment Number of and reasons for dose delays, interruptions, by each treatment Reductions of study treatments (AZD1775, CBDP, AZD6738 and olaparib), by each
treatment RDI of each treatment arm, for each AZ investigational product
4.2.8 Efficacy All efficacy analyses are exploratory, and will be performed on the FAS.
4.2.8.1 Objective response rate ORR will be estimated for each treatment arm with corresponding two-sided exact 95% confidence intervals (CIs). The analysis will be based on the programmatically derived ORR based on site Investigator assessments, and using all scans; regardless of whether they were scheduled or not. Two sensitivity analyses will be performed –on programmatically derived ORR RECIST 1.1 modified for confirmation of progression, and on ORR RECIST 1.1 for a subset of FAS patients without important protocol deviations (Section 4.2.9). The primary analysis population for ORR will be the FAS. The analysis population for the former sensitivity analysis - according to modified RECIST 1.1 - will also be the FAS. The analysis population for the second sensitivity analysis will be the FAS without important protocol deviations.
The summary will include all patients in the FAS for the primary and the RECIST modified sensitivity analysis while all patients in the FAS without important protocol deviations will be included in the protocol deviations related sensitivity analysis. Summaries will be produced that present the number and percentage of patients with a tumour response (CR/PR). The number (%) of patients with a confirmed response and the number (%) of patients with a single visit response (ie, an unconfirmed response) will also be presented.
4.2.8.2 Duration of response A Kaplan-Meier (KM) plot of DoR will be presented by treatment arm, if appropriate. The median (calculated from the KM plot, with 95% CIs), lower quartile and upper quartile will be presented for DoR, for patients with a response. Only patients who have a confirmed response will be included in this summary table.
4.2.8.3 Disease control rate The number and percentage of patients with each best objective response (BoR) category (CR, PR, SD, PD and NE) will be summarised for each treatment arm.

Statistical Analysis Plan Study Code D419QC00002 Edition Number 4.0 Date 12 Apr 2019
41
The DCR at 12 weeks will be summarised for each treatment arm.
4.2.8.4 Time to response TTR will be presented by treatment arm. The number and percentage of patients with TTR based on the site Investigator assessment of RECIST 1.1 will be summarised for each treatment arm by the scheduled assessment time point that the response was first observed. The median, minimum, maximum, lower quartile and upper quartile will also be presented for TTR, for patients with a response. Only patients who have a confirmed response will be included in this summary table.
4.2.8.5 Progression-free survival A KM plot of PFS will be presented by treatment arm. The total number of patients experiencing a PFS event and the type of event (RECIST progression or death), along with median PFS (calculated from the KM plot, with 95% CIs) will be presented. Moreover, the PFS rate at 6 and 12 months will be calculated along with the 95% CIs by using the Kaplan-Meier technique.
The total number of patients censored and the reasons for censoring (censored RECIST progression, censored death, progression-free at time of analysis, lots to follow-up, withdrawn consent) will also be summarised.
4.2.8.6 Overall survival A KM plot of OS will be presented by treatment arm. The total number of deaths, the number of patients still in survival follow-up, the number of patients who have withdrawn consent, and median OS (calculated from the KM plot, with 95% CIs) will be summarised for each treatment arm. Moreover, the OS rate at 6 and 12 months will be calculated along with the 95% CIs using Kaplan-Meier techniques.
The total number of patients censored and the reasons for censoring (still in survival follow-up, terminated prior to death, lost to follow-up, withdrawn consent) will also be summarised.
4.2.9 Sensitivity analyses Two sensitivity analyses will be performed: a) a sensitivity analysis on RECIST 1.1 modified for confirmation of progression on all patients in the FAS and b) a sensitivity analysis where, efficacy data on RECIST 1.1 will be summarised/analysed in a subgroup of FAS for patients without important protocol deviations. Protocol deviations will be reviewed by the clinical team before database lock to determine the patients who have important protocol divisions and will be excluded from the analysis population for this sensitivity analysis.
The above mentioned sensitivity analyses will be performed for ORR, DoR and DCR, to determine whether there is any difference in ORR, DoR and DCR when using a) progression confirmation rules and b) when only patients without important protocol deviations are included.

Statistical Analysis Plan Study Code D419QC00002 Edition Number 4.0 Date 12 Apr 2019
42
In particular, ORR, DoR and DCR will be assessed using the RECIST 1.1 site Investigator tumour data following a modification where any objective progression requires confirmation. Therefore, data obtained up until confirmed progression, or the last evaluable assessment in the absence of a confirmed progression, will be included in the assessment of ORR, DoR and DCR. Note that the response may be after an unconfirmed progression.
In addition, the following figures will be generated for each arm if needed.
Waterfall plot of best change from baseline in target lesion size (%) Spider plot of change in sum of target lesion diameter from baseline (%) Swimmer plot of patient profiles indicating time to first response, treatment duration,
off treatment, first PD, death or alive or censored.
4.2.10 Safety Safety data will be summarised for each treatment arm. No formal statistical analyses will be performed on the safety data. All safety and tolerability data will be presented separately for each treatment arm. Data from all cycles of treatment will be combined in the presentation of safety data. All safety summaries will use the FAS.
The following sections describe the planned safety summaries for AEs, vital signs, laboratory parameters, ECG and ECOG PS.
4.2.10.1 Adverse events The summary tables will include all AEs that first occurred or worsened after the start of treatment up until 90 days after discontinuation of study treatment for Arm A or 30 days after discontinuation of study treatment for Arm B or 30 days after discontinuation of study treatment for Arm C, or the initiation of the first subsequent cancer therapy following the discontinuation of treatment (whichever is first). This will more accurately depict AEs attributable to study treatment only, as a number of AEs up to 90 days following discontinuation of the immunotherapy agents/30 days after CBDP/AZD1775 or AZD6738/olaparib are likely to be attributable to subsequent therapy. Multiple events per patient will be counted once within that SOC and PT.
However, to assess the longer term toxicity profile, AE summaries will also be produced containing AEs observed up until 90 days following discontinuation of the immunotherapy agents (durvalumab and tremelimumab) or 30 days following discontinuation of AZD1775 and CBDP or 30 days following discontinuation of AZD6738 and olaparib (i.e., without taking subsequent therapy into account).
All reported AEs will be listed along with the date of onset (including study day), date of resolution (if AE is resolved), investigator’s assessment of CTCAE grade and relationship to study drug. Any events that occur after a patient has received further therapy for cancer (following discontinuation of study treatment) will be flagged.

Statistical Analysis Plan Study Code D419QC00002 Edition Number 4.0 Date 12 Apr 2019
43
Summaries of AEs and SAEs will be presented by SOC and PT. AEs leading to death and AEs leading to treatment discontinuation will also be summarised by SOC and PT.
AEs will be assigned CTCAE grades and summaries of the number and percentage of patients will be provided by maximum (most severe) reported CTCAE grade, SOC, PT and treatment arm.
Summaries of the rates of AEs per person-years at risk may be produced.
A separate data listing of AEs occurring more than until the time period specified in each specific study arm after discontinuation of IP will be produced. These events will not be included in AE summaries.
Adverse events of special interest
Adverse events of special interest for Arm A are the following:
Diarrhea / Colitis Pneumonitis / ILD Alanine aminotransferase (ALT)/ Aspartate aminotransferase (AST) increases /
hepatitis / hepatotoxicity Neuropathy / neuromuscular toxicity (i.e., events of encephalitis, peripheral motor and
sensory neuropathies, Guillain-Barré, and myasthenia gravis) Endocrinopathies (ie, events of hypophysitis, hypopituitarism, adrenal insufficiency,
diabetes insipidus, hyper- and hypothyroidism and type I diabetes mellitus) Rash / Dermatitis Nephritis / Blood creatinine increases Pancreatitis (or laboratory results suggestive of pancreatitis - increased serum lipase or
increased serum amylase) Other inflammatory responses that are rare with a potential immune-mediated
aetiology include, but are not limited to, myocarditis, pericarditis, and uveitis.
Adverse events of special interest for Arm C are the following:
MDS/AML New primary malignancies other than MDS/AML Pneumonitis.
In addition, infusion-related reactions and hypersensitivity/anaphylactic reactions with a different underlying pharmacological aetiology are also considered AESIs.
Summaries of the above mentioned AESIs will include number (%) of patients who have:
At least one AESI
At least one AESI causally related to any study treatment

Statistical Analysis Plan Study Code D419QC00002 Edition Number 4.0 Date 12 Apr 2019
44
At least one AESI leading to discontinuation of a study treatment
A summary of total duration (days) of selected AESI will be provided for events which have an end date, and this may be supported by summaries of ongoing AESIs at death and, separately, at data cut-off. Duration will be calculated as duration of the longest event if presented twice for the same patient.
Additionally, summaries of AESIs requiring immunosuppressive agents, steroids and/or hormone replacement therapy, with separate summary of AESIs requiring immunosuppressive agents at high doses will be presented.
Deaths
As a summary of deaths will be provided with the OS, a corresponding listing will also be produced. Deaths outside the period covered by the OS will be listed.
4.2.10.2 Laboratory evaluations Data obtained up until the 90 days following discontinuation of immunotherapy agents (i.e., the last dose of durvalumab + tremelimumab followed by durvalumab monotherapy) or 30 days following discontinuation of AZD1775 + CBDP or 30 days following discontinuation of AZD6738 + olaparib, or until the initiation of the first subsequent anti-cancer therapy following discontinuation of sub-study treatment (whichever occurs first) will be used for reporting. This will more accurately depict laboratory toxicities attributable to study treatment only as a number of toxicities up to 90 days following discontinuation of Arm A (durvalumab + tremelimumab followed by durvalumab monotherapy) or 30 days following discontinuation of Arm B (AZD1775 + CBDP) or 30 days following discontinuation of Arm C (AZD6738 + olaparib) are likely to be attributable to subsequent therapy.
Data summaries will be provided after conversion of lab results to corresponding project-wide preferred units.
Absolute values and change from baseline for all continuous haematology, clinical chemistry and urinalysis laboratory parameters will be summarised by treatment arm and visit.
Shift tables for laboratory values by worst CTC grade will be produced, and for specific parameters separate shift tables indicating hyper- and hypo- directionality of change will be produced. The laboratory parameters for which CTC grade shift outputs will be produced are:
Haematology: haemoglobin (hypo- and hyper-), lymphocytes (absolute count) (hypo- and hyper-), neutrophils (absolute count) (hypo- and hyper-), platelets (hypo- and hyper-), activated partial thromboplastin time, and international normalized ratio
Clinical chemistry: ALT, AST, alkaline phosphatase, amylase, lipase, leucocytes (hypo- and hyper-), total bilirubin, albumin, bicarbonate (hypo- and hyper-), magnesium (hypo- and hyper-), sodium (hypo- and hyper-), potassium (hypo- and

Statistical Analysis Plan Study Code D419QC00002 Edition Number 4.0 Date 12 Apr 2019
45
hyper-), corrected calcium (hypo- and hyper-), glucose (hypo- and hyper-), gamma-glutamyl transferase or gamma-glutamyl transpeptidase (GGT), creatinine
Thyroid function tests (hypo- and hyper-)
Liver function tests
For categorical urinalysis parameters (bilirubin, blood, glucose, ketones, and protein), a shift table may be produced comparing baseline value to the maximum on-treatment value.
For the parameters with no CTC grading available that are listed as being recorded in the protocol, shift tables from baseline to worst value on-treatment will be provided.
Hy's law
The following summaries will include the number (%) of patients who have:
Elevated ALT, AST, and total bilirubin during the study
o ALT ≥3x – ≤5x, >5x – ≤8x, >8x – ≤10x, >10x – ≤20x, and >20x upper limit of normal (ULN) during the study
o AST ≥3x – ≤5x, >5x – ≤8x, >8x – ≤10x, >10x – ≤20x, and >20x ULN during the study
o Total bilirubin ≥2x – ≤3x, >3x – ≤5x, >5x ULN during the study
o ALT or AST ≥3x – ≤5x, >5x – ≤8x, >8x – ≤10x, >10x – ≤20x, >20x ULN during the study
o ALT or AST ≥3x ULN and total bilirubin ≥2x ULN during the study (potential Hy’s law): the onset date of ALT or AST elevation should be prior to or on the date of total bilirubin elevation
Liver biochemistry test results over time for patients with elevated ALT or AST (i.e., ≥ 3 × ULN) and elevated total bilirubin (i.e., ≥ 2 × ULN) at any time will be plotted.
Individual patient data where ALT or AST plus total bilirubin are elevated at any time will be listed (i.e., ALT and/or AST ≥3 × ULN and total bilirubin ≥2 × ULN, at any time).
Plots of maximum post-baseline ALT and AST versus maximum post-baseline total bilirubin, expressed as multiples of ULN, will also be produced with reference lines at 3 × ULN for ALT and AST, and 2 × ULN for total bilirubin. In each plot, total bilirubin will be presented on the vertical axis.
4.2.10.3 ECG assessments Arm A

Statistical Analysis Plan Study Code D419QC00002 Edition Number 4.0 Date 12 Apr 2019
46
No outputs for ECG will be summarised.
Arms B and C
ECG data obtained up until the 30 day safety follow-up visit will be included in the summary tables.
Absolute values and change from baseline for QTcF will be summarised by treatment arm and visit.
The number and percentage of patients with normal, abnormal, not clinically significant and abnormal, clinically significant ECG results will be presented as a shift table from baseline to worst evaluation during the study.
4.2.10.4 Vital signs and weight Vital sign data obtained up until the 30 day safety follow-up visit will be included in the summary tables.
Absolute values and change from baseline for BP, pulse, temperature, respiration rate and weight will be summarised by treatment arm and visit.
4.2.10.5 ECOG performance status Absolute values and change from baseline for ECOG PS will be summarised by treatment arm and visit.
A shift table will present ECOG PS changes from baseline to the maximum value on treatment.
4.2.11
4.2.12 Pharmacokinetics and immunogenicity 4.2.12.1 Pharmacokinetic data PK concentration data will be listed for each patient at each visit, for the PK analysis set.
A summary of PK concentration-time profiles by visit and treatment arm will be provided for the PK analysis set.
CCI
CCI
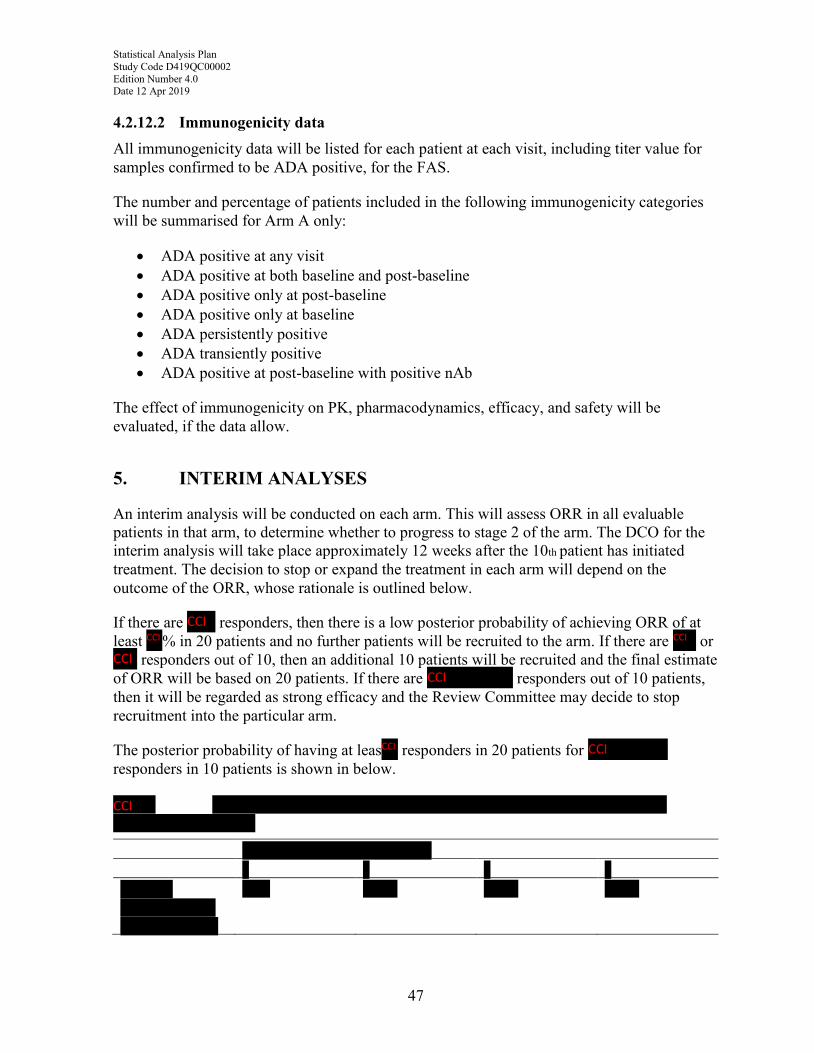
Statistical Analysis Plan Study Code D419QC00002 Edition Number 4.0 Date 12 Apr 2019
47
4.2.12.2 Immunogenicity data All immunogenicity data will be listed for each patient at each visit, including titer value for samples confirmed to be ADA positive, for the FAS.
The number and percentage of patients included in the following immunogenicity categories will be summarised for Arm A only:
ADA positive at any visit ADA positive at both baseline and post-baseline ADA positive only at post-baseline ADA positive only at baseline ADA persistently positive ADA transiently positive ADA positive at post-baseline with positive nAb
The effect of immunogenicity on PK, pharmacodynamics, efficacy, and safety will be evaluated, if the data allow.
5. INTERIM ANALYSES
An interim analysis will be conducted on each arm. This will assess ORR in all evaluable patients in that arm, to determine whether to progress to stage 2 of the arm. The DCO for the interim analysis will take place approximately 12 weeks after the 10th patient has initiated treatment. The decision to stop or expand the treatment in each arm will depend on the outcome of the ORR, whose rationale is outlined below.
If there are responders, then there is a low posterior probability of achieving ORR of at least % in 20 patients and no further patients will be recruited to the arm. If there are or
responders out of 10, then an additional 10 patients will be recruited and the final estimate of ORR will be based on 20 patients. If there are responders out of 10 patients, then it will be regarded as strong efficacy and the Review Committee may decide to stop recruitment into the particular arm.
The posterior probability of having at leas responders in 20 patients for responders in 10 patients is shown in below.
CCI
CCICCI
CCI
CCI CCI
CCI
CCI

Statistical Analysis Plan Study Code D419QC00002 Edition Number 4.0 Date 12 Apr 2019
48
If the Review Committee decides to recommend expansion of any given arm (for a maximum total of 40 eligible patients), no further interim analysis will be conducted and the entire expansion cohort (additional 20 patients) will be recruited with no break. Primary analysis will be ORR of all subjects recruited to the individual arm (i.e. 1st and 2nd stage cohorts plus the expansion cohort) after 12 weeks follow up of the last patient dosed in that arm. However, a sensitivity analysis may be performed to analyze the cohorts separately due to potential changes in population (e.g. due to differences in the 1st line therapy) between recruitment of the initial 2 cohorts and the expansion cohort of that arm.
6. CHANGES OF ANALYSIS FROM PROTOCOL (NOT APPLICABLE)
7. REFERENCES (NOT APPLICABLE)
8.
CCI
CCI