logistic regression analysis
DESCRIPTION
This presentation explains the concept of Logistic Regression Analysis, the goal behind Logistic Regression Analysis, and the underlying Assumptions. In addition, we provide an example that explains the Logistic Regression Analysis.TRANSCRIPT

Logistic Regression Analysis
-By
PIE TUTORS
…your statistical partner…
www.pietutors.com

OUTLINE
• Introduction
• Assumptions
• Model development
• Example
• References

Introduction• Logistic Regression is a statistical method for analyzing a dataset
in which there are one or more independent variables thatdetermine an outcome. The outcome is measured with adichotomous variable, where there are only two possible outcomes.
• The goal of logistic regression is to find the best fitting model todescribe the relationship between the dichotomous characteristic ofinterest, and a set of independent variables.
• Logistic Regression generates the coefficients of a formula topredict a Logit Transformation of the probability of presence of thecharacteristic of interest.
Assumptions
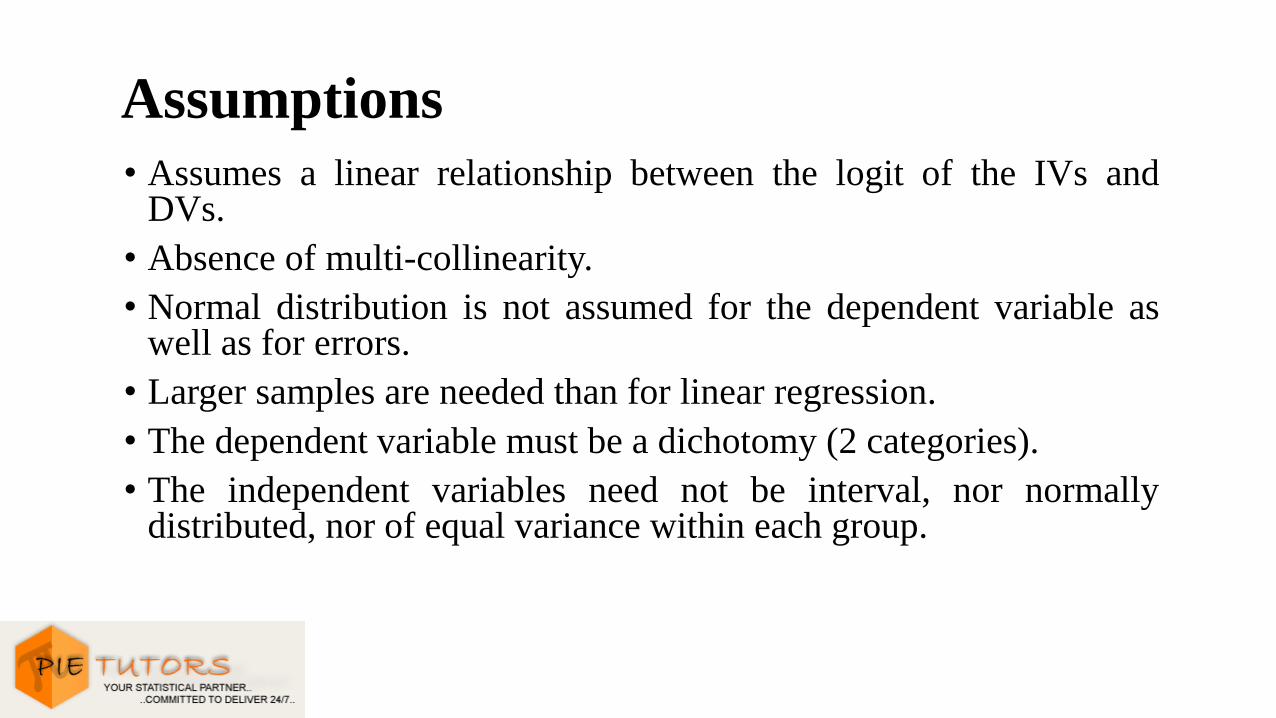
• Assumes a linear relationship between the logit of the IVs andDVs.
• Absence of multi-collinearity.
• Normal distribution is not assumed for the dependent variable aswell as for errors.
• Larger samples are needed than for linear regression.
• The dependent variable must be a dichotomy (2 categories).
• The independent variables need not be interval, nor normallydistributed, nor of equal variance within each group.

Model Development
1. Binary Logistic Regression
As Logistic Regression gives the formula to predict a logittransformation of probability of presence of character of interest, so,the model is,
𝑙𝑜𝑔𝑖𝑡 𝑝 = 𝑏0 + 𝑏1𝑥1+…….+𝑏𝑘𝑥𝑘In logistic regression, the dependent variable is in fact a logit, whichis a log of odds,
𝑙𝑜𝑔𝑖𝑡 𝑝 = 𝑙𝑛𝑝
1 − 𝑝

𝑝 =𝑒𝑙𝑜𝑔𝑖𝑡(𝑝)
1 + 𝑒𝑙𝑜𝑔𝑖𝑡(𝑝)
So, the required probability is-

2. Multinomial Logistic Regression
Multinomial logit regression is used when the dependent variable inquestion is nominal and for which there are more than twocategories.
Two additional assumptions:-
1. The multinomial logit model assumes that data are casespecific, that is, each independent variable has a single value foreach case.
2. There is no need for the independent variables to bestatistically independent from each other.
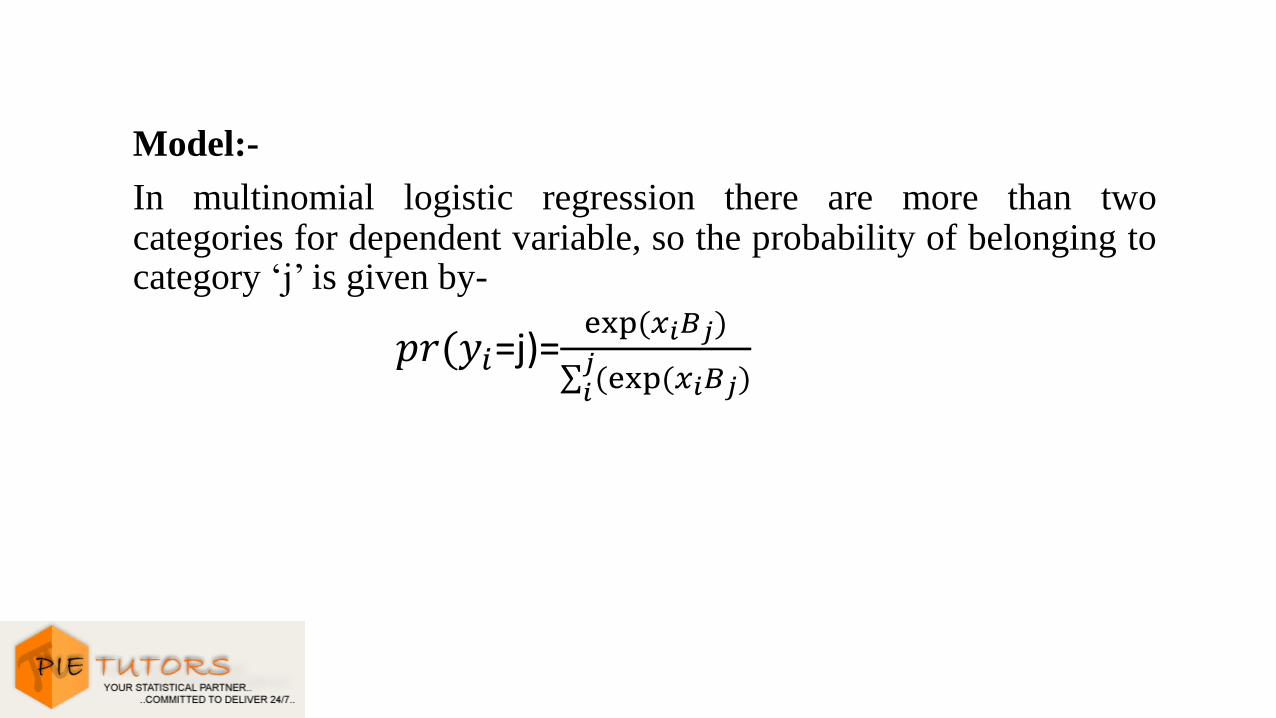
Model:-
In multinomial logistic regression there are more than twocategories for dependent variable, so the probability of belonging tocategory ‘j’ is given by-
𝑝𝑟(𝑦𝑖=j)=exp(𝑥𝑖𝐵𝑗)
𝑖𝑗(exp(𝑥𝑖𝐵𝑗)
Example
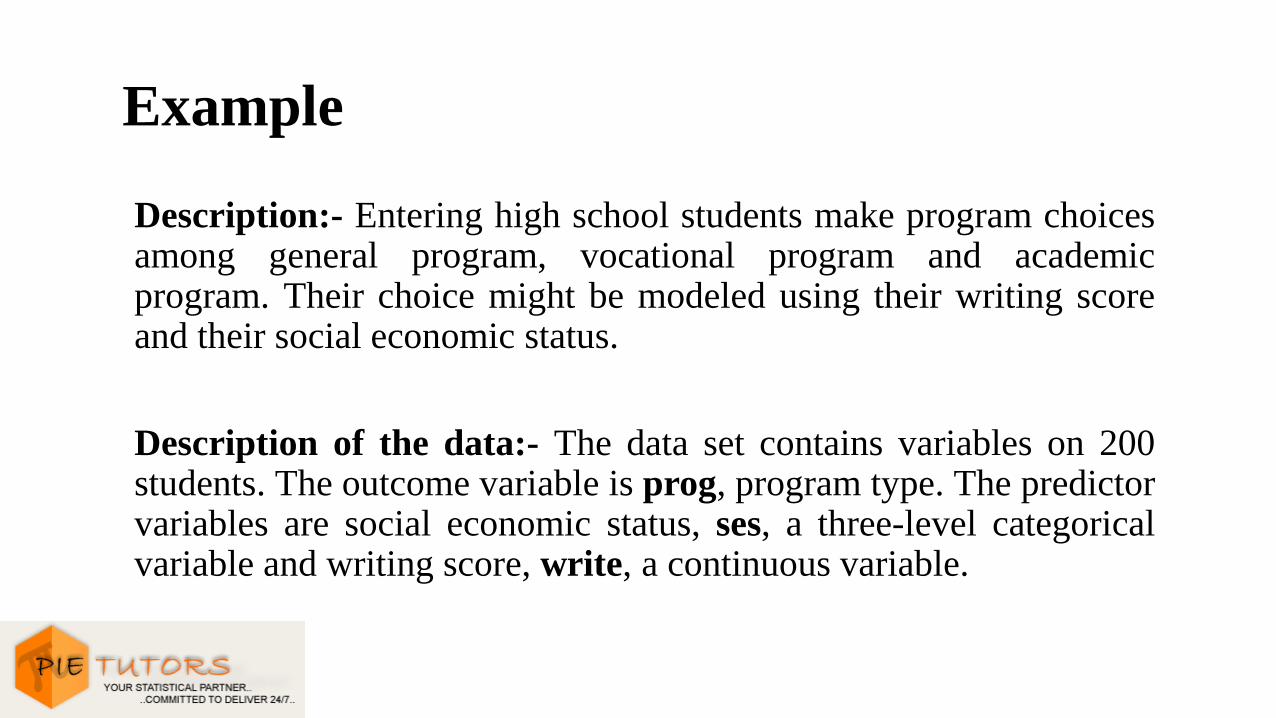
Description:- Entering high school students make program choicesamong general program, vocational program and academicprogram. Their choice might be modeled using their writing scoreand their social economic status.
Description of the data:- The data set contains variables on 200students. The outcome variable is prog, program type. The predictorvariables are social economic status, ses, a three-level categoricalvariable and writing score, write, a continuous variable.
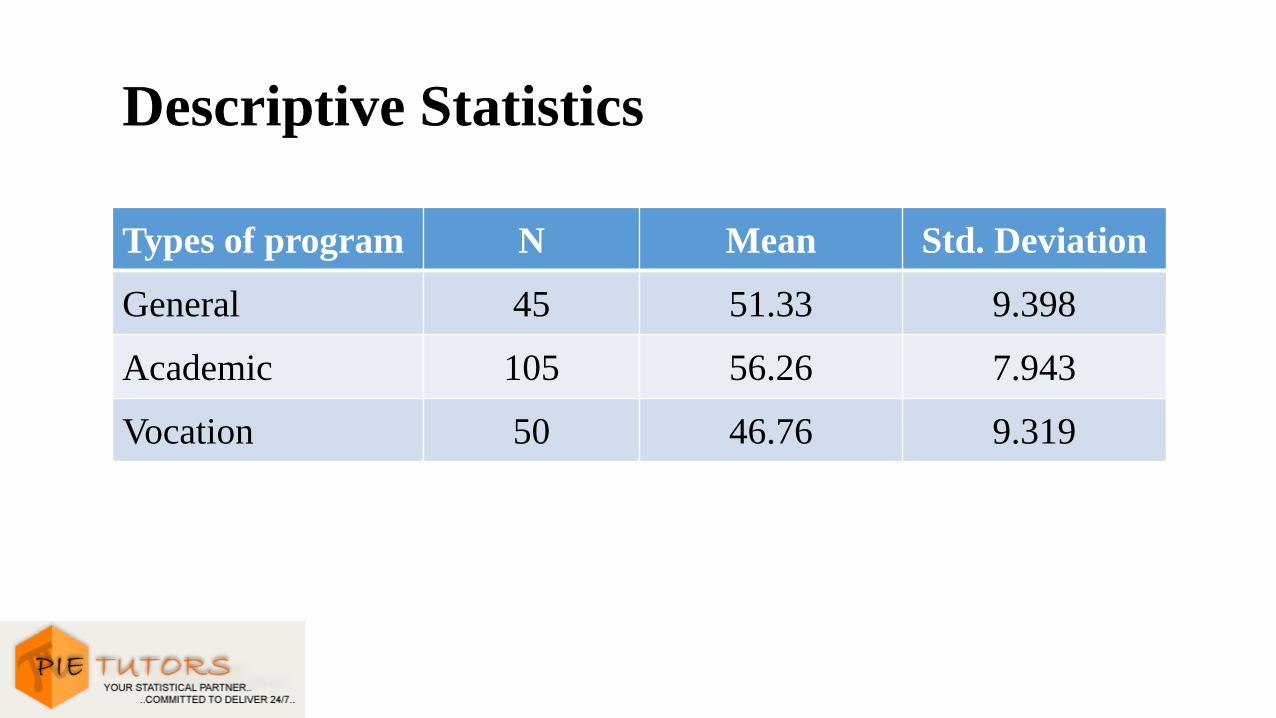
Descriptive Statistics
Types of program N Mean Std. Deviation
General 45 51.33 9.398
Academic 105 56.26 7.943
Vocation 50 46.76 9.319

Now, by using multinomial logit model-
modelFitting-criteria Likelihood ratio test
-2 log likelihood Chi-square df Sig.
Intercept only 254.986
Final 206.756 48.230 6 .000

Results• The Pseudo R- square value for the model is 0.21.
• The likelihood ratio chi-square of 48.23 with a p-value < 0.0001tells us that our model as a whole fits significantly better than anempty model. And the parameters are corresponding to twoequations:-
𝑙𝑛𝑃(𝑝𝑟𝑜𝑔=𝑔𝑒𝑛𝑒𝑟𝑎𝑙)
𝑃(𝑝𝑟𝑜𝑔=𝑎𝑐𝑎𝑑𝑒𝑚𝑖𝑐)=𝑏10+𝑏11(𝑠𝑒𝑠 = 1)+𝑏12(𝑠𝑒𝑠 = 2)+𝑏13 𝑤𝑟𝑖𝑡𝑒
𝑙𝑛𝑃(𝑝𝑟𝑜𝑔=𝑣𝑜𝑐𝑎𝑡𝑖𝑜𝑛)
𝑃(𝑝𝑟𝑜𝑔=𝑎𝑐𝑎𝑑𝑒𝑚𝑖𝑐)=𝑏20+𝑏21(𝑠𝑒𝑠 = 1)+𝑏22(𝑠𝑒𝑠 = 2)+𝑏23 𝑤𝑟𝑖𝑡𝑒
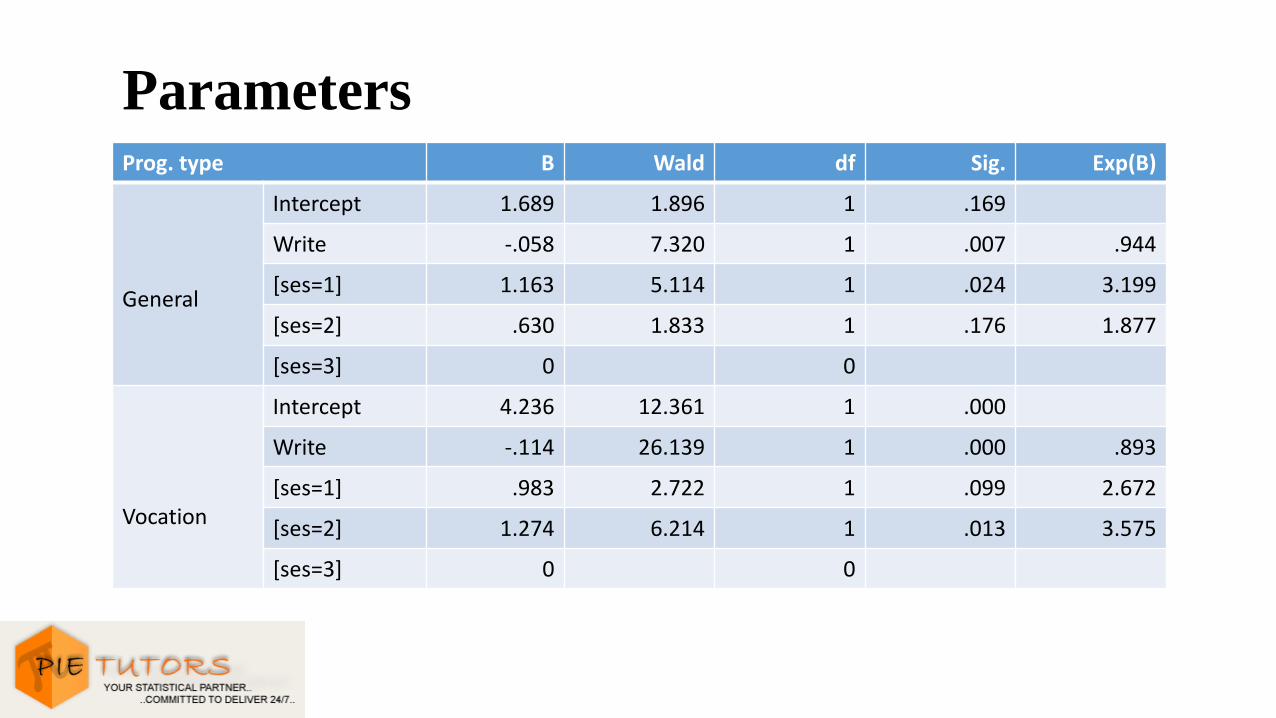
ParametersProg. type B Wald df Sig. Exp(B)
General
Intercept 1.689 1.896 1 .169
Write -.058 7.320 1 .007 .944
[ses=1] 1.163 5.114 1 .024 3.199
[ses=2] .630 1.833 1 .176 1.877
[ses=3] 0 0
Vocation
Intercept 4.236 12.361 1 .000
Write -.114 26.139 1 .000 .893
[ses=1] .983 2.722 1 .099 2.672
[ses=2] 1.274 6.214 1 .013 3.575
[ses=3] 0 0

Interpretation
• A one-unit increase in the variable write is associated with a .058decrease in the relative log odds of being in general program versusacademic program .
• A one-unit increase in the variable write is associated with a .1136decrease in the relative log odds of being in vocation programversus academic program.
• The relative log odds of being in general program versus inacademic program will increase by 1.163 if moving from thehighest level of ses (ses = 3) to the lowest level of ses (ses = 1).

References
1. http://www.schatz.sju.edu/multivar/guide/Logistic.pdf
2. http://www.ats.ucla.edu/stat/spss/dae/mlogit.htm

Are you looking for a Statistical Consultant who can help you run a
Logistic Regression Analysis?Contact Us: [email protected]
Visit Us: www.pietutors.com