logistic regression without interaction (homogeneous association model) 1 for i = 2, if we want to...
TRANSCRIPT
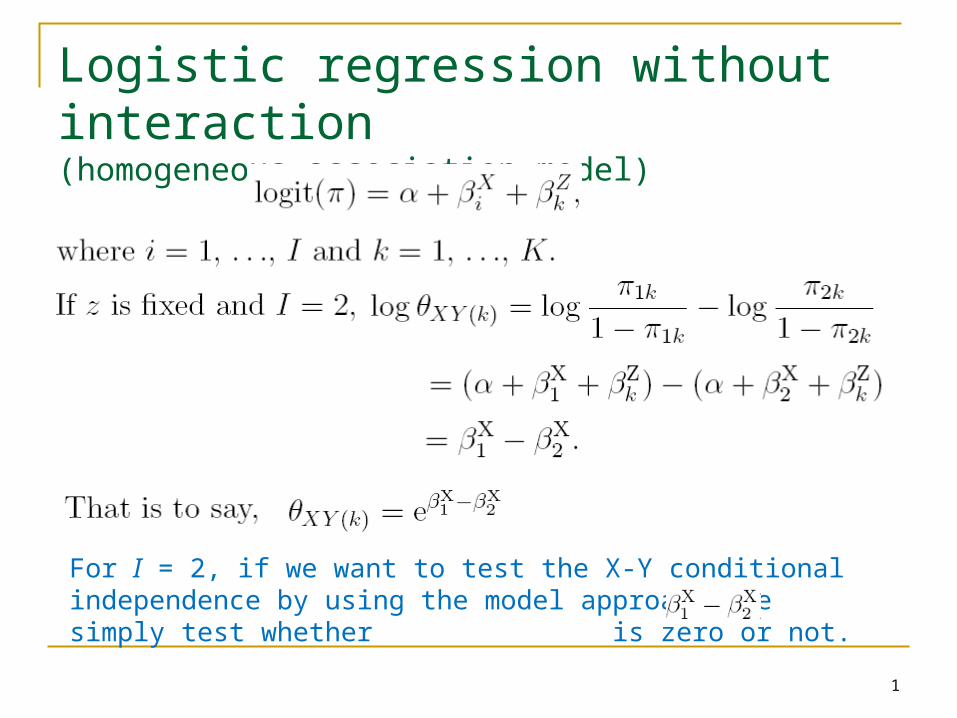
Logistic regression without interaction(homogeneous association model)
1
For I = 2, if we want to test the X-Y conditional independence by using the model approach, we simply test whether is zero or not.
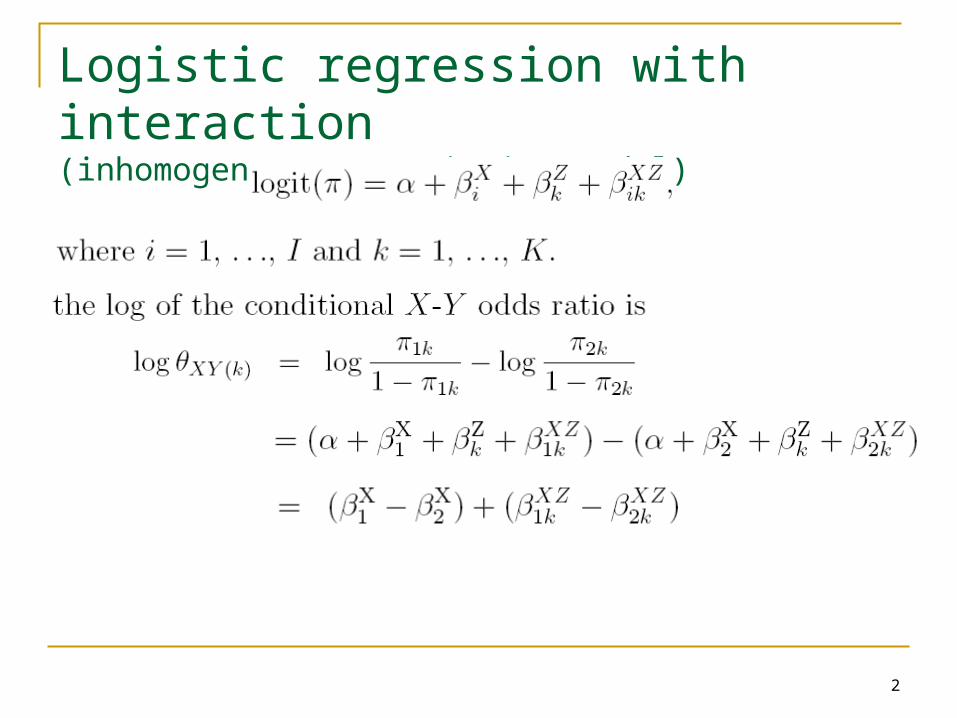
Logistic regression with interaction(inhomogeneous association model)
2
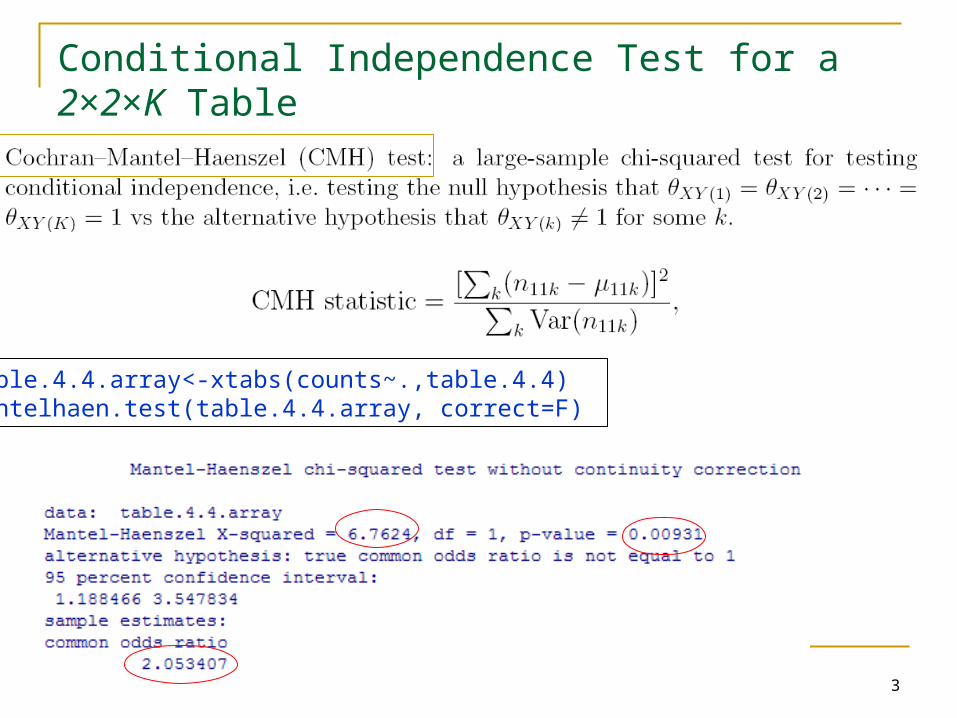
Conditional Independence Test for a 2×2×K Table
3
table.4.4.array<-xtabs(counts~.,table.4.4)mantelhaen.test(table.4.4.array, correct=F)
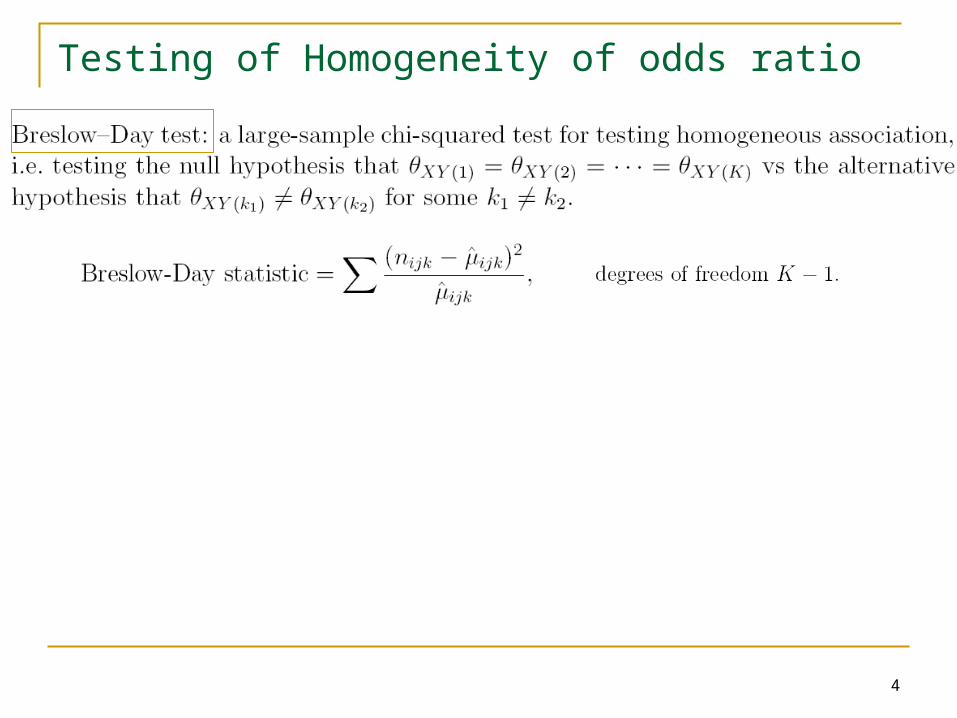
Testing of Homogeneity of odds ratio
4
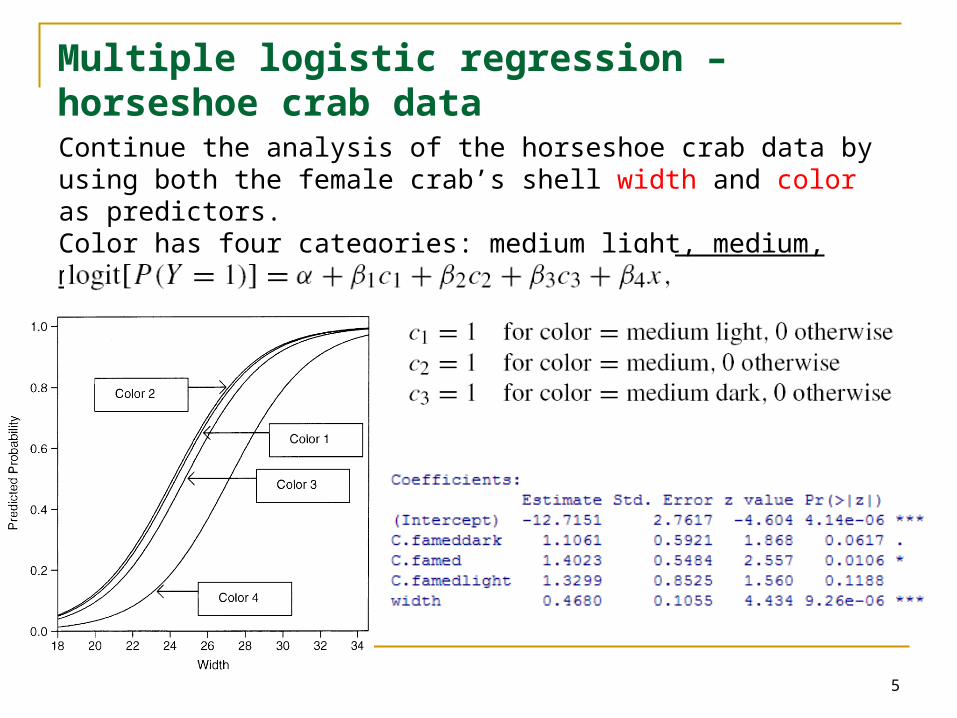
Multiple logistic regression – horseshoe crab data
5
Continue the analysis of the horseshoe crab data by using both the female crab’s shell width and color as predictors. Color has four categories: medium light, medium, medium dark, dark.
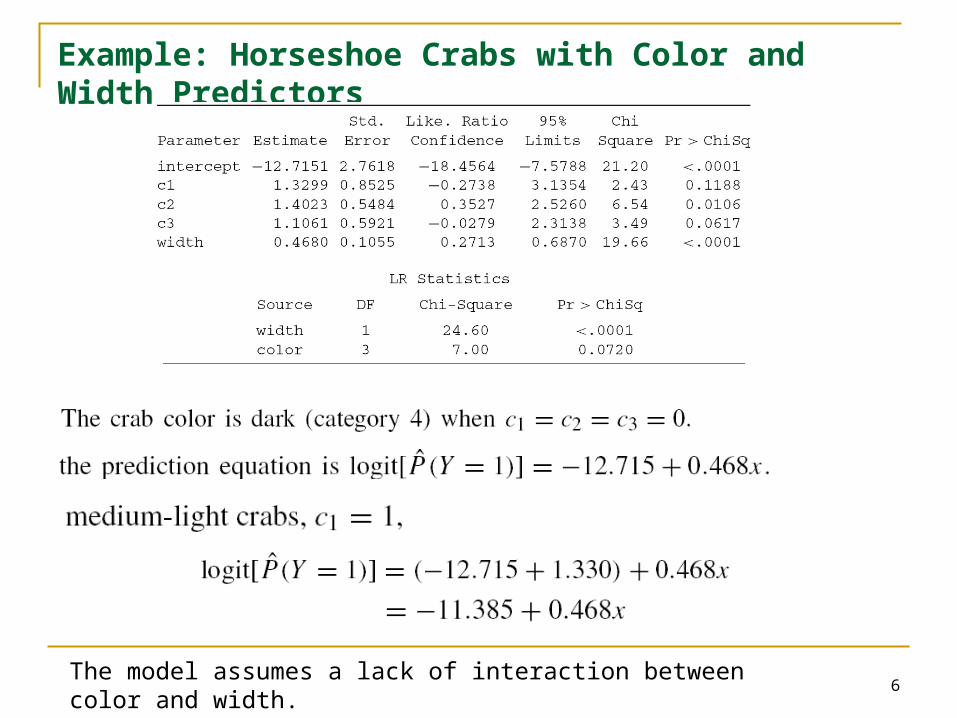
Example: Horseshoe Crabs with Color and Width Predictors
6The model assumes a lack of interaction between color and width.
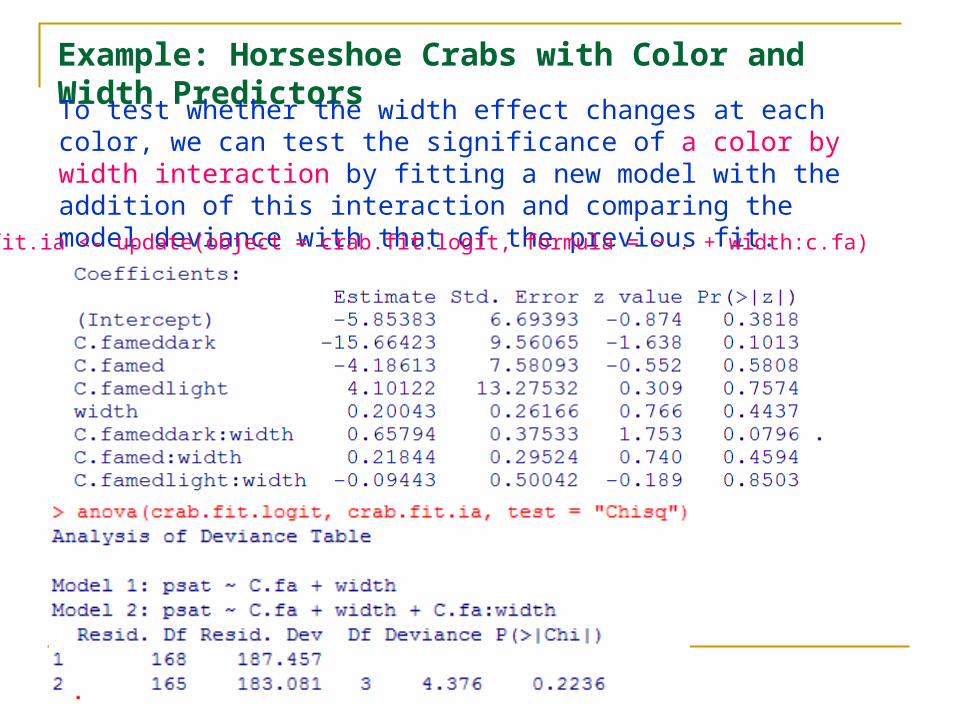
Example: Horseshoe Crabs with Color and Width PredictorsTo test whether the width effect changes at each color, we can test the significance of a color by width interaction by fitting a new model with the addition of this interaction and comparing the model deviance with that of the previous fit.> crab.fit.ia <- update(object = crab.fit.logit, formula = ~ . + width:c.fa)
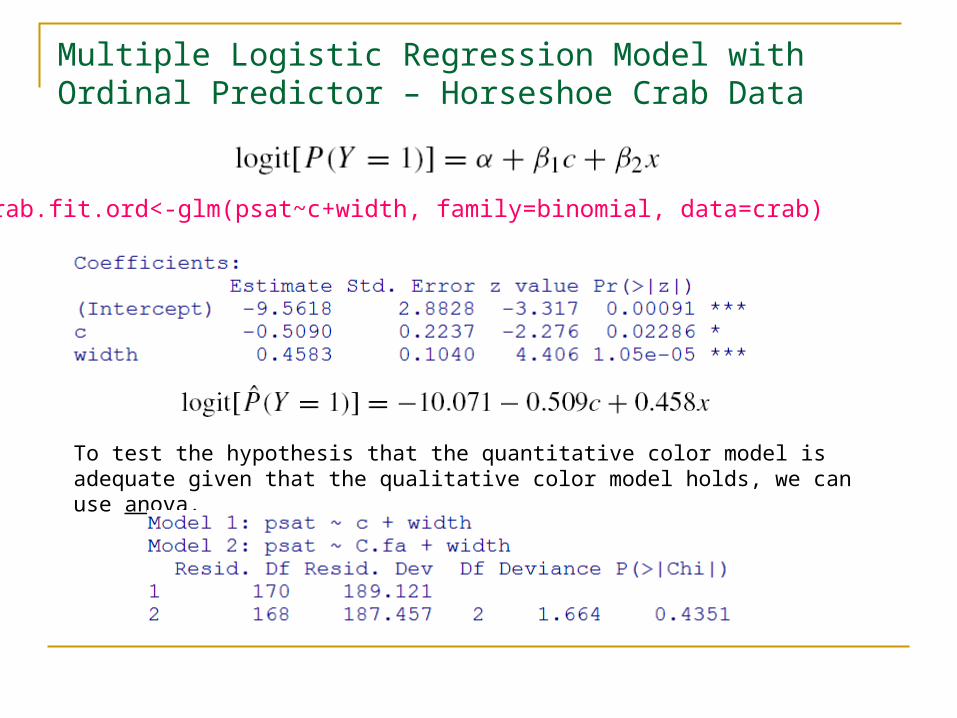
Multiple Logistic Regression Model with Ordinal Predictor – Horseshoe Crab Data
crab.fit.ord<-glm(psat~c+width, family=binomial, data=crab)
To test the hypothesis that the quantitative color model is adequate given that the qualitative color model holds, we can use anova.
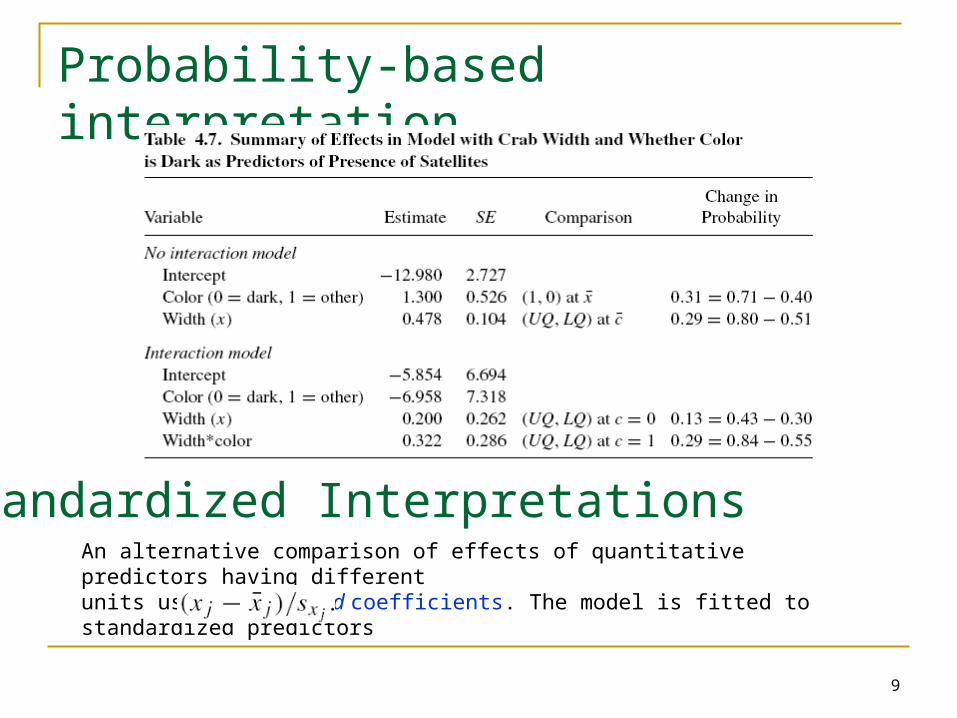
Probability-based interpretation
9
Standardized InterpretationsAn alternative comparison of effects of quantitative predictors having differentunits uses standardized coefficients. The model is fitted to standardized predictors
Model Selection for Horseshoe Crab Data
10
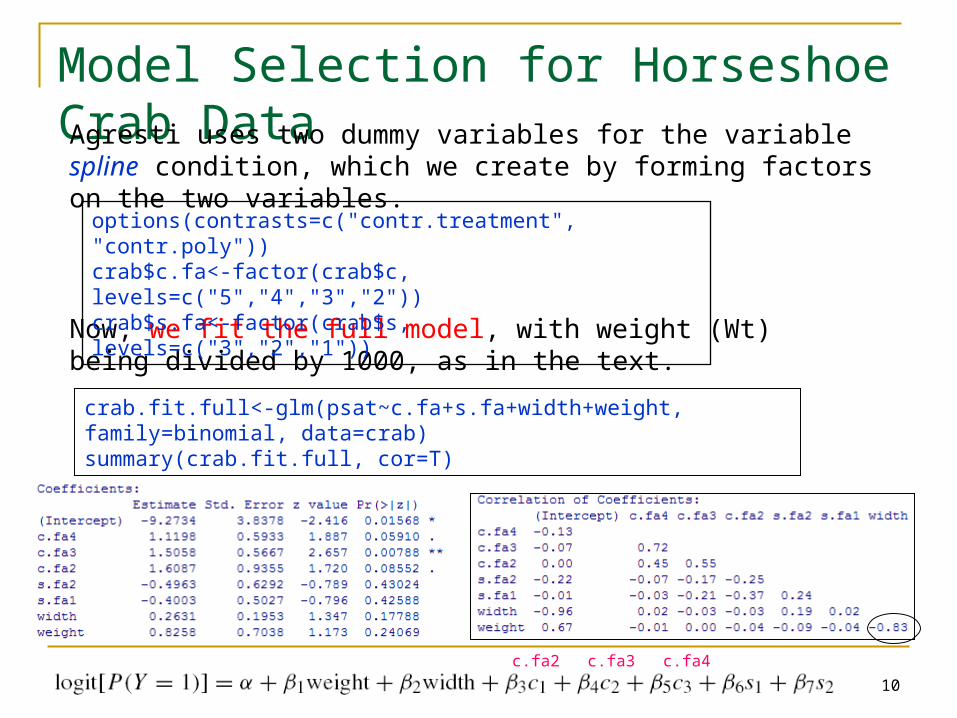
Agresti uses two dummy variables for the variable spline condition, which we create by forming factors on the two variables.
Now, we fit the full model, with weight (Wt) being divided by 1000, as in the text.
options(contrasts=c("contr.treatment", "contr.poly"))crab$c.fa<-factor(crab$c, levels=c("5","4","3","2"))crab$s.fa<-factor(crab$s, levels=c("3","2","1"))
crab.fit.full<-glm(psat~c.fa+s.fa+width+weight, family=binomial, data=crab)summary(crab.fit.full, cor=T)
c.fa4c.fa3c.fa2
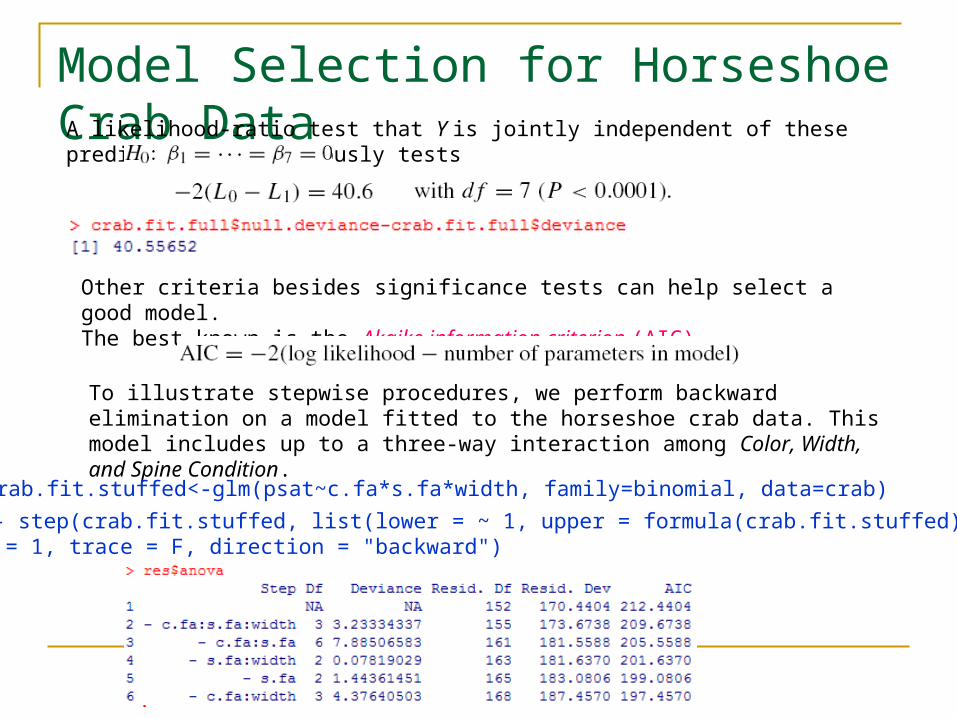
Model Selection for Horseshoe Crab DataA likelihood-ratio test that Y is jointly independent of these predictors simultaneously tests
Other criteria besides significance tests can help select a good model. The best known is the Akaike information criterion (AIC).
To illustrate stepwise procedures, we perform backward elimination on a model fitted to the horseshoe crab data. This model includes up to a three-way interaction among Color, Width, and Spine Condition.
crab.fit.stuffed<-glm(psat~c.fa*s.fa*width, family=binomial, data=crab)
res <- step(crab.fit.stuffed, list(lower = ~ 1, upper = formula(crab.fit.stuffed)), scale = 1, trace = F, direction = "backward")
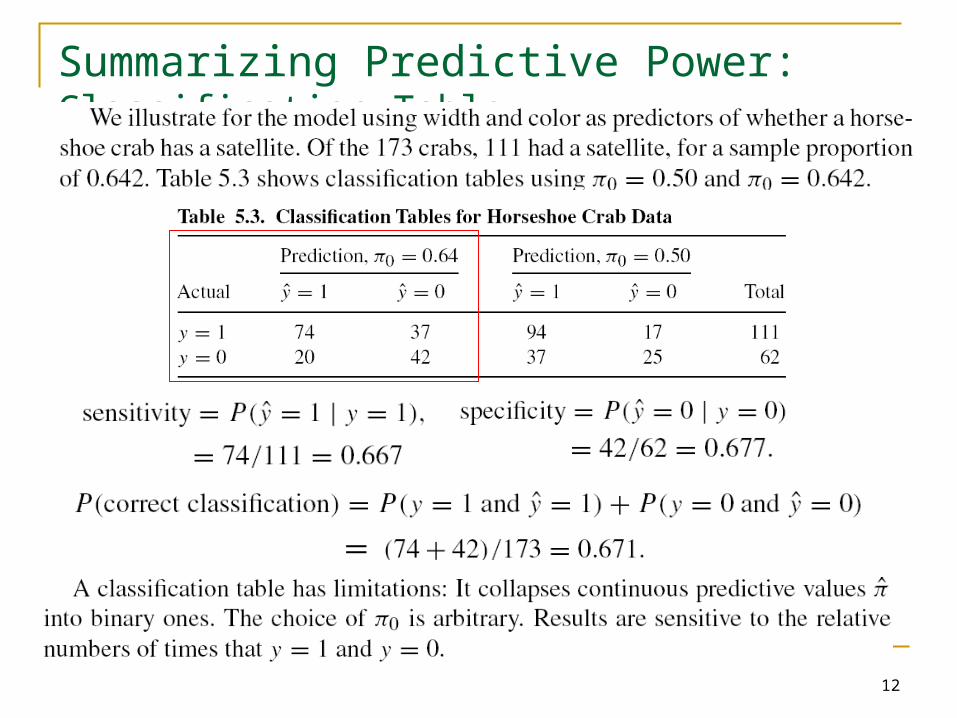
Summarizing Predictive Power: Classification Table
12
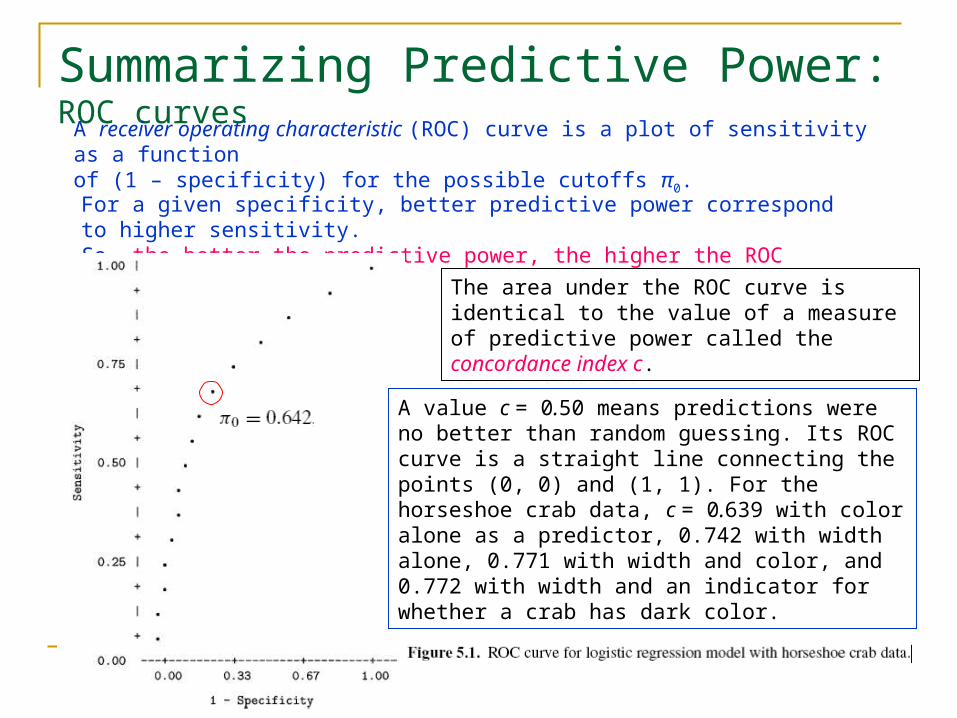
Summarizing Predictive Power: ROC curves
A receiver operating characteristic (ROC) curve is a plot of sensitivity as a functionof (1 – specificity) for the possible cutoffs π0.
For a given specificity, better predictive power correspond to higher sensitivity.So, the better the predictive power, the higher the ROC curve.
The area under the ROC curve is identical to the value of a measure of predictive power called the concordance index c.
A value c = 0.50 means predictions were no better than random guessing. Its ROC curve is a straight line connecting the points (0, 0) and (1, 1). For the horseshoe crab data, c = 0.639 with color alone as a predictor, 0.742 with width alone, 0.771 with width and color, and 0.772 with width and an indicator for whether a crab has dark color.