logistics real estate investing for supply chain managersjjb/classes/6340/talk/idi-g.pdf ·...
TRANSCRIPT

Logistics Real Estate Investing for Supply Chain Managers
March 15th, 2017
Derrick Perkins
Vice President, Investments
(404)479-4121

2
Logistics Real Estate Investing for Supply Chain Managers
• About IDI Gazeley
• Real Estate from the Investors Point of View
• Real Estate Fundamentals
• Case Study: Developing a Building
• Global Differences
Presentation Outline

3
Growing Together
https://www.youtube.com/watch?v=EjQLgbZH8gY

4
30BROOKFIELD PORT TERMINALS IN OUR MARKETS
13MARKET OFFICES
A truly global logistics real estate platform
50 MSFOPERATING PORTFOLIO
(4.6 MILLION SQ M)
45 MSFDEVELOPMENT LAND
(4.2 MILLION SQ M)
Map of Holdings
UNITED STATESHeadquartered in Atlanta
185 MSF (17 million SQ M) developed
750 facilities developed and acquired
30 MSF (2.8 million SQ M) land bank
CHINAHeadquartered in Shanghai
3.0 MSF (282,400 SQ M) developed
8 facilities developed
500,000 SF (46,000 SQ M) land bank
FRANCEHeadquartered in Paris
6.2 MSF (576,000 SQ M) developed
39 facilities developed and acquired
6 MSF (557,000 SQ M) land bank
UNITED KINGDOMHeadquartered in London
56 MSF (5.2 million SQ M)
developed
130 facilities developed and acquired
3.8 MSF (357,000 SQ M) land bank
GERMANYHeadquartered in Frankfurt
7.1 MSF (660,000 SQ M) developed
28 facilities developed and acquired
2.3 MSF (213,000 SQ M) land bank
NETHERLANDS15 facilities totaling 2.3 MSF (2.1 million SQ M)

5
Brookfield is a global alternative asset manager with $250 billion in assets under management.
They have four main businesses: property, infrastructure, renewable power and private equity.
As a portfolio company of Brookfield, we are part of one of the world's largest and most
sophisticated owners, operators, and investors in real estate.
Brookfield Asset Management
Brookfield Property
Partners 1
Private Institutional
Funds
Brookfield Property
Group
Brookfield Renewable
Energy Group
Brookfield Renewable
Energy Partners
(“BREP”) 1
Private Institutional
Funds
Brookfield
Infrastructure Group
Brookfield Infrastructure
Partners (“BIP”) 1
Private Institutional
Funds
Brookfield
Capital Group
(1) Flagship publicly listed entities
Brookfield
Brookfield Business Partners (“BBP”) 1
Private Institutional
Funds
6
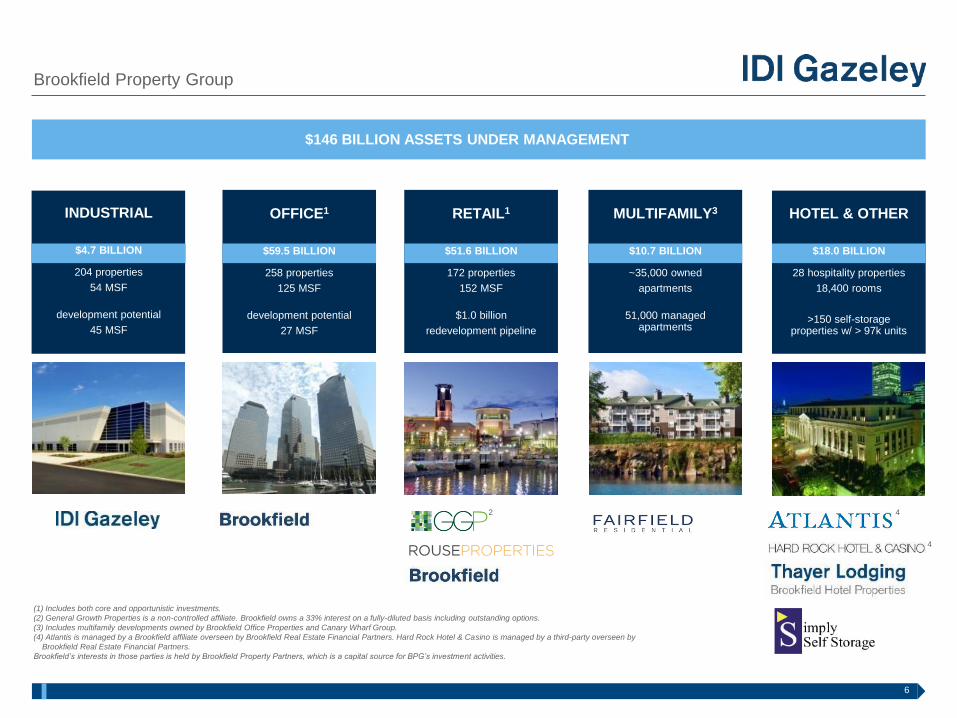
Brookfield Property Group
$146 BILLION ASSETS UNDER MANAGEMENT
OFFICE1
$59.5 BILLION
258 properties
125 MSF
development potential
27 MSF
RETAIL1
$51.6 BILLION
172 properties
152 MSF
$1.0 billion
redevelopment pipeline
MULTIFAMILY3
$10.7 BILLION
~35,000 owned
apartments
51,000 managed apartments
INDUSTRIAL
$4.7 BILLION
204 properties
54 MSF
development potential
45 MSF
HOTEL & OTHER
$18.0 BILLION
28 hospitality properties
18,400 rooms
>150 self-storage properties w/ > 97k units
(1) Includes both core and opportunistic investments.
(2) General Growth Properties is a non-controlled affiliate. Brookfield owns a 33% interest on a fully-diluted basis including outstanding options.
(3) Includes multifamily developments owned by Brookfield Office Properties and Canary Wharf Group.
(4) Atlantis is managed by a Brookfield affiliate overseen by Brookfield Real Estate Financial Partners. Hard Rock Hotel & Casino is managed by a third-party overseen by
Brookfield Real Estate Financial Partners.
Brookfield’s interests in those parties is held by Brookfield Property Partners, which is a capital source for BPG’s investment activities.
2
4
4

7
The Brookfield Advantage
BROOKFIELD LOGISTICS PROPERTIES60 MSF global operating portfolio
PORTS30 Brookfield port terminals
worldwide
GENERAL GROWTH PROPERTIES
(RETAIL)154 MSF portfolio
FAIRFIELD RESIDENTIAL50,000 managed and owned apartments
Being part of Brookfield ties all parts of IDI Gazeley’s business together
and leverages global relationships with local expertise.

8
E-commerce
Retail +
Consumer Goods
3PL
Healthcare +
Food
Automotive
More than 60% of our projects are with repeat customers from all major industries
Repeat Customers

Real Estate from the Investors Point of View

10
Who?
– Individuals through Public REITS (Prologis, Duke, First Industrial East Group)
– Institutional
• Pension Funds
• Retirement Funds
• Sovereign Wealth
– High Net Worth / Family Office
Why?
– Alternative / Hard Assets
– Bond Like Performance
– Inflation Hedge
Investing in Real Estate
1.8% 2.4%1.4%
0.7%2.1%
-1.2%
3.9%
9.2%
12.9%
9.6%
3.3%
10.1%
20.9%
7.8%7.2%
9.5%
14.2%
6.4% 6.0% 6.4%7.2%
-2%
0%
2%
4%
6%
8%
10%
12%
14%
16%
18%
20%
22%
NPI LeveragedNPI
NCREIFFarmland
NCREIFTimberland
NFI-ODCE -gross of
fees
NAREITEquity REIT
Index
S&P 500Index
3Q 2016 1-Year 10-Year

11
Why Industrial?
– Unique demand drivers from other property types (Office, Retail, Multifamily, Hotel)
– Lower Investment (Initial, CapEx)
– Different Size Buildings = Different Demand Drivers
Investing in Real Estate
Super Bulk
Home Depot 657,000 SF Williams-Sonoma 1,350,000 SF
Light Industrial Bulk Distribution

12
Key: Maximum Flexibility to Meet Changing Market Demand
– Sizes: 50,000 SF to 1,000,000 SF
– Height: 28’ to 36’+
– Depth: 120’ to 650’
– Construction
• Wall type
• Column & bay spacing
– Loading (Docks, Space)
– Trailer and auto parking
• Impact on Rentable Area
– Expansion
• Land is Not Free
Investing in Real Estate
More than Just a Box!

13
The Site Plan
Investing in Real Estate

14
Construction Design
Investing in Real Estate

15
Investing Options
• Highest Risk (Uncertainty) usually has highest reward
• Core Investment – Buying Existing Asset - Safest
o Long-term leases to good credit tenants
o Established markets
o Traditional design features
o Return = Initial Yield + Rental Increases + Appreciation, 7-10%
• Speculative Development is Riskiest
o Empty land > Hopefully occupied building
o First Rents 2 to 3 years after investment decision
o Return = Development Profit + Rental Increases, 12-14%
Investing in Real Estate

16
Development ProForma
Investing in Real Estate
Raw Land Cost: $ 5.00 / BSF
Site Improvement Cost: $ 5.00
Base Building Cost: $20.00
Tenant Improvements (TI): $ 5.00
Design, Permits & Soft Costs: $ 4.00 / BSF
Finance Cost: $ 2.00
Leasing Commissions: $ 2.00
Total Cost $43.00 / BSF
Rent $3.25 / SF
Yield 7.55%
Cap Rate 6.00%
Sale Price (Rent/Cap) $54.00
Margin 25.6%
9 Month Construction, ~12 Month Lease-Up – Time Risk!
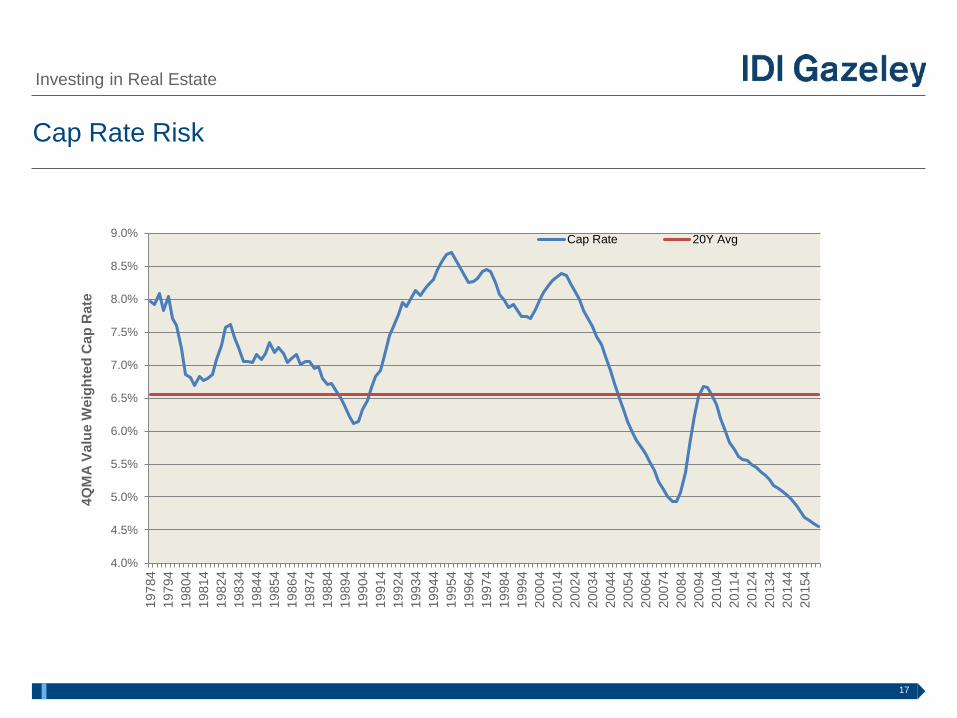
17
Cap Rate Risk
Investing in Real Estate
4.0%
4.5%
5.0%
5.5%
6.0%
6.5%
7.0%
7.5%
8.0%
8.5%
9.0%
19
784
19
794
19
804
19
814
19
824
19
834
19
844
19
854
19
864
19
874
19
884
19
894
19
904
19
914
19
924
19
934
19
944
19
954
19
964
19
974
19
984
19
994
20
004
20
014
20
024
20
034
20
044
20
054
20
064
20
074
20
084
20
094
20
104
20
114
20
124
20
134
20
144
20
154
4Q
MA
Va
lue
We
igh
ted
Ca
p R
ate
Cap Rate 20Y Avg

18
NCREIF NPI “Core” Return
Investing in Real Estate
2.40%
-10%
-8%
-6%
-4%
-2%
0%
2%
4%
6%
8%
19
78
Q1
19
79
Q1
19
80
Q1
19
81
Q1
19
82
Q1
19
83
Q1
19
84
Q1
19
85
Q1
19
86
Q1
19
87
Q1
19
88
Q1
19
89
Q1
19
90
Q1
19
91
Q1
19
92
Q1
19
93
Q1
19
94
Q1
19
95
Q1
19
96
Q1
19
97
Q1
19
98
Q1
19
99
Q1
20
00
Q1
20
01
Q1
20
02
Q1
20
03
Q1
20
04
Q1
20
05
Q1
20
06
Q1
20
07
Q1
20
08
Q1
20
09
Q1
20
10
Q1
20
11
Q1
20
12
Q1
20
13
Q1
20
14
Q1
20
15
Q1
20
16
Q1
Qu
art
erl
y R
etu
rn
Total Return 20Y Average
NCREIF Average Annual Return = 9.95% (Unlevered)

Real Estate Fundamentals

20
Distribution Centers – Take Costs & Time of Supply Chain
Real Estate Fundamentals

21
Population Weighted Map of the US
Real Estate Fundamentals
- 80% of the US population lives in a metropolitan area -

22
Logistics is Balancing Services Levels with Cost Drivers
Real Estate Fundamentals
Source: Establish Inc., Herbert W. Davis and Company, Grubb and Ellis
50%
22%
10%
8%
4%
3%
2%
1%
0%
10%
20%
30%
40%
50%
60%
Tra
nsport
ation
Invento
ry
Lab
or
Custo
me
r S
erv
ice
Ren
t
Adm
in
Sup
plie
s
Oth
er

23
Superior Logistics Infrastructure Drives (Floats) demand for Modern Logistics
Real Estate Fundamentals

24
IDI / Georgia Tech Logistics Infrastructure Index
Real Estate Fundamentals
0 0.1 0.2 0.3 0.4 0.5 0.6 0.7 0.8 0.9 1
AustinPittsburghLas VegasRichmond
Salt Lake CityHartford
NashvilleSan Antonio
PhoenixNorfolk
CharlotteBoston
PortlandSan DiegoCleveland
DenverCentral Florida
St. LouisJacksonville
HoustonColumbus
MinneapolisSeattleAtlanta
Baltimore / WashingtonKansas City
DetroitPhiladelphia
New Jersey TurnpikeSouth Florida
IndianapolisNorthern California
New York MetroCincinnati
Dallas - Ft. WorthInland Empire
Los AngelesMemphisChicago
Rail Intermodal Index Airport Index Interstate Index

25
Top Logistics Markets in the US
Real Estate Fundamentals
Source: CBRE-EA, IDI Gazeley Research
Focus Market Classification Market Size (Modern Logistics)
Super Regional 20 MSF
Logistics Infrastructure 40 MSF
Highly Constrained
100 MSF
Regional Plus
Large Stabilized
200 MSF
Other

26
Real Estate Fundamentals
Source: IDI Gazeley Research, Costar
Retail E-Commerce Sales Worldwide, 2014-2019
$1.34
$1.67
$2.05
$2.50
$3.02
$3.58
6.3%
8.6%
12.8%
0%
2%
4%
6%
8%
10%
12%
14%
$0.0
$0.5
$1.0
$1.5
$2.0
$2.5
$3.0
$3.5
$4.0
2014 2015 2016P 2017F 2018F 2019F
E-C
om
me
rce
Sa
les
(T
rill
ion
s)
Asia North America
Europe Latin America, Middle East, Asia
E-Comm. % of Total Retail Sales

27
Real Estate Fundamentals
Source: IDI Gazeley Research, Costar
0
50
100
150
200
250
2008 2009 2010 2011 2012 2013 2014 2015 2016
Nu
mb
er
of
Fa
cil
itie
s in
No
rth
Am
eri
ca
Fulfillment Sortation Depot
17
191
Amazon Distribution Center Growth in the US

28
Real Estate Fundamentals
Source: IDI Gazeley Research, Federal Reserve Bank
DepotFulfillment Sortation / Distribution
FF
F F
S
F
D
D
15mi /
24km
F S D
DEPOTS
Varies, Vintage (1970|1998), 25’ clear
70-100 KSF
FULFILLMENT CENTERS
Cross Dock, Modern 32’ clear
400-600 KSF
Last Mile Logistics – Amazon Distribution Center Network

29
North America Real Estate Fundamentals
0%
2%
4%
6%
8%
10%
12%
14%
16%
18%
20%
0.0
20.0
40.0
60.0
80.0
100.0
120.0
140.0
160.0
2007 2010 2013 2016
Mil
lio
ns
SF
Completions Net Absorption Vacancy
• 2016 ended the year with record absorption – 155% of the
historical average.
• Despite new construction, Vacancy continues to fall – down
to 5.5% for total industrial – a record low.
• Continued strength for the larger Super Bulk segment, also
where development is concentrated.
• Light Industrial healthy, but not out performing
• Rents growth healthy, investor demand and pricing remain
high
Source: IDI Gazeley Research, CoStar as of 3q16
MSFCurrent
Ask RentAvail. Vacancy
Trailing 4Q
Abs. MSF
Hist. Avg.
Abs. MSFYears Supply % Normal Abs.
Under Const.
MSF
LI (50-250 KSF) 877.9 $5.76 8.1% 8.1% 36.4 37.4 -0.44 97% 38.4
Bulk (250-600
KSF)729.6 $4.29 12.7% 10.2% 45.0 30.5 0.05 148% 50.7
SB (600 KSF +) 587.9 $3.64 8.9% 8.2% 56.9 24.7 -0.43 230% 69.7
Total Logistics 2,195.4 $4.88 11.1% 8.8% 139.4 90.0 -0.29 155% 158.7
Total Industrial 15,277.5 $6.62 7.8% 5.5% 254.1 251.1 -2.75 101% 203.0
MODERN LOGISTICS SUPPLY AND DEMAND
• Modern Logistics – 1995 and Newer, Warehouses for Rent, 50,000 SF +
• Percent Normal Absorption – Compares the trailing for quarters of absorption of a market or segment to its historical average (2003-2007)
• Years Excess Supply – Calculated as the vacancy over 10% divided by the normal absorption as defined above
HIGHLIGHTS

30
Modern Logistics Construction vs. Net Absorption
• After leveling off, 158.6 MSF currently under construction; 39% pre-lased according to CoStar
• Despite new supply, absorption has tracked well
• Super Bulk Strength – 230% absorption, 8.8% vacancy
• Development limited to institutional investors
-
20
40
60
80
100
120
140
160
180
Mil
lio
ns
SF
Under Construction Trailing 4Q Absorption Historical Average Absorption

31
Net Absorption vs Historic Market Average (Trailing 4Q)
Inland Empire
+ 170%
Dallas
+ 275%
Houston
+ 130%
Fort Lauderdale
+ 153%
Atlanta
+ 150%
Memphis
+ 85%
Chicago
+ 115%
Indianapolis
+ 141%Cincinnati
+ 70%
Central NJ
+ 117%Eastern PA
+ 339%

32
Real Estate Fundamentals
Choosing our Markets
0.0
0.5
1.0
1.5
2.0
2.5
3.0
3.5
4.0
4.5
Market Penetration and Scalability Barriers to New Supply Business Environment Capital Markets
Demographic/Economic Demand and Rent Growth Logistics/Infrastructure
Model Output - Logistics

Case Study – Developing a Building

34
Case Study
• 2/3 of industrial space users in US Lease vs. Own
• Reasons to lease:
o Invest capital in primary business not real estate
o Flexibility to adapt to changing business needs
o Lease Payments align to Operating Income
o Simple Economics - DCF
• Reasons to own:
o Specialized Building / Control
o RE Returns higher than core business
o Simple Economics – DCF
o Sometimes emotional
Leasing versus Owning

35
Development Strategies
Case Study
• Speculative – “Inventory”
• Construct a building empty and lease it up
• Build-to-Suit
• Construct a building for a specific user
• Developer finances – short and long-term
• Owned Land or Neutral Site
• Build-to-Own / Fee Development
• Construct a building for a specific user
• Tenant owns & finances
• Sell land sites to users / other developers
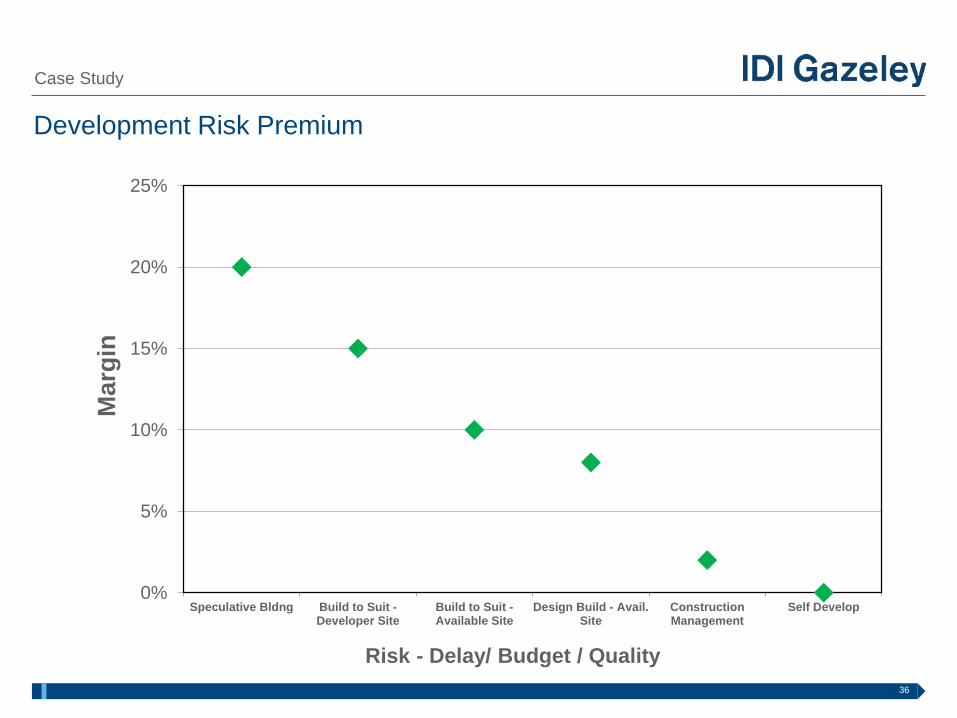
36
Development Risk Premium
Case Study
0%
5%
10%
15%
20%
25%
Speculative Bldng Build to Suit -Developer Site
Build to Suit -Available Site
Design Build - Avail.Site
ConstructionManagement
Self Develop
Ma
rgin
Risk - Delay/ Budget / Quality
37
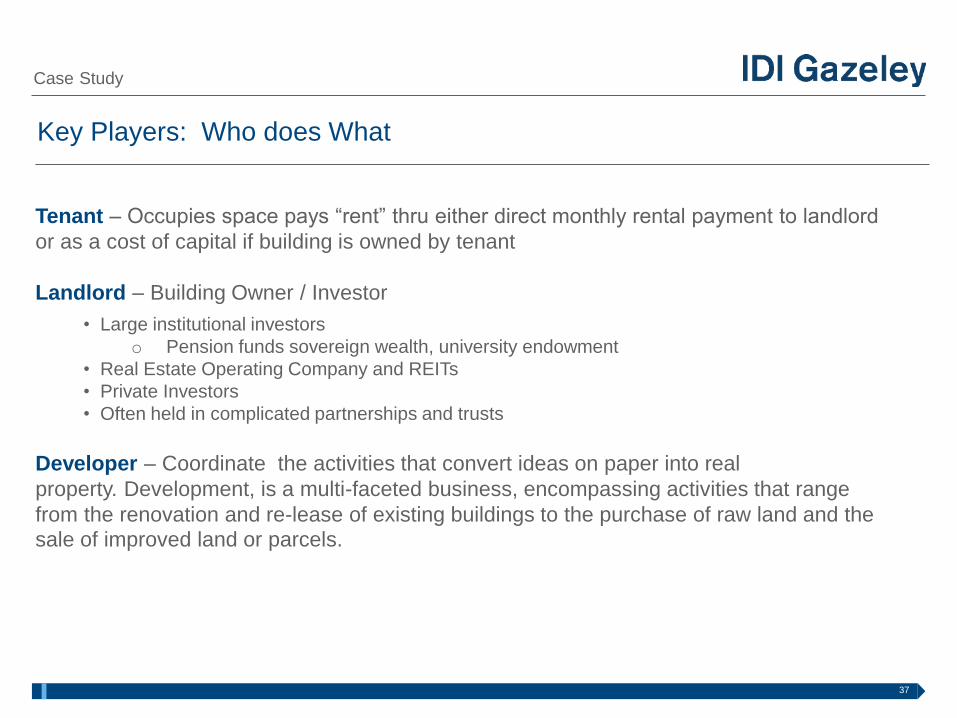
Key Players: Who does What
Case Study
Tenant – Occupies space pays “rent” thru either direct monthly rental payment to landlord
or as a cost of capital if building is owned by tenant
Landlord – Building Owner / Investor
• Large institutional investors
o Pension funds sovereign wealth, university endowment
• Real Estate Operating Company and REITs
• Private Investors
• Often held in complicated partnerships and trusts
Developer – Coordinate the activities that convert ideas on paper into real
property. Development, is a multi-faceted business, encompassing activities that range
from the renovation and re-lease of existing buildings to the purchase of raw land and the
sale of improved land or parcels.

38
Key Players: Who does What
Case Study
Government – Regulates land use and approves design including variances. Also critical in
awarding tax incentives and administering municipal infrastructure. Numerous departments
and levels – primarily local, but also state and federal.
Attorneys – Documents purchase & sale, land use and lease agreements, also title review.
Architect & Engineers – Design site and facilities
General Contractor – Coordinates construction activities
Banker – Provides construction / development financing as well as long term debt
Investor – Provides equity investment typically 20 to 50% of project cost
Brokers – Paid a fee to represent tenants or landlords
Property Management – Collects rent, complying with laws and regulations, and maintaining
the property on behalf of the property owner.

39
Eastpoint at Exit 8A
South Brunswick, NJ
• IDI Gazeley’s History in New Jersey
• Site History
• Evaluation Process to go Spec
– Why not Build-to-suit?
– Market Intel – Fundamentals, Competitive Set, Lease Comps, Sale Comps
• Design Process and Consideration
– Rail Easement
– 36’ or 40’ Clear?
– Build trailer storage now or later?
– Access Improvements.
• Project Economics
• Site Plan Approval Process
• Brokerage Team Selection
• Current Status
Case Study

40
• Former Polymer manufacturing plant decommissioned by BASF in 2005. “Brownfield”.
• 2006 IDI Placed Under Contract
– BASF to demolish buildings, handle soil remediation and groundwater contamination.
– BASF to draft a Remedial Action Workplan based upon findings and submit to NJDEP.
– IDI to receive a No Further Action / Covenant Not to Sue from NJDEP as condition of closing.
– Soil remediation can be done quickly, groundwater monitored over time.
• Closing Occurred July of 2008
Case Study

41
Exit 8A Supply and Demand
Case Study
0%
5%
10%
15%
20%
25%
-1.0
-0.5
0.0
0.5
1.0
1.5
2.0
2.5
3.0
2007 2008 2009 2010 2011 2012 2013 2014 2015 2016ytd.
Mill
ion
s S
F
Completions Net Absorption Vacancy

42
Site Plan
Case Study

43
Access Improvements
Case Study

44
Rendering
Case Study

45
Eastpoint at Exit 8A
South Brunswick, NJ
• IDI Gazeley’s History in New Jersey
• Site History
• Evaluation Process to go Spec
– Why not Build-to-suit?
– Market Intel – Fundamentals, Competitive Set, Lease Comps, Sale Comps
• Design Process and Consideration
– Rail Easement
– 36’ or 40’ Clear?
– Build trailer storage now or later?
– Access Improvements.
• Project Economics
• Site Plan Approval Process
• Brokerage Team Selection
• Current Marketing Status – Economics, ASTI, Etc.
Case Study

Global Differences

47
Milton Keynes Park

48
Milton Keynes, UK

49
Lutterworth, UK

50
Pre-Cast, Sealed Pour, Concrete MFL walls

51
Wooden Timbers (France, Scandanavia, Germany)
52
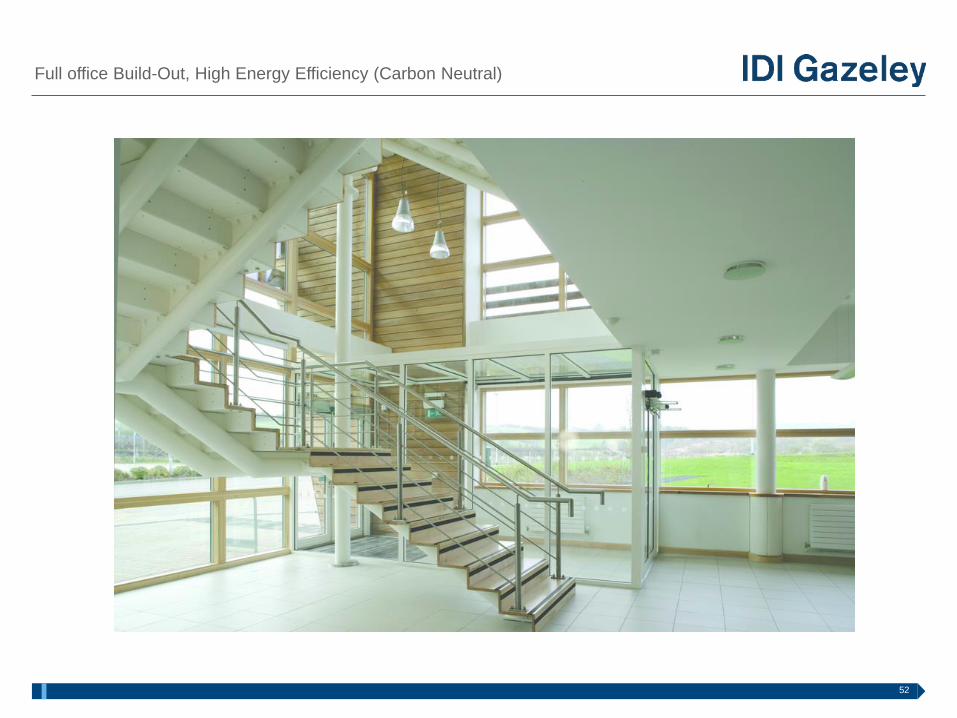
Full office Build-Out, High Energy Efficiency (Carbon Neutral)

53
Wuxi, China (75 West of Shanghai)

54
Wuxi, China

55
Wuxi, China

56
BTS in Dongguan, China (52M NW of Hong Kong)
