logview: visualizing event log clusters - dalhousie university
TRANSCRIPT

LogView: Visualizing Event Log ClustersAdetokunbo Makanju, Stephen Brooks, A. Nur Zincir-Heywood, Evangelos E. Milios
Faculty of Computer ScienceDalhousie UniversityHalifax, Nova Scotia
B3H 1W5Canada
{makanju, sbrooks, zincir, eem}@cs.dal.ca
Abstract—Event logs or log files form an essential part ofany network management and administration setup. While logfiles are invaluable to a network administrator, the vast amountof data they sometimes contain can be overwhelming and cansometimes hinder rather than facilitate the tasks of a networkadministrator. For this reason several event clustering algorithmsfor log files have been proposed, one of which is the eventclustering algorithm proposed by Risto Vaarandi, on which hisSimple Log file Clustering Tool (SLCT) is based. The aim of thiswork is to develop a visualization tool that can be used to viewlog files based on the clusters produced by SLCT. The proposedvisualization tool, which is called LogView, utilizes treemaps tovisualize the hierarchical structure of the clusters produced bySLCT. Our results based on different application log files showthat LogView can ease the summarization of vast amount of datacontained in the log files. This in turn can help to speed up theanalysis of event data in order to detect any security issues on agiven application.
I. INTRODUCTIONAn event log or log file consists of several independent lines
of text data, which contain information that pertains to eventsthat occur within a system. A log file might contain eventsfrom one service or different services which may come fromone node or several nodes on the network. The actual setup isusually at the discretion of the administrator.For this reason the contents of event logs are an important
indication of the current status of the system(s) that they mon-itor. This makes them indispensable in systems administrationand network management, are used by administrators in theirgeneral monitoring tasks, security analysis and also for troubleshooting when downtimes occur.While log files are invaluable to a network administrator,
the vast amount of data they sometimes contain can easilyoverwhelm a human and can actually hinder rather thanfacilitate the tasks of an administrator. A possible solutionto this problem is to cluster the events based on their type.Data mining techniques are required to produce such clusters.One such technique is the frequent event mining algorithm[1], on which the Simple Log file clustering tool (SLCT) [2]is based. SLCT is a text based tool. The clusters produced bysuch methods can be used in tasks such as event correlation orin system profiling both of which can be used in fault detectionand anomaly detection in a security context.Despite the promise provided by data clustering tools such
as SLCT in providing useful insight into the character of a log
file and invariably the specification of the “normal” behavior ofa system, they have not received much attention in network andsystem management tools in practice. Moreover, visualizationtechniques can help interpret large amounts of data, and logfile analysis could definitely benefit from visualization as well.
The aim of this work is to build a visualization tool thatcan be used to view event log clusters such as the onesproduced by SLCT. A major cornerstone of our work is tonot just build a visualization tool but to build one whichis interactive, dynamic and based on arbitrary clusters ofapplication event/log files. Several tools have been proposedin recent times for the visualization of network data e.g.Afterglow [3], SnortView [4], VISUAL (Visual InformationSecurity Utility for Administration Live) [5], Session Viewer[6] and HNMaps [7]. So far none of these tools provides allthe cornerstones of our project in one package.
Our tool will provide visual summaries of the contents ofan event log file to an administrator, to speed up the dataanalysis needed during downtimes and security breaches. Thetool, which is christened LogView, utilizes treemaps [8] tovisualize the hierarchical structure of the clusters producedby SLCT. Treemaps are used as the visualization techniquein this project as they provide an appropriate alternative totraditional node-link diagrams used for viewing hierarchicalstructures. Node-link diagrams do not use space efficiently.This fact also makes visualization tools like daVinci [9](nowcalled uDraw) inappropriate for our work. daVinci is an ex-tensible, multipurpose visualization tool for hierarchical nodelink diagrams. Treemaps are also useful when the intent ofvisualization goes beyond the need to visualize the structureof the hierarchy but also requires the encoding of other piecesof information.
The rest of this paper is organized as follows: section 2provides an overview of SLCT and treemaps and describesprevious work. Section 3 discusses the steps taken to achieveour goal i.e. going from data collection to data preparationand finally the visualization of the data. Section 4 describesthe results whereas section 5 presents the conclusion and futurework.

II. BACKGROUND AND PREVIOUS WORK
A. Previous WorkVisualization literature is abounding with examples of tools
intended for use in the network management and securitydomain. These tools are usually designed with the goal ofsummarizing system related data for ease of analysis anddiffer mainly based on the type/source of data they visualize,the visualization technique utilized and task for which theyare intended. Examples of recent network information visual-ization tools include Afterglow [3], SnortView [4], VISUAL(Visual Information Security Utility for Administration Live)[5], Session Viewer [6] and HNMaps [7].Afterglow is an example of an open source
toolkit/application which was designed for networkinformation visualization. Afterglow consists of two modules1.x and 2.0. Afterglow 1.x is a toolkit; it consists of acollection of scripts written in Perl which can be used totransform the contents of log files into a form which issuitable for generating visualizations. Afterglow 2.0 on theother hand is a treemap visualization application and takesfiles produced by Afterglow 1.x as input. Afterglow 2.0 iswritten in Java, and unlike our proposal, is designed withonly the capability to view log files based on groupings ofsource IP addresses and intrusion detection log files, but notapplication log files.SnortView was designed specifically for the visualization
of Snort [10] alert logs. VISUAL visualizes communicationpatterns between hosts on an internal network and externalhosts, while Session Viewer provides a visual alternative tothe statistical approaches for the analysis of web session logs.HNMaps are another treemap based information visualiza-
tion tool proposed for visualizing internet level network trafficbased on IP address hierarchies. HNMaps were applied todepict a network which spanned 7 continents, 190 countries,23054 autonomous systems and 197427 IP prefixes [7].Unlike the visualization tools discussed above, the proposed
system is the only one which is designed with the visualizationof event logs in mind. The proposed system also goes one stepfurther by providing not just a visualization of raw data butdata which has been preprocessed through an initial clusteringphase. Moreover another contribution, of our work is to builda tool that is both dynamic and interactive. It should be notedhere that to the best of our knowledge none of the above workhas addressed these three issues together. Table I provides acomparative summary of the tools previously highlighted andour proposed tool.
B. Simple Log File Clustering ToolSeveral data mining algorithms for finding clusters in large
databases with high dimensionality have been developed overthe last decade. Examples of these clustering algorithms in-clude CLIQUE [11], CURE [12] and MAFIA [13]. Unfortu-nately, though event logs (which are the primary source of datain network and system management) fit these criteria, thesealgorithms are in some respects not well suited for event logs.
An algorithm suitable for clustering event logs needs to notjust be able to deal with high dimensional data, it also needs tobe able to deal with data with different attribute types, ignorethe order of the input records and discover clusters that existin subspaces of the high dimensional data [1], [14]. For thisreason clustering algorithms which are designed specificallywith event logs in mind are required, examples of suchalgorithms include simple event log clustering algorithm [1]and CUFRES [14]. The former algorithm deals with miningfrequent patterns from event logs while the latter deals withclustering of events for correlation. The event log clusteringtool, SLCT [2] (which stands for Simple Log File ClusteringTool), utilized in our work is based on the simple event logclustering algorithm. The algorithm and the tool were bothproposed by Risto Vaarandi.SLCT is an appropriate clustering tool for our work due
its simplicity and its production of results which are com-prehendible by humans. Aside from this, SLCT has beenused successfully in intrusion detection[15] for the automaticcreation of new attack detection signatures from log files.Also the application event logs utilized in our work follow
the typical pattern of word frequency occurrence in log filesi.e. the majority of words occur infrequently, sometimes nomore than once and a strong correlation exists between wordsthat do occur frequently, due to the fact that every line in anevent log is formatted according to some format string. Theconstant words in the format string therefore occur frequentlyin log files. These peculiar properties of event logs wereutilized in the design of SLCT [1], which also another reasonwhy SLCT is well suited to our work. The technique usedin SLCT works by using a 3-step algorithm, with the firststep proceeding in a fashion that is very similar to the Apriorialgorithm for association rule mining. During the first stepfrequent 1-item attributes are identified, these frequent 1-itemsare then used to build cluster candidates in the second step.In the third and final step clusters are selected from thesecandidates if the number of lines they match is greater than athreshold provided by the user.Fig. 1 shows four examples of the type of clusters that SLCT
is able to find, the asterisks (or wildcards) in each line indicateplace holders that can match any word.Any line that matches any of these patterns is a member of
that cluster.
TABLE ICOMPARING LOGVIEW TO OTHER NETWORK INFORMATION
VISUALIZATION TOOLSName Technique Data Source PurposeAfterglow Treemaps Traffic Logs SecuritySnortView 2-D plots Intrusion detection Security
logsVISUAL Fan-in/Fan-out Packet Trace Data Security
layoutSession Viewer Various Web Session Logs GeneralHNMaps Treemaps AS Level internet Security
traffic logsLogView Treemaps Application Logs General

Fig. 1. Sample clusters generated by SLCT
SLCT is written in C and can be easily compiled using gcc.It can be downloaded from [2]. Some of the more importantparameters required to run SLCT include:
• Support Threshold (-s): This can be given as a per-centage or integer. Since SLCT determines clusters byidentifying line patterns that occur frequently, the supportthreshold value is used to determine frequency. A linepattern in any log file needs to have members thatare greater than or equal to the support threshold tobe considered frequent. The support threshold can alsobe used to increase or decrease the number of clustersformed.
• Byte Offset (-b): This can be used to filter out irrelevantinformation that usually occurs at the beginning of log fileentries e.g. timestamps. The value is in bytes and whenspecified SLCT ignores this number of bytes at the startof each line.
• Outliers (-o): Specifies a file where outliers are storedi.e. lines that do not fit into any clusters.
• Ignore (-f <regexp>): This option takes a regular ex-pression as input and tells SLCT to ignore any log entrythat matches the expression when processing the log file.
C. TreemapsTreemaps were first proposed by Professor Ben Shneider-
man of the University of Maryland in 1992 [8]. His aim wasto produce a visualization of the directory structure of the filesystem of his 80MB hard disk with a technique that utilizesa space-constrained layout. Treemaps provide an alternativeto the node-link structure diagrams traditionally used forvisualizing hierarchical data. Treemaps are particularly usefulwhen visualizing large amounts of hierarchical data, as theyallow data to be viewed in a confined space. They alsoprovide an interface which can be useful for encoding otherpieces of information, a convenience which is not readilyavailable or convenient with node-link representations. Thismakes treemaps an excellent choice for visualizing log fileevent clusters.An example of how a treemap can be used to represent the
hierarchical structure of a node-link diagram is provided inFig. 2. Leaf nodes are represented by numbers in Fig. 2 (b)while internal nodes are represented with letters. The numberrepresentation of each leaf node is also an indication of thesize of the node; we can immediately notice that these numberscould have been omitted in the treemap representation as thesize of each node is encoded by the size of its correspondingblock in the treemap.A treemap is usually produced using the classic slice-and-
dice treemap layout algorithm. However, other treemap layout
algorithms have been proposed [16] to solve the problemsof low-aspect ratio, layout instability, order preservation inthe face of dynamically changing data and the need to createlayouts that are easy to search visually. Some of these layoutsinclude; Squarified, Strip, Cluster, Pivot-by-spilt, Pivot-by-sizeand Pivot-by-Middle. Our tool utilizes the squarified treemaplayout algorithm.
III. METHODOLOGYIn this work the major steps taken can be summarized as
follows:• Data Collection• Data Processing, Preparation and Clustering• Cluster VisualizationThe following sections explain these steps in more detail.
A. Data CollectionTo build and test a visualization tool like LogView, appropri-
ate data is required. The data used in this project was collectedon a test server from our Netpal project [17].The log files were collected on a per service basis and log
files from four services were used for this project. The serviceschosen include IMAP, POP3, SSH and HTTP. These servicesare explained in more detail in the following. The contents ofthe event logs employed in this work are summarized in TableII .
• IMAP: The IMAP service is an application layer protocolwhich allows a client to access his/her e-mails stored ona remote server over a TCP/IP connection. IMAP standsfor Internet Message Access Protocol.
• POP3: Like IMAP, POP3 is also an application layerprotocol which allows a client to access his/her e-mailson a remote server over a TCP/IP connection. It howeverdiffers from IMAP in that it does not allow persistentconnections. This means that connections last for only aslong as it takes to download messages, while POP3 allowsclients to stay connected for as long as they require. POP3stands for Post Office Protocol v3.
• SSH: SSH is an application layer protocol which allowstwo computers to exchange information over a secureencrypted channel. The information exchanged or trans-ferred can be shell commands or files. SSH stands forSecure Shell.
• HTTP: One of the most popular application layer pro-tocols in use today, HTTP is the protocol used forcommunication over the World Wide Web (WWW) andinternal Intranets. HTTP stands for Hyper Text TransferProtocol.
TABLE IIDATASET SUMMARY
S/No Service No. of Events Period Covered1 httpd 574,664 > 6 months2 imapd 85,721 > 6 months3 pop3d 86,190 > 6 months4 sshd 146,092 > 6 months

(a) Tree Structure
2
40
2
2
3
1
12 8
5
6 8 11 D
C B
A
(b) Treemap representation
Fig. 2. Treemap visualization of hierarchical data using the slice and dice algorithm.
These event log files only form a fraction of the possibleservices that could be visualized by LogView or clusteredusing SLCT. It is possible to cluster and visualize the log filesof virtually all services. These four services were selected onlyas samples for the demonstration of the tool.
B. Data Processing, Preparation and ClusteringOur visualization tool is not intended for the visualization of
raw event log data but event log clusters. For this reason, thedata collected had to be processed into a suitable form beforeit could be used as input to our visualization tool. The threesteps required to process the data included running the datathrough SLCT to get the cluster representations, sorting of theevents in the data set according to their clusters (as producedby SLCT)and producing TreeML files with the resulting data.In the first phase of data processing and preparation, SLCT
was run using the log files as input. After running SLCT, theraw clusters produced were inspected with the aim of selectingrelevant and meaningful clusters, a task which is made easyby the human readable cluster representations produced bySLCT. A description of the clusters which were selected forvisualization from each service are outlined in Table III. Thename of each cluster was intuitively assigned.In the second phase, regular expressions, which matched the
selected cluster representations were produced. These regularexpressions were then used to produce scripts, which areable to sort the events in each of the log files based on theselected clusters they belonged to; an event which did notbelong to any cluster was classified as an “outlier”. This wasnecessary given the fact that SLCT’s output are not the clustersthemselves but only textual representation of the form theevents in each cluster should take, see Fig. 1. Since we havetextual representations of each cluster, the regular expressionsserve as input to the system for the automatic classification oflog file events.In the final phase, further scripts were written to take these
event clusters and produce files suitable for input into ourproposed tool. The TreeML format was chosen as the input
file format. The TreeML format is an XML based file formatdesigned for the purpose of specifying the data in a treehierarchy. The general outline of a TreeML file is given inFig. 3
Fig. 3. General outline of a TreeML file
The TreeML format requires that we declare a number ofdata attributes which can be assigned to the entities in the tree.Table IV gives an outline of the data attributes used in the finalTreeML files produced.
C. Cluster VisualizationThe visualization component was built using a combination
of the Java Swing GUI toolkit and the prefuse visualizationtoolkit [18]. The prefuse toolkit was a natural choice for this

implementation as it is implemented in Java and provides ex-cellent classes for building visualization tools, which allow theuser to interact with the visualization. Building an interactivevisualization is one of the aims of this project.The color coding scheme used in our tool is very simple.
The outlines of the squares were drawn using a grayscale colorcoding scheme going from black through shades of gray towhite, the color used for an outline gets progressively brighter,the deeper in the hierarchy that the user goes. When a leaf nodeis selected or a mouse pointer hovers over it, the outline ofthe node changes color to blue. Only the leaf nodes in the treeare colored. All leaf nodes are colored with different shadesof green. The shade of green indicates the severity of the logevent type with outliers having the darkest shade of green. Theshade of green gets darker based on this severity order; OK,WARN, FAIL, OUTLIER. The color of the nodes howeverchanges to red when the “msg” field of the node contains asearch term entered by the user, more on this below.LogView also offers a dynamic query, a search facility
which allows text based searches of the log messages of theleaf nodes in the visualization. There is also a detail pane,which will show the “msg” field of a leaf node when it isselected and a drop down combo box, which switches theview between services. The dynamic query filters on the dayof the month on which a log event occurred. The assumptionhere is that each input file will contain entries for one monthonly.
D. Prefuse Visualization ToolkitVisualization toolkits are becoming an increasingly popular
means of creating information visualization tools as they helpto reduce the time and effort required to build them. Someexamples of such toolkits include Piccolo [19], InfoVis [20]and prefuse [18]. For the development of LogView, the prefusetoolkit is employed.The prefuse visualization toolkit is a software framework
written using the Java2D graphics library for the creationof visualization tools that are dynamic and interactive [21].The design of the prefuse toolkit is based on the informationvisualization reference model outlined in the work of Chi [22].By providing reusable building blocks based on this model forthe easy building of custom visualization tools, prefuse goesbeyond what is offered in other visualization toolkits.Prefuse serves only as an application building toolkit in our
work. It is transparent to the potential users of LogView.
IV. RESULTSThis section highlights the results of using the proposed
system, LogView, to visualize the data collected. An overviewof the LogView interface is shown in Figure 4, the exampleshows the visualization of the contents of the SSH serviceevent log.The components of the LogView window as can be seen
in Fig. 4 include a service selection combo-box is at the topof the screen, a dynamic query slider to the middle-right andthe visualization itself to the middle-left. There are also search
and detail panes which occupy the bottom-right and bottom-left of the screen respectively. The labels for each cluster arethe “names” given to each of the cluster types.
A. Service Overview and ProfilingAn overview of the visualizations created for each service
type is shown in Fig. 5. Using such views, we can proceedto profile a particular service on a network. In this case, wecan see that the IMAP and POP3 event logs are relatively lesscomplex when compared to HTTP and SSH, since all theirentries were able to fall into defined clusters without outliers.Specifically IMAP clusters are the least complex with onlytwo clusters.Looking also at the SSH visualization, we can see that
the majority of the entries fall into one cluster, this clusterrepresents invalid login attempts. Further investigation showedthat this was due to a prevalence of brute force login attemptson this server. In this case, LogView provided a very nicevisualization of such an attack attempt on the SSH server. Forthe HTTP visualization, we notice that most of the clustersare PHP related. This is an immediate indication that thisweb server runs mostly pages developed using PHP. Such ascenario would not occur on a web server that does not hostsuch pages.
B. Data Analysis and InteractionIn demonstrating the data analysis and interaction capabil-
ities of LogView, we split the possible tasks into three i.e.searching, filtering and selection.A screenshot of a search over the SSH service showing
log entries which contain the term “root” is shown in Fig. 6,(a) this is a task that an administrator might want to performover this service to find the frequency of attempts to gainroot access over SSH for instance. In figure 6 (b), we see thefiltering of the same visualization using the dynamic query.The filter is set to show only those entries that occur on the27th day of the month, all other nodes are invisible. The viewcan be dynamically changed by simply dragging the slider.The slider has values in the range 0 - 31. The range 1 - 31for each of the possible days of a month and 0 (the defaultvalue) means “show all nodes”.There might be times when the administrator has focused
on a node of interest and wants more information on the node.LogView allows for such situations; by hovering a mousepointer over the node the actual log entry gets displayed in thedetail pane below. An example of such a selection operationis shown in Fig. 6 (c). As an illustration of a situation where aselection operation would be useful, imagine finding out thatyour server has been flooded with brute force login attempts, aselection operation on a log entry would reveal the IP addressof the source of the flood.
C. Zooming and PanningFor user convenience LogView provides the capability to
zoom and pan the visualization. A screenshot of LogViewzoomed out on the visualization of the SSH service is shown

TABLE IIICLUSTER SUMMARY
Service Cluster Names DescriptionSSH Invalid User Shell login request from a non registered user.
Failed Reverse Mapping Failed attempt to use getaddrinfo() to resolve a hostname.Spoof IP A request from an IP address that may be spoofed.PAM Authentication Failure: Legal User Pluggable Authentication Module (PAM) login failure from a registered user.PAM Authentication Failure: Illegal User Pluggable Authentication Module (PAM) failure from an unregistered user.Failed keyboard-interactive/pam Failed keyboard interactive or PAM authentication.No identification String Shell login request without login information.
IMAP Connection A client connection to the IMAP server.Disconnection A client disconnection from the IMAP server.
POP3 Logout A client disconnection from the POP3 server.Connection A client connection to the POP3 server.Login Failed A failed login attempt.checkmailpasswd: Login Failed A failed login attempt associated with checkmailpasswd.checkmailpasswd: Connection A client connection to the POP3 server associated with checkmailpasswd.checkmailpasswd: Logout A client disconnection from the POP3 server associated with checkmailpasswd.
HTTP PHP Undefined Index: Fail PHP error associated with an undefined array index that generates a failure message.PHP Undefined Index: Warn PHP error associated with an undefined array index that generates a warning message.PHP Undefined Index: Ok PHP error associated with an undefined array index that generates an information only message.PHP Undefined Offset: 0 PHP error associated with an undefined numeric array index of 0.PHP Undefined Offset: 1 PHP error associated with an undefined numeric array index of 1.GET Request 500 HTTP get request with a status code of 500.GET Request 400 HTTP get request with a status code of 400.PHP Division by Zero PHP error caused by division by zero.
TABLE IVDATA ATTRIBUTES USED IN TREEML FILES
Attribute Name DescriptionName A string describing the node.Entries An integer which indicates the number of events which are part of the entire tree rooted at that node.Cluster A string which represents the cluster description produced by SLCT.Severity A string describing the severity category of the even type. The categories are OK, WARN and FAIL.Service A string which indicates the service which produced the log entry.Msg The actual log event entry string.Server The name or IP address of the server on which the data was collected.
in Fig. 7 (a), while Fig. 7 (b) shows the tool zoomed in andpanned to the left over the same visualization. We believe thatsuch utilities could prove valuable during the analysis of a logfile.
V. CONCLUSION AND FUTURE WORK
In this work, we developed a visualization tool, whichdisplays event log clusters based on clusters produced bySLCT. Our proposed event log visualization tool, LogView,is developed using the prefuse visualization toolkit and theJava Swing toolkit. Moreover, a squarified treemap layout isemployed as its visualization technique.We demonstrated the usefulness of the prototype in carrying
out various log analysis tasks including profiling, selection, fil-tering and searching on event log data sets from the followingservices i.e. IMAP, POP3, SSH and HTTP.Future work will include refining the tool to allow users
to choose the color coding scheme, and to automate the filepreparation process. We also intend to apply machine learningtechniques for event correlation and diagnostics using theoutput of LogView.
ACKNOWLEDGEMENTSThe author would also like to thank staff of Palomino
System Innovations Inc., based in Toronto for their support
in completing this work. Moreover, the authors gratefullyacknowledge the support of NSERC, MITACS and CFI.This work is conducted as part of the Dalhousie NIMS Lab
at http://www.cs.dal.ca/projectx/.
REFERENCES
[1] R. Vaarandi, “A Data Clustering Algorithm for Mining Patterns fromEvent Logs,” in Proceedings of the 3rd IEEE Workshop on IP Operationsand Management. Kansas City, MO, USA.: IEEE Press, October 2003,pp. 119 – 126.
[2] ——, “Simple Logfile Clustering Tool : http://kodu.neti.ee/ risto/slct/,”Accessed from the web., 2003.
[3] R. Marty, “Afterglow Project Home: http://afterglow.sourceforge.net,”Accessed from the web., 2008.
[4] H. Kioke and K. Ohno, “SnortView: Visualization System of SnortLogs,” in CCS Workshop on Visualization and Data Mining for Com-puter Security. Washington, DC, USA.: ACM Press, October 2004, pp.143 – 147.
[5] R. Ball, G. Fink, and C. North, “Home-centric visualization of networksecurity traffic for security administration,” in CCS Workshop on Visu-alization and Data Mining for Computer Security. Washington, DC,USA: ACM Press, October 2004, pp. 55 – 64.
[6] H. Lam, D. Russell, D. Tang, and T. Munzner, “Session viewer: Visualexploratory analysis of web session logs,” in IEEE Symposium on VisualAnalytics Science and Technology. IEEE Press, November 2007, pp.147 – 154.
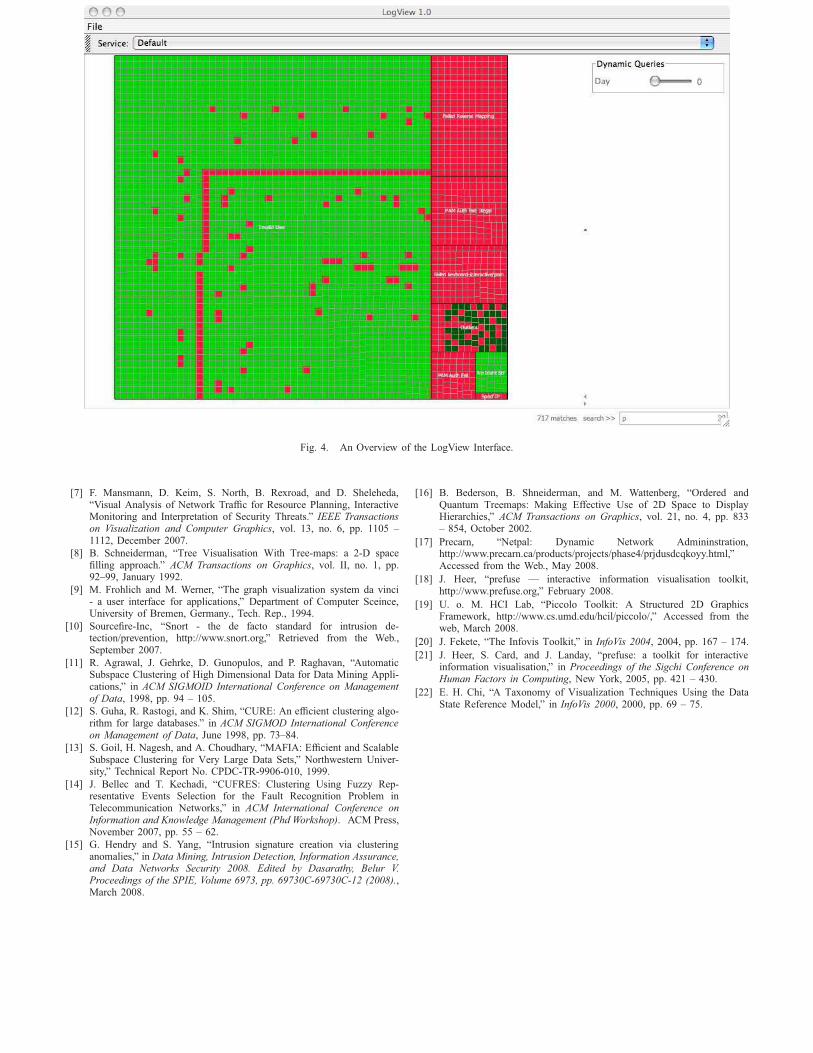
Fig. 4. An Overview of the LogView Interface.
[7] F. Mansmann, D. Keim, S. North, B. Rexroad, and D. Sheleheda,“Visual Analysis of Network Traffic for Resource Planning, InteractiveMonitoring and Interpretation of Security Threats.” IEEE Transactionson Visualization and Computer Graphics, vol. 13, no. 6, pp. 1105 –1112, December 2007.
[8] B. Schneiderman, “Tree Visualisation With Tree-maps: a 2-D spacefilling approach.” ACM Transactions on Graphics, vol. II, no. 1, pp.92–99, January 1992.
[9] M. Frohlich and M. Werner, “The graph visualization system da vinci- a user interface for applications,” Department of Computer Sceince,University of Bremen, Germany., Tech. Rep., 1994.
[10] Sourcefire-Inc, “Snort - the de facto standard for intrusion de-tection/prevention, http://www.snort.org,” Retrieved from the Web.,September 2007.
[11] R. Agrawal, J. Gehrke, D. Gunopulos, and P. Raghavan, “AutomaticSubspace Clustering of High Dimensional Data for Data Mining Appli-cations,” in ACM SIGMOID International Conference on Managementof Data, 1998, pp. 94 – 105.
[12] S. Guha, R. Rastogi, and K. Shim, “CURE: An efficient clustering algo-rithm for large databases.” in ACM SIGMOD International Conferenceon Management of Data, June 1998, pp. 73–84.
[13] S. Goil, H. Nagesh, and A. Choudhary, “MAFIA: Efficient and ScalableSubspace Clustering for Very Large Data Sets,” Northwestern Univer-sity,” Technical Report No. CPDC-TR-9906-010, 1999.
[14] J. Bellec and T. Kechadi, “CUFRES: Clustering Using Fuzzy Rep-resentative Events Selection for the Fault Recognition Problem inTelecommunication Networks,” in ACM International Conference onInformation and Knowledge Management (Phd Workshop). ACM Press,November 2007, pp. 55 – 62.
[15] G. Hendry and S. Yang, “Intrusion signature creation via clusteringanomalies,” in Data Mining, Intrusion Detection, Information Assurance,and Data Networks Security 2008. Edited by Dasarathy, Belur V.Proceedings of the SPIE, Volume 6973, pp. 69730C-69730C-12 (2008).,March 2008.
[16] B. Bederson, B. Shneiderman, and M. Wattenberg, “Ordered andQuantum Treemaps: Making Effective Use of 2D Space to DisplayHierarchies,” ACM Transactions on Graphics, vol. 21, no. 4, pp. 833– 854, October 2002.
[17] Precarn, “Netpal: Dynamic Network Admininstration,http://www.precarn.ca/products/projects/phase4/prjdusdcqkoyy.html,”Accessed from the Web., May 2008.
[18] J. Heer, “prefuse — interactive information visualisation toolkit,http://www.prefuse.org,” February 2008.
[19] U. o. M. HCI Lab, “Piccolo Toolkit: A Structured 2D GraphicsFramework, http://www.cs.umd.edu/hcil/piccolo/,” Accessed from theweb, March 2008.
[20] J. Fekete, “The Infovis Toolkit,” in InfoVis 2004, 2004, pp. 167 – 174.[21] J. Heer, S. Card, and J. Landay, “prefuse: a toolkit for interactive
information visualisation,” in Proceedings of the Sigchi Conference onHuman Factors in Computing, New York, 2005, pp. 421 – 430.
[22] E. H. Chi, “A Taxonomy of Visualization Techniques Using the DataState Reference Model,” in InfoVis 2000, 2000, pp. 69 – 75.

(a) SSH (b) IMAP
(c) POP3 (d) HTTP
Fig. 5. Figure showing the Treemaps produced by LogView. (a)SSH (b) IMAP (c) POP3 (d)HTTP.

(a) Search showing all log events containing the term ”root” (b) Filtering the view to show only log events that occurred on the27th day of the month
(c) Selecting a node causes the message of the log entry to be displayedin the textbox below the treemap.
Fig. 6. Analysis Using LogView with the SSH service(a) Search (b) Filtering (c)Selection.

(a) ZoomOut (b) ZoomIn and Pan-Left
Fig. 7. Zooming and Panning with the SSH service.(a) Zoomout (b) Zoomin and Pan-Left.