london, autumn 2017 residential market outlook · 2018. 10. 10. · residential market outlook...
TRANSCRIPT

RESIDENTIAL MARKET OUTLOOKLondon, Autumn 2017
cluttons.com
The Bank of England continues to maintain base rates at a historically low level, which is shielding home buyers from the current affordability crunch they face. We believe the prospects of a base rate rise will continue to drift, offering mortgaged households some comfort. Our expectation is that base rates have the potential to see an upward inflection of 25 basis points in the second half of 2018, climbing to 1% by the end of 2019.
In addition to these economic pressures, rampant house price growth across London has pushed the home ownership dream beyond the reach of many, even though the previous government made a conscious commitment to driving up home ownership numbers through its flagship Help-to-Buy schemes.
The affordability issues for Londoners is best reflected in the ratio of average house prices to household incomes.
On a borough level, perhaps unsurprisingly, the Royal Borough of Kensington and Chelsea remains the most expensive place to own a home in London, with average house prices standing at almost 50 times annual incomes. At the other end of the spectrum, home values in Barking & Dagenham stand at roughly 12 times average annual household incomes.
RESIDENTIAL SALES
Stubborn affordability challenges persistAs we have been highlighting for several quarters, households remain burdened with affordability challenges when trying to make the transition from rented accommodation to owner occupation. Anaemic wage growth, combined with an upward creep in inflation has meant that income growth lags inflation for many.
Unsurprisingly, consumer borrowing has continued to balloon according to the Bank of England. The total borrowings surpassed a record £200 billion at the end of June; higher than the total borrowing just before the Great Recession of 2008/09. Households continue to extend themselves in order to sustain lifestyles through rising debt linked purchases.
However as many households approach their maximum credit threshold, big ticket investments, such as property purchases are likely to be put on the back burner. In fact, the number of home purchases nationally has already shown signs of decline in recent quarters.

Source: Land Registry, ONS, Cluttons Source: Cluttons
Ratio of house prices to annual household incomes Performance of house prices in South Kensington, Chelsea and Knightsbridge
Mul
tipl
e an
nual
hou
seho
ld in
com
e
Q/Q
cha
nge
Prime Central London values finally bottoming out?When it comes to prime Central London, average residential prices stood at a little over £3 million at the end of Q2. By contrast, average household incomes in prime Central are at approximately £42,000, or 1/70th of average residential prices.
According to the latest Land Registry data for the year so far however, the average value of transactions across our definition of prime Central London stands at £1.9 million, or 45 times annual household incomes.
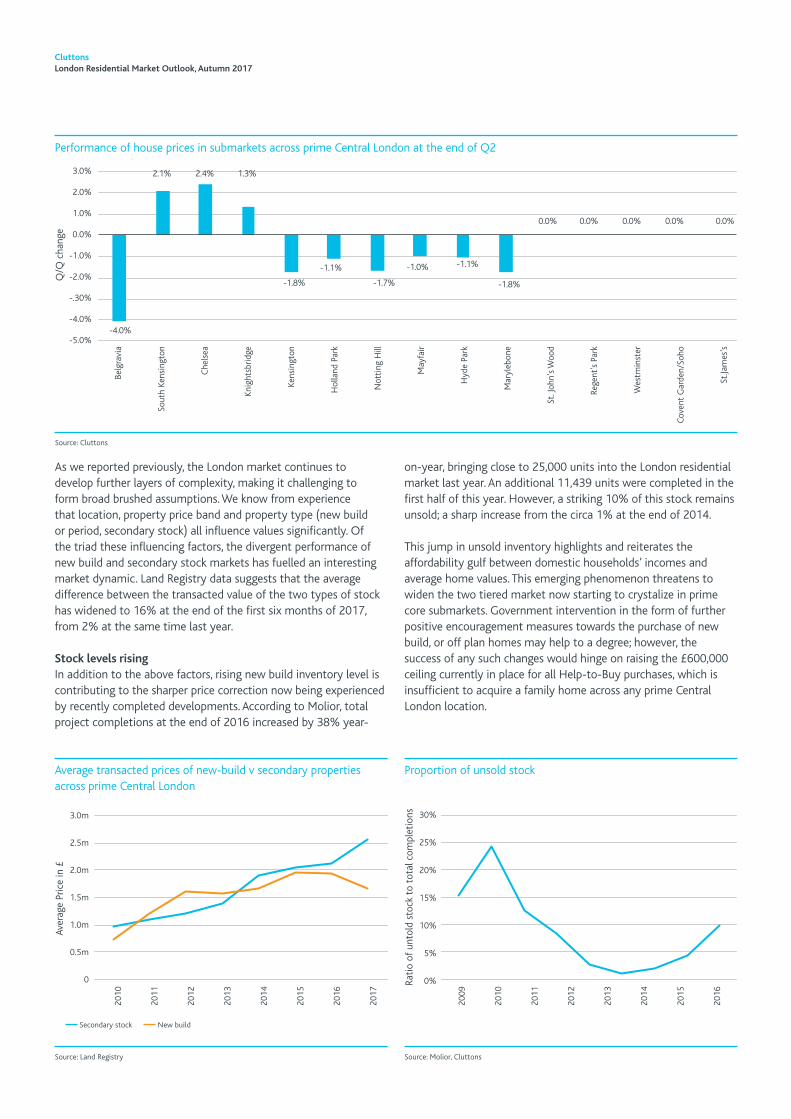
Still, the news of course of values in prime Central London finally showing signs of bottoming out may not be well received. In fact, our data shows that premium submarkets such as South Kensington (2.1%), Chelsea (2.4%) and Knightsbridge (1.3%) all continued to record positive growth for the second quarter in a row; a stark contrast to last year, when values dipped by 10.4%, 10% and 11.6%, respectively.
Investor driven activity is a key reason for the marginal increase in prices in these submarkets, with international buyers in particular standing out as a very active segment of the market. Overall, buyers appear to have adapted to the revised Stamp Duty regime, however the domestic and global economic ambiguity is still filtering through in the reduced volume of deals completing.
Also, in an increasing number of instances, our Central London agency offices are reporting that vendors are offering Stamp Duty incentives by effectively offering to cover Stamp Duty charges by adjusting asking prices accordingly. This recent phenomenon is again supporting the marginal turnaround in activity levels. This change in conditions has also been mirrored by the 11% rise in the number of viewings we have recorded during the first six months of 2017, when compared to the same period last year. It is worth noting however that the number of motivated sellers in the market remains very limited, with very few vendors urgently looking to sell.
Slowing rate of decline in valuesAcross prime Central London, although average house prices continued to decline for a fifth consecutive quarter, the rate of decline has been slower at -0.5% at the end of Q2, compared to -0.8% during Q1 2017. This slowing rate of decline has improved the overall profile of values across prime Central London, which now stand 4.3% lower than this time last year, compared to -5.6% in the 12 months to the end of Q1.
Even submarkets such as Mayfair, Hyde Park, Marylebone and Holland Park have shown a marked slowdown in the rate of decline in house prices.
50
45
40
35
30
25
20
15
10
5
0
4.0%
3.0%
2.0%
1.0%
0.0%
-1.0%
-2.0%
-3.0%
-4.0%
-5.0%
-6.0%
-7.0%
Kens
ingt
on a
nd C
hels
ea
Cit
y of
Wes
tmin
ster
Cam
den
Ham
mer
smit
h an
d Fu
lham
Islin
gton
Har
inge
y
Cro
ydon
Hav
erin
g
Cit
y of
Lon
don
Bexl
ey
Bark
ing
and
Dag
enha
m
Q3
2014
Q4
2014
Q1
2015
Q2
2015
Q3
2015
Q4
2015
Q1
2016
Q2
2016
Q3
2016
Q4
2016
Q1
2017
Q2
2017
South Kensington Chelsea Knightsbridge
Source: Cluttons, ONS
£42,000 1/70thAverage estimated annual household income in Prime Central London Average household income in prime Central London as a proportion of
average house prices
Cluttons London Residential Market Outlook, Autumn 2017
Source: Molior, CluttonsSource: Land Registry
Source: Cluttons
Proportion of unsold stockAverage transacted prices of new-build v secondary properties across prime Central London
Performance of house prices in submarkets across prime Central London at the end of Q2
30%
25%
20%
15%
10%
5%
0%
3.0%
2.0%
1.0%
0.0%
-1.0%
-2.0%
-.30%
-4.0%
-5.0%
3.0m
2.5m
2.0m
1.5m
1.0m
0.5m
0
-4.0%
2.1% 2.4% 1.3%
-1.8%
-1.1%
-1.7%
-1.0% -1.1%
-1.8%
0.0% 0.0% 0.0% 0.0% 0.0%
Rati
o of
unt
old
stoc
k to
tot
al c
ompl
etio
ns
Q/Q
cha
nge
Aver
age
Pric
e in
£
Belg
ravi
a
Sout
h Ke
nsin
gton
Che
lsea
Knig
htsb
ridge
Kens
ingt
on
Hol
land
Par
k
Not
ting
Hill
May
fair
Hyd
e Pa
rk
Mar
yleb
one
St. J
ohn’
s Woo
d
Rege
nt’s
Par
k
Wes
tmin
ster
Cove
nt G
arde
n/So
ho
St.Ja
mes
’s
As we reported previously, the London market continues to develop further layers of complexity, making it challenging to form broad brushed assumptions. We know from experience that location, property price band and property type (new build or period, secondary stock) all influence values significantly. Of the triad these influencing factors, the divergent performance of new build and secondary stock markets has fuelled an interesting market dynamic. Land Registry data suggests that the average difference between the transacted value of the two types of stock has widened to 16% at the end of the first six months of 2017, from 2% at the same time last year.
Stock levels risingIn addition to the above factors, rising new build inventory level is contributing to the sharper price correction now being experienced by recently completed developments. According to Molior, total project completions at the end of 2016 increased by 38% year-
2010
2011
2012
2013
2014
2015
2016
2017
2009
2010
2011
2012
2013
2014
2015
2016
Secondary stock New build
on-year, bringing close to 25,000 units into the London residential market last year. An additional 11,439 units were completed in the first half of this year. However, a striking 10% of this stock remains unsold; a sharp increase from the circa 1% at the end of 2014.
This jump in unsold inventory highlights and reiterates the affordability gulf between domestic households’ incomes and average home values. This emerging phenomenon threatens to widen the two tiered market now starting to crystalize in prime core submarkets. Government intervention in the form of further positive encouragement measures towards the purchase of new build, or off plan homes may help to a degree; however, the success of any such changes would hinge on raising the £600,000 ceiling currently in place for all Help-to-Buy purchases, which is insufficient to acquire a family home across any prime Central London location.
Cluttons London Residential Market Outlook, Autumn 2017

While the Help-to-Buy scheme has not benefited London to the same extent as the rest of the UK, lower average home values have driven domestic buyer activity in locations that fall under our definition of Core Central London and beyond.
With developers moving to capitalise on this more peripheral demand for homes outside prime Central London, Molior has reported a strengthening in the supply pipeline, with circa 30,000 units per annum completing in outer London locations over the last three years.
What’s interesting is that the value of new homes completing has also continued to edge up over this time. At the end of 2016 however, an affordability threshold appears to have been breached, with the average value of new build transactions declining, even in outer London locations.
This suggests that the supply of high value, new build homes may now have exceeded domestic demand levels, once again underscoring the need for developers to address the affordability emergency gripping the capital’s housing market.
Source: Land Registry, Molior, Cluttons
Secondary versus new-build Stock in Outer London boroughs
600,000
500,000
400,000
300,000
200,000
100,000
0
40,000
30,000
20,000
10,000
0
No. of units
Avg
tran
sact
ed p
rice
in £
Under construction units Completed units Price for secondary stock Price for new build
2010
2011
2012
2013
2014
2015
2016
2017
Cluttons London Residential Market Outlook, Autumn 2017
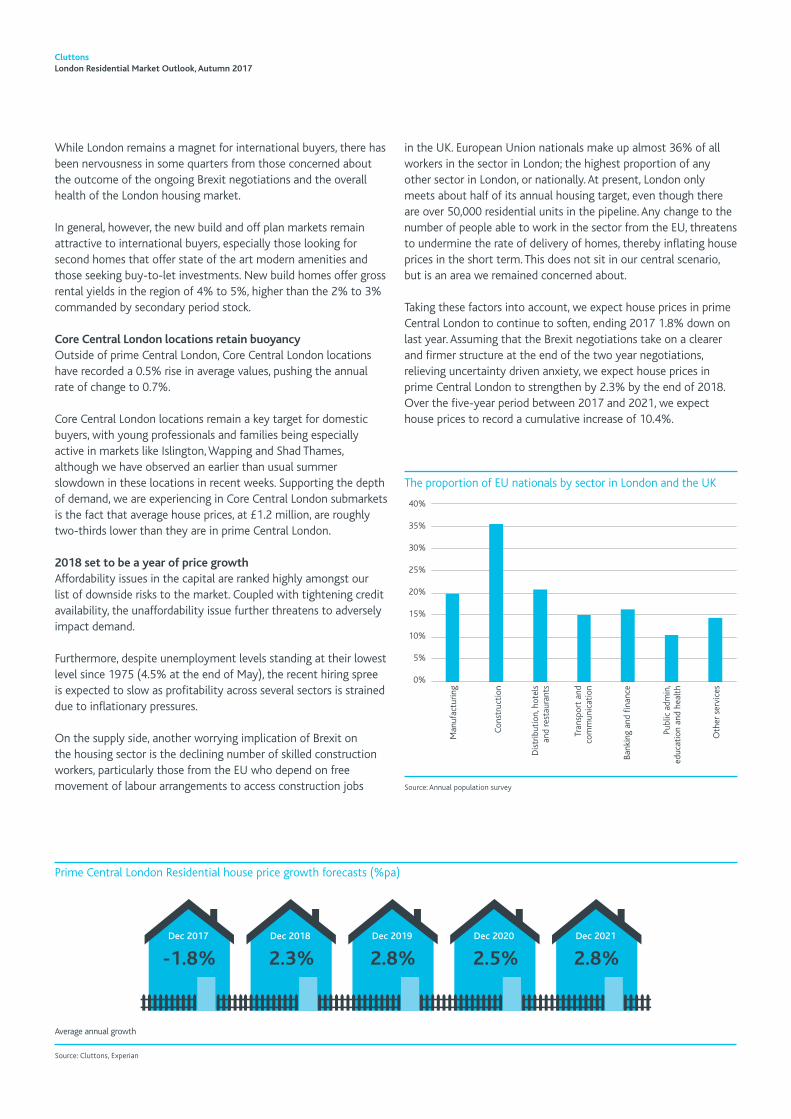
Prime Central London Residential house price growth forecasts (%pa)
Source: Cluttons, Experian
Dec 2018Dec 2017 Dec 2019 Dec 2020 Dec 2021
-1.8% 2.3% 2.8% 2.5% 2.8%
Average annual growth
While London remains a magnet for international buyers, there has been nervousness in some quarters from those concerned about the outcome of the ongoing Brexit negotiations and the overall health of the London housing market.
In general, however, the new build and off plan markets remain attractive to international buyers, especially those looking for second homes that offer state of the art modern amenities and those seeking buy-to-let investments. New build homes offer gross rental yields in the region of 4% to 5%, higher than the 2% to 3% commanded by secondary period stock.
Core Central London locations retain buoyancyOutside of prime Central London, Core Central London locations have recorded a 0.5% rise in average values, pushing the annual rate of change to 0.7%.
Core Central London locations remain a key target for domestic buyers, with young professionals and families being especially active in markets like Islington, Wapping and Shad Thames, although we have observed an earlier than usual summer slowdown in these locations in recent weeks. Supporting the depth of demand, we are experiencing in Core Central London submarkets is the fact that average house prices, at £1.2 million, are roughly two-thirds lower than they are in prime Central London.
2018 set to be a year of price growthAffordability issues in the capital are ranked highly amongst our list of downside risks to the market. Coupled with tightening credit availability, the unaffordability issue further threatens to adversely impact demand.
Furthermore, despite unemployment levels standing at their lowest level since 1975 (4.5% at the end of May), the recent hiring spree is expected to slow as profitability across several sectors is strained due to inflationary pressures.
On the supply side, another worrying implication of Brexit on the housing sector is the declining number of skilled construction workers, particularly those from the EU who depend on free movement of labour arrangements to access construction jobs
40%
35%
30%
25%
20%
15%
10%
5%
0%
Man
ufac
turin
g
Cons
truc
tion
Dis
trib
utio
n, h
otel
s an
d re
stau
rant
s
Tran
spor
t an
d co
mm
unic
atio
n
Bank
ing
and
finan
ce
Publ
ic a
dmin
, ed
ucat
ion
and
heal
th
Oth
er s
ervi
ces
Source: Annual population survey
The proportion of EU nationals by sector in London and the UK
in the UK. European Union nationals make up almost 36% of all workers in the sector in London; the highest proportion of any other sector in London, or nationally. At present, London only meets about half of its annual housing target, even though there are over 50,000 residential units in the pipeline. Any change to the number of people able to work in the sector from the EU, threatens to undermine the rate of delivery of homes, thereby inflating house prices in the short term. This does not sit in our central scenario, but is an area we remained concerned about.
Taking these factors into account, we expect house prices in prime Central London to continue to soften, ending 2017 1.8% down on last year. Assuming that the Brexit negotiations take on a clearer and firmer structure at the end of the two year negotiations, relieving uncertainty driven anxiety, we expect house prices in prime Central London to strengthen by 2.3% by the end of 2018. Over the five-year period between 2017 and 2021, we expect house prices to record a cumulative increase of 10.4%.
Cluttons London Residential Market Outlook, Autumn 2017

RESIDENTIAL LETTINGS
Affordability squeeze extends to lettings marketThe lettings market in prime Central London continues to be subjected to the same affordability pressures as the sales market, with household budgets stretched and outgoings towards rents, often emerging as the obvious candidate to cut down expenses. So, despite the 0.8% fall in average weekly rents during Q2, average annual rents of circa £73,000 are almost 75% higher than annual household incomes in prime Central London, which stand at roughly £42,000. Average weekly rents across prime Central London stood at £1,400 at the end of Q2.
Rising stock levels and increasingly cost conscious behaviour among tenants has contributed to the general softening we have been recording across the board. We recently highlighted the increasing instances of “accidental landlords”, which were contributing to rising stock levels, however this trend appears to have slowed considerably. Burdened by additional taxation, these landlords have now returned to list their properties for sale, which has had a negative impact on the rental inventory levels.
Source: Cluttons
Performance of rental values during Q2 across prime central London
2.0%
1.0%
0.0%
-1.0%
-2.0%
-.30%
-4.0%
-5.0%
Q/Q
gro
wth
Belg
ravi
a
Sout
h Ke
nsin
gton
Che
lsea
Knig
htsb
ridge
Kens
ingt
on
Hol
land
Par
k
Not
ting
Hill
May
fair
Hyd
e Pa
rk
Mar
yleb
one
St. J
ohn’
s Woo
d
Rege
nt’s
Par
k
Wes
tmin
ster
Cove
nt G
arde
n/So
ho
St.Ja
mes
’s
-0.7% -0.7%
-1.4%
-0.1%
-4.5%
-0.9%
-3.9%
-0.2%
-1.7%
-0.7%
1.7%
-0.0%
0.9%
-0.0% -0.0%
Cluttons London Residential Market Outlook, Autumn 2017
Looking at specific property types, most demand remains centred on one and two- bedroom flats, which has helped to hold rents steady in this segment of the market. All other types of property configurations recorded price drops of 1% on average. St. John’s Wood (1.7%) and Regent’s Park (0.9%) were the only two submarkets to have recorded an increase in rental values over the previous quarter, underpinned by seasonal summer demand.
Professionals from banking and financial institutions, as well as international students continue to dominate the tenant profile across prime Central London. Of note is the rise in the number of professional sharers on the market, particularly in locations such as Shad Thames. With anecdotal evidence of reductions in housing allowances, especially in the finance and banking sector, this is perhaps not a surprise. Aside from finance and banking, the technology-media-telecoms (TMT) sector continues to deliver a reliable and ever expanding stream of demand to the lettings market in many core locations.
Beyond the confines of prime Central London, the submarkets of South Bank and Hammersmith have proved to be the most resilient, with rents remaining stable over the past few quarters. In fact, South Bank has not observed a drop in rental rates in three years. Ease of access to the City and West end have allowed the area to emerge as a preferred alternative to more established prime Central London locations in recent years. Lower average weekly rental rates of £555 have clearly contributed to the stability in rents in this submarket. Furthermore, demand has been supported by young professionals and international students.
Tenant driven market still persistsWhile enquiries and viewings have been on the rise in recent weeks, tenants continue to seek what they perceive to be the best value. As such, the number of deals and the viewings to offer ratio for high value rental property remains suppressed.
Tenants also remain firmly in the driving seat, seeking refurbishments and rent reductions at renewal. For those landlords who opt to end tenancies after being unable to secure rental uplifts, void periods continue to lengthen, with new tenants being secured at notably lower rents than their predecessors. Meanwhile, landlords who choose to undertake refurbishments are, for the most part, able to stabilise rents, rather than secure higher rates. In general, properties maintained to a high standard often let rapidly at asking rates.
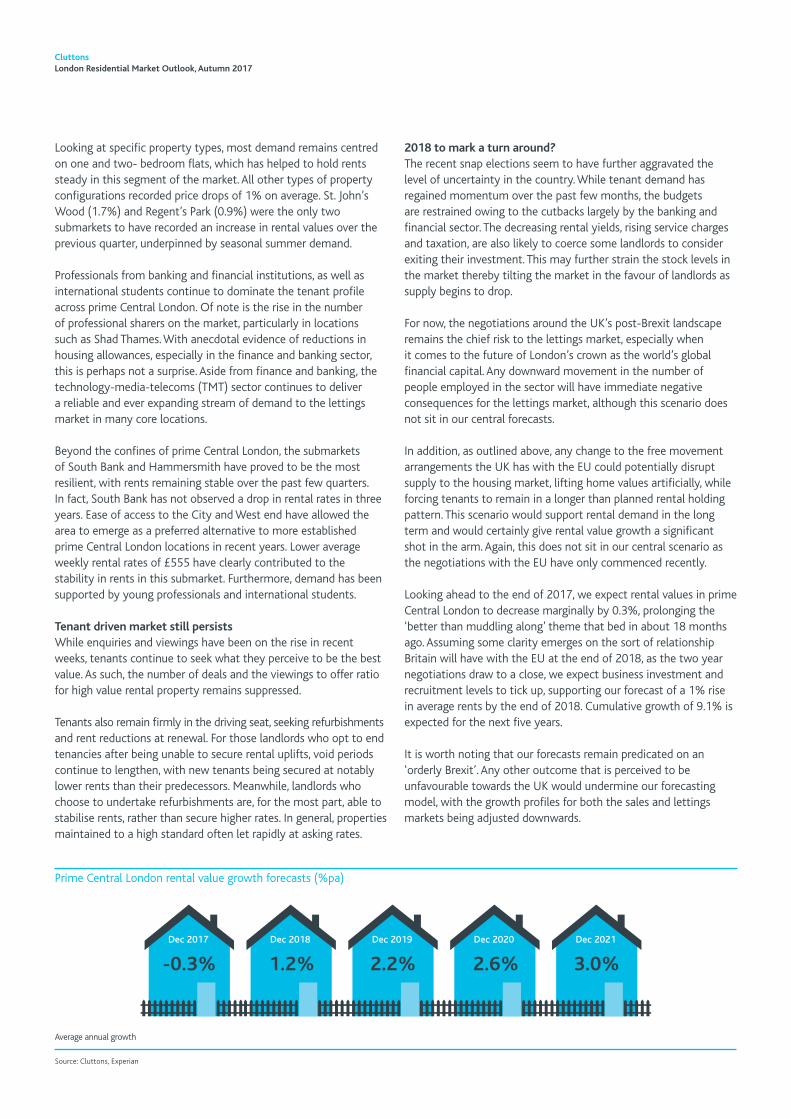
Prime Central London rental value growth forecasts (%pa)
Source: Cluttons, Experian
Dec 2018Dec 2017 Dec 2019 Dec 2020 Dec 2021
-0.3% 1.2% 2.2% 2.6% 3.0%
Average annual growth
2018 to mark a turn around?The recent snap elections seem to have further aggravated the level of uncertainty in the country. While tenant demand has regained momentum over the past few months, the budgets are restrained owing to the cutbacks largely by the banking and financial sector. The decreasing rental yields, rising service charges and taxation, are also likely to coerce some landlords to consider exiting their investment. This may further strain the stock levels in the market thereby tilting the market in the favour of landlords as supply begins to drop.
For now, the negotiations around the UK’s post-Brexit landscape remains the chief risk to the lettings market, especially when it comes to the future of London’s crown as the world’s global financial capital. Any downward movement in the number of people employed in the sector will have immediate negative consequences for the lettings market, although this scenario does not sit in our central forecasts.
In addition, as outlined above, any change to the free movement arrangements the UK has with the EU could potentially disrupt supply to the housing market, lifting home values artificially, while forcing tenants to remain in a longer than planned rental holding pattern. This scenario would support rental demand in the long term and would certainly give rental value growth a significant shot in the arm. Again, this does not sit in our central scenario as the negotiations with the EU have only commenced recently.
Looking ahead to the end of 2017, we expect rental values in prime Central London to decrease marginally by 0.3%, prolonging the ‘better than muddling along’ theme that bed in about 18 months ago. Assuming some clarity emerges on the sort of relationship Britain will have with the EU at the end of 2018, as the two year negotiations draw to a close, we expect business investment and recruitment levels to tick up, supporting our forecast of a 1% rise in average rents by the end of 2018. Cumulative growth of 9.1% is expected for the next five years.
It is worth noting that our forecasts remain predicated on an ‘orderly Brexit’. Any other outcome that is perceived to be unfavourable towards the UK would undermine our forecasting model, with the growth profiles for both the sales and lettings markets being adjusted downwards.
Cluttons London Residential Market Outlook, Autumn 2017

© Cluttons LLP 2017. This publication is the sole property of Cluttons LLP and must not be copied, reproduced or transmitted in any form or by any means, either in whole or in part, without the prior written consent of Cluttons LLP. The information contained in this publication has been obtained from sources generally regarded to be reliable. However, no representation is made, or warranty given, in respect of the accuracy of this information. We would like to be informed of any inaccuracies so that we may correct them. Cluttons LLP does not accept any liability in negligence or otherwise for any loss or damage suffered by any party resulting from reliance on this publication.
For further details contactFaisal DurraniHead of research +44 (0) 20 7647 [email protected]
Trishika ShettyResidential research analyst+44 (0) 20 7647 [email protected]
James HymanHead of residential agency +44 (0) 20 7407 3669 [email protected]
Zoe InnesHead of residential lettings+44 (0) 20 7584 [email protected]
1712