london city airport lcy start of season... · aircraft types by atms 7 top 20 destinations by atms...
TRANSCRIPT

S13 (Start)- S13 (End)-
S14 (Start) S14 (Start)
KEY STATISTICS Summer 2014 % Change % Change
Passenger Air Transport Movements 42,510 2.3% 3.5%
Total Seats 3,380,083 7.9% 9.7%
Seats per Passenger ATM 79.5 5.6% 6.0%
CONTENTS Page
Scheduling Limits 2
Scheduled Route Analysis 3
Total ATM Figures 4
Total Seat Figures 5
Airlines by ATMs 6
Aircraft Types by ATMs 7
Top 20 Destinations by ATMs and Seats 8
Destination Country by ATMs and Seats 9
ATM by Month 10
Runway Histograms - Hourly Total movements 11
Runway Histograms - Hourly Arrival movements 12
Runway Histograms - Hourly Departure movements 13
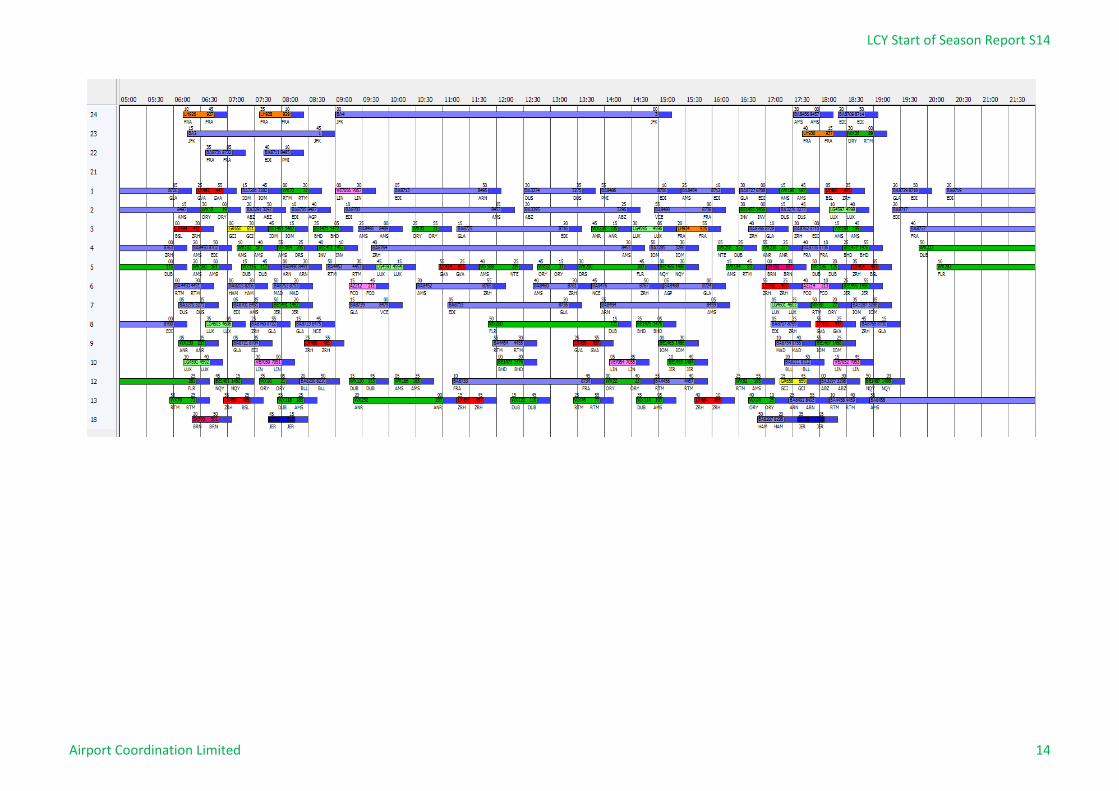
Parking Gantt Chat 14
Glossary 15
No warranty whether expressed or implied as to the completeness, accuracy, fitness for purpose, or satisfactory quality is given by ACL regarding the information in this report, which
is provided by third parties. Accordingly, ACL excludes all liability with regard to such data.
Summer 14START OF SEASON REPORT
LONDON CITY AIRPORT
Data in this report is current as of: 13 March 2014
LCY
LCY Start of Season Report S14
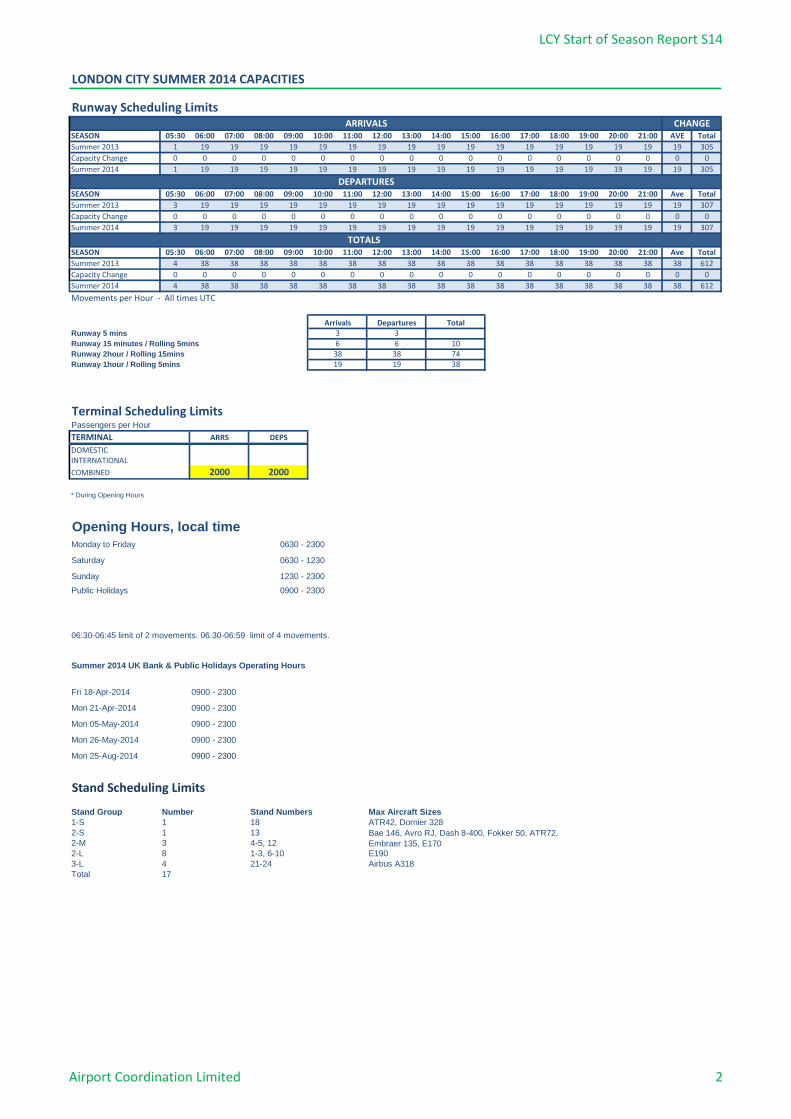
LONDON CITY SUMMER 2014 CAPACITIES
Runway Scheduling Limits
SEASON 05:30 06:00 07:00 08:00 09:00 10:00 11:00 12:00 13:00 14:00 15:00 16:00 17:00 18:00 19:00 20:00 21:00 AVE Total
Summer 2013 1 19 19 19 19 19 19 19 19 19 19 19 19 19 19 19 19 19 305
Capacity Change 0 0 0 0 0 0 0 0 0 0 0 0 0 0 0 0 0 0 0
Summer 2014 1 19 19 19 19 19 19 19 19 19 19 19 19 19 19 19 19 19 305
SEASON 05:30 06:00 07:00 08:00 09:00 10:00 11:00 12:00 13:00 14:00 15:00 16:00 17:00 18:00 19:00 20:00 21:00 Ave Total
Summer 2013 3 19 19 19 19 19 19 19 19 19 19 19 19 19 19 19 19 19 307
Capacity Change 0 0 0 0 0 0 0 0 0 0 0 0 0 0 0 0 0 0 0
Summer 2014 3 19 19 19 19 19 19 19 19 19 19 19 19 19 19 19 19 19 307
SEASON 05:30 06:00 07:00 08:00 09:00 10:00 11:00 12:00 13:00 14:00 15:00 16:00 17:00 18:00 19:00 20:00 21:00 Ave Total
Summer 2013 4 38 38 38 38 38 38 38 38 38 38 38 38 38 38 38 38 38 612
Capacity Change 0 0 0 0 0 0 0 0 0 0 0 0 0 0 0 0 0 0 0
Summer 2014 4 38 38 38 38 38 38 38 38 38 38 38 38 38 38 38 38 38 612
Movements per Hour - All times UTC
Runway 5 mins
Runway 15 minutes / Rolling 5mins
Runway 2hour / Rolling 15mins
Runway 1hour / Rolling 5mins
Terminal Scheduling LimitsPassengers per Hour
TERMINAL
DOMESTICINTERNATIONAL
COMBINED
Opening Hours, local time
0630 - 2300
0630 - 1230
1230 - 2300
0900 - 2300
06:30-06:45 limit of 2 movements. 06:30-06:59 limit of 4 movements.
Summer 2014 UK Bank & Public Holidays Operating Hours
0900 - 2300
0900 - 2300
0900 - 2300
Mon 26-May-2014 0900 - 2300
0900 - 2300
Stand Scheduling Limits
Stand Group Number Stand Numbers Max Aircraft Sizes
1-S 1 18 ATR42, Dornier 328
2-S 1 13
2-M 3 4-5, 12
2-L 8 1-3, 6-10 E190
3-L 4 21-24 Airbus A318
Total 17
ARRIVALS
DEPARTURES
TOTALS
CHANGE
Mon 25-Aug-2014
Monday to Friday
Saturday
Sunday
Mon 05-May-2014
Mon 21-Apr-2014
Fri 18-Apr-2014
Public Holidays
20002000
19 19
ARRS DEPS
* During Opening Hours
Bae 146, Avro RJ, Dash 8-400, Fokker 50, ATR72,
Embraer 135, E170
Arrivals Departures Total3 36 6 10
38 38 7438
Airport Coordination Limited 2
LCY Start of Season Report S14
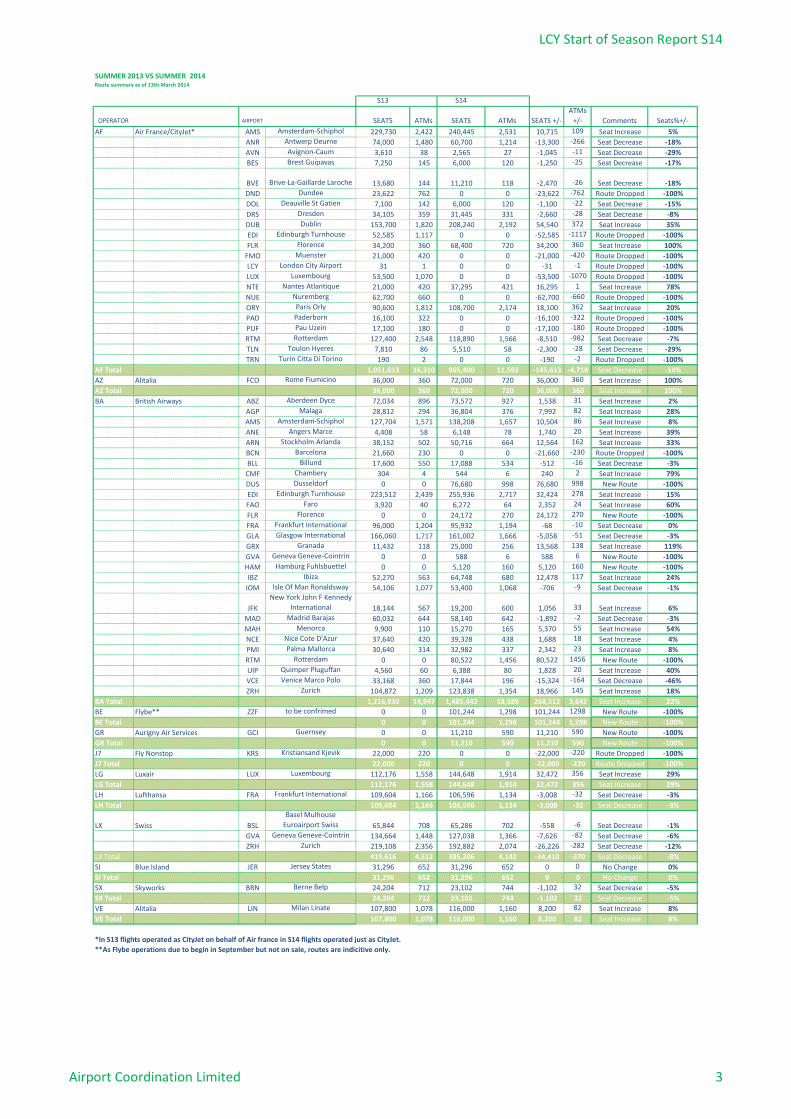
SUMMER 2013 VS SUMMER 2014Route summary as of 13th March 2014
S13 S14
OPERATOR AIRPORT SEATS ATMs SEATS ATMs SEATS +/-
ATMs
+/- Comments Seats%+/-
AF Air France/CityJet* AMS Amsterdam-Schiphol 229,730 2,422 240,445 2,531 10,715 109 Seat Increase 5%
ANR Antwerp Deurne 74,000 1,480 60,700 1,214 -13,300 -266 Seat Decrease -18%
AVN Avignon-Caum 3,610 38 2,565 27 -1,045 -11 Seat Decrease -29%
BES Brest Guipavas 7,250 145 6,000 120 -1,250 -25 Seat Decrease -17%
BVE Brive-La-Gaillarde Laroche 13,680 144 11,210 118 -2,470 -26 Seat Decrease -18%
DND Dundee 23,622 762 0 0 -23,622 -762 Route Dropped -100%
DOL Deauville St Gatien 7,100 142 6,000 120 -1,100 -22 Seat Decrease -15%
DRS Dresden 34,105 359 31,445 331 -2,660 -28 Seat Decrease -8%
DUB Dublin 153,700 1,820 208,240 2,192 54,540 372 Seat Increase 35%
EDI Edinburgh Turnhouse 52,585 1,117 0 0 -52,585 -1117 Route Dropped -100%
FLR Florence 34,200 360 68,400 720 34,200 360 Seat Increase 100%
FMO Muenster 21,000 420 0 0 -21,000 -420 Route Dropped -100%
LCY London City Airport 31 1 0 0 -31 -1 Route Dropped -100%
LUX Luxembourg 53,500 1,070 0 0 -53,500 -1070 Route Dropped -100%
NTE Nantes Atlantique 21,000 420 37,295 421 16,295 1 Seat Increase 78%
NUE Nuremberg 62,700 660 0 0 -62,700 -660 Route Dropped -100%
ORY Paris Orly 90,600 1,812 108,700 2,174 18,100 362 Seat Increase 20%
PAD Paderborn 16,100 322 0 0 -16,100 -322 Route Dropped -100%
PUF Pau Uzein 17,100 180 0 0 -17,100 -180 Route Dropped -100%
RTM Rotterdam 127,400 2,548 118,890 1,566 -8,510 -982 Seat Decrease -7%
TLN Toulon Hyeres 7,810 86 5,510 58 -2,300 -28 Seat Decrease -29%
TRN Turin Citta Di Torino 190 2 0 0 -190 -2 Route Dropped -100%
AF Total 1,051,013 16,310 905,400 11,592 -145,613 -4,718 Seat Decrease -14%
AZ Alitalia FCO Rome Fiumicino 36,000 360 72,000 720 36,000 360 Seat Increase 100%
AZ Total 36,000 360 72,000 720 36,000 360 Seat Increase 100%
BA British Airways ABZ Aberdeen Dyce 72,034 896 73,572 927 1,538 31 Seat Increase 2%
AGP Malaga 28,812 294 36,804 376 7,992 82 Seat Increase 28%
AMS Amsterdam-Schiphol 127,704 1,571 138,208 1,657 10,504 86 Seat Increase 8%
ANE Angers Marce 4,408 58 6,148 78 1,740 20 Seat Increase 39%
ARN Stockholm Arlanda 38,152 502 50,716 664 12,564 162 Seat Increase 33%
BCN Barcelona 21,660 230 0 0 -21,660 -230 Route Dropped -100%
BLL Billund 17,600 550 17,088 534 -512 -16 Seat Decrease -3%
CMF Chambery 304 4 544 6 240 2 Seat Increase 79%
DUS Dusseldorf 0 0 76,680 998 76,680 998 New Route -100%
EDI Edinburgh Turnhouse 223,512 2,439 255,936 2,717 32,424 278 Seat Increase 15%
FAO Faro 3,920 40 6,272 64 2,352 24 Seat Increase 60%
FLR Florence 0 0 24,172 270 24,172 270 New Route -100%
FRA Frankfurt International 96,000 1,204 95,932 1,194 -68 -10 Seat Decrease 0%
GLA Glasgow International 166,060 1,717 161,002 1,666 -5,058 -51 Seat Decrease -3%
GRX Granada 11,432 118 25,000 256 13,568 138 Seat Increase 119%
GVA Geneva Geneve-Cointrin 0 0 588 6 588 6 New Route -100%
HAM Hamburg Fuhlsbuettel 0 0 5,120 160 5,120 160 New Route -100%
IBZ Ibiza 52,270 563 64,748 680 12,478 117 Seat Increase 24%
IOM Isle Of Man Ronaldsway 54,106 1,077 53,400 1,068 -706 -9 Seat Decrease -1%
JFK
New York John F Kennedy
International 18,144 567 19,200 600 1,056 33 Seat Increase 6%
MAD Madrid Barajas 60,032 644 58,140 642 -1,892 -2 Seat Decrease -3%
MAH Menorca 9,900 110 15,270 165 5,370 55 Seat Increase 54%
NCE Nice Cote D'Azur 37,640 420 39,328 438 1,688 18 Seat Increase 4%
PMI Palma Mallorca 30,640 314 32,982 337 2,342 23 Seat Increase 8%
RTM Rotterdam 0 0 80,522 1,456 80,522 1456 New Route -100%
UIP Quimper Pluguffan 4,560 60 6,388 80 1,828 20 Seat Increase 40%
VCE Venice Marco Polo 33,168 360 17,844 196 -15,324 -164 Seat Decrease -46%
ZRH Zurich 104,872 1,209 123,838 1,354 18,966 145 Seat Increase 18%
BA Total 1,216,930 14,947 1,485,442 18,589 268,512 3,642 Seat Increase 22%
BE Flybe** ZZF to be confrimed 0 0 101,244 1,298 101,244 1298 New Route -100%
BE Total 0 0 101,244 1,298 101,244 1,298 New Route -100%
GR Aurigny Air Services GCI Guernsey 0 0 11,210 590 11,210 590 New Route -100%
GR Total 0 0 11,210 590 11,210 590 New Route -100%
J7 Fly Nonstop KRS Kristiansand Kjevik 22,000 220 0 0 -22,000 -220 Route Dropped -100%
J7 Total 22,000 220 0 0 -22,000 -220 Route Dropped -100%
LG Luxair LUX Luxembourg 112,176 1,558 144,648 1,914 32,472 356 Seat Increase 29%
LG Total 112,176 1,558 144,648 1,914 32,472 356 Seat Increase 29%
LH Lufthansa FRA Frankfurt International 109,604 1,166 106,596 1,134 -3,008 -32 Seat Decrease -3%
LH Total 109,604 1,166 106,596 1,134 -3,008 -32 Seat Decrease -3%
LX Swiss BSL
Basel Mulhouse
Euroairport Swiss 65,844 708 65,286 702 -558 -6 Seat Decrease -1%
GVA Geneva Geneve-Cointrin 134,664 1,448 127,038 1,366 -7,626 -82 Seat Decrease -6%
ZRH Zurich 219,108 2,356 192,882 2,074 -26,226 -282 Seat Decrease -12%
LX Total 419,616 4,512 385,206 4,142 -34,410 -370 Seat Decrease -8%
SI Blue Island JER Jersey States 31,296 652 31,296 652 0 0 No Change 0%
SI Total 31,296 652 31,296 652 0 0 No Change 0%
SX Skyworks BRN Berne Belp 24,204 712 23,102 744 -1,102 32 Seat Decrease -5%
SX Total 24,204 712 23,102 744 -1,102 32 Seat Decrease -5%
VE Alitalia LIN Milan Linate 107,800 1,078 116,000 1,160 8,200 82 Seat Increase 8%
VE Total 107,800 1,078 116,000 1,160 8,200 82 Seat Increase 8%
*In S13 flights operated as CityJet on behalf of Air france in S14 flights operated just as CityJet.
**As Flybe operations due to begin in September but not on sale, routes are indicitive only.
Airport Coordination Limited 3

LCY Start of Season Report S14
S13 START S13 END S14 START% CHANGE START-
START
% CHANGE END -
START
International 32,883 32,598 33,592 2.2% 3.0%
Domestic 8,686 8,473 8,918 2.7% 5.3%
Total 41,569 41,071 42,510 2.3% 3.5%
AIR TRANSPORT MOVEMENTS BY TERMINAL
0
5,000
10,000
15,000
20,000
25,000
30,000
35,000
40,000
International Domestic
S13 START S13 END S14 START
Airport Coordination Limited 4

LCY Start of Season Report S14
S13 START S13 END S14 START% CHANGE START-
START
% CHANGE END -
START
International 2,508,093 2,475,179 2,692,511 7.4% 8.8%
Domestic 623,246 606,213 687,572 10.3% 13.4%
Total 3,131,339 3,081,392 3,380,083 7.9% 9.7%
S13 START S13 END S14 START% CHANGE START-
START
% CHANGE END -
START
International 76.3 75.9 80.2 5.1% 5.6%Domestic 71.8 71.5 77.1 7.5% 7.8%
Average 75.3 75.0 79.5 5.6% 6.0%
SEATS PER PASSENGER ATM BY TERMINAL
TOTAL SEATS BY TERMINAL
0
500,000
1,000,000
1,500,000
2,000,000
2,500,000
3,000,000
International Domestic
S13 START S13 END S14 START
66.0
68.0
70.0
72.0
74.0
76.0
78.0
80.0
82.0
International Domestic Average
S13 START S13 END S14 START
Airport Coordination Limited 5

LCY Start of Season Report S14
Airlines ATMs
British Airways (BA) 18,589
Air France (AF) 11,591
Swiss International (LX) 4,118
Luxair (LG) 1,914
Alitalia (AZ/VE) 1,880
Flybe(BE) 1,298
Lufthansa (LH) 1,134
Sky Work (SX) 744
Blue Islands (SI) 652
Aurigny (GR) 590
Total 42,510
NOTES:
British Airways is the combined total for CityFlyer (CJ), SunAir (EZ) and British Airways (BA) programmes.
AIRLINES BY AIR TRANSPORT MOVEMENTS
British Airways (BA) 44%
Air France (AF) 27%
Swiss International (LX) 10%
Luxair (LG) 4%
Alitalia (AZ/VE) 4%
Flybe(BE) 3%
Lufthansa (LH) 3%
Sky Work (SX) 2%
Blue Islands (SI) 2%
Aurigny (GR) 1%
Airport Coordination Limited 6
LCY Start of Season Report S14
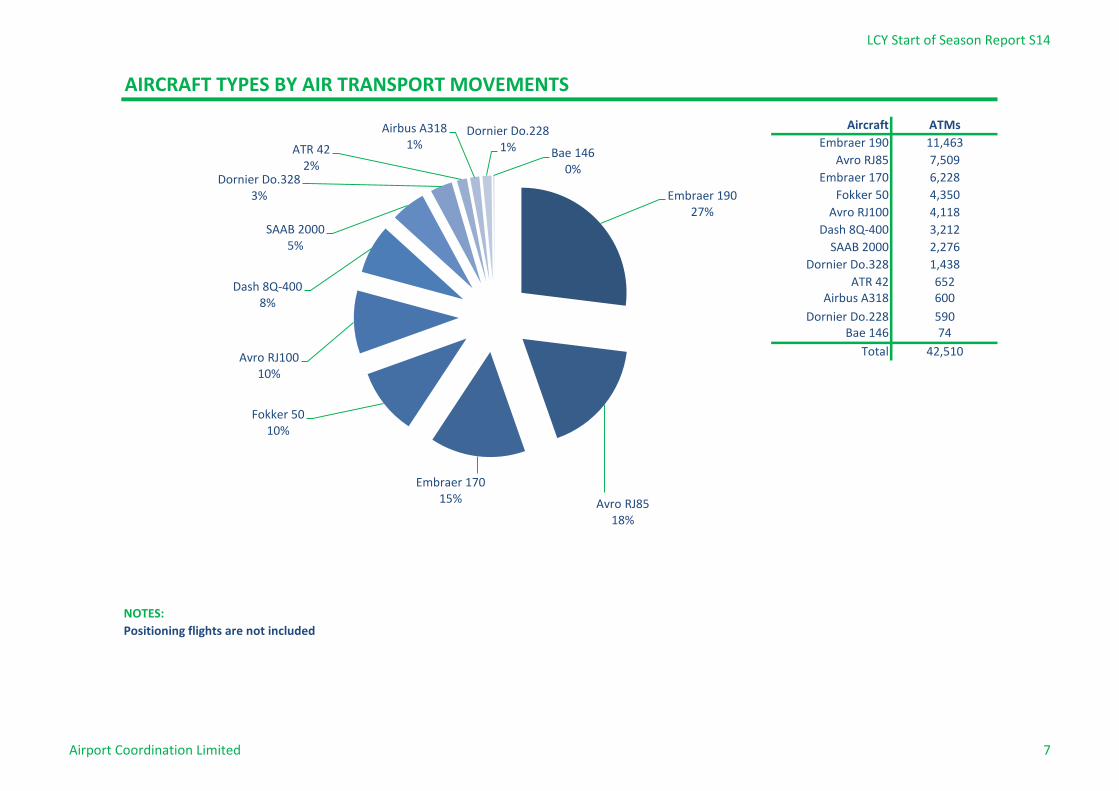
Aircraft ATMs
Embraer 190 11,463
Avro RJ85 7,509
Embraer 170 6,228
Fokker 50 4,350
Avro RJ100 4,118
Dash 8Q-400 3,212
SAAB 2000 2,276
Dornier Do.328 1,438
ATR 42 652Airbus A318 600
Dornier Do.228 590Bae 146 74
Total 42,510
NOTES:
Positioning flights are not included
AIRCRAFT TYPES BY AIR TRANSPORT MOVEMENTS
Embraer 190 27%
Avro RJ85 18%
Embraer 170 15%
Fokker 50 10%
Avro RJ100 10%
Dash 8Q-400 8%
SAAB 2000 5%
Dornier Do.328 3%
ATR 42 2%
Airbus A318 1%
Dornier Do.228 1% Bae 146
0%
Airport Coordination Limited 7
LCY Start of Season Report S14
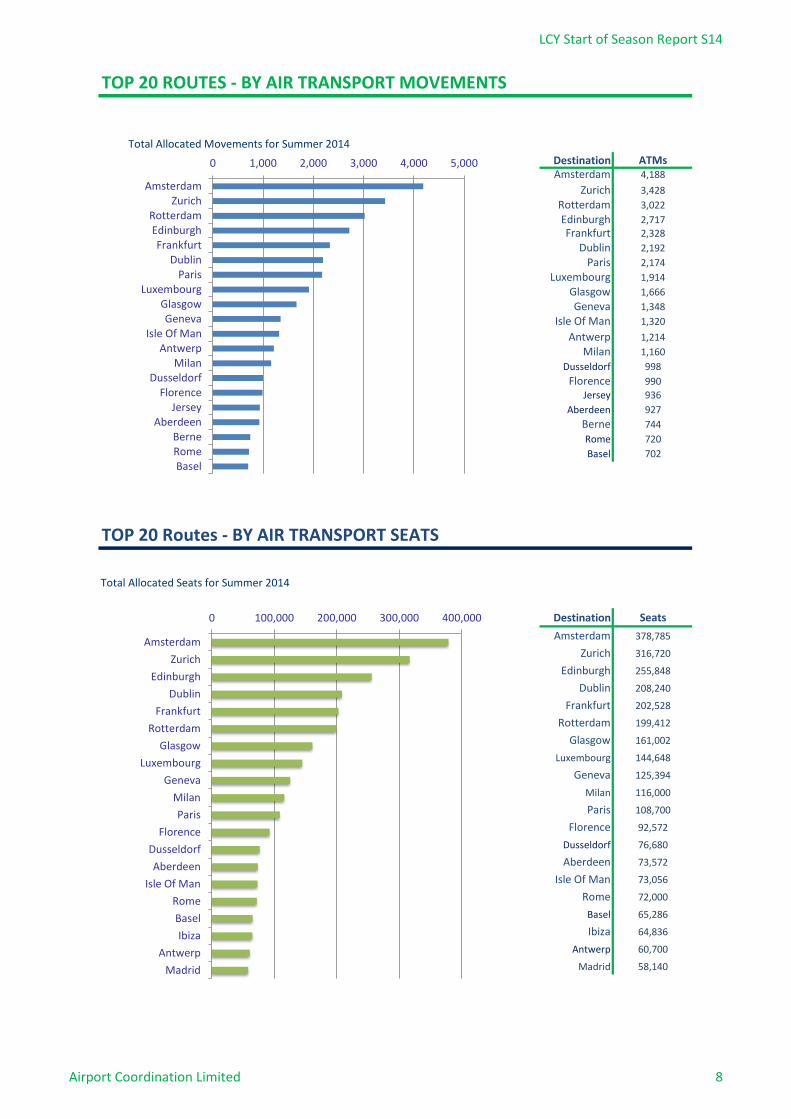
Destination ATMsAmsterdam 4,188
Zurich 3,428
Rotterdam 3,022
Edinburgh 2,717
Frankfurt 2,328
Dublin 2,192
Paris 2,174
Luxembourg 1,914
Glasgow 1,666
Geneva 1,348
Isle Of Man 1,320
Antwerp 1,214
Milan 1,160
Dusseldorf 998
Florence 990
Jersey 936
Aberdeen 927
Berne 744
Rome 720
Basel 702
Total Allocated Seats for Summer 2014
Destination Seats
Amsterdam 378,785
Zurich 316,720
Edinburgh 255,848
Dublin 208,240
Frankfurt 202,528
Rotterdam 199,412
Glasgow 161,002
Luxembourg 144,648
Geneva 125,394
Milan 116,000
05:30-05:45 limit of 2 movements. 05:30-05:59 limit of 4 movements. Paris 108,700
Florence 92,572
Dusseldorf 76,680
Aberdeen 73,572
Isle Of Man 73,056
Rome 72,000
Basel 65,286
Ibiza 64,836
Antwerp 60,700
Madrid 58,140
TOP 20 Routes - BY AIR TRANSPORT SEATS
TOP 20 ROUTES - BY AIR TRANSPORT MOVEMENTS
Total Allocated Movements for Summer 2014
0 1,000 2,000 3,000 4,000 5,000
AmsterdamZurich
RotterdamEdinburghFrankfurt
DublinParis
LuxembourgGlasgowGeneva
Isle Of ManAntwerp
MilanDusseldorf
FlorenceJersey
AberdeenBerneRomeBasel
0 100,000 200,000 300,000 400,000
Amsterdam
Zurich
Edinburgh
Dublin
Frankfurt
Rotterdam
Glasgow
Luxembourg
Geneva
Milan
Paris
Florence
Dusseldorf
Aberdeen
Isle Of Man
Rome
Basel
Ibiza
Antwerp
Madrid
Airport Coordination Limited 8
LCY Start of Season Report S14
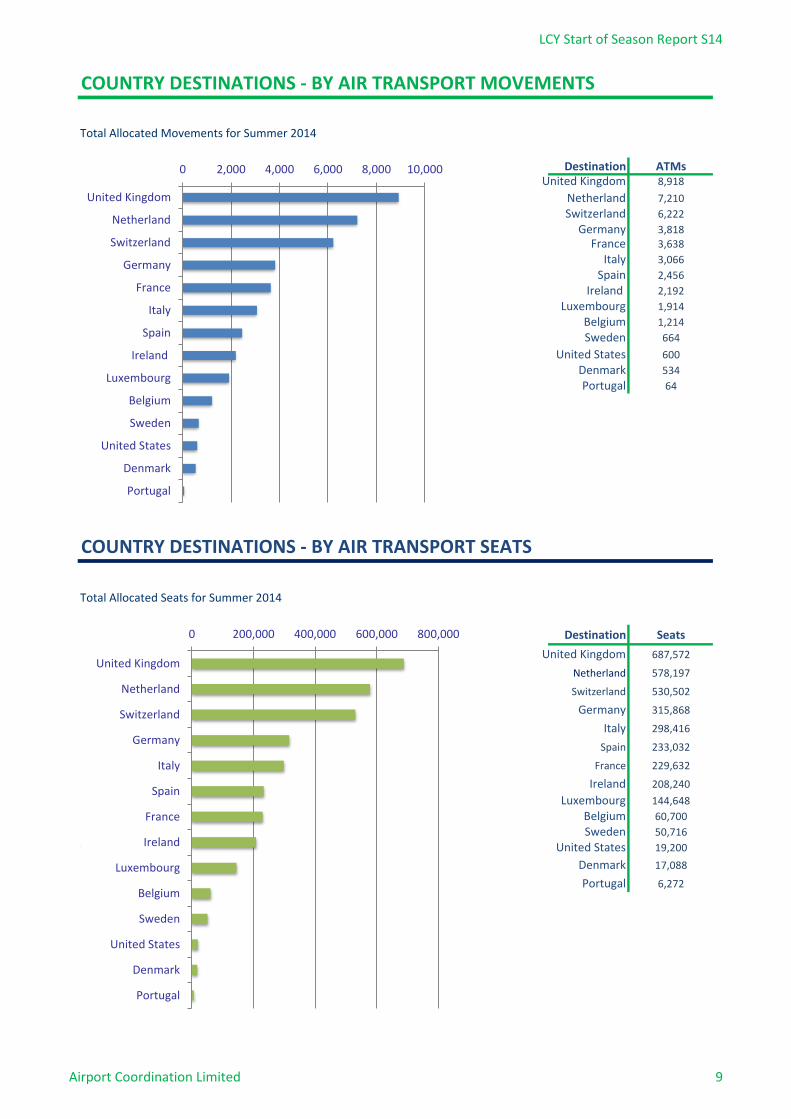
Total Allocated Movements for Summer 2014
Destination ATMsUnited Kingdom 8,918
Netherland 7,210
Switzerland 6,222
Germany 3,818France 3,638
Italy 3,066
Spain 2,456
Ireland 2,192
Luxembourg 1,914
Belgium 1,214
Sweden 664
United States 600
Denmark 534
Portugal 64
Total Allocated Seats for Summer 2014
Destination Seats
United Kingdom 687,572
Netherland 578,197
Switzerland 530,502
Germany 315,868
Italy 298,416
Spain 233,032
France 229,632
Ireland 208,240
Luxembourg 144,648
Belgium 60,700
Sweden 50,716
05:30-05:45 limit of 2 movements. 05:30-05:59 limit of 4 movements. United States 19,200
Denmark 17,088
Portugal 6,272
COUNTRY DESTINATIONS - BY AIR TRANSPORT SEATS
COUNTRY DESTINATIONS - BY AIR TRANSPORT MOVEMENTS
0 2,000 4,000 6,000 8,000 10,000
United Kingdom
Netherland
Switzerland
Germany
France
Italy
Spain
Ireland
Luxembourg
Belgium
Sweden
United States
Denmark
Portugal
0 200,000 400,000 600,000 800,000
United Kingdom
Netherland
Switzerland
Germany
Italy
Spain
France
Ireland
Luxembourg
Belgium
Sweden
United States
Denmark
Portugal
Airport Coordination Limited 9

LCY Start of Season Report S14
AIR TRANSPORT MOVEMENTS BY MONTH S14
Average Daily Allocated Movements for Summer 2014
Month ATMs
March 172
April 192
May 189
June 205
July 201
August 174
September 234
October 230
TOTAL 202
SEATS BY MONTH S14
Average Daily Allocated Seats for Summer 2014
Month Seats
March 13,506
April 15,110
May 14,946
June 16,295July 16,030
August 14,002September 18,619
October 18,322
TOTAL 16,096
05:30-05:45 limit of 2 movements. 05:30-05:59 limit of 4 movements.
0 50 100 150 200 250
April
May
June
July
August
September
October
0 5,000 10,000 15,000 20,000
April
May
June
July
August
September
October
Airport Coordination Limited 10
LCY Start of Season Report S14
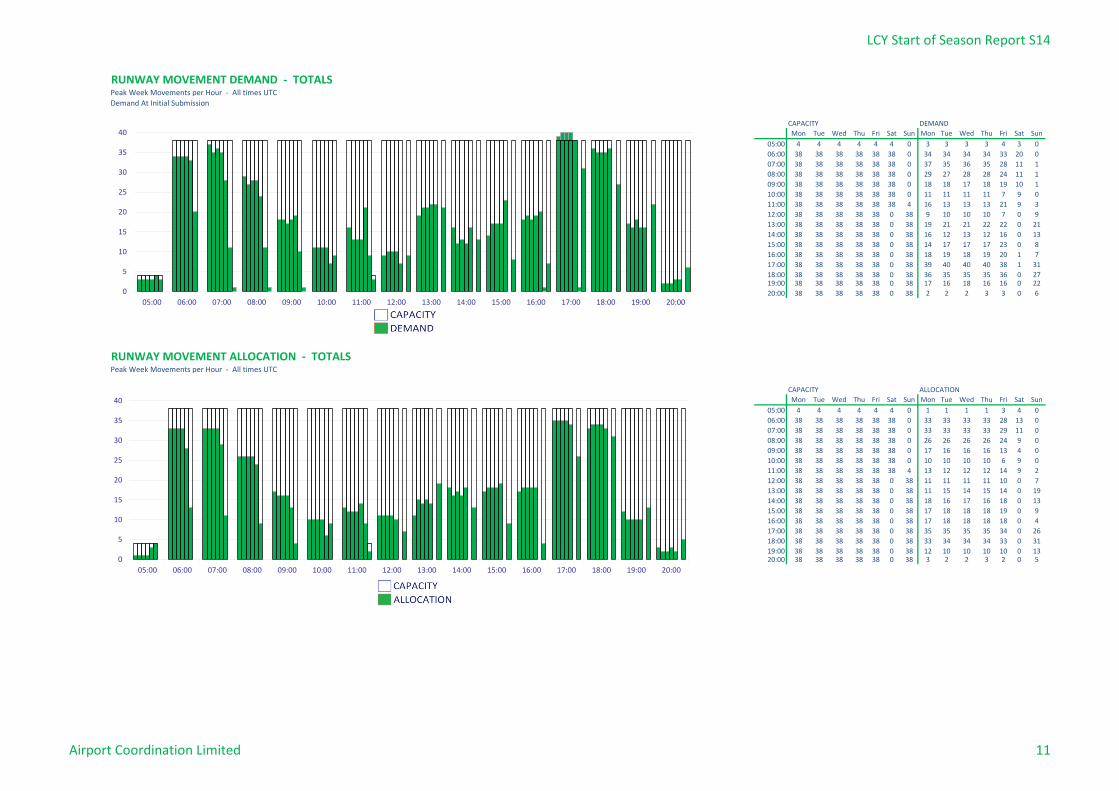
RUNWAY MOVEMENT DEMAND - TOTALSPeak Week Movements per Hour - All times UTC
Demand At Initial Submission
CAPACITY DEMAND
Mon Tue Wed Thu Fri Sat Sun Mon Tue Wed Thu Fri Sat Sun
05:00 4 4 4 4 4 4 0 3 3 3 3 4 3 0
06:00 38 38 38 38 38 38 0 34 34 34 34 33 20 0
07:00 38 38 38 38 38 38 0 37 35 36 35 28 11 1
08:00 38 38 38 38 38 38 0 29 27 28 28 24 11 1
09:00 38 38 38 38 38 38 0 18 18 17 18 19 10 1
10:00 38 38 38 38 38 38 0 11 11 11 11 7 9 0
11:00 38 38 38 38 38 38 4 16 13 13 13 21 9 3
12:00 38 38 38 38 38 0 38 9 10 10 10 7 0 9
13:00 38 38 38 38 38 0 38 19 21 21 22 22 0 21
14:00 38 38 38 38 38 0 38 16 12 13 12 16 0 13
15:00 38 38 38 38 38 0 38 14 17 17 17 23 0 8
16:00 38 38 38 38 38 0 38 18 19 18 19 20 1 7
17:00 38 38 38 38 38 0 38 39 40 40 40 38 1 31
18:00 38 38 38 38 38 0 38 36 35 35 35 36 0 2719:00 38 38 38 38 38 0 38 17 16 18 16 16 0 22
20:00 38 38 38 38 38 0 38 2 2 2 3 3 0 6
RUNWAY MOVEMENT ALLOCATION - TOTALSPeak Week Movements per Hour - All times UTC
CAPACITY ALLOCATION
Mon Tue Wed Thu Fri Sat Sun Mon Tue Wed Thu Fri Sat Sun
05:00 4 4 4 4 4 4 0 1 1 1 1 3 4 0
06:00 38 38 38 38 38 38 0 33 33 33 33 28 13 0
07:00 38 38 38 38 38 38 0 33 33 33 33 29 11 0
08:00 38 38 38 38 38 38 0 26 26 26 26 24 9 0
09:00 38 38 38 38 38 38 0 17 16 16 16 13 4 0
10:00 38 38 38 38 38 38 0 10 10 10 10 6 9 0
11:00 38 38 38 38 38 38 4 13 12 12 12 14 9 2
12:00 38 38 38 38 38 0 38 11 11 11 11 10 0 7
13:00 38 38 38 38 38 0 38 11 15 14 15 14 0 19
14:00 38 38 38 38 38 0 38 18 16 17 16 18 0 13
15:00 38 38 38 38 38 0 38 17 18 18 18 19 0 9
16:00 38 38 38 38 38 0 38 17 18 18 18 18 0 4
05:30-05:45 limit of 2 movements. 05:30-05:59 limit of 4 movements. 17:00 38 38 38 38 38 0 38 35 35 35 35 34 0 26
18:00 38 38 38 38 38 0 38 33 34 34 34 33 0 31
19:00 38 38 38 38 38 0 38 12 10 10 10 10 0 1320:00 38 38 38 38 38 0 38 3 2 2 3 2 0 5
0
5
10
15
20
25
30
35
40
05:00 06:00 07:00 08:00 09:00 10:00 11:00 12:00 13:00 14:00 15:00 16:00 17:00 18:00 19:00 20:00
0
5
10
15
20
25
30
35
40
05:00 06:00 07:00 08:00 09:00 10:00 11:00 12:00 13:00 14:00 15:00 16:00 17:00 18:00 19:00 20:00
Airport Coordination Limited 11
LCY Start of Season Report S14
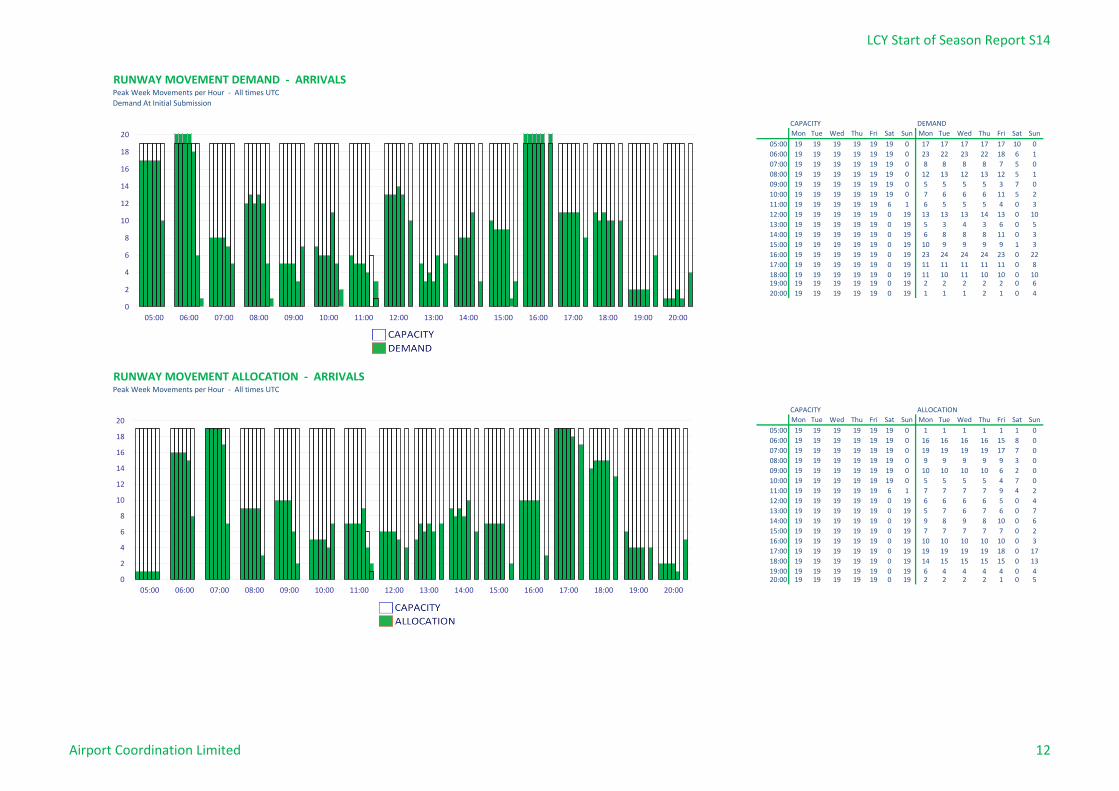
RUNWAY MOVEMENT DEMAND - ARRIVALSPeak Week Movements per Hour - All times UTC
Demand At Initial Submission
CAPACITY DEMAND
Mon Tue Wed Thu Fri Sat Sun Mon Tue Wed Thu Fri Sat Sun
05:00 19 19 19 19 19 19 0 17 17 17 17 17 10 0
06:00 19 19 19 19 19 19 0 23 22 23 22 18 6 1
07:00 19 19 19 19 19 19 0 8 8 8 8 7 5 0
08:00 19 19 19 19 19 19 0 12 13 12 13 12 5 1
09:00 19 19 19 19 19 19 0 5 5 5 5 3 7 0
10:00 19 19 19 19 19 19 0 7 6 6 6 11 5 2
11:00 19 19 19 19 19 6 1 6 5 5 5 4 0 3
12:00 19 19 19 19 19 0 19 13 13 13 14 13 0 10
13:00 19 19 19 19 19 0 19 5 3 4 3 6 0 5
14:00 19 19 19 19 19 0 19 6 8 8 8 11 0 3
15:00 19 19 19 19 19 0 19 10 9 9 9 9 1 3
16:00 19 19 19 19 19 0 19 23 24 24 24 23 0 22
17:00 19 19 19 19 19 0 19 11 11 11 11 11 0 8
18:00 19 19 19 19 19 0 19 11 10 11 10 10 0 1019:00 19 19 19 19 19 0 19 2 2 2 2 2 0 6
20:00 19 19 19 19 19 0 19 1 1 1 2 1 0 4
RUNWAY MOVEMENT ALLOCATION - ARRIVALSPeak Week Movements per Hour - All times UTC
CAPACITY ALLOCATION
Mon Tue Wed Thu Fri Sat Sun Mon Tue Wed Thu Fri Sat Sun
05:00 19 19 19 19 19 19 0 1 1 1 1 1 1 0
06:00 19 19 19 19 19 19 0 16 16 16 16 15 8 0
07:00 19 19 19 19 19 19 0 19 19 19 19 17 7 0
08:00 19 19 19 19 19 19 0 9 9 9 9 9 3 0
09:00 19 19 19 19 19 19 0 10 10 10 10 6 2 0
10:00 19 19 19 19 19 19 0 5 5 5 5 4 7 0
11:00 19 19 19 19 19 6 1 7 7 7 7 9 4 2
12:00 19 19 19 19 19 0 19 6 6 6 6 5 0 4
13:00 19 19 19 19 19 0 19 5 7 6 7 6 0 7
14:00 19 19 19 19 19 0 19 9 8 9 8 10 0 6
05:30-05:45 limit of 2 movements. 05:30-05:59 limit of 4 movements. 15:00 19 19 19 19 19 0 19 7 7 7 7 7 0 2
16:00 19 19 19 19 19 0 19 10 10 10 10 10 0 3
17:00 19 19 19 19 19 0 19 19 19 19 19 18 0 17
18:00 19 19 19 19 19 0 19 14 15 15 15 15 0 13
19:00 19 19 19 19 19 0 19 6 4 4 4 4 0 420:00 19 19 19 19 19 0 19 2 2 2 2 1 0 5
0
2
4
6
8
10
12
14
16
18
20
05:00 06:00 07:00 08:00 09:00 10:00 11:00 12:00 13:00 14:00 15:00 16:00 17:00 18:00 19:00 20:00
0
2
4
6
8
10
12
14
16
18
20
05:00 06:00 07:00 08:00 09:00 10:00 11:00 12:00 13:00 14:00 15:00 16:00 17:00 18:00 19:00 20:00
Airport Coordination Limited 12
LCY Start of Season Report S14
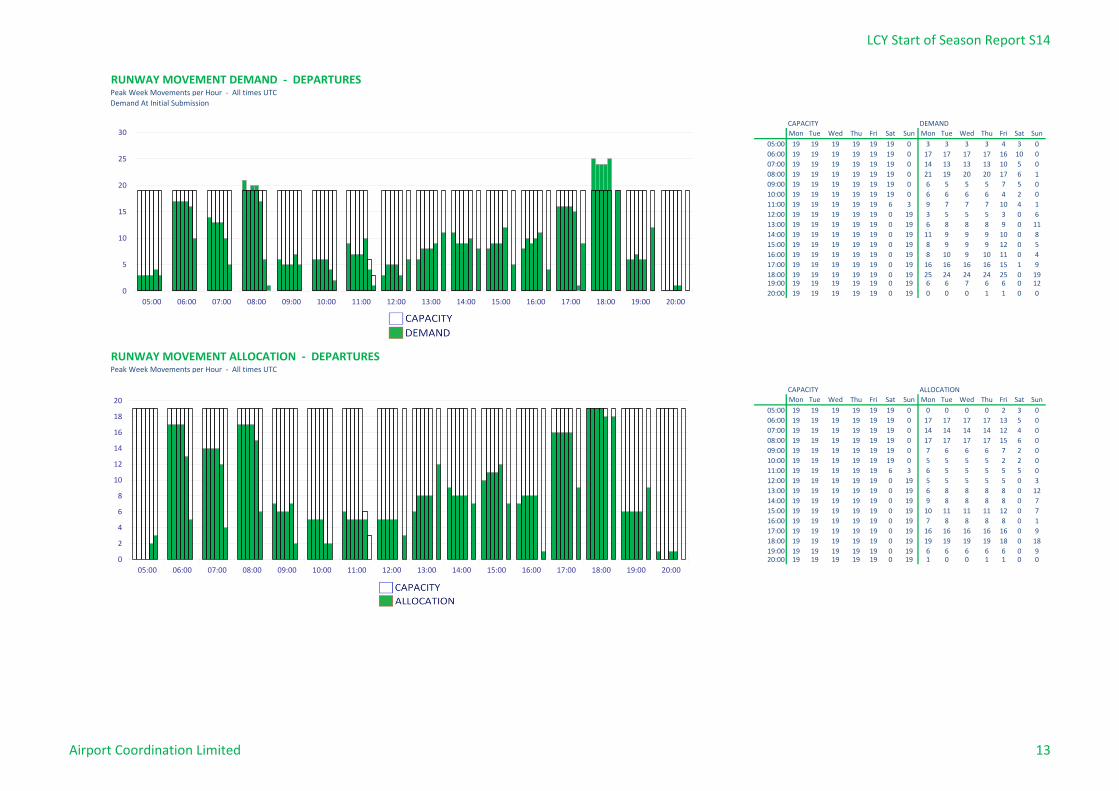
RUNWAY MOVEMENT DEMAND - DEPARTURESPeak Week Movements per Hour - All times UTC
Demand At Initial Submission
CAPACITY DEMAND
Mon Tue Wed Thu Fri Sat Sun Mon Tue Wed Thu Fri Sat Sun
05:00 19 19 19 19 19 19 0 3 3 3 3 4 3 0
06:00 19 19 19 19 19 19 0 17 17 17 17 16 10 0
07:00 19 19 19 19 19 19 0 14 13 13 13 10 5 0
08:00 19 19 19 19 19 19 0 21 19 20 20 17 6 1
09:00 19 19 19 19 19 19 0 6 5 5 5 7 5 0
10:00 19 19 19 19 19 19 0 6 6 6 6 4 2 0
11:00 19 19 19 19 19 6 3 9 7 7 7 10 4 1
12:00 19 19 19 19 19 0 19 3 5 5 5 3 0 6
13:00 19 19 19 19 19 0 19 6 8 8 8 9 0 11
14:00 19 19 19 19 19 0 19 11 9 9 9 10 0 8
15:00 19 19 19 19 19 0 19 8 9 9 9 12 0 5
16:00 19 19 19 19 19 0 19 8 10 9 10 11 0 4
17:00 19 19 19 19 19 0 19 16 16 16 16 15 1 9
18:00 19 19 19 19 19 0 19 25 24 24 24 25 0 1919:00 19 19 19 19 19 0 19 6 6 7 6 6 0 12
20:00 19 19 19 19 19 0 19 0 0 0 1 1 0 0
RUNWAY MOVEMENT ALLOCATION - DEPARTURESPeak Week Movements per Hour - All times UTC
CAPACITY ALLOCATION
Mon Tue Wed Thu Fri Sat Sun Mon Tue Wed Thu Fri Sat Sun
05:00 19 19 19 19 19 19 0 0 0 0 0 2 3 0
06:00 19 19 19 19 19 19 0 17 17 17 17 13 5 0
07:00 19 19 19 19 19 19 0 14 14 14 14 12 4 0
08:00 19 19 19 19 19 19 0 17 17 17 17 15 6 0
09:00 19 19 19 19 19 19 0 7 6 6 6 7 2 0
10:00 19 19 19 19 19 19 0 5 5 5 5 2 2 0
11:00 19 19 19 19 19 6 3 6 5 5 5 5 5 0
12:00 19 19 19 19 19 0 19 5 5 5 5 5 0 3
13:00 19 19 19 19 19 0 19 6 8 8 8 8 0 12
14:00 19 19 19 19 19 0 19 9 8 8 8 8 0 7
15:00 19 19 19 19 19 0 19 10 11 11 11 12 0 7
16:00 19 19 19 19 19 0 19 7 8 8 8 8 0 1
05:30-05:45 limit of 2 movements. 05:30-05:59 limit of 4 movements. 17:00 19 19 19 19 19 0 19 16 16 16 16 16 0 9
18:00 19 19 19 19 19 0 19 19 19 19 19 18 0 18
19:00 19 19 19 19 19 0 19 6 6 6 6 6 0 920:00 19 19 19 19 19 0 19 1 0 0 1 1 0 0
0
5
10
15
20
25
30
05:00 06:00 07:00 08:00 09:00 10:00 11:00 12:00 13:00 14:00 15:00 16:00 17:00 18:00 19:00 20:00
0
2
4
6
8
10
12
14
16
18
20
05:00 06:00 07:00 08:00 09:00 10:00 11:00 12:00 13:00 14:00 15:00 16:00 17:00 18:00 19:00 20:00
Airport Coordination Limited 13
LCY Start of Season Report S14
Airport Coordination Limited 14

LCY Start of Season Report S14
Air Transport Movement (ATM) A scheduled or charter passenger or freight aircraft movement.
Allocation The allocation of slots such that demand is constrained to fit within declared
scheduling limits.
Common Travel Area (CTA) Services to or from the Republic of Ireland and the Channel Islands.
DemandThe unconstrained demand for slots, prior to any schedule adjustments.
Passenger ATM A scheduled or charter passenger aircraft movement (ie, exluding all-cargo
aircraft movements).
Scheduling Limits Limiting parameters declared by the Airport Operator used in the
coordination process.
Seats The number of seats based on the aircraft configuration advised by the
airline.
Peak Week The Peak Week for Summer 2014 is Week 27 (29th September to 05th
October)
Summer 2014 Data Snapshot All data used for this report was as held at 13 March 2014
Summer 2013 Data S13 Start of Season was as held on 21 March 2013S13 End of Season was as held on 13 March 2014
GUIDE TO HISTOGRAMS
The histograms show the pattern of traffic by time of day against the appropriate scheduling limit. Each time period
consist of seven columns representing the days-of-week, Monday through Sunday.
GLOSSARY OF TERMS
Airport Coordination Limited 15