london november 20, 2003 aesc european conference new leadership for a changing europe why ceos fall...
TRANSCRIPT

LondonLondonNovember 20, 2003November 20, 2003
AESC European ConferenceAESC European ConferenceNew Leadership for a Changing EuropeNew Leadership for a Changing Europe
Why CEOs FallWhy CEOs FallA Global Perspective on CEO TurnoverA Global Perspective on CEO Turnover

2
Today’s Agenda: Addressing Three Key QuestionsToday’s Agenda: Addressing Three Key Questions
Why has leadership become so difficult Why has leadership become so difficult and risky?and risky?
Why has life at the top become nasty, Why has life at the top become nasty, brutish and short?brutish and short?
So, what do we do about this mess?So, what do we do about this mess?
The Leadership ChallengeThe Leadership Challenge

4
Today’s management challengesToday’s management challenges
Growth (innovation, technology evolution, new shape of growth in developed Growth (innovation, technology evolution, new shape of growth in developed economies, etc.)economies, etc.)
Demanding customers (audience fragmentation, CRM, smart customization, etc.)Demanding customers (audience fragmentation, CRM, smart customization, etc.)
ROI (marketing and sales effectiveness)ROI (marketing and sales effectiveness)
New Competition (disaggregating value chains, Innovator’s dilemma, emerging New Competition (disaggregating value chains, Innovator’s dilemma, emerging markets, etc.)markets, etc.)
‘‘Glocalisation’ (linking economies of scale and scope with local execution)Glocalisation’ (linking economies of scale and scope with local execution)
The Human Factor (labor mobility, war for talent, how do values create value, The Human Factor (labor mobility, war for talent, how do values create value, alignment, etc.)alignment, etc.)

5
… but also… but also
Discontinuities (9/11, X-rates, capital markets, etc.)Discontinuities (9/11, X-rates, capital markets, etc.)
Wayward CEOs and Corporate scandalsWayward CEOs and Corporate scandals
Corporate GovernanceCorporate Governance
Shareholder activismShareholder activism

6
One big theme that underlies these trends…One big theme that underlies these trends…
Meta-networks
Complex options
Competition
Transparency
Asymmetric Risk
““Managing Managing complexity in a complexity in a
world of continual, world of continual, discontinuous discontinuous
change”change”

Life at the TopLife at the Top
8
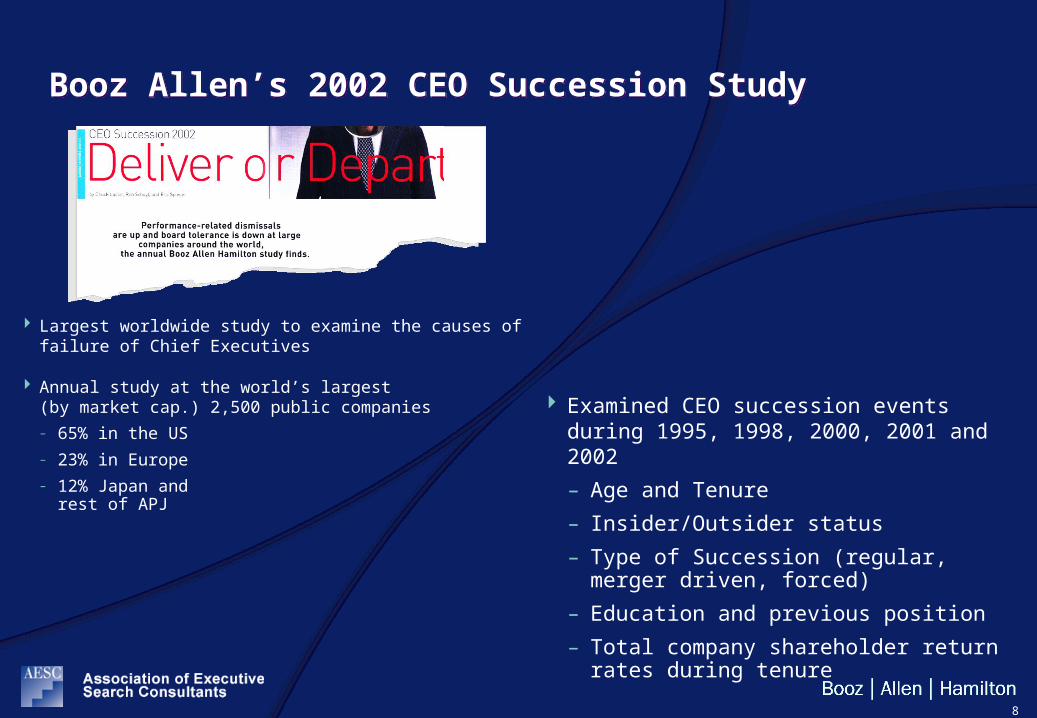
Booz Allen’s 2002 CEO Succession StudyBooz Allen’s 2002 CEO Succession Study
Largest worldwide study to examine the causes of failure of Chief Executives
Annual study at the world’s largest (by market cap.) 2,500 public companies
– 65% in the US
– 23% in Europe
– 12% Japan and rest of APJ
Examined CEO succession events during 1995, 1998, 2000, 2001 and 2002
– Age and Tenure
– Insider/Outsider status
– Type of Succession (regular, merger driven, forced)
– Education and previous position
– Total company shareholder return rates during tenure
9
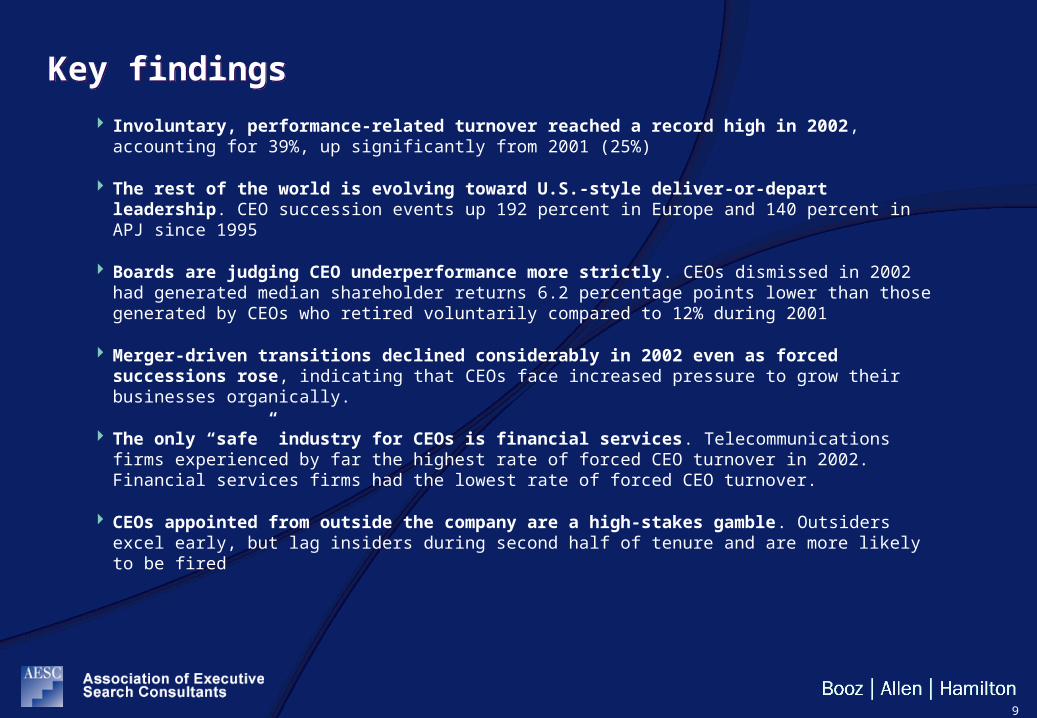
Key findingsKey findings
Involuntary, performance-related turnover reached a record high in 2002, accounting for 39%, up significantly from 2001 (25%)
The rest of the world is evolving toward U.S.-style deliver-or-depart leadership. CEO succession events up 192 percent in Europe and 140 percent in APJ since 1995
Boards are judging CEO underperformance more strictly. CEOs dismissed in 2002 had generated median shareholder returns 6.2 percentage points lower than those generated by CEOs who retired voluntarily compared to 12% during 2001
Merger-driven transitions declined considerably in 2002 even as forced successions rose, indicating that CEOs face increased pressure to grow their businesses organically.
The only “safe” industry for CEOs is financial services. Telecommunications firms experienced by far the highest rate of forced CEO turnover in 2002. Financial services firms had the lowest rate of forced CEO turnover.
CEOs appointed from outside the company are a high-stakes gamble. Outsiders excel early, but lag insiders during second half of tenure and are more likely to be fired

10
North America still leads in rate of CEO successionsNorth America still leads in rate of CEO successions
253 global succession events during 2002 (10.1%)
Succession rate in Europe is catching up.
Sharp increases also seen in Japan and rest of Asia.
3.5% 3.0%4.9%
6.2%4.3%
2.3%
9.8%
2.2%3.3%
8.4%
4.1%
1.9%
10.5% 10.2%8.5% 8.6%
10.3%10.6%
17.9%
13.5%
0.0%2.0%4.0%6.0%8.0%
10.0%12.0%14.0%
16.0%18.0%
20.0%
North America Europe Japan Rest of Asia/Pacific
1995 1998 2000 2001 2002
Regional Succession Rates Among Top CompaniesRegional Succession Rates Among Top Companies

11
Rate of performance-related successions rose 70% over 2001 Rate of performance-related successions rose 70% over 2001
Forced events made up 39 percent of the global total last year; in 2001, they accounted for one-quarter of all successions.
Mergers drove only 15 percent of succession events in 2002
– compared with 27 percent in 2001 and 29 percent in 2000
Global Results of CEO SuccessionGlobal Results of CEO Succession
Regular 4.2%
1995
3.6%
1998
4.8%
2000
4.4%
2001
4.7%
2002
Performance-Related 1.0% 1.9% 3.2% 2.3% 3.9%
Merger-Driven 0.8% 1.9% 3.2% 2.5% 1.5%
12
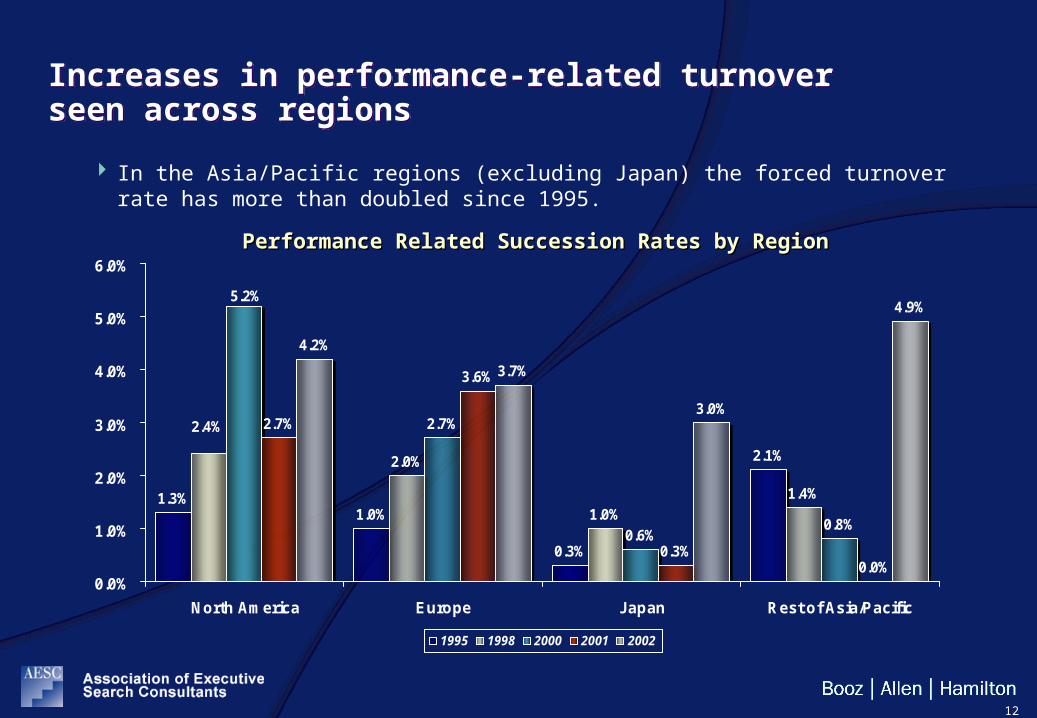
Increases in performance-related turnover seen across regions Increases in performance-related turnover seen across regions
In the Asia/Pacific regions (excluding Japan) the forced turnover rate has more than doubled since 1995.
1.3%1.0%
0.3%
2.1%2.0%
1.0%1.4%
2.7%
0.6%0.8%
2.7%
3.6%
0.3%0.0%
4.2%
3.7%
3.0%
4.9%
2.4%
5.2%
0.0%
1.0%
2.0%
3.0%
4.0%
5.0%
6.0%
North America Europe Japan Rest of Asia/Pacific
1995 1998 2000 2001 2002
Performance Related Succession Rates by RegionPerformance Related Succession Rates by Region

13
Performance mattersPerformance matters
Poor shareholder performance continues to drive forced turnover.
For departing “class of 2002” performance gap was 6.2 points, half of what prompted dismissal during 2001 (11.9%) and even less than in 2000 (13.5%)
Media Shareholder Returns, by Reason for SuccessionMedia Shareholder Returns, by Reason for Succession
Regular 2.1%
1995
0.8%
1998
-4.3%
2000
2.0%
2001
4.8%
2002
Performance-Related -3.1% -4.5% -17.8% -9.9% -1.4%
Return Gap 5.2 pts 5.3 pts 13.5 pts 11.9 pts 6.2 pts
14
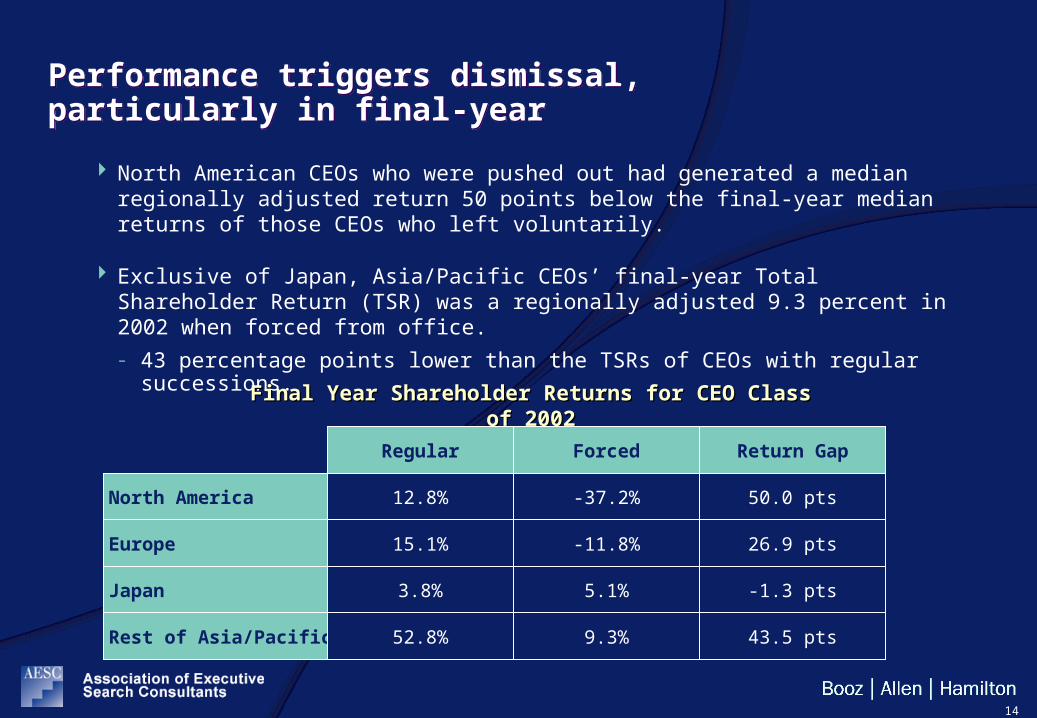
North American CEOs who were pushed out had generated a median regionally adjusted return 50 points below the final-year median returns of those CEOs who left voluntarily.
Exclusive of Japan, Asia/Pacific CEOs’ final-year Total Shareholder Return (TSR) was a regionally adjusted 9.3 percent in 2002 when forced from office.
– 43 percentage points lower than the TSRs of CEOs with regular successions.
Performance triggers dismissal, particularly in final-yearPerformance triggers dismissal, particularly in final-year
Final Year Shareholder Returns for CEO Class of 2002Final Year Shareholder Returns for CEO Class of 2002
North America
Europe
12.8%
Regular
-37.2%
Forced
50.0 pts
Return Gap
15.1% -11.8% 26.9 pts
Japan
Rest of Asia/Pacific
3.8% 5.1% -1.3 pts
52.8% 9.3% 43.5 pts

15
Performance gaps largest in North America and EuropePerformance gaps largest in North America and Europe
Shareholder returns not a driver for performance-related successions in Japan
6.3
13.3
4.26.4
13.3
2.3
-5.7
28.0
4.7
16.8
6.3
1.3
10.1
6.3
-3.7
4.55.1
15.3
-10
-5
0
5
10
15
20
25
30
North America Europe Japan Rest of Asia/Pacific
1995 1998 2000 2001 2002
Median Shareholder Returns, by Region Performance RelatedMedian Shareholder Returns, by Region Performance Related
n/an/a n/an/a

16
Two industries with high turnover in the five years studied stand out: telecommunications services and energyTwo industries with high turnover in the five years studied stand out: telecommunications services and energy
Financial services had the lowest CEO turnover in four of the previous years we studied and the second lowest turnover in 2002.
Across the five years, telecommunications services has the highest forced turnover.
Regular
Telecommunications Services
Energy
Information Technology
Materials
Consumer Staples
Consumer Discretionary
Utilities
Industrials
Financial Services
Average Across Industries
15.6% 12.1%
12.6% 11.3%
9.1% 9.7%
13.5% 9.3%
2002 All 5 Years
8.9% 9.2%
9.2% 8.9%
15.8% 8.9%
8.3% 8.5%
8.6% 6.6%
10.1% 8.8%
Health 9.7% 9.4%
Regular
Information Technology
Telecommunications Services
Consumer Discretionary
Utilities
Consumer Staples
Industrials
Materials
Energy
Financial Services
Average Across Industries
4.7% 4.3%
9.4% 4.2%
3.5% 3.1%
5.7% 2.2%
2002 All 5 Years
1.8% 2.2%
3.2% 2.0%
5.2% 1.9%
2.5% 1.7%
3.3% 1.5%
3.9% 2.5%
Health Care 3.8% 2.8%
Succession Rates, by IndustrySuccession Rates, by Industry Forced Succession Rates, by IndustryForced Succession Rates, by Industry

17
Outsider CEOs – a risky businessOutsider CEOs – a risky business
Outsiders face a much greater — and an increasing — probability of being fired.
Outsiders come on extremely strong, are unable to uphold their early promise, and are more likely to generate disaffection among shareholders and dismissals by boards.
Forced Succession Among Insider and Outsider CEOs, by RegionForced Succession Among Insider and Outsider CEOs, by Region
North America
Europe
Asia/Pacific
Global
49%
Insiders
57%
Outsiders
38% 64%
42% 0%
44% 53%
2002
31%
Insiders
38%
Outsiders
45% 54%
30% 40%
34% 43%
All 5 Years
18
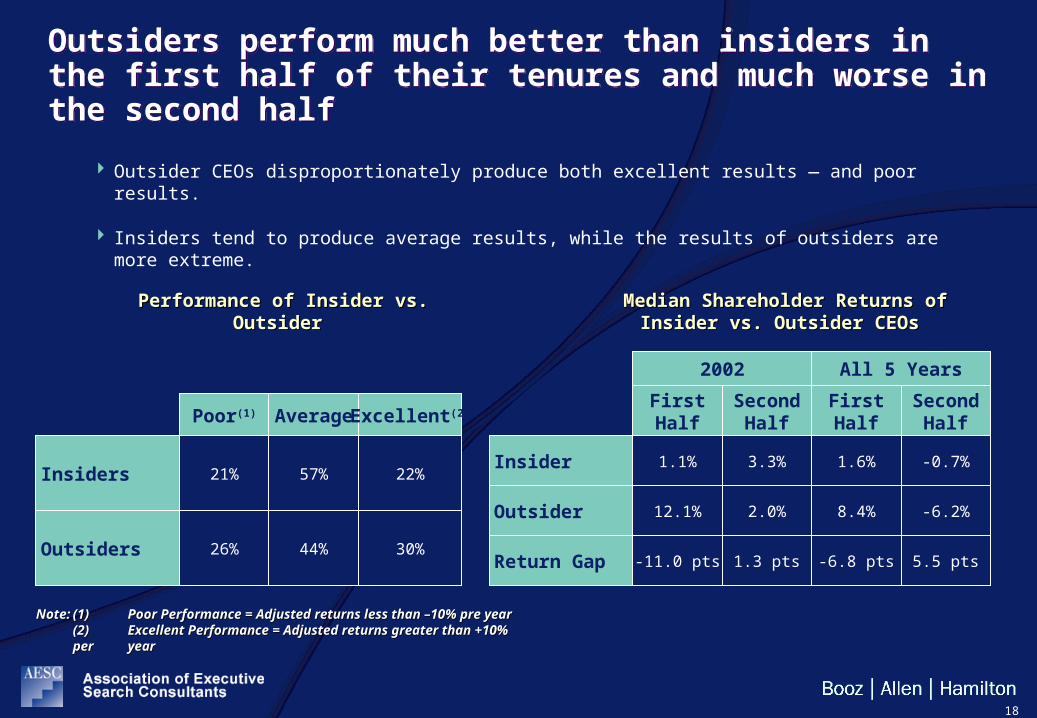
Outsiders perform much better than insiders in the first half of their tenures and much worse in the second halfOutsiders perform much better than insiders in the first half of their tenures and much worse in the second half
Outsider CEOs disproportionately produce both excellent results — and poor results.
Insiders tend to produce average results, while the results of outsiders are more extreme.
Insider 1.1%
FirstHalf
3.3%
SecondHalf
2002
1.6%
FirstHalf
-0.7%
SecondHalf
All 5 Years
Median Shareholder Returns of Median Shareholder Returns of Insider vs. Outsider CEOsInsider vs. Outsider CEOs
Poor(1) Average Excellent(2)
Performance of Insider vs. OutsiderPerformance of Insider vs. Outsider
Outsiders 26% 44% 30%
Insiders 21% 57% 22%
Outsider 12.1% 2.0% 8.4% -6.2%
Return Gap -11.0 pts 1.3 pts -6.8 pts 5.5 pts
Note:Note: (1)(1) Poor Performance = Adjusted returns less than –10% pre Poor Performance = Adjusted returns less than –10% pre yearyear(2)(2) Excellent Performance = Adjusted returns greater than +10% Excellent Performance = Adjusted returns greater than +10% per per yearyear

19
Life at the Top is getting shorter Life at the Top is getting shorter
The average tenure for CEOs forced from office across all regions has declined since 1995
2002 seems an exception. Both in the US and in Europe the mean tenure length for fired CEOs increased. 7.9 yrs in the US and 5.4 yrs in Europe – the longest since 1995
8.9
4.85.6
7.0
5.1
7.5
6.3
4.9
3.5
4.84.6 4.5
8.0
4.6
7.9
5.4
3.9
6.46.2
4.9 4.85.7
6.8
4.9
012345
6789
10
North America Europe Asia/Pacific Global
1995 1998 2000 2001 2002 All 5 Years
Average Tenure (in Years) of Departing CEOs, by Region Performance RelatedAverage Tenure (in Years) of Departing CEOs, by Region Performance Related

20
In conclusion …In conclusion …
Despite increases in CEO tenure and age, professional lives of CEOs resemble the Hobbesian man: nasty, brutish and short
Increased CEO ‘volatility’ is natural outcome of two-decade trend toward “celebritizing” of individual CEOs, especially in North America and Europe
Five observations:
1. Individual leadership still matters
2. Execution and vision cannot be divided
3. Hit the ground running – and then keep running
4. Board shouldn’t just be judge and jury; it must be coach and counselor
5. Help the board become more effective too

The Transformation ImperativeThe Transformation Imperative

22
The Need for Strategy Based TransformationThe Need for Strategy Based Transformation
Complexity is the challenge
Transformation is the path
Resilience is the goal
Meta-networks
Complex options
Competition
Transparency
Asymmetric Risk

23
Strategy Based Transformation
Strategy
“Establish the case for change”
Capabilities
“Define what to change“
Program Architecture
“Determine how to change“
Change Management
“Get it done“
Mission:“Booz Allen Hamilton works with clients to deliver results that endure”
A unique perspective on the dynamics of businesses and governments in today’s world…– Complexity is the
challenge– Transformation is
the path– Resilience is the goal
Fix problems/build capabilities by blending multi-functional expertise (Strategy, Oper-ations, Organization, IT) to address client priorities:– Channels, Customers and
Markets– Innovation– Supply Chain– People and Performance
(NOM)– One-time events– Enterprise Resilience
The design and execution of an objectives driven transformation effort to ensure results with speed, certainty and precision
Shaping the organisation by:– Engaging the top to
lead the change– Cascading down and
break barriers– Mobilizing the base
= + + +
Booz Allen’s response: Integrated approach to help clients change and develop the capabilities to adapt and grow through future uncertainties
Booz Allen’s Strategy Based Transformation ApproachBooz Allen’s Strategy Based Transformation Approach

24
Results are showingResults are showing
Booz Allen Hamilton Client ExamplesBooz Allen Hamilton Client Examples