london tech listing considerations
TRANSCRIPT

LONDON TECH LISTING CONSIDERATIONS MARCH 2017

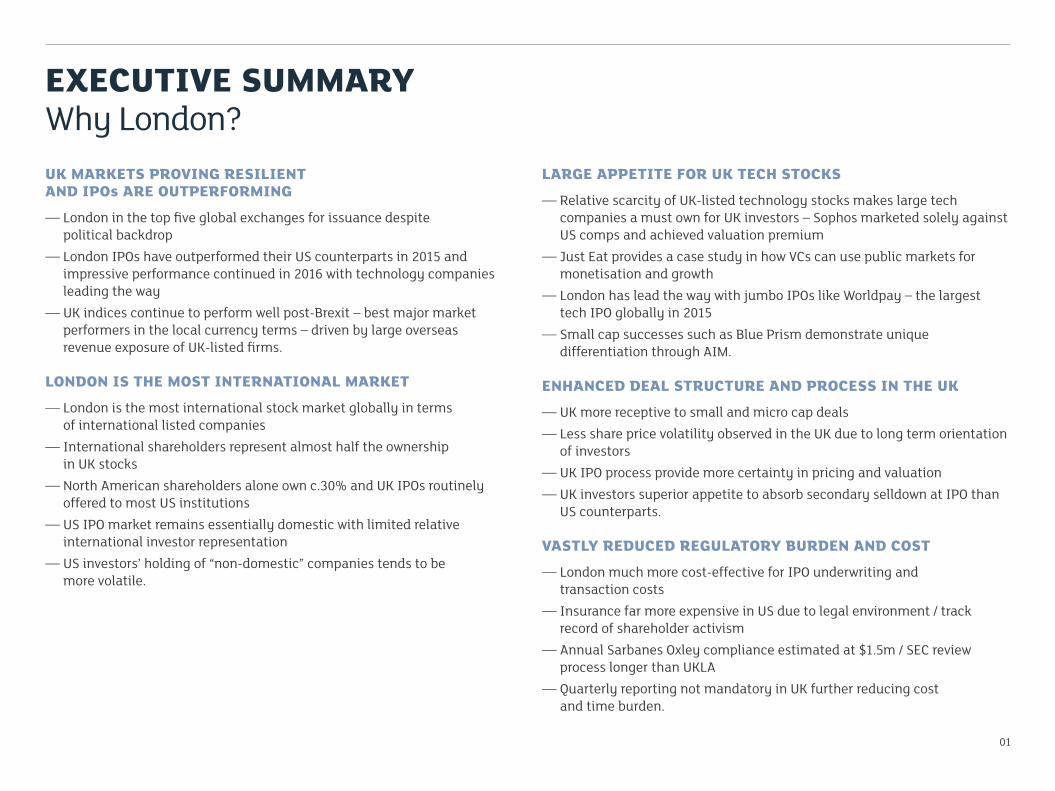
EXECUTIVE SUMMARYWhy London?
LARGE APPETITE FOR UK TECH STOCKS
— Relative scarcity of UK-listed technology stocks makes large tech companies a must own for UK investors – Sophos marketed solely against US comps and achieved valuation premium
— Just Eat provides a case study in how VCs can use public markets for monetisation and growth
— London has lead the way with jumbo IPOs like Worldpay – the largest tech IPO globally in 2015
— Small cap successes such as Blue Prism demonstrate unique differentiation through AIM.
ENHANCED DEAL STRUCTURE AND PROCESS IN THE UK
— UK more receptive to small and micro cap deals— Less share price volatility observed in the UK due to long term orientation
of investors— UK IPO process provide more certainty in pricing and valuation— UK investors superior appetite to absorb secondary selldown at IPO than
US counterparts.
VASTLY REDUCED REGULATORY BURDEN AND COST
— London much more cost-effective for IPO underwriting and transaction costs
— Insurance far more expensive in US due to legal environment / track record of shareholder activism
— Annual Sarbanes Oxley compliance estimated at $1.5m / SEC review process longer than UKLA
— Quarterly reporting not mandatory in UK further reducing cost and time burden.
UK MARKETS PROVING RESILIENT AND IPOs ARE OUTPERFORMING
— London in the top five global exchanges for issuance despite political backdrop
— London IPOs have outperformed their US counterparts in 2015 and impressive performance continued in 2016 with technology companies leading the way
— UK indices continue to perform well post-Brexit – best major market performers in the local currency terms – driven by large overseas revenue exposure of UK-listed firms.
LONDON IS THE MOST INTERNATIONAL MARKET
— London is the most international stock market globally in terms of international listed companies
— International shareholders represent almost half the ownership in UK stocks
— North American shareholders alone own c.30% and UK IPOs routinely offered to most US institutions
— US IPO market remains essentially domestic with limited relative international investor representation
— US investors’ holding of “non-domestic” companies tends to be more volatile.
01
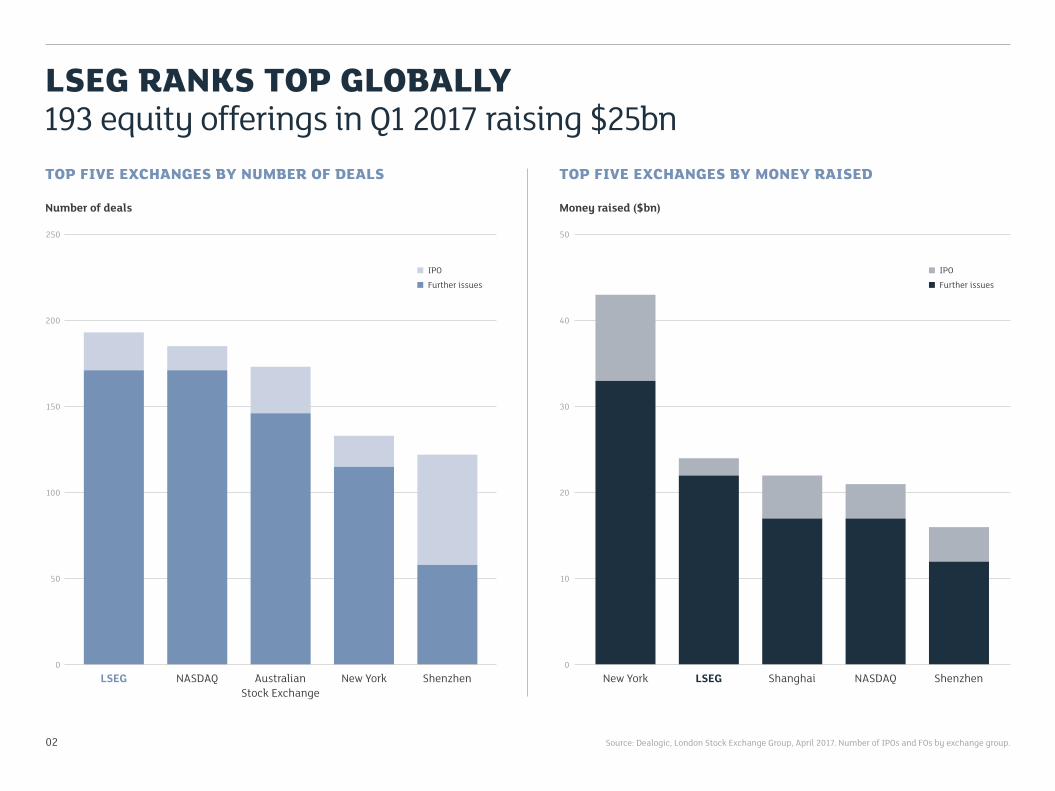
LSEG RANKS TOP GLOBALLY 193 equity offerings in Q1 2017 raising $25bn
Source: Dealogic, London Stock Exchange Group, April 2017. Number of IPOs and FOs by exchange group.
TOP FIVE EXCHANGES BY NUMBER OF DEALS
Number of deals
LSEG NASDAQ
250
0
200
150
100
50
IPO
Further issues
02
ShenzhenAustralian Stock Exchange
New York
TOP FIVE EXCHANGES BY MONEY RAISED
Money raised ($bn)
50
40
30
20
10
0New York LSEG ShenzhenShanghai NASDAQ
IPO
Further issues
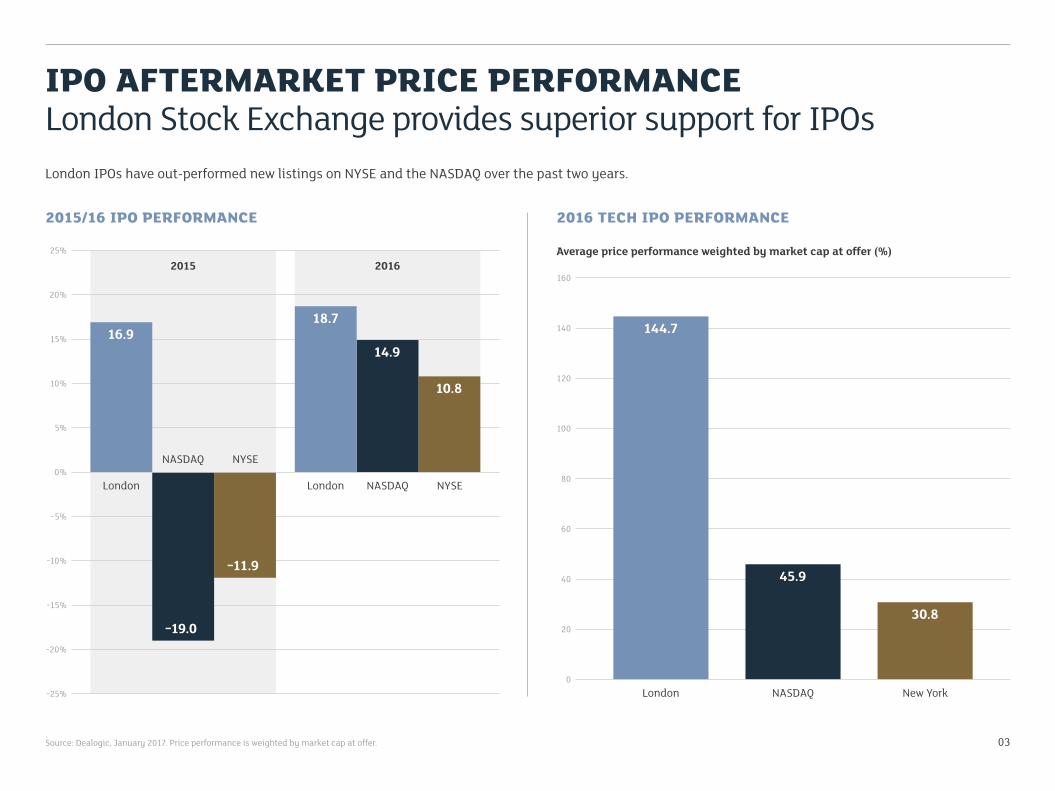
IPO AFTERMARKET PRICE PERFORMANCELondon Stock Exchange provides superior support for IPOsLondon IPOs have out-performed new listings on NYSE and the NASDAQ over the past two years.
2016 TECH IPO PERFORMANCE2015/16 IPO PERFORMANCE
25%
20%
15%
10%
5%
0%
−5%
−10%
−15%
−20%
−25%
16.918.7
14.9
10.8
−19.0
−11.9
2015 2016
London London NASDAQ NYSE
NASDAQ NYSE
Source: Dealogic, January 2017. Price performance is weighted by market cap at offer. 03
Average price performance weighted by market cap at offer (%)
160
140
120
100
80
60
40
20
0London NASDAQ New York
144.7
45.9
30.8
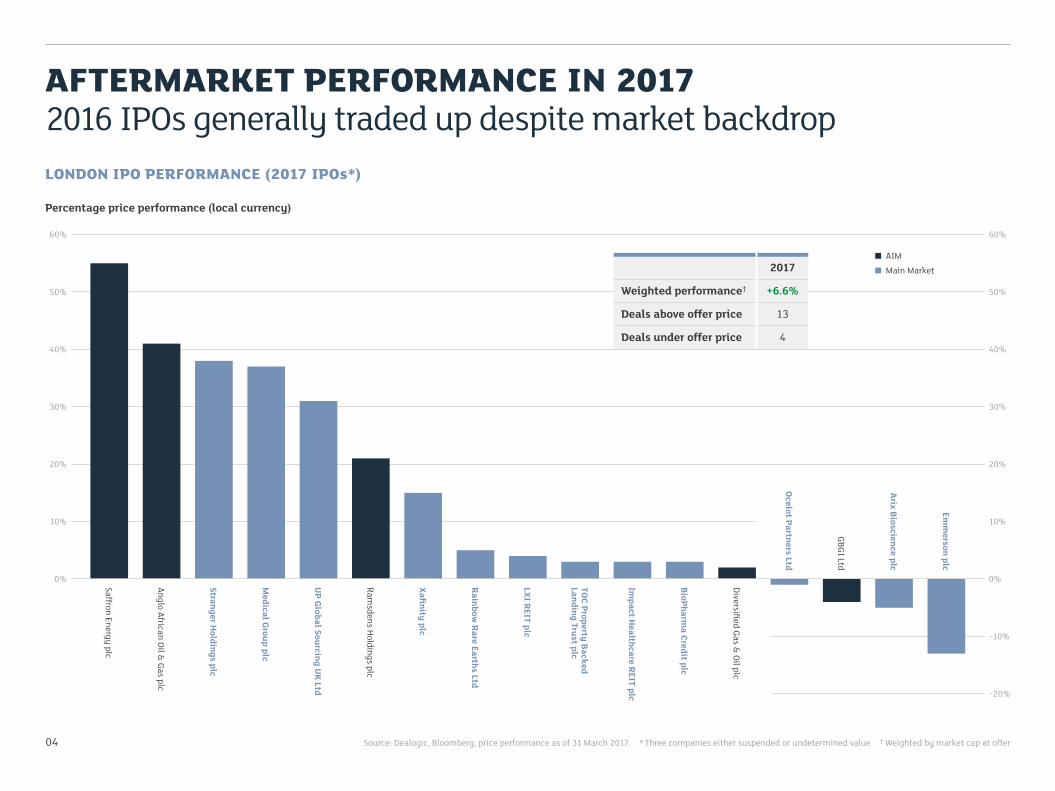
LONDON IPO PERFORMANCE (2017 IPOs*)
Percentage price performance (local currency)
60%
Source: Dealogic, Bloomberg, price performance as of 31 March 2017. * Three companies either suspended or undetermined value † Weighted by market cap at offer
Saffron Energy plc
Anglo African Oil & Gas plc
Stranger Holdings plc
Medical Group plc
UP Global Sourcing U
K Ltd
Ramsdens Holdings plc
Xafinity plc
Rainbow Rare Earths Ltd
LXI REIT plc
TOC Property Backed Landing Trust plc
Impact H
ealthcare REIT plc
BioPharma Credit plc
Diversified Gas & Oil plc
Ocelot Partners Ltd
GBGI Ltd
Arix Bioscience plc
Emm
erson plc
40%
30%
20%
10%
0%
60%
50%
40%
30%
20%
0%
−10%
−20%
2017
Weighted performance† +6.6%
Deals above offer price 13
Deals under offer price 4
AFTERMARKET PERFORMANCE IN 20172016 IPOs generally traded up despite market backdrop
AIM
Main Market
04
50%
10%
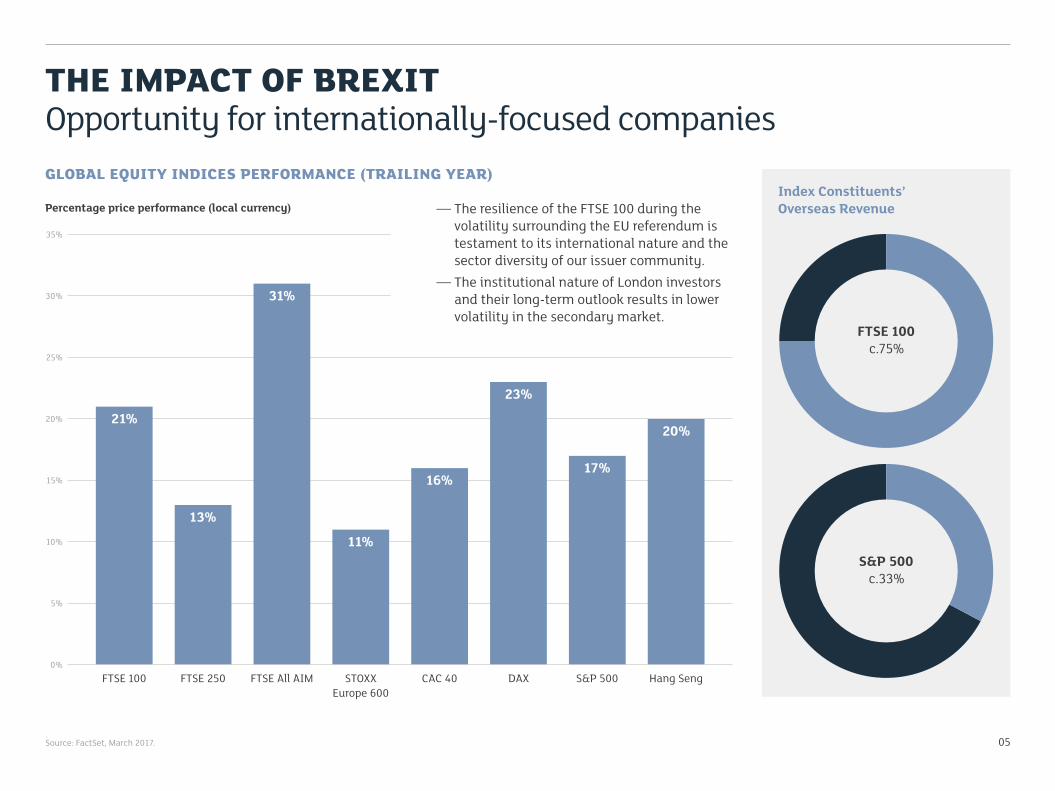
Index Constituents’ Overseas Revenue
THE IMPACT OF BREXITOpportunity for internationally-focused companies
— The resilience of the FTSE 100 during the volatility surrounding the EU referendum is testament to its international nature and the sector diversity of our issuer community.
— The institutional nature of London investors and their long-term outlook results in lower volatility in the secondary market.
Source: FactSet, March 2017.
GLOBAL EQUITY INDICES PERFORMANCE (TRAILING YEAR)
FTSE 100
Percentage price performance (local currency)
0%
35%
30%
25%
20%
15%
10%
5%
Hang SengFTSE 250 FTSE All AIM STOXX Europe 600
CAC 40 DAX S&P 500
FTSE 100c.75%
S&P 500c.33%
05
21%
13%
31%
11%
16%
23%
17%
20%
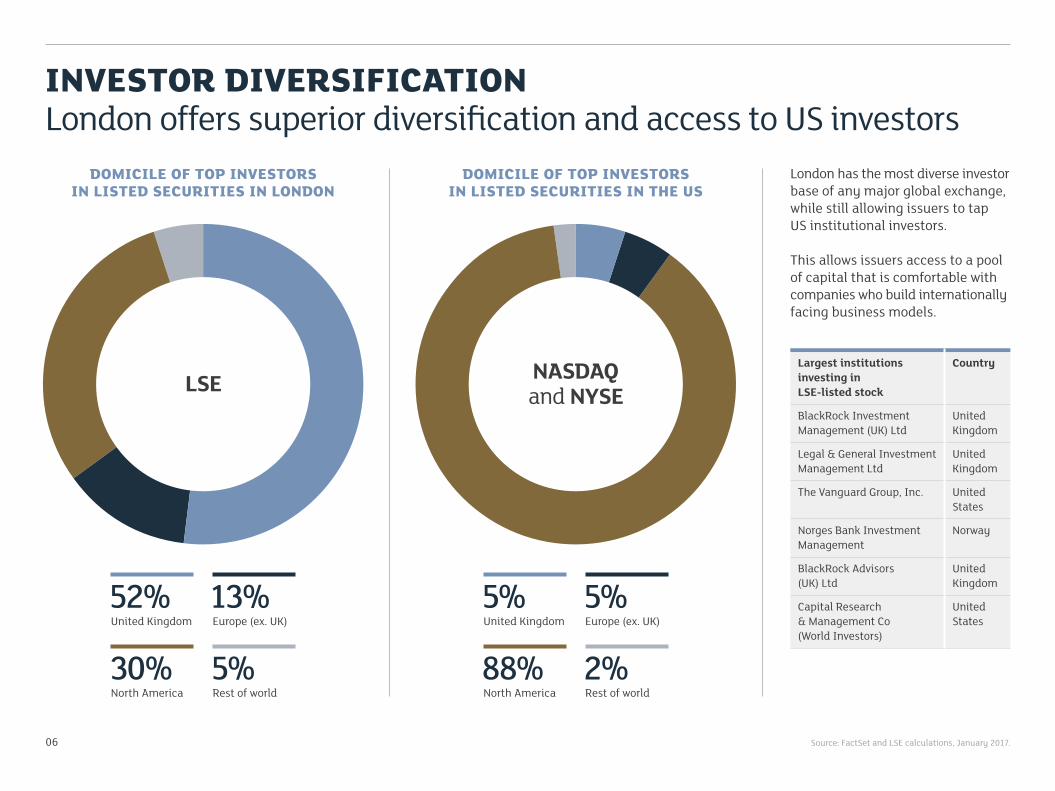
INVESTOR DIVERSIFICATIONLondon offers superior diversification and access to US investors
06
London has the most diverse investor base of any major global exchange, while still allowing issuers to tap US institutional investors.
This allows issuers access to a pool of capital that is comfortable with companies who build internationally facing business models.
Source: FactSet and LSE calculations, January 2017.
Largest institutions investing in LSE-listed stock
Country
BlackRock Investment Management (UK) Ltd
United Kingdom
Legal & General Investment Management Ltd
United Kingdom
The Vanguard Group, Inc. United States
Norges Bank Investment Management
Norway
BlackRock Advisors (UK) Ltd
United Kingdom
Capital Research & Management Co (World Investors)
United States
DOMICILE OF TOP INVESTORS IN LISTED SECURITIES IN LONDON
DOMICILE OF TOP INVESTORS IN LISTED SECURITIES IN THE US
52%United Kingdom
30%North America
13%Europe (ex. UK)
5%Rest of world
5%United Kingdom
88%North America
5%Europe (ex. UK)
2%Rest of world
LSE NASDAQ and NYSE
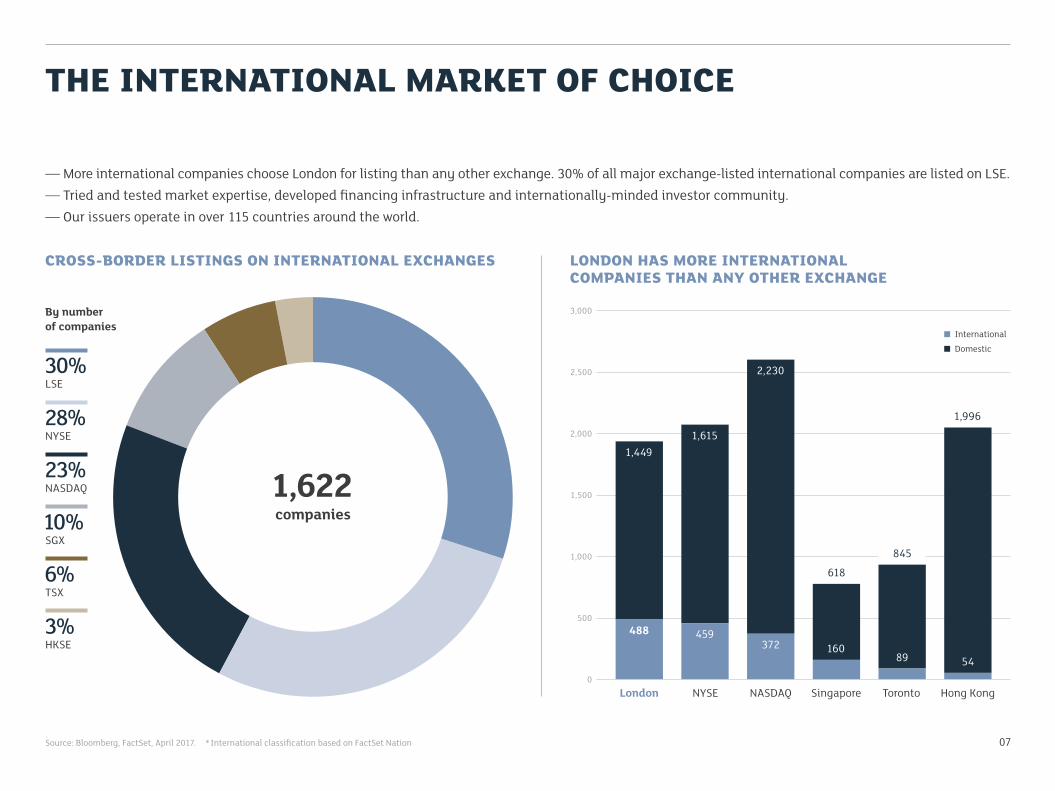
THE INTERNATIONAL MARKET OF CHOICE
07
— More international companies choose London for listing than any other exchange. 30% of all major exchange-listed international companies are listed on LSE.— Tried and tested market expertise, developed financing infrastructure and internationally-minded investor community.— Our issuers operate in over 115 countries around the world.
LONDON HAS MORE INTERNATIONAL COMPANIES THAN ANY OTHER EXCHANGE
CROSS-BORDER LISTINGS ON INTERNATIONAL EXCHANGES
Source: Bloomberg, FactSet, April 2017. * International classification based on FactSet Nation
30%LSE
28%NYSE
23%NASDAQ
10%SGX
6%TSX
3%HKSE
1,622 companies
By number of companies
London0
3,000
2,500
2,000
1,500
1,000
500
NYSE NASDAQ Singapore Toronto Hong Kong
International
Domestic
488
1,449
459
1,615
372
2,230
160
618
89
845
1,996
54
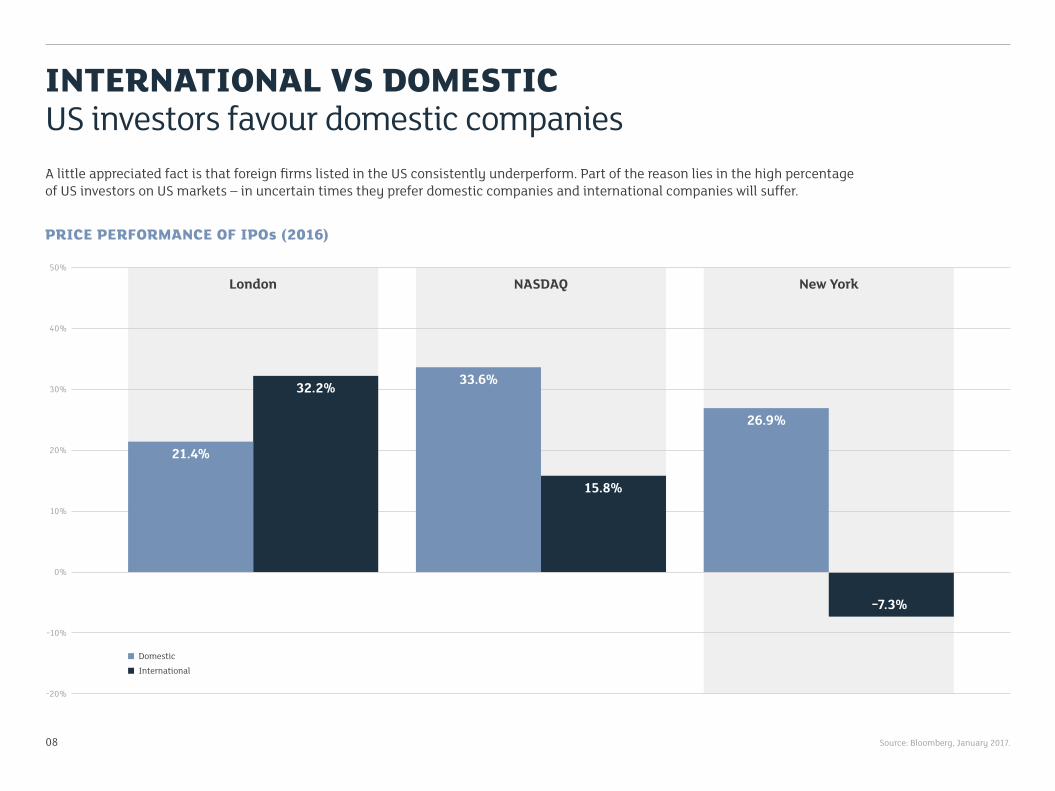
INTERNATIONAL VS DOMESTICUS investors favour domestic companies
08
A little appreciated fact is that foreign firms listed in the US consistently underperform. Part of the reason lies in the high percentage of US investors on US markets – in uncertain times they prefer domestic companies and international companies will suffer.
PRICE PERFORMANCE OF IPOs (2016)
50%
40%
30%
20%
10%
0%
−10%
−20%
London NASDAQ New York
21.4%
32.2% 33.6%
15.8%
26.9%
−7.3%
Domestic
International
Source: Bloomberg, January 2017.
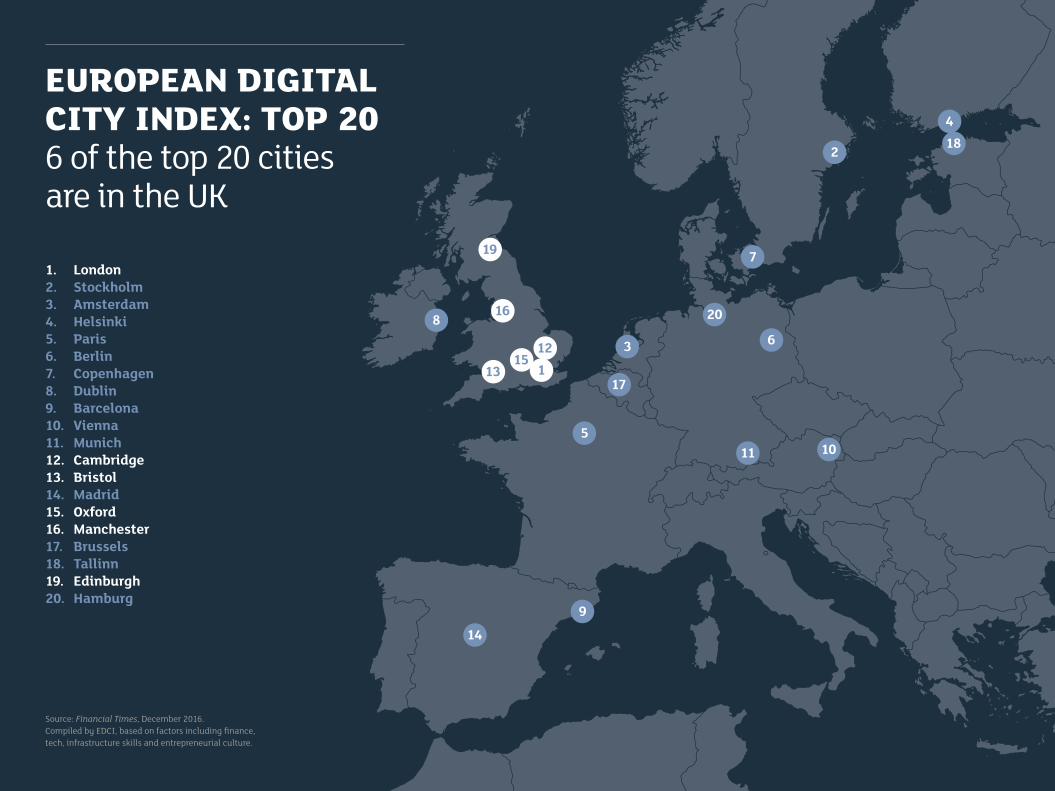
EUROPEAN DIGITAL CITY INDEX: TOP 20 6 of the top 20 cities are in the UK
1. London2. Stockholm3. Amsterdam4. Helsinki5. Paris6. Berlin7. Copenhagen8. Dublin9. Barcelona10. Vienna11. Munich12. Cambridge13. Bristol14. Madrid15. Oxford16. Manchester17. Brussels18. Tallinn19. Edinburgh20. Hamburg
Source: Financial Times, December 2016. Compiled by EDCI, based on factors including finance, tech, infrastructure skills and entrepreneurial culture.
1
2
3
4
5
6
7
8
9
1011
12
13
14
15
16
17
18
19
20
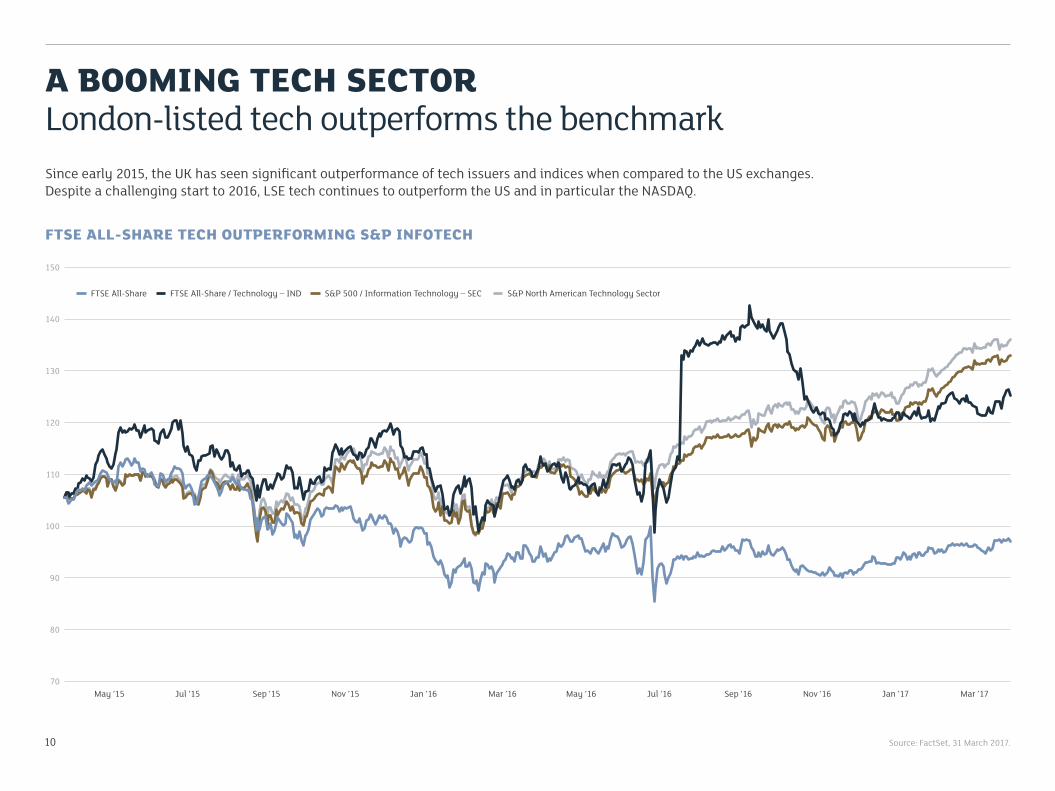
A BOOMING TECH SECTORLondon-listed tech outperforms the benchmark
10
Since early 2015, the UK has seen significant outperformance of tech issuers and indices when compared to the US exchanges. Despite a challenging start to 2016, LSE tech continues to outperform the US and in particular the NASDAQ.
Source: FactSet, 31 March 2017.
FTSE ALL-SHARE TECH OUTPERFORMING S&P INFOTECH
150
70
140
130
120
110
100
90
80
Mar ’17May ’15 Mar ’16 May ’16 Jul ’16 Sep ’16
FTSE All-Share FTSE All-Share / Technology – IND S&P 500 / Information Technology – SEC S&P North American Technology Sector
Nov ’16Jul ’15 Sep ’15 Nov ’15 Jan ’16 Jan ’17
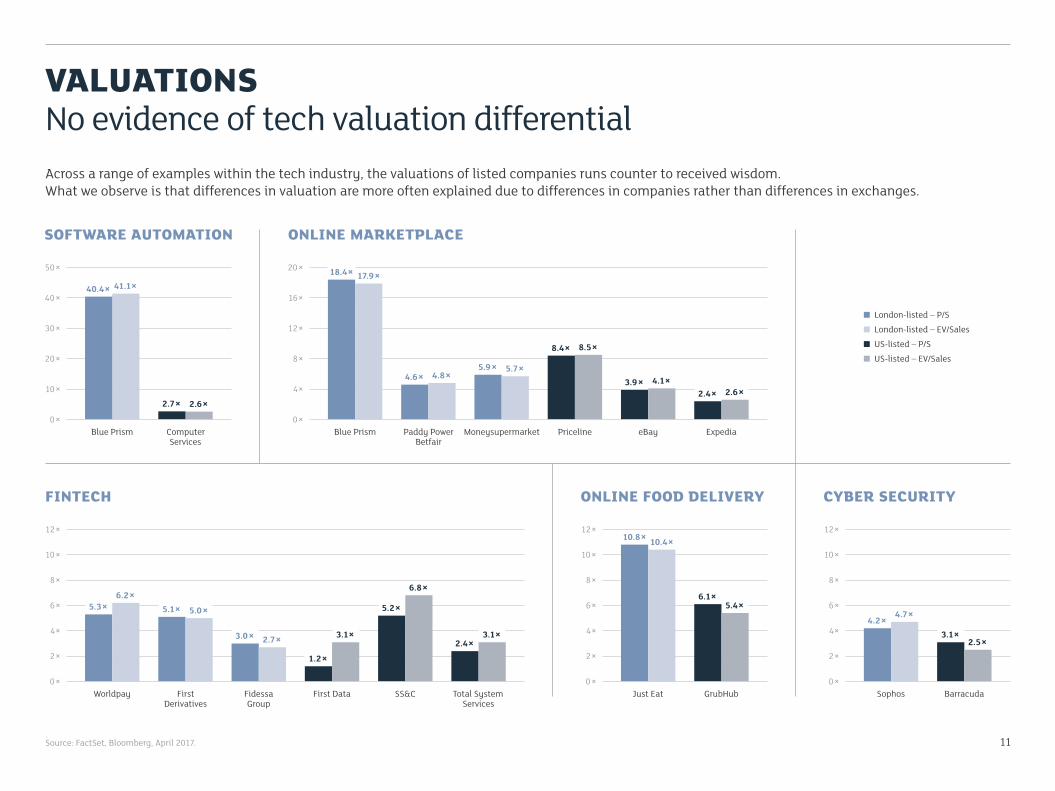
VALUATIONSNo evidence of tech valuation differentialAcross a range of examples within the tech industry, the valuations of listed companies runs counter to received wisdom.What we observe is that differences in valuation are more often explained due to differences in companies rather than differences in exchanges.
SOFTWARE AUTOMATION
11Source: FactSet, Bloomberg, April 2017.
ONLINE MARKETPLACE
FINTECH ONLINE FOOD DELIVERY CYBER SECURITY
Blue Prism
50×
0×
40×
30×
20×
10×
Computer Services
Blue Prism
20×
0×
12×
8×
4×
16×
Moneysupermarket Priceline eBayPaddy Power Betfair
Expedia
Worldpay
12×
0×
10×
6×
4×
2×
8×
First Derivatives
Fidessa Group
Total System Services
First Data SS&C0×
12×
10×
6×
4×
2×
8×
0×
12×
10×
6×
4×
2×
8×
BarracudaSophosGrubHubJust Eat
5.3×6.2×
5.1× 5.0×
3.0× 2.7×1.2×
3.1×
5.2×6.8×
2.4×3.1×
10.8× 10.4×
6.1×5.4×
4.2× 4.7×3.1×
2.5×
40.4× 41.1×
2.7× 2.6×
18.4× 17.9×
4.6× 4.8×5.9× 5.7×
8.4× 8.5×
3.9× 4.1×2.4× 2.6×
London-listed – P/S
London-listed – EV/Sales
US-listed – P/S
US-listed – EV/Sales
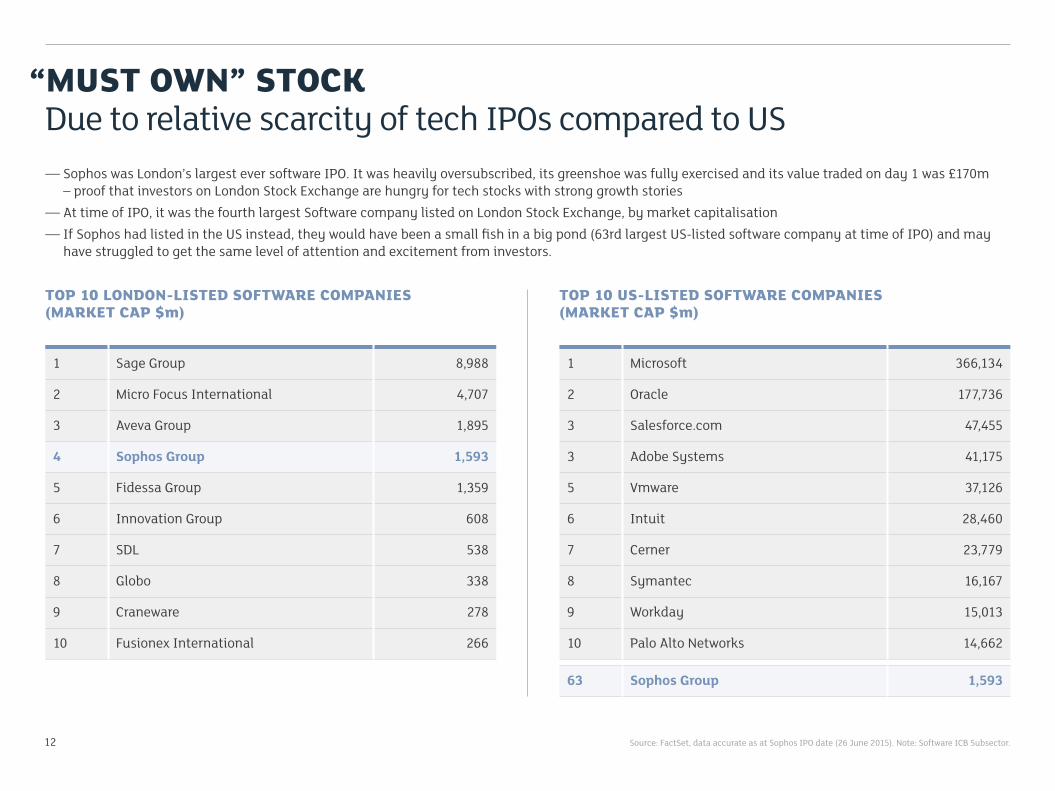
“MUST OWN” STOCKDue to relative scarcity of tech IPOs compared to US
12 Source: FactSet, data accurate as at Sophos IPO date (26 June 2015). Note: Software ICB Subsector.
— Sophos was London’s largest ever software IPO. It was heavily oversubscribed, its greenshoe was fully exercised and its value traded on day 1 was £170m – proof that investors on London Stock Exchange are hungry for tech stocks with strong growth stories
— At time of IPO, it was the fourth largest Software company listed on London Stock Exchange, by market capitalisation— If Sophos had listed in the US instead, they would have been a small fish in a big pond (63rd largest US-listed software company at time of IPO) and may
have struggled to get the same level of attention and excitement from investors.
TOP 10 LONDON-LISTED SOFTWARE COMPANIES(MARKET CAP $m)
TOP 10 US-LISTED SOFTWARE COMPANIES(MARKET CAP $m)
1 Sage Group 8,988
2 Micro Focus International 4,707
3 Aveva Group 1,895
4 Sophos Group 1,593
5 Fidessa Group 1,359
6 Innovation Group 608
7 SDL 538
8 Globo 338
9 Craneware 278
10 Fusionex International 266
1 Microsoft 366,134
2 Oracle 177,736
3 Salesforce.com 47,455
3 Adobe Systems 41,175
5 Vmware 37,126
6 Intuit 28,460
7 Cerner 23,779
8 Symantec 16,167
9 Workday 15,013
10 Palo Alto Networks 14,662
63 Sophos Group 1,593
13
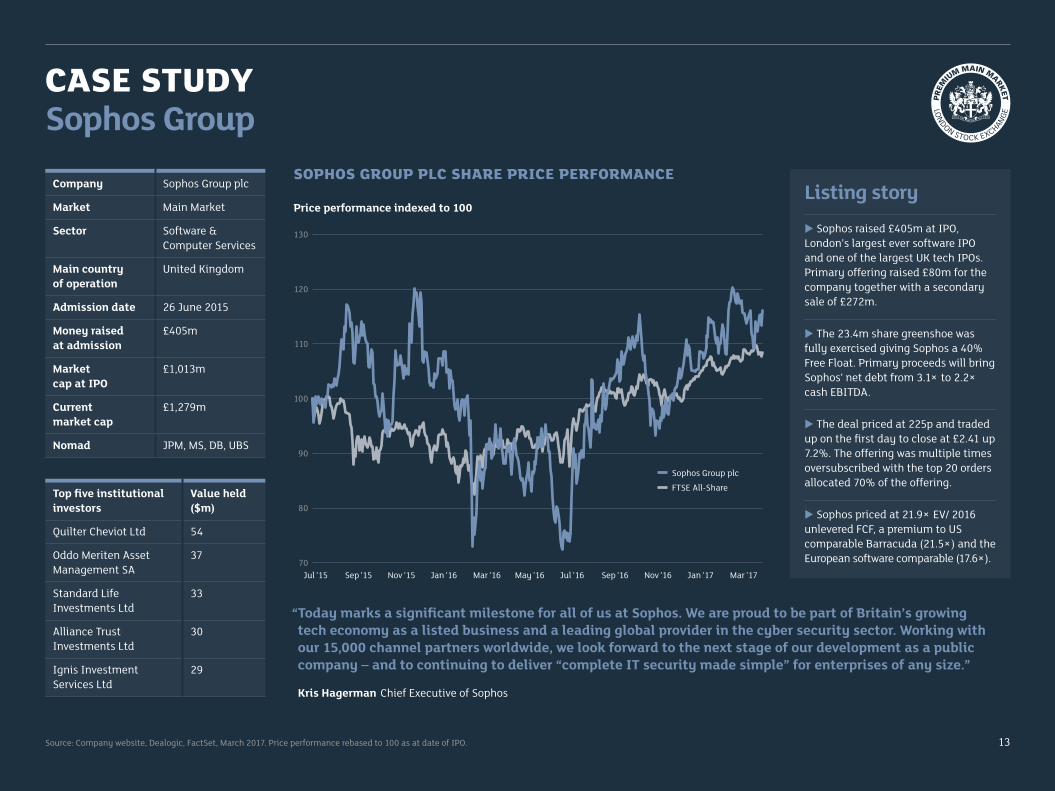
CASE STUDYSophos Group
Source: Company website, Dealogic, FactSet, March 2017. Price performance rebased to 100 as at date of IPO.
Company Sophos Group plc
Market Main Market
Sector Software & Computer Services
Main country of operation
United Kingdom
Admission date 26 June 2015
Money raised at admission
£405m
Market cap at IPO
£1,013m
Current market cap
£1,279m
Nomad JPM, MS, DB, UBS
Listing storyu Sophos raised £405m at IPO, London’s largest ever software IPO and one of the largest UK tech IPOs.Primary offering raised £80m for the company together with a secondary sale of £272m.
u The 23.4m share greenshoe was fully exercised giving Sophos a 40% Free Float. Primary proceeds will bring Sophos’ net debt from 3.1× to 2.2× cash EBITDA.
u The deal priced at 225p and traded up on the first day to close at £2.41 up 7.2%. The offering was multiple times oversubscribed with the top 20 orders allocated 70% of the offering.
u Sophos priced at 21.9× EV/ 2016 unlevered FCF, a premium to US comparable Barracuda (21.5×) and the European software comparable (17.6×).
Top five institutional investors
Value held ($m)
Quilter Cheviot Ltd 54
Oddo Meriten Asset Management SA
37
Standard Life Investments Ltd
33
Alliance Trust Investments Ltd
30
Ignis Investment Services Ltd
29
SOPHOS GROUP PLC SHARE PRICE PERFORMANCE
Price performance indexed to 100
130
120
110
100
90
80
“Today marks a significant milestone for all of us at Sophos. We are proud to be part of Britain’s growing tech economy as a listed business and a leading global provider in the cyber security sector. Working with our 15,000 channel partners worldwide, we look forward to the next stage of our development as a public company – and to continuing to deliver “complete IT security made simple” for enterprises of any size.”
Kris Hagerman Chief Executive of Sophos
70Jul ’15 Mar ’17Jul ’16 Sep ’16 Nov ’16 Jan ’17
Sophos Group plc
FTSE All-Share
Sep ’15 Nov ’15 Jan ’16 Mar ’16 May ’16
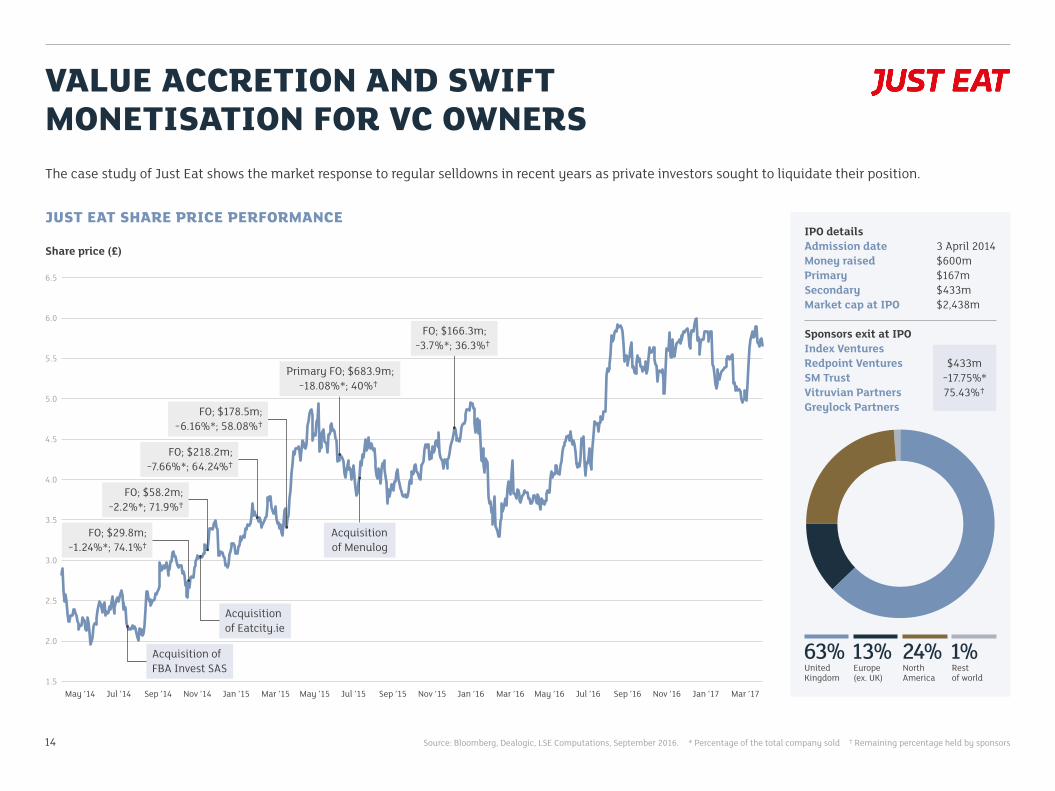
IPO detailsAdmission date 3 April 2014Money raised $600mPrimary $167mSecondary $433mMarket cap at IPO $2,438m
Sponsors exit at IPOIndex VenturesRedpoint VenturesSM TrustVitruvian PartnersGreylock Partners
VALUE ACCRETION AND SWIFT MONETISATION FOR VC OWNERS
14
The case study of Just Eat shows the market response to regular selldowns in recent years as private investors sought to liquidate their position.
JUST EAT SHARE PRICE PERFORMANCE
Share price (£)
6.5
1.5Mar ’17
5.5
5.0
4.5
4.0
3.5
3.0
2.5
2.0
Source: Bloomberg, Dealogic, LSE Computations, September 2016. * Percentage of the total company sold † Remaining percentage held by sponsors
$433m−17.75%*75.43%†
63%United Kingdom
1%Rest of world
13%Europe (ex. UK)
24%North America
Acquisition of FBA Invest SAS
FO; $29.8m; −1.24%*; 74.1%†
Acquisition of Eatcity.ie
FO; $58.2m; −2.2%*; 71.9%†
FO; $218.2m; −7.66%*; 64.24%†
FO; $178.5m; −6.16%*; 58.08%†
Primary FO; $683.9m; −18.08%*; 40%†
FO; $166.3m; −3.7%*; 36.3%†
Acquisition of Menulog
6.0
May ’14 Jul ’14 Sep ’14 Nov ’14 Jan ’15 Mar ’15 May ’15 Jul ’15 Sep ’15 Nov ’15 Jan ’16 Mar ’16 May ’16 Jul ’16 Sep ’16 Nov ’16 Jan ’17

15
COMPARISON OF JUST EAT AND GRUBHUB
Source: FactSet, Dealogic, March 2017.
Stock exchange London New York
Pricing date 3 April 2014 3 April 2014
IPO size $599m $221m
Pricing vs range Top Above
Price range £2.10–£2.60 $23.00–$25.00
Priced £2.60 $26.00
Market cap at admission
$2.4bn $2.0bn
Current market cap $4.7bn $2.9bn
% offered at IPO 24.6% 10.9%
Primary/secondary split at IPO
28%:72% 47%:53%
Current to offer price 91.4% 34.1%
Selling shareholders Redpoint Ventures, SM Trust, Vitruvian Partners
GS Capital Partners Spectrum Equity, Thomas H Lee, Warburg Pincus
JUST EAT SHARE PRICE PERFORMANCE
Price performance indexed to 100
240
40
220
200
180
160
140
120
100
80
60
Mar ’17
Just Eat plc
GrubHub Inc.
Jun ’14 Sep ’14 Dec ’14 Mar ’15 Jun ’15 Sep ’15 Dec ’15 Mar ’16 Jun ’16 Sep ’16 Dec ’16
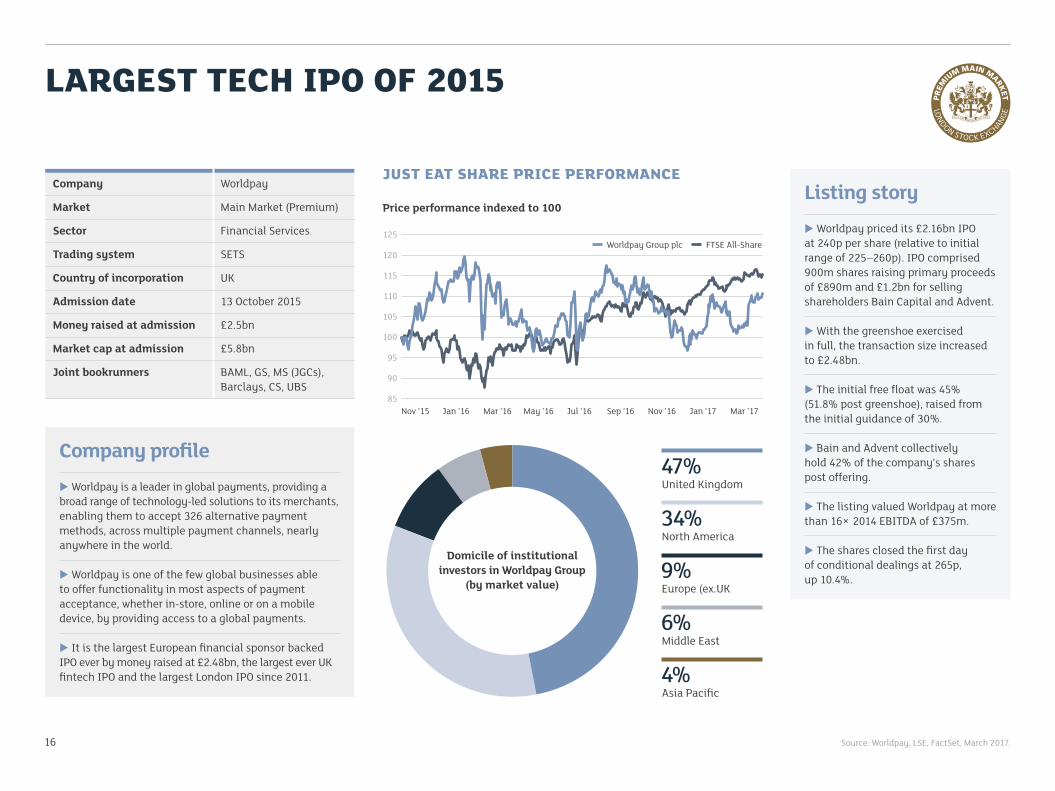
LARGEST TECH IPO OF 2015
Source: Worldpay, LSE, FactSet, March 2017.16
Company Worldpay
Market Main Market (Premium)
Sector Financial Services
Trading system SETS
Country of incorporation UK
Admission date 13 October 2015
Money raised at admission £2.5bn
Market cap at admission £5.8bn
Joint bookrunners BAML, GS, MS (JGCs), Barclays, CS, UBS
Listing storyu Worldpay priced its £2.16bn IPO at 240p per share (relative to initial range of 225–260p). IPO comprised 900m shares raising primary proceeds of £890m and £1.2bn for selling shareholders Bain Capital and Advent.
u With the greenshoe exercised in full, the transaction size increased to £2.48bn.
u The initial free float was 45% (51.8% post greenshoe), raised from the initial guidance of 30%.
u Bain and Advent collectively hold 42% of the company’s shares post offering.
u The listing valued Worldpay at more than 16× 2014 EBITDA of £375m.
u The shares closed the first day of conditional dealings at 265p, up 10.4%.
Company profileu Worldpay is a leader in global payments, providing a broad range of technology-led solutions to its merchants, enabling them to accept 326 alternative payment methods, across multiple payment channels, nearly anywhere in the world.
u Worldpay is one of the few global businesses able to offer functionality in most aspects of payment acceptance, whether in-store, online or on a mobile device, by providing access to a global payments.
u It is the largest European financial sponsor backed IPO ever by money raised at £2.48bn, the largest ever UK fintech IPO and the largest London IPO since 2011.
47%United Kingdom
34%North America
9%Europe (ex.UK
6%Middle East
4%Asia Pacific
JUST EAT SHARE PRICE PERFORMANCE
Price performance indexed to 100
Nov ’15 Mar ’17
125
85
120
115
110
105
100
95
90
Domicile of institutional investors in Worldpay Group
(by market value)
Worldpay Group plc FTSE All-Share
Jan ’16 Mar ’16 May ’16 Jul ’16 Sep ’16 Nov ’16 Jan ’17

WORLDPAY VS FIRST DATA COMPARISON
17
Worldpay and First Data listed within a day of each other. Worldpay was the largest IPO by deal size, First Data the largest IPO by valuation. Worldpay outperformed First Data on opening, and subsequently has continued to outperform the US-listed company despite challenging market conditions.
Source: FactSet, Dealogic, March 2017.
Price performance indexed to 100
Nov ’15
130
50
120
110
100
90
80
70
60
Jan ’16 May ’16 Jul ’16 Sep ’16 Mar ’17
Worldpay Group plc
First Data Corporation Class A
Mar ’16
WORLDPAY GROUP PLC VS FIRST DATA CORPORATION CLASS A
Stock exchange London New York
Pricing date 13 October 2015 14 October 2015
IPO size $3.81m $2.82m
Pricing vs range Mid range Below
Price range £2.25–£2.60 $18.00–$20.00
Priced £2.40 $16.00
Market cap at admission $4.8bn/$7.4bn $14.1bn
Current market cap $5.8bn/$7.2bn $14.4bn
Valuation at IPO 16 ’14 EBITDA 13 ’14 EBITDA
% offered at IPO 51.8% 19.7%
Primary/secondary split at IPO
44%:56% 100%:0%
Greenshoe exercised In shoe Partial
First day performance 10.42% 1.46%
Private equity sponsor(s) Advent International, Bain Capital
KKR
Nov ’16 Jan ’17
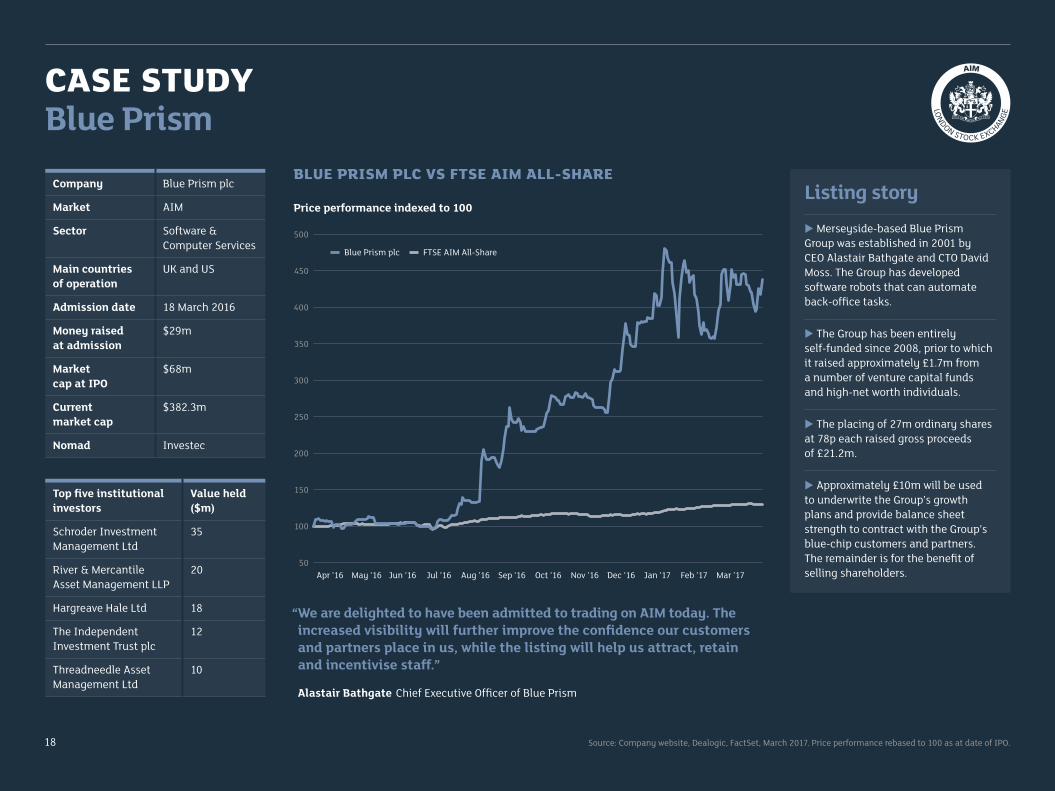
CASE STUDYBlue Prism
18
Company Blue Prism plc
Market AIM
Sector Software & Computer Services
Main countries of operation
UK and US
Admission date 18 March 2016
Money raised at admission
$29m
Market cap at IPO
$68m
Current market cap
$382.3m
Nomad Investec
Top five institutional investors
Value held ($m)
Schroder Investment Management Ltd
35
River & Mercantile Asset Management LLP
20
Hargreave Hale Ltd 18
The Independent Investment Trust plc
12
Threadneedle Asset Management Ltd
10
Listing storyu Merseyside-based Blue Prism Group was established in 2001 by CEO Alastair Bathgate and CTO David Moss. The Group has developed software robots that can automate back-office tasks.
u The Group has been entirely self-funded since 2008, prior to which it raised approximately £1.7m from a number of venture capital funds and high-net worth individuals.
u The placing of 27m ordinary shares at 78p each raised gross proceeds of £21.2m.
u Approximately £10m will be used to underwrite the Group’s growth plans and provide balance sheet strength to contract with the Group’s blue-chip customers and partners. The remainder is for the benefit of selling shareholders.
“We are delighted to have been admitted to trading on AIM today. The increased visibility will further improve the confidence our customers and partners place in us, while the listing will help us attract, retain and incentivise staff.”
Alastair Bathgate Chief Executive Officer of Blue Prism
BLUE PRISM PLC VS FTSE AIM ALL-SHARE
Price performance indexed to 100
Apr ’16 Mar ’17
Blue Prism plc FTSE AIM All-Share
500
400
250
200
150
100
50
350
300
450
Source: Company website, Dealogic, FactSet, March 2017. Price performance rebased to 100 as at date of IPO.
May ’16 Jun ’16 Jul ’16 Aug ’16 Sep ’16 Oct ’16 Nov ’16 Dec ’16 Jan ’17 Feb ’17
CASE STUDYLoopUp
19
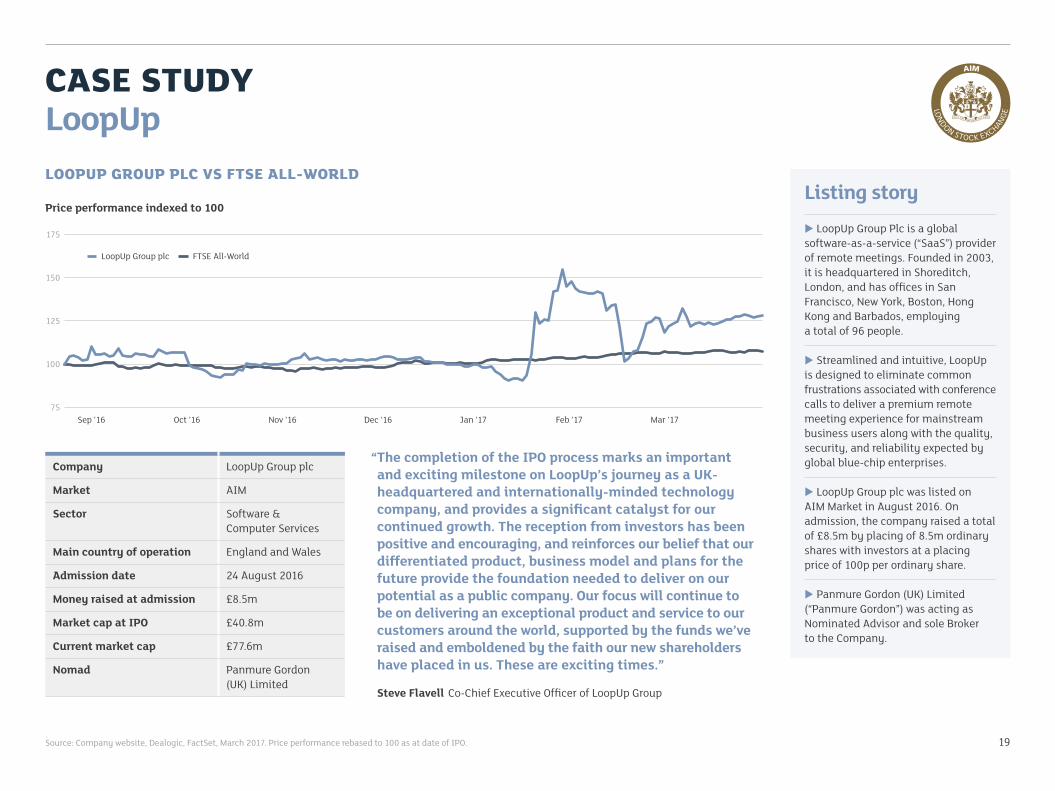
Company LoopUp Group plc
Market AIM
Sector Software & Computer Services
Main country of operation England and Wales
Admission date 24 August 2016
Money raised at admission £8.5m
Market cap at IPO £40.8m
Current market cap £77.6m
Nomad Panmure Gordon (UK) Limited
Source: Company website, Dealogic, FactSet, March 2017. Price performance rebased to 100 as at date of IPO.
Listing storyu LoopUp Group Plc is a global software-as-a-service (“SaaS”) provider of remote meetings. Founded in 2003, it is headquartered in Shoreditch, London, and has offices in San Francisco, New York, Boston, Hong Kong and Barbados, employing a total of 96 people.
u Streamlined and intuitive, LoopUp is designed to eliminate common frustrations associated with conference calls to deliver a premium remote meeting experience for mainstream business users along with the quality, security, and reliability expected by global blue-chip enterprises.
u LoopUp Group plc was listed on AIM Market in August 2016. On admission, the company raised a total of £8.5m by placing of 8.5m ordinary shares with investors at a placing price of 100p per ordinary share.
u Panmure Gordon (UK) Limited (“Panmure Gordon”) was acting as Nominated Advisor and sole Broker to the Company.
“The completion of the IPO process marks an important and exciting milestone on LoopUp’s journey as a UK-headquartered and internationally-minded technology company, and provides a significant catalyst for our continued growth. The reception from investors has been positive and encouraging, and reinforces our belief that our differentiated product, business model and plans for the future provide the foundation needed to deliver on our potential as a public company. Our focus will continue to be on delivering an exceptional product and service to our customers around the world, supported by the funds we’ve raised and emboldened by the faith our new shareholders have placed in us. These are exciting times.”
Steve Flavell Co-Chief Executive Officer of LoopUp Group
LOOPUP GROUP PLC VS FTSE ALL-WORLD
Price performance indexed to 100
175
Sep ’16 Mar ’1775
150
100
125
Oct ’16 Nov ’16 Dec ’16 Jan ’17 Feb ’17
LoopUp Group plc FTSE All-World
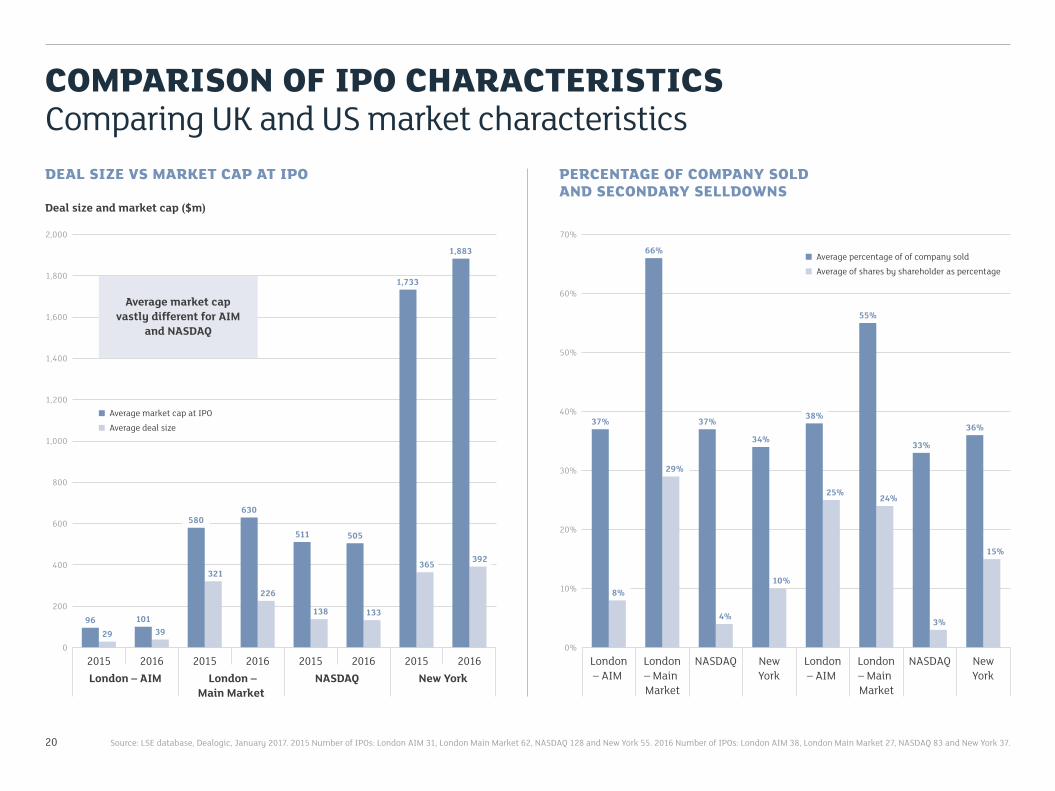
COMPARISON OF IPO CHARACTERISTICSComparing UK and US market characteristics
20
DEAL SIZE VS MARKET CAP AT IPO
Deal size and market cap ($m)
2,000
PERCENTAGE OF COMPANY SOLD AND SECONDARY SELLDOWNS
70%
London – AIM2015
020162016 2015 2016 2015 2016 2015
New YorkLondon – Main Market
NASDAQ
1,800
1,600
1,400
1,200
1,000
800
600
400
200
Source: LSE database, Dealogic, January 2017. 2015 Number of IPOs: London AIM 31, London Main Market 62, NASDAQ 128 and New York 55. 2016 Number of IPOs: London AIM 38, London Main Market 27, NASDAQ 83 and New York 37.
9629
10139
580
321
630
226
511
138
505
133
1,733
365
1,883
392
Average market cap at IPO
Average deal size
Average market cap vastly different for AIM
and NASDAQ
0%London – AIM
New York
London – Main Market
NASDAQ New York
London – AIM
London – Main Market
NASDAQ
60%
50%
40%
30%
20%
10%
Average percentage of of company sold
Average of shares by shareholder as percentage
37%
66%
37%
34%
38%
55%
33%
36%
8%
29%
4%
10%
25%24%
3%
15%
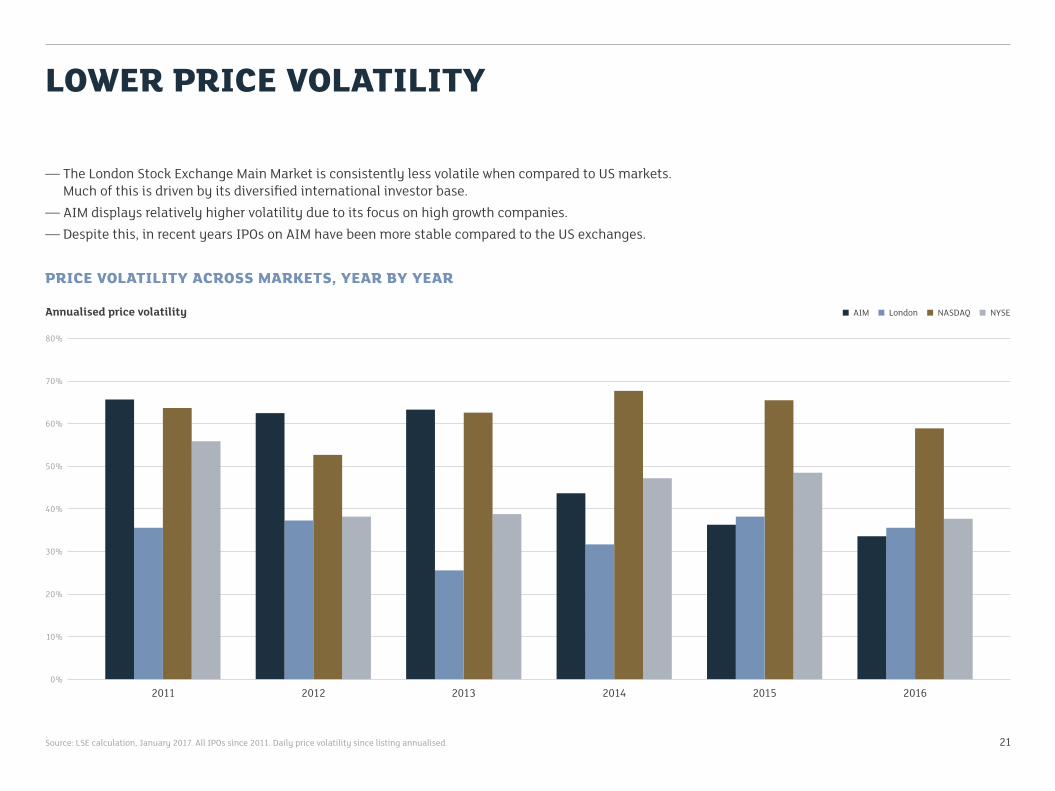
LOWER PRICE VOLATILITY
21
— The London Stock Exchange Main Market is consistently less volatile when compared to US markets. Much of this is driven by its diversified international investor base.
— AIM displays relatively higher volatility due to its focus on high growth companies.— Despite this, in recent years IPOs on AIM have been more stable compared to the US exchanges.
PRICE VOLATILITY ACROSS MARKETS, YEAR BY YEAR
Annualised price volatility
80%
20110%
70%
60%
50%
40%
30%
20%
10%
20162012 2013 2014 2015
AIM London NASDAQ NYSE
Source: LSE calculation, January 2017. All IPOs since 2011. Daily price volatility since listing annualised.
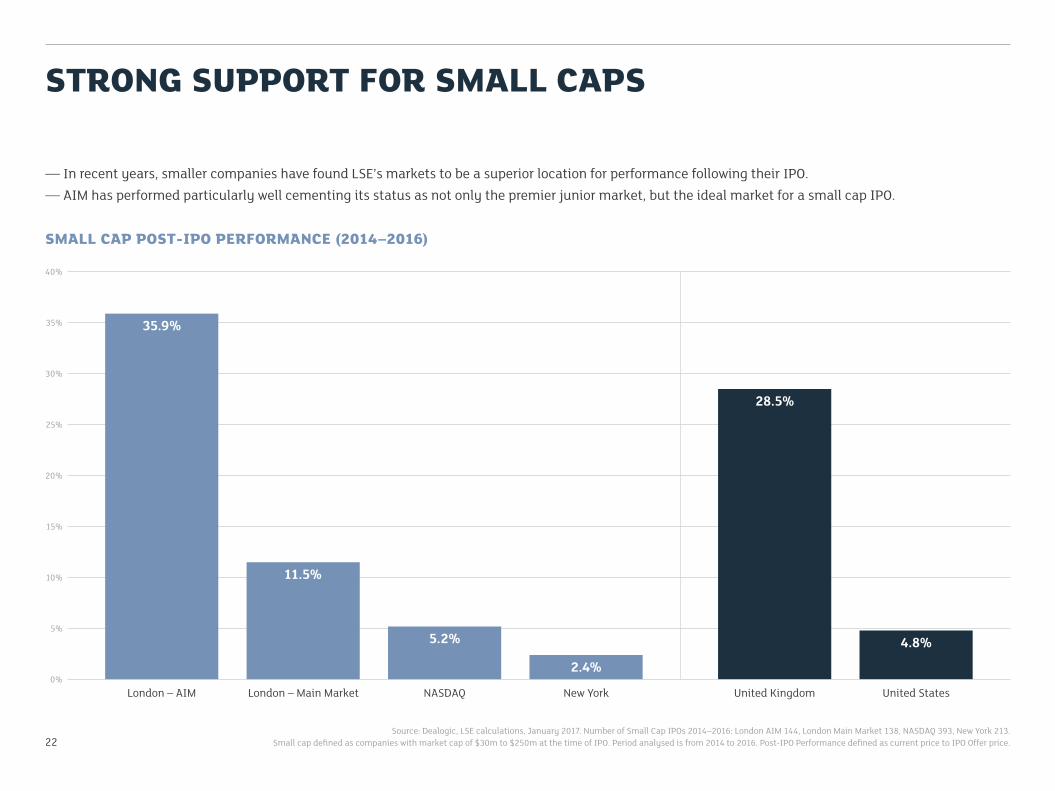
STRONG SUPPORT FOR SMALL CAPS
22
— In recent years, smaller companies have found LSE’s markets to be a superior location for performance following their IPO.— AIM has performed particularly well cementing its status as not only the premier junior market, but the ideal market for a small cap IPO.
Source: Dealogic, LSE calculations, January 2017. Number of Small Cap IPOs 2014–2016: London AIM 144, London Main Market 138, NASDAQ 393, New York 213.Small cap defined as companies with market cap of $30m to $250m at the time of IPO. Period analysed is from 2014 to 2016. Post-IPO Performance defined as current price to IPO Offer price.
SMALL CAP POST-IPO PERFORMANCE (2014–2016)
40%
0%
35%
30%
25%
20%
15%
10%
5%
London – AIM United StatesLondon – Main Market NASDAQ New York United Kingdom
35.9%
11.5%
5.2%
2.4%
28.5%
4.8%
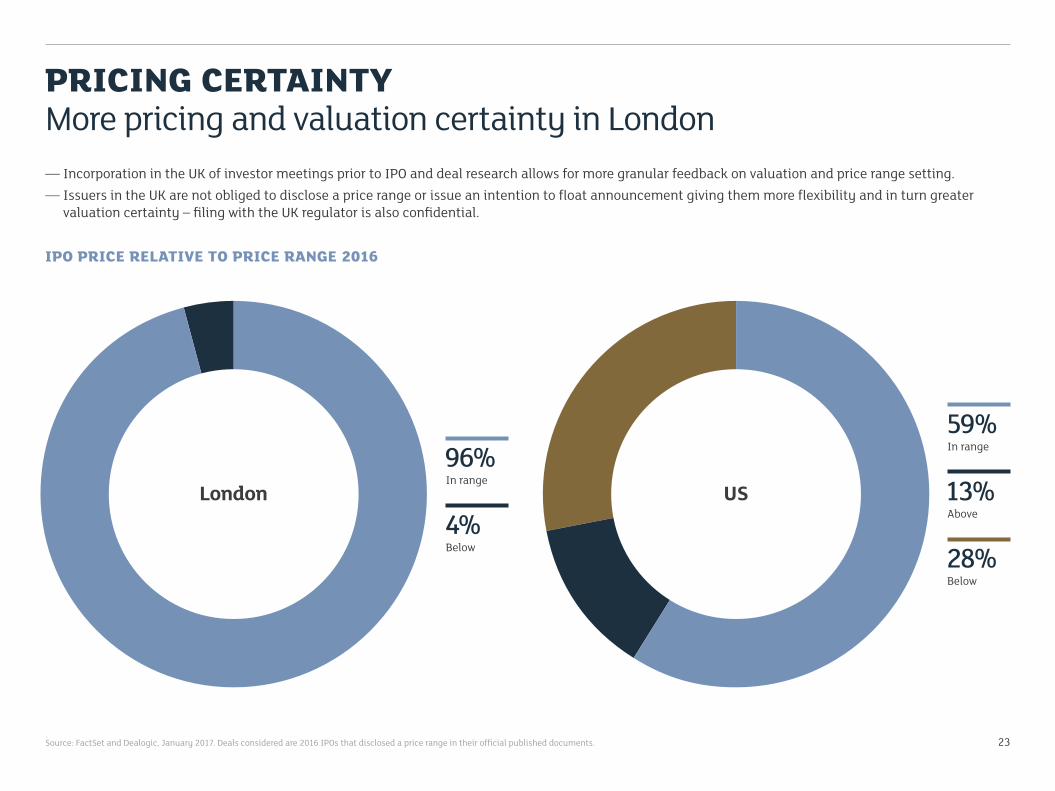
PRICING CERTAINTYMore pricing and valuation certainty in London
23Source: FactSet and Dealogic, January 2017. Deals considered are 2016 IPOs that disclosed a price range in their official published documents.
— Incorporation in the UK of investor meetings prior to IPO and deal research allows for more granular feedback on valuation and price range setting.— Issuers in the UK are not obliged to disclose a price range or issue an intention to float announcement giving them more flexibility and in turn greater
valuation certainty – filing with the UK regulator is also confidential.
IPO PRICE RELATIVE TO PRICE RANGE 2016
96%In range
4%Below
59%In range
13%Above
28%Below
London US
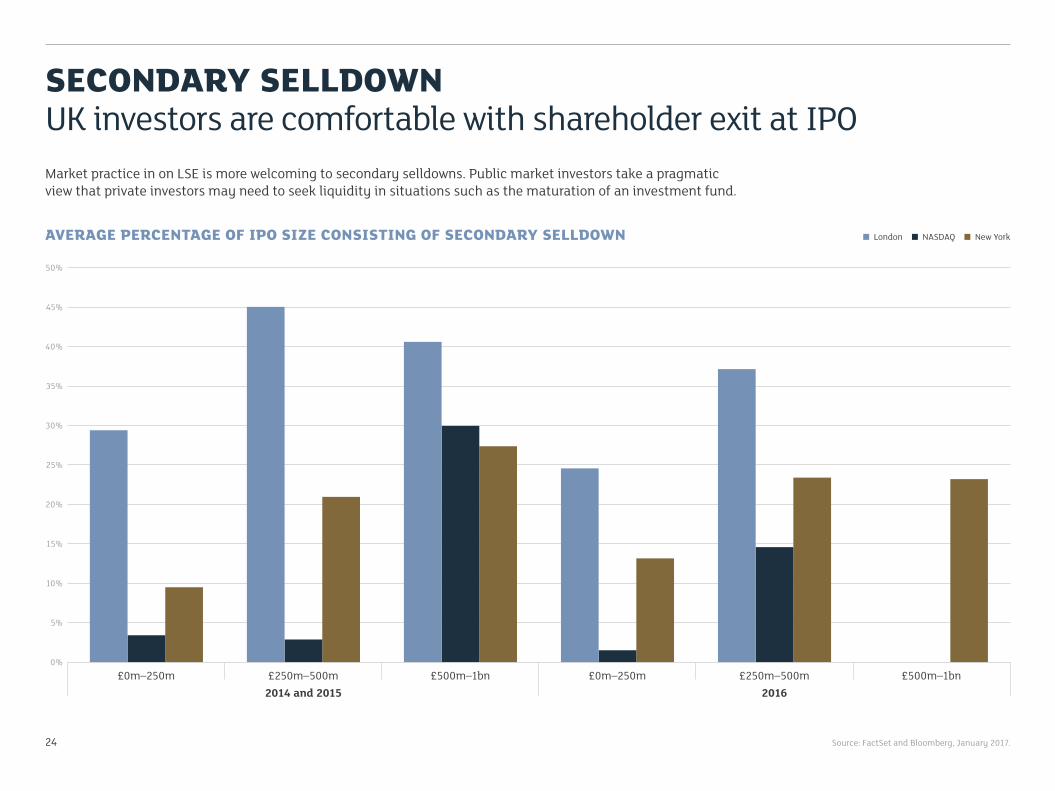
SECONDARY SELLDOWNUK investors are comfortable with shareholder exit at IPO
24
Market practice in on LSE is more welcoming to secondary selldowns. Public market investors take a pragmatic view that private investors may need to seek liquidity in situations such as the maturation of an investment fund.
Source: FactSet and Bloomberg, January 2017.
AVERAGE PERCENTAGE OF IPO SIZE CONSISTING OF SECONDARY SELLDOWN
50%
45%
40%
35%
30%
25%
20%
15%
10%
5%
2014 and 2015£0m–250m
0%
2016£500m–1bn£250m–500m £500m–1bn £0m–250m £250m–500m
London NASDAQ New York
25
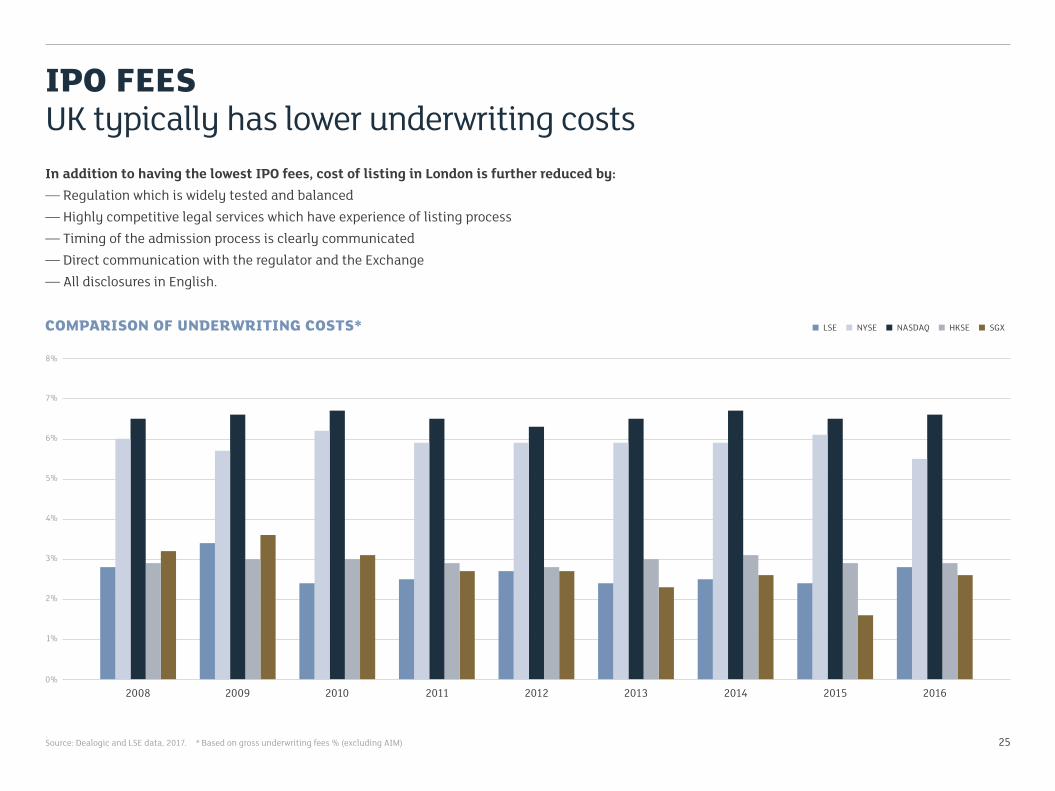
IPO FEESUK typically has lower underwriting costs
Source: Dealogic and LSE data, 2017. * Based on gross underwriting fees % (excluding AIM)
In addition to having the lowest IPO fees, cost of listing in London is further reduced by:— Regulation which is widely tested and balanced— Highly competitive legal services which have experience of listing process— Timing of the admission process is clearly communicated— Direct communication with the regulator and the Exchange— All disclosures in English.
COMPARISON OF UNDERWRITING COSTS* LSE NYSE NASDAQ HKSE SGX
2008 2009 2010 2011 2012 2013 2014 2015 2016
7%
6%
5%
4%
3%
2%
1%
8%
0%
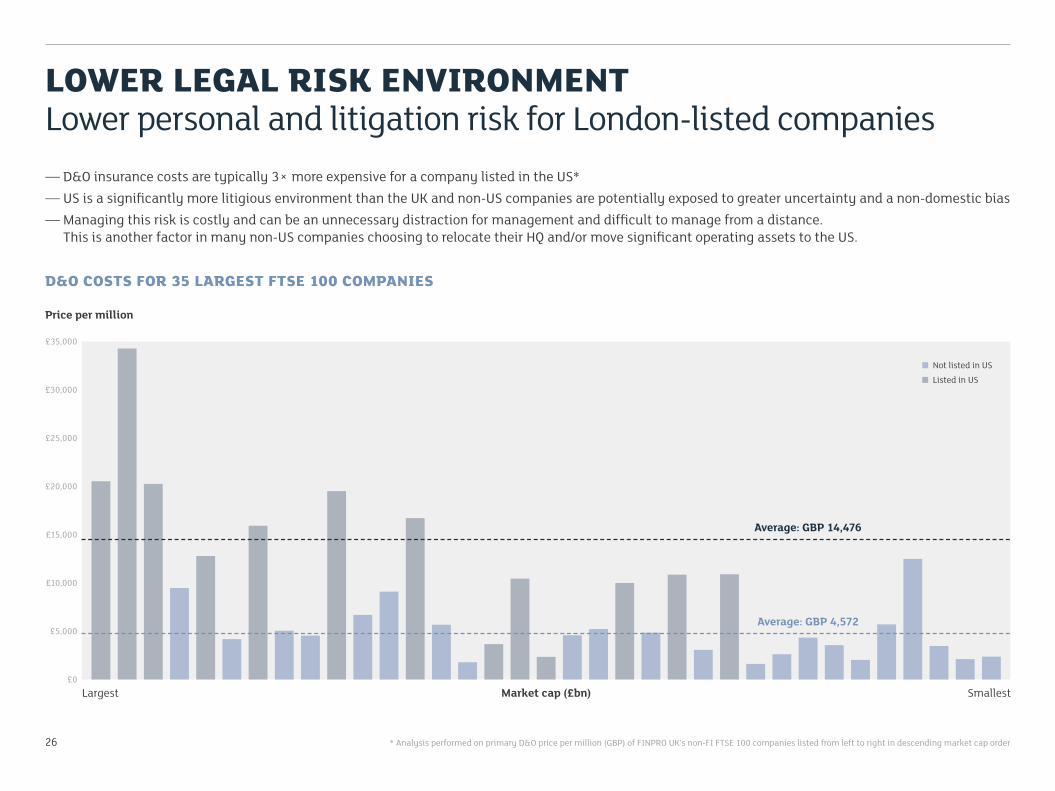
* Analysis performed on primary D&O price per million (GBP) of FINPRO UK’s non-FI FTSE 100 companies listed from left to right in descending market cap order
D&O COSTS FOR 35 LARGEST FTSE 100 COMPANIES
Price per million
Not listed in US
Listed in US
Average: GBP 14,476
Average: GBP 4,572
26
LOWER LEGAL RISK ENVIRONMENTLower personal and litigation risk for London-listed companies— D&O insurance costs are typically 3× more expensive for a company listed in the US*— US is a significantly more litigious environment than the UK and non-US companies are potentially exposed to greater uncertainty and a non-domestic bias— Managing this risk is costly and can be an unnecessary distraction for management and difficult to manage from a distance.
This is another factor in many non-US companies choosing to relocate their HQ and/or move significant operating assets to the US.
Largest Market cap (£bn) Smallest
£35,000
£30,000
£25,000
£20,000
£15,000
£10,000
£5,000
£0
LONDON STOCK EXCHANGE TECH CONTACTSUK
James ClarkTelephone +44 20 7797 [email protected]
Tom AttenboroughTelephone +44 20 7797 [email protected]
RUSSIA & CIS
Ayuna Nechaeva (London)Telephone +44 20 7797 [email protected]
ASIA PACIFIC
Jon Edwards (Beijing)Telephone +44 20 7797 [email protected]
INTERNATIONAL
Tom AttenboroughTelephone +44 20 7797 [email protected]
AMERICAS
Chris Mayo (Chicago)Telephone +1 646 925 [email protected]
CONTINENTAL EUROPE
Axel KalinowskiTelephone +44 20 7797 [email protected]
ISRAEL
Justine Zwerling (Tel Aviv)Telephone +97 [email protected]
For further information refer to www.lseg.com 27

NOTES
28


This document has been compiled by the London Stock Exchange plc (the “Exchange”). The Exchange has attempted to ensure that the information in this document is accurate, however the information is provided “AS IS” and on an “AS AVAILABLE” basis and may not be accurate or up to date. The Exchange does not guarantee the accuracy, timeliness, completeness, performance or fitness for a particular purpose of the document or any of the information in it. The Exchange is not responsible for any third party content which is set out in this document. No responsibility is accepted by or on behalf of the Exchange for any errors, omissions, or inaccurate information in the document. No action should be taken or omitted to be taken in reliance upon information in this document. The Exchange accepts no liability for the results of any action taken on the basis of the information in this document. All implied warranties, including but not limited to the implied warranties of satisfactory quality, fitness for a particular purpose, non-infringement, compatibility, security and accuracy are excluded by the Exchange to the extent that they may be excluded as a matter of law. Further, the Exchange does not warrant that the document is error free or that any defects will be corrected. To the extent permitted by applicable law, the Exchange expressly disclaims all liability howsoever arising whether in contract, tort (or deceit) or otherwise (including, but not limited to, liability for any negligent act or omissions) to any person in respect of any claims or losses of any nature, arising directly or indirectly from: (i) anything done or the consequences of anything done or omitted to be done wholly or partly in reliance upon the whole or any part of the contents of this document, and (ii) the use of any data or materials in this document. Information in this document is not offered as advice on any particular matter and must not be treated as a substitute for specific advice. In particular information in the document does not constitute professional, financial or investment advice and must not be used as a basis for making investment decisions and is in no way intended, directly or indirectly, as an attempt to market or sell any type of financial instrument. Advice from a suitably qualified professional should always be sought in relation to any particular matter or circumstances. The contents of this document do not constitute an invitation to invest in shares of the Exchange, or constitute or form a part of any offer for the sale or subscription of, or any invitation to offer to buy or subscribe for, any securities or other financial instruments, nor should it or any part of it form the basis of, or be relied upon in any connection with any contract or commitment whatsoever. London Stock Exchange and the London Stock Exchange coat of arms device are registered trade marks of London Stock Exchange plc. Other logos, organisations and company names referred to may be the trade marks of their respective owners.
© March 2017London Stock Exchange plc, 10 Paternoster Square, London EC4M 7LSTelephone +44 (0)20 7797 1000www.lseg.com