lonely but attractive:sparse color salient points for object retrieval and categorization
DESCRIPTION
In this paper, computational methods are proposed to compute salient points designed to allow a reduction in the number of salient points while maintaining state of the art performance in image retrieval and object recognition applications. To obtain a more sparse description, a color salient point and scale determination framework is proposed operating on color spaces that have useful perceptual and saliency properties. This allows for the necessary discriminative points to be located, allowing a significant reduction in the number of salient points and obtaining an invariant (repeatability) and discriminative (distinctiveness) image description.TRANSCRIPT
Lonely but Attractive:Sparse Color Salient Points for Object Retrieval and Categorization
Julian StottingerVienna University of Technology
Favoritenstr 9/183-2Vienna, Austria
Allan Hanbury, Theo Gevers and Nicu SebeUniversity of Amsterdam
Kruislaan 403Amsterdam, The Netherlands
[hanbury|gevers|nicu]@science.uva.nl
Abstract
Local image descriptors computed in areas aroundsalient points in images are essential for many algorithmsin computer vision. Recent work suggests using as manysalient points as possible. While sophisticated classifiershave been proposed to cope with the resulting large num-ber of descriptors, processing this large amount of data iscomputationally costly.
In this paper, computational methods are proposed tocompute salient points designed to allow a reduction in thenumber of salient points while maintaining state of the artperformance in image retrieval and object recognition ap-plications. To obtain a more sparse description, a colorsalient point and scale determination framework is pro-posed operating on color spaces that have useful perceptualand saliency properties. This allows for the necessary dis-criminative points to be located, allowing a significant re-duction in the number of salient points and obtaining an in-variant (repeatability) and discriminative (distinctiveness)image description.
Experimental results on large image datasets show thatthe proposed method obtains state of the art results with thenumber of salient points reduced by half. This reduction inthe number of points allows subsequent operations, such asfeature extraction and clustering, to run more efficiently. Itis shown that the method provides less ambiguous features,a more compact description of visual data, and therefore afaster classification of visual data.
1. IntroductionSalient points, also referred to as interest points, are im-
portant in current solutions to computer vision challenges.In general, the current trend is toward increasing the num-ber of points [26], applying several detectors or combiningthem [13, 19], or making the salient point distribution as
dense as possible [16, 21]. While such a dense samplinghas been shown to be effective in object recognition, theseapproaches basically shift the task of discarding the non-discriminative points to the classifier.
Dense sampling implies that a huge amount of data mustbe extracted from each image and processed. This is fea-sible when executed on a cluster of computers in a re-search environment. Nevertheless, there are environmentsin which the luxury of extensive computing power is notavailable. This is illustrated by the strong trend towardsmobile computing on Netbooks, mobile phones and PDAs.Therefore, an important question is if it is possible to reducethe number of salient points extracted while still obtainingstate of the art image retrieval or object recognition results.
Therefore, in this paper, computational methods are pro-posed to compute salient points, designed to allow a reduc-tion in the number of salient points while maintaining stateof the art performance in image retrieval and object recogni-tion applications. The ability to choose the most discrimina-tive points in an image is gained through including color in-formation in the salient point determination process. To thisend, a framework is presented for using color informationto extract salient points and select a scale associated witheach salient point. The color salient point and scale deter-mination framework proposed operates on color spaces thathave useful perceptual and saliency properties. This allowsfor the necessary discriminative points to be located, allow-ing a significant reduction in the number of salient points.In this way, an invariant (repeatability) and discriminative(distinctiveness) image description is obtained.
Experimental results are presented to demonstrate thatfewer color salient points maintain state of the art perfor-mance for various applications. Firstly, we evaluate the re-peatability of corner detection approaches using the evalu-ation framework of [14]. We show that the use of color in-creases the stability and distinctiveness of salient points innatural scenes under varying transformations so that fewer
1978-1-4244-3993-5/09/$25.00 ©2009 IEEE
points maintain state of the art performance. We then showthat by using fewer color salient points, we obtain improvedretrieval of color images, by being more stable to lightingand shadowing effects. Finally, we evaluate object catego-rization using the PASCAL VOC dataset and show that theuse of significantly fewer color salient points gives com-parable performance to the best performing system in thechallenges [26].
Section 2 gives an overview of the main approaches toextract salient points. Section 3 presents the theory behindthe color salient point detection and scale calculation, withan overview of the color representations used in the experi-ments. With the experiments in Section 4, we demonstratethat significantly fewer color salient points perform equallywell to existing state of the art techniques.
2. Related workWe give an overview of the successful approaches for
detecting salient points based on intensity information andtheir extensions to use color information.
Blob detectors – based on the space-scale theory [25]and extended by [10] – rely on differential methods suchas Laplacian of Gaussians (LoG), difference of Gaussians(DoG) and Determinant of Hessian (DoH) [10]. The resultof blob detection using either LoG or DoG methods dependson the choice of a scale sampling rate which is analyzedin [11].
Maximally stable extremum regions (MSER) [12] areobtained by a watershed-like algorithm. Connected regionsof a certain thresholded range are selected if they remainstable over a set of thresholds. The algorithm is efficientboth in run-time performance and detection rate. The regionsaliency is measured as the number of thresholds where theregion remains stable.
A widely used color based interest point detector isthe Harris corner detector [7] which can be extended toRGB [15]. Instead of using the intensity gradient, the gra-dient for each RGB channel is determined. These valuesare summed and averaged using a Gaussian kernel with size!D. It is shown in [6] that it is the most stable interest pointdetector with respect to illumination changes, noise, rota-tion and viewpoint changes. It is successfully used in manyapplications including object tracking [5], visual informa-tion retrieval [18] and object-based queries. As suggestedin [24], the second moment matrix can be computed usingdifferent color models. The first step is to determine thegradients of each RGB component, which are then trans-formed to the desired color space. This method forms thebasis for the color salient point detector in Section 3.
Rugna et al. [18] suggest a method to extract scale-invariant interest points based on color information for tex-ture classification. They build a color Gaussian pyramid us-ing every channel separately. For every pyramid level and
color channel, the Harris energy is calculated building a per-ceptual image of the texture. This method is independentof the color space used. The authors suggest the Y UV orCIELAB color space.
Faille [4] proposes a shadow, shading, illumination colorand specularities invariant interest point localization usingthe perceived RGB information as terms modeled as Lam-bertian and specular reflection, and expresses their geomet-ric dependencies as a function of the light direction, surfacenormal and viewing direction. The approach is evaluatedwith the shadow-shading invariant HSI approach that wechoose in Section 3.3. Unnikrishnan et al. [22] extract scaleand illumination invariant blobs through color. The result-ing regions are found by non-maxima suppression in thescale space pyramid.
3. Color Salient Point and Scale Detection
We first present the Harris corner detector generalized tocolor images, followed by the PCA method for determiningthe characteristic scale of the region surrounding an inter-est point in color images [20]. Finally we describe the twocolor spaces used for the experiments. In contrast to othercolor interest points used so far [1, 4, 5, 15, 18, 22] we areusing an adapted color Harris detector in conjunction withan independent scale selection maintaining the main prop-erties of the chosen color space [20]. Very relevant to ourwork is the research of van de Weijer et al. [24, 23]. Theydid preliminary work on incorporating color distinctivenessinto the design of salient point detectors (see Section 3.3)and extended the RGB based Harris to be applied on arbi-trary color spaces which is given in the next Section.
3.1. Color Salient Point Detector
The Harris corner detector introduced in [7] provides acornerness measure for image data. It is based on the secondmoment matrix which describes the gradient distribution inthe local neighborhood of a pixel in a greyscale image.
The second moment matrix can be computed in colorspaces that are obtained by transformation from the RGBspace [24]. The first step is to determine the gradients ofeach component of the RGB color system. This is done us-ing a convolution with a differentiation kernel of size !D.The gradients are then transformed into the desired colorsystem. By multiplication and summation of the trans-formed gradients, all components of the second momentmatrix are computed. The values are averaged by a Gaus-sian integration kernel with size !I . To achieve scale invari-ance, scale normalization is done using the factor !D.
In symbolic form, an arbitrary color space C is used withits n components [c1, . . . , cn]T . The second moment matrix
2
M computed at position x in a color image is then
M(x, !I , !D) =!2DG(!I)!
!L2
x(x, !D) LxLy(x, !D)LxLy(x, !D) L2
y(x, !D)
"
(1)
with the components L2x, LxLy and L2
y defined as:
L2x(x, !D) =
n#
i=1
c2i,x(x, !D) (2)
LxLy(x, !D) =n#
i=1
ci,x(x, !D)ci,y(x, !D)
L2y(x, !D) =
n#
i=1
c2i,y(x, !D)
where ci,x and ci,y denote the components of the trans-formed color channel gradients, and where the subscript xor y indicates the direction of the gradient. As shown in sev-eral experiments [14], the relation 3!D = !I performs best.Given a second moment matrix M(x, !I , !D), the Harrisenergy is calculated based on the trace and determinant ofthis matrix:
CH(x, !I , !D) = det(M)" " · trace2(M) (3)
where the matrices M are calculated using the parametersspecified as arguments of the CH function. The constant "indicates the slope of the zero line, i.e. the border betweencorner and edge. We show in Section 4 that this measuregives a powerful saliency indication for the choice of im-portant salient points. In the next section, we suggest a wayto estimate the characteristic scale of a salient point basedon this measurement.
3.2. Color Scale DecisionMikolajczyk and Schmid [14] applied the Laplacian of
Gaussian for automatic scale selection. This is referred toas the Harris Laplacian detector. The scale space of theHarris function is built by iteratively calculating the Harrisenergy under varying !D and !I .
We apply principal component analysis (PCA) to reducethe transformed color image I to a single channel findingthe most representing projection vector and reducing theprojective representation error $I(x) = #!I(x)T [2]. In thisscope the projection aims to maintain both salient colorsand relative color differences. Therefore we make use ofthe “saliency implies rarity” principle from [8].
The Laplacian of Gaussian function ! has been used todetect the characteristic scale automatically [10]. ! is de-fined by
!(x, !D) =%
$2I
$x2+
$2I
$y2
&!G(!D)! "(!D) (4)
where "(!D) is the circularly symmetric raised cosine ker-nel, which is defined for each location xi, yi in the patchwith the center xc, yc and the radius !D
"(!D) =1 + (cos( "
#D
'(xi " xc)2 + (yi " yc)2)
3(5)
A convolution with this kernel gives smoother bordersthan the Gaussian kernel G for scale decision [9].
A characteristic scale of a possible region is found ifboth the Harris energy and the Laplacian of Gaussian areextrema [20]. Aiming for just one region per location cover-ing the characteristic structure around, we use the followingdecision criteria:
$R(x) =
(maxs
)$E(x, s)
*
3targ maxs[(b!(x,s))]!D
+(6)
where, having chosen constants !I , !D and t, the func-tions are $E(x, s) = CH (x, ts!I , ts!D) and $!(x, s) =! (x, ts!D). The resulting vector function $R(x) defines allcandidates for salient points and the corresponding regionsize. The Harris energy is the measure used to characterizesalient points, and is used as a decision criterion for discard-ing less salient points. The characteristic scale is estimatedindependently of the scale in which the highest Harris en-ergy occurs.
3.3. Color SpacesWe calculate the proposed salient points in two color
spaces encoding luminance and chroma information sepa-rately. We use the color space HSI proposed in [24], de-rived from the Opponent Color Space (OCS) defined as
OCS =
,
-o1
o2
o3
.
/ =
,
0-
R!G"2
R+G!2B"6
R+G+B"3
.
1/ (7)
This orthonormal transformation into OCS providesspecular variance.
A polar transformation on o1 and o2 of the OCS leadsto the HSI color space
HSI =
,
-hsi
.
/ =
,
-tan!1
2o1o2
3'
o21 + o2
2
o3
.
/ (8)
The derivative of the hue component h is both the shad-ing and the specular quasi-invariant [24], as it is both per-pendicular to the shadow-shading direction and the speculardirection.
As proposed in [23], colors have different occurrenceprobabilities p(v) and therefore, different information con-tent I(v) of the descriptor v:
I(v) = "log(p(v)) (9)
3
The idea behind color boosting is to boost rare colorsto have a higher saliency in the cornerness measurement.Looking for rare colors, statistics for the Corel Databasecontaining 40000 color images showed that the three di-mensional color distribution was remarkably significant.The color boosting transformation is chosen that vectors ofequal saliency lead to vectors of equal length. A boostingfunction can be found so that pixel information in the imagedata has equal impact on the saliency function as its infor-mation content. The strength of gradients is considered asthe decorrelated information content [24].
These color spaces provide either shading and specularquasi-invariance or a occurrence probability based saliencymeasure. Therefore we use these two color spaces to ex-tract the color salient points used in the experiments in thefollowing Section.
4. ExperimentsThe experiments aim to demonstrate that state of the art
results can be obtained when using significantly fewer colorsalient points. We first demonstrate the stability of thesecolor salient points by carrying out extensive repeatabilityexperiments on natural scenes in Section 4.1. We show thatcolor information increases the stability of salient pointsespecially for lighting changes. In an image retrieval ex-periment in Section 4.2, we show that fewer color salientpoints outperform intensity-based Harris Laplacian salientpoints. In addition, the increased ability of color points toretrieve colorful objects under lighting changes is demon-strated. Going into “real world” experiments with naturalimages, we challenge the color salient points in a large pub-lic object categorization challenge. To show the impact ofthe location of detectors in different applications, we do notuse color based description but use illumination based SIFTand SPIN descriptors only.
In the experiments, we denote the salient points basedon the HSI quasi invariant coordinates as light invariantpoints and the salient points based on the color boostedOCS coordinates as color boosted points. When we re-fer to both of them, we refer to them as color points. InSection 4.1, we add RGB points for comparison. As thestate of the art reference, we use the Harris Laplacian. Forthe Harris Laplacian we use the latest implementation1 usedand evaluated in [14]. All experiments are carried out withthe same parameters !D = 1, s = 10, t =
#2 as suggested
in the literature and defined in Section 3. In case we choosea subset of the provided points, we order the points by theirHarris energy (see Eq. 3). We show the color based Harrisenergy gives a more reliable decision criteria for reducingfeatures than the illumination based counterpart does.
1http://www.robots.ox.ac.uk/˜vgg/research/affine/
4.1. RepeatabilityMikolajczyk and Schmid [14] suggest a test for the qual-
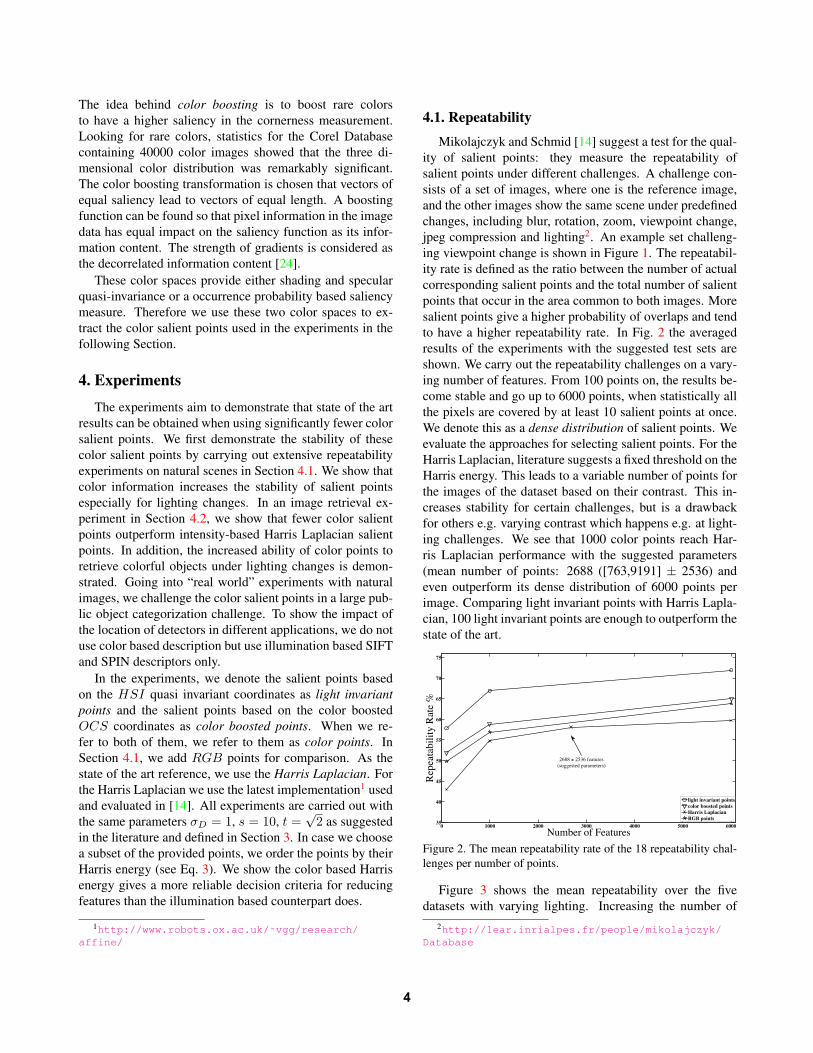
ity of salient points: they measure the repeatability ofsalient points under different challenges. A challenge con-sists of a set of images, where one is the reference image,and the other images show the same scene under predefinedchanges, including blur, rotation, zoom, viewpoint change,jpeg compression and lighting2. An example set challeng-ing viewpoint change is shown in Figure 1. The repeatabil-ity rate is defined as the ratio between the number of actualcorresponding salient points and the total number of salientpoints that occur in the area common to both images. Moresalient points give a higher probability of overlaps and tendto have a higher repeatability rate. In Fig. 2 the averagedresults of the experiments with the suggested test sets areshown. We carry out the repeatability challenges on a vary-ing number of features. From 100 points on, the results be-come stable and go up to 6000 points, when statistically allthe pixels are covered by at least 10 salient points at once.We denote this as a dense distribution of salient points. Weevaluate the approaches for selecting salient points. For theHarris Laplacian, literature suggests a fixed threshold on theHarris energy. This leads to a variable number of points forthe images of the dataset based on their contrast. This in-creases stability for certain challenges, but is a drawbackfor others e.g. varying contrast which happens e.g. at light-ing challenges. We see that 1000 color points reach Har-ris Laplacian performance with the suggested parameters(mean number of points: 2688 ([763,9191] ± 2536) andeven outperform its dense distribution of 6000 points perimage. Comparing light invariant points with Harris Lapla-cian, 100 light invariant points are enough to outperform thestate of the art.
0 1000 2000 3000 4000 5000 600035
40
45
50
55
60
65
70
75
Number of Features
Rep
eata
bil
ity
Rat
e %
light invariant points
color boosted points
Harris Laplacian
RGB points
2688 ± 2536 features
(suggested parameters)
Figure 2. The mean repeatability rate of the 18 repeatability chal-lenges per number of points.
Figure 3 shows the mean repeatability over the fivedatasets with varying lighting. Increasing the number of
2http://lear.inrialpes.fr/people/mikolajczyk/Database
4
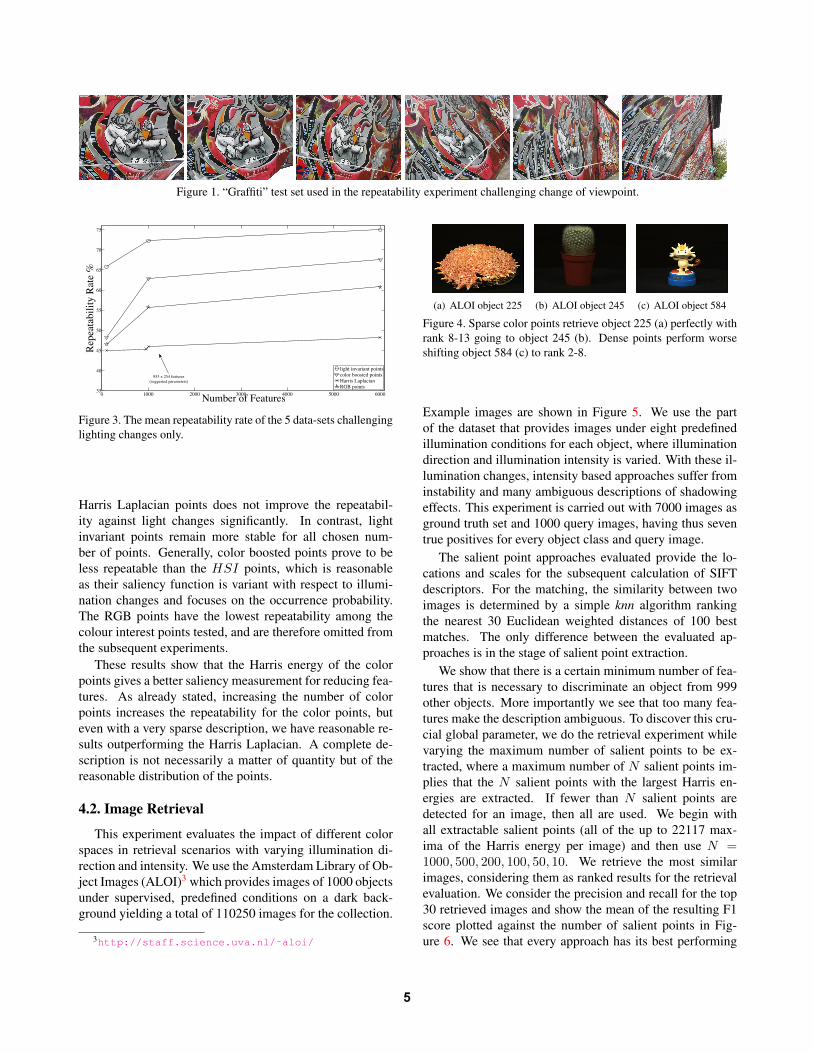
Figure 1. “Graffiti” test set used in the repeatability experiment challenging change of viewpoint.
0 1000 2000 3000 4000 5000 600035
40
45
50
55
60
65
70
75
Number of Features
Rep
eata
bil
ity
Rat
e %
light invariant points
color boosted points
Harris Laplacian
RGB points
953 ± 254 features
(suggested parameters)
Figure 3. The mean repeatability rate of the 5 data-sets challenginglighting changes only.
Harris Laplacian points does not improve the repeatabil-ity against light changes significantly. In contrast, lightinvariant points remain more stable for all chosen num-ber of points. Generally, color boosted points prove to beless repeatable than the HSI points, which is reasonableas their saliency function is variant with respect to illumi-nation changes and focuses on the occurrence probability.The RGB points have the lowest repeatability among thecolour interest points tested, and are therefore omitted fromthe subsequent experiments.
These results show that the Harris energy of the colorpoints gives a better saliency measurement for reducing fea-tures. As already stated, increasing the number of colorpoints increases the repeatability for the color points, buteven with a very sparse description, we have reasonable re-sults outperforming the Harris Laplacian. A complete de-scription is not necessarily a matter of quantity but of thereasonable distribution of the points.
4.2. Image RetrievalThis experiment evaluates the impact of different color
spaces in retrieval scenarios with varying illumination di-rection and intensity. We use the Amsterdam Library of Ob-ject Images (ALOI)3 which provides images of 1000 objectsunder supervised, predefined conditions on a dark back-ground yielding a total of 110250 images for the collection.
3http://staff.science.uva.nl/˜aloi/
(a) ALOI object 225 (b) ALOI object 245 (c) ALOI object 584
Figure 4. Sparse color points retrieve object 225 (a) perfectly withrank 8-13 going to object 245 (b). Dense points perform worseshifting object 584 (c) to rank 2-8.
Example images are shown in Figure 5. We use the partof the dataset that provides images under eight predefinedillumination conditions for each object, where illuminationdirection and illumination intensity is varied. With these il-lumination changes, intensity based approaches suffer frominstability and many ambiguous descriptions of shadowingeffects. This experiment is carried out with 7000 images asground truth set and 1000 query images, having thus seventrue positives for every object class and query image.
The salient point approaches evaluated provide the lo-cations and scales for the subsequent calculation of SIFTdescriptors. For the matching, the similarity between twoimages is determined by a simple knn algorithm rankingthe nearest 30 Euclidean weighted distances of 100 bestmatches. The only difference between the evaluated ap-proaches is in the stage of salient point extraction.
We show that there is a certain minimum number of fea-tures that is necessary to discriminate an object from 999other objects. More importantly we see that too many fea-tures make the description ambiguous. To discover this cru-cial global parameter, we do the retrieval experiment whilevarying the maximum number of salient points to be ex-tracted, where a maximum number of N salient points im-plies that the N salient points with the largest Harris en-ergies are extracted. If fewer than N salient points aredetected for an image, then all are used. We begin withall extractable salient points (all of the up to 22117 max-ima of the Harris energy per image) and then use N =1000, 500, 200, 100, 50, 10. We retrieve the most similarimages, considering them as ranked results for the retrievalevaluation. We consider the precision and recall for the top30 retrieved images and show the mean of the resulting F1score plotted against the number of salient points in Fig-ure 6. We see that every approach has its best performing
5
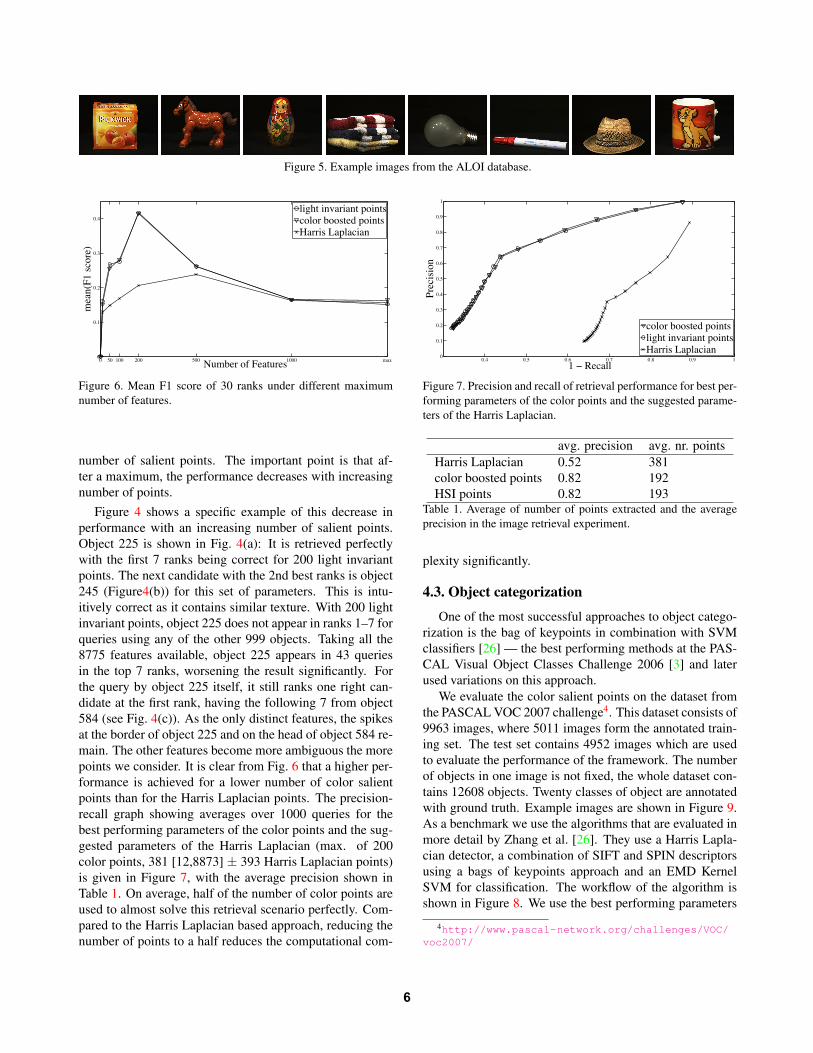
Figure 5. Example images from the ALOI database.
0 50 100 200 500 1000 max0
0.1
0.2
0.3
0.4
Number of Features
mea
n(F
1 s
core
)
light invariant pointscolor boosted pointsHarris Laplacian
Figure 6. Mean F1 score of 30 ranks under different maximumnumber of features.
number of salient points. The important point is that af-ter a maximum, the performance decreases with increasingnumber of points.
Figure 4 shows a specific example of this decrease inperformance with an increasing number of salient points.Object 225 is shown in Fig. 4(a): It is retrieved perfectlywith the first 7 ranks being correct for 200 light invariantpoints. The next candidate with the 2nd best ranks is object245 (Figure4(b)) for this set of parameters. This is intu-itively correct as it contains similar texture. With 200 lightinvariant points, object 225 does not appear in ranks 1–7 forqueries using any of the other 999 objects. Taking all the8775 features available, object 225 appears in 43 queriesin the top 7 ranks, worsening the result significantly. Forthe query by object 225 itself, it still ranks one right can-didate at the first rank, having the following 7 from object584 (see Fig. 4(c)). As the only distinct features, the spikesat the border of object 225 and on the head of object 584 re-main. The other features become more ambiguous the morepoints we consider. It is clear from Fig. 6 that a higher per-formance is achieved for a lower number of color salientpoints than for the Harris Laplacian points. The precision-recall graph showing averages over 1000 queries for thebest performing parameters of the color points and the sug-gested parameters of the Harris Laplacian (max. of 200color points, 381 [12,8873] ± 393 Harris Laplacian points)is given in Figure 7, with the average precision shown inTable 1. On average, half of the number of color points areused to almost solve this retrieval scenario perfectly. Com-pared to the Harris Laplacian based approach, reducing thenumber of points to a half reduces the computational com-
!"# !"$ !"% !"& !"' !"( )!
!")
!"*
!"+
!"#
!"$
!"%
!"&
!"'
!"(
)
),!,-./011
23./45467
/6163,86659.:,;6479514<=9,47>034079,;64795?03345,@0;10/407
Figure 7. Precision and recall of retrieval performance for best per-forming parameters of the color points and the suggested parame-ters of the Harris Laplacian.
avg. precision avg. nr. pointsHarris Laplacian 0.52 381color boosted points 0.82 192HSI points 0.82 193
Table 1. Average of number of points extracted and the averageprecision in the image retrieval experiment.
plexity significantly.
4.3. Object categorizationOne of the most successful approaches to object catego-
rization is the bag of keypoints in combination with SVMclassifiers [26] — the best performing methods at the PAS-CAL Visual Object Classes Challenge 2006 [3] and laterused variations on this approach.
We evaluate the color salient points on the dataset fromthe PASCAL VOC 2007 challenge4. This dataset consists of9963 images, where 5011 images form the annotated train-ing set. The test set contains 4952 images which are usedto evaluate the performance of the framework. The numberof objects in one image is not fixed, the whole dataset con-tains 12608 objects. Twenty classes of object are annotatedwith ground truth. Example images are shown in Figure 9.As a benchmark we use the algorithms that are evaluated inmore detail by Zhang et al. [26]. They use a Harris Lapla-cian detector, a combination of SIFT and SPIN descriptorsusing a bags of keypoints approach and an EMD KernelSVM for classification. The workflow of the algorithm isshown in Figure 8. We use the best performing parameters
4http://www.pascal-network.org/challenges/VOC/voc2007/
6
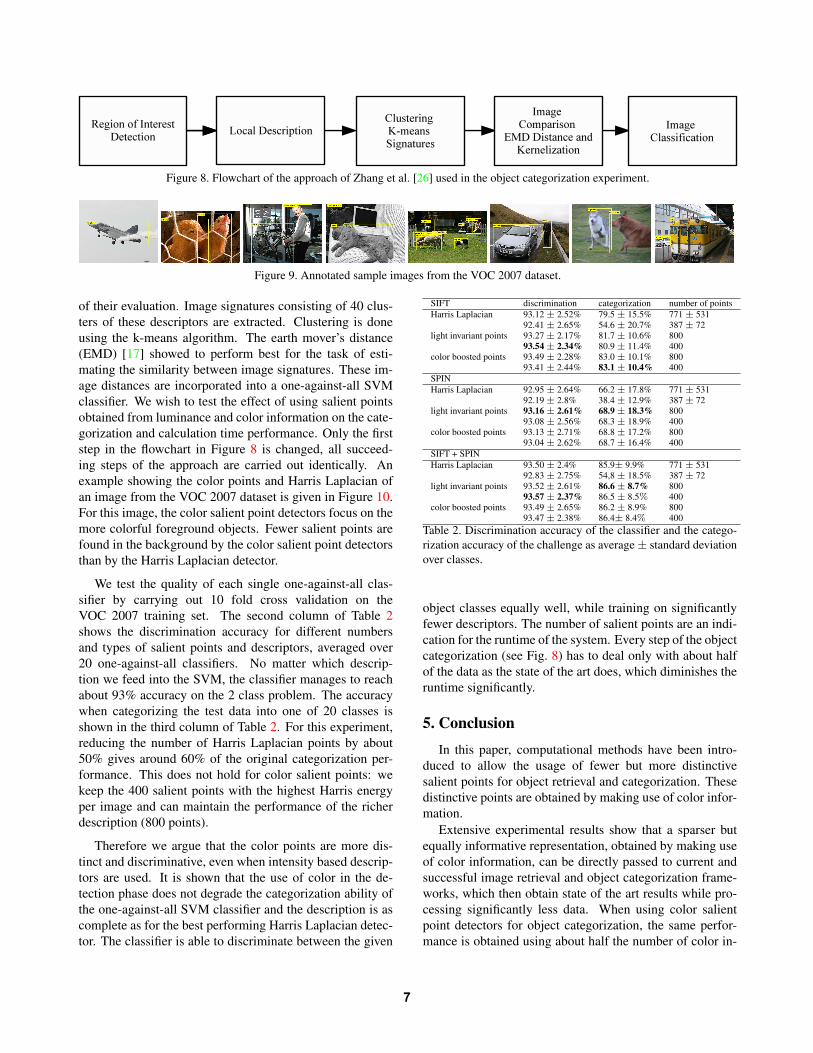
Figure 8. Flowchart of the approach of Zhang et al. [26] used in the object categorization experiment.
Figure 9. Annotated sample images from the VOC 2007 dataset.
of their evaluation. Image signatures consisting of 40 clus-ters of these descriptors are extracted. Clustering is doneusing the k-means algorithm. The earth mover’s distance(EMD) [17] showed to perform best for the task of esti-mating the similarity between image signatures. These im-age distances are incorporated into a one-against-all SVMclassifier. We wish to test the effect of using salient pointsobtained from luminance and color information on the cate-gorization and calculation time performance. Only the firststep in the flowchart in Figure 8 is changed, all succeed-ing steps of the approach are carried out identically. Anexample showing the color points and Harris Laplacian ofan image from the VOC 2007 dataset is given in Figure 10.For this image, the color salient point detectors focus on themore colorful foreground objects. Fewer salient points arefound in the background by the color salient point detectorsthan by the Harris Laplacian detector.
We test the quality of each single one-against-all clas-sifier by carrying out 10 fold cross validation on theVOC 2007 training set. The second column of Table 2shows the discrimination accuracy for different numbersand types of salient points and descriptors, averaged over20 one-against-all classifiers. No matter which descrip-tion we feed into the SVM, the classifier manages to reachabout 93% accuracy on the 2 class problem. The accuracywhen categorizing the test data into one of 20 classes isshown in the third column of Table 2. For this experiment,reducing the number of Harris Laplacian points by about50% gives around 60% of the original categorization per-formance. This does not hold for color salient points: wekeep the 400 salient points with the highest Harris energyper image and can maintain the performance of the richerdescription (800 points).
Therefore we argue that the color points are more dis-tinct and discriminative, even when intensity based descrip-tors are used. It is shown that the use of color in the de-tection phase does not degrade the categorization ability ofthe one-against-all SVM classifier and the description is ascomplete as for the best performing Harris Laplacian detec-tor. The classifier is able to discriminate between the given
SIFT discrimination categorization number of pointsHarris Laplacian 93.12± 2.52% 79.5± 15.5% 771± 531
92.41± 2.65% 54.6± 20.7% 387± 72light invariant points 93.27± 2.17% 81.7± 10.6% 800
93.54± 2.34% 80.9± 11.4% 400color boosted points 93.49± 2.28% 83.0± 10.1% 800
93.41± 2.44% 83.1± 10.4% 400SPINHarris Laplacian 92.95± 2.64% 66.2± 17.8% 771± 531
92.19± 2.8% 38.4± 12.9% 387± 72light invariant points 93.16± 2.61% 68.9± 18.3% 800
93.08± 2.56% 68.3± 18.9% 400color boosted points 93.13± 2.71% 68.8± 17.2% 800
93.04± 2.62% 68.7± 16.4% 400SIFT + SPINHarris Laplacian 93.50± 2.4% 85.9± 9.9% 771± 531
92.83± 2.75% 54,8± 18.5% 387± 72light invariant points 93.52± 2.61% 86.6± 8.7% 800
93.57± 2.37% 86.5± 8.5% 400color boosted points 93.49± 2.65% 86.2± 8.9% 800
93.47± 2.38% 86.4± 8.4% 400Table 2. Discrimination accuracy of the classifier and the catego-rization accuracy of the challenge as average± standard deviationover classes.
object classes equally well, while training on significantlyfewer descriptors. The number of salient points are an indi-cation for the runtime of the system. Every step of the objectcategorization (see Fig. 8) has to deal only with about halfof the data as the state of the art does, which diminishes theruntime significantly.
5. ConclusionIn this paper, computational methods have been intro-
duced to allow the usage of fewer but more distinctivesalient points for object retrieval and categorization. Thesedistinctive points are obtained by making use of color infor-mation.
Extensive experimental results show that a sparser butequally informative representation, obtained by making useof color information, can be directly passed to current andsuccessful image retrieval and object categorization frame-works, which then obtain state of the art results while pro-cessing significantly less data. When using color salientpoint detectors for object categorization, the same perfor-mance is obtained using about half the number of color in-
7
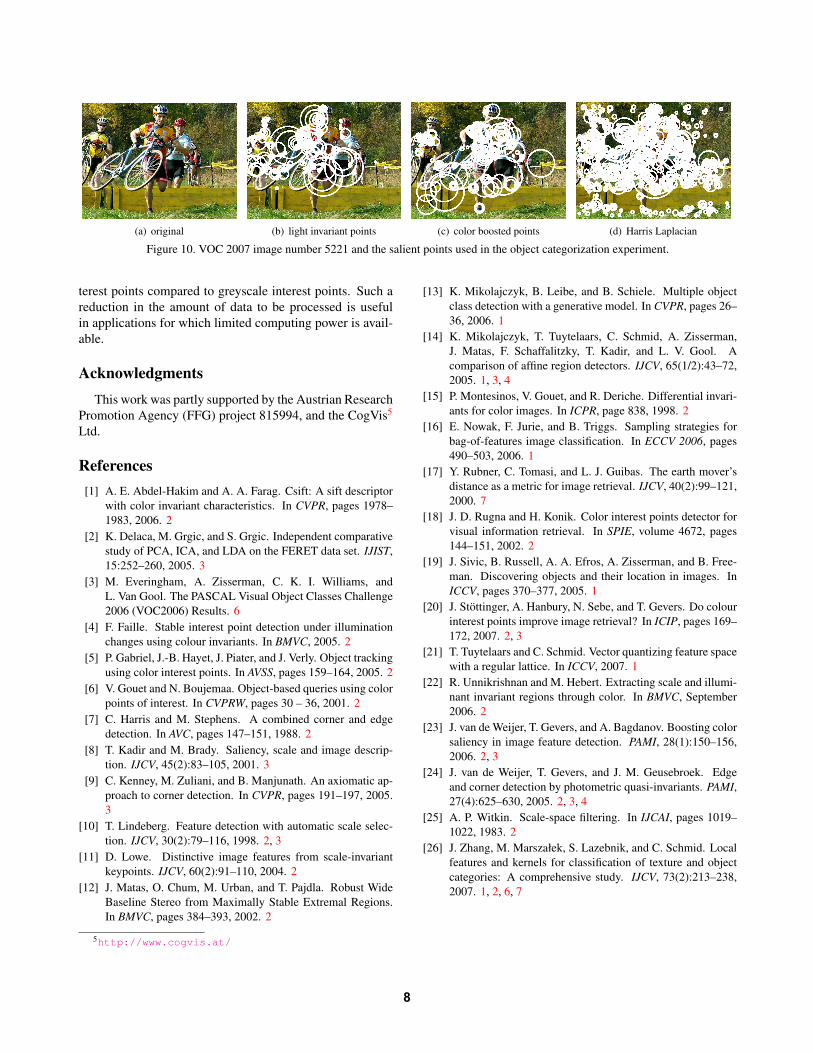
(a) original (b) light invariant points (c) color boosted points (d) Harris Laplacian
Figure 10. VOC 2007 image number 5221 and the salient points used in the object categorization experiment.
terest points compared to greyscale interest points. Such areduction in the amount of data to be processed is usefulin applications for which limited computing power is avail-able.
AcknowledgmentsThis work was partly supported by the Austrian Research
Promotion Agency (FFG) project 815994, and the CogVis5
Ltd.
References[1] A. E. Abdel-Hakim and A. A. Farag. Csift: A sift descriptor
with color invariant characteristics. In CVPR, pages 1978–1983, 2006. 2
[2] K. Delaca, M. Grgic, and S. Grgic. Independent comparativestudy of PCA, ICA, and LDA on the FERET data set. IJIST,15:252–260, 2005. 3
[3] M. Everingham, A. Zisserman, C. K. I. Williams, andL. Van Gool. The PASCAL Visual Object Classes Challenge2006 (VOC2006) Results. 6
[4] F. Faille. Stable interest point detection under illuminationchanges using colour invariants. In BMVC, 2005. 2
[5] P. Gabriel, J.-B. Hayet, J. Piater, and J. Verly. Object trackingusing color interest points. In AVSS, pages 159–164, 2005. 2
[6] V. Gouet and N. Boujemaa. Object-based queries using colorpoints of interest. In CVPRW, pages 30 – 36, 2001. 2
[7] C. Harris and M. Stephens. A combined corner and edgedetection. In AVC, pages 147–151, 1988. 2
[8] T. Kadir and M. Brady. Saliency, scale and image descrip-tion. IJCV, 45(2):83–105, 2001. 3
[9] C. Kenney, M. Zuliani, and B. Manjunath. An axiomatic ap-proach to corner detection. In CVPR, pages 191–197, 2005.3
[10] T. Lindeberg. Feature detection with automatic scale selec-tion. IJCV, 30(2):79–116, 1998. 2, 3
[11] D. Lowe. Distinctive image features from scale-invariantkeypoints. IJCV, 60(2):91–110, 2004. 2
[12] J. Matas, O. Chum, M. Urban, and T. Pajdla. Robust WideBaseline Stereo from Maximally Stable Extremal Regions.In BMVC, pages 384–393, 2002. 2
5http://www.cogvis.at/
[13] K. Mikolajczyk, B. Leibe, and B. Schiele. Multiple objectclass detection with a generative model. In CVPR, pages 26–36, 2006. 1
[14] K. Mikolajczyk, T. Tuytelaars, C. Schmid, A. Zisserman,J. Matas, F. Schaffalitzky, T. Kadir, and L. V. Gool. Acomparison of affine region detectors. IJCV, 65(1/2):43–72,2005. 1, 3, 4
[15] P. Montesinos, V. Gouet, and R. Deriche. Differential invari-ants for color images. In ICPR, page 838, 1998. 2
[16] E. Nowak, F. Jurie, and B. Triggs. Sampling strategies forbag-of-features image classification. In ECCV 2006, pages490–503, 2006. 1
[17] Y. Rubner, C. Tomasi, and L. J. Guibas. The earth mover’sdistance as a metric for image retrieval. IJCV, 40(2):99–121,2000. 7
[18] J. D. Rugna and H. Konik. Color interest points detector forvisual information retrieval. In SPIE, volume 4672, pages144–151, 2002. 2
[19] J. Sivic, B. Russell, A. A. Efros, A. Zisserman, and B. Free-man. Discovering objects and their location in images. InICCV, pages 370–377, 2005. 1
[20] J. Stottinger, A. Hanbury, N. Sebe, and T. Gevers. Do colourinterest points improve image retrieval? In ICIP, pages 169–172, 2007. 2, 3
[21] T. Tuytelaars and C. Schmid. Vector quantizing feature spacewith a regular lattice. In ICCV, 2007. 1
[22] R. Unnikrishnan and M. Hebert. Extracting scale and illumi-nant invariant regions through color. In BMVC, September2006. 2
[23] J. van de Weijer, T. Gevers, and A. Bagdanov. Boosting colorsaliency in image feature detection. PAMI, 28(1):150–156,2006. 2, 3
[24] J. van de Weijer, T. Gevers, and J. M. Geusebroek. Edgeand corner detection by photometric quasi-invariants. PAMI,27(4):625–630, 2005. 2, 3, 4
[25] A. P. Witkin. Scale-space filtering. In IJCAI, pages 1019–1022, 1983. 2
[26] J. Zhang, M. Marsza!ek, S. Lazebnik, and C. Schmid. Localfeatures and kernels for classification of texture and objectcategories: A comprehensive study. IJCV, 73(2):213–238,2007. 1, 2, 6, 7
8