long island offshore sediment resources white paper (bokuniewicz, tanski) the new york district of...
TRANSCRIPT

Long Island Offshore Sediment ResourcesWhite Paper (Bokuniewicz, Tanski)
•The New York District of the U.S. Army Corps of Engineers is undertaking a Regional Sediment Management (RSM) program for the 120 mile south shore of Long Island from Coney Island to Montauk Point known as the Long Island Coastal Planning Project (LICPP).
Objectives of LICPP•making more effective use of the sediments found along the coast•enhancing environmental habitat•improving the collection and dissemination of information on the movement of sediment in this area.
• The two-day technical workshop was intended to review what is known, or unknown about the volume of offshore sand reserves, the potential for onshore transport, and the character of offshore sand ridges.
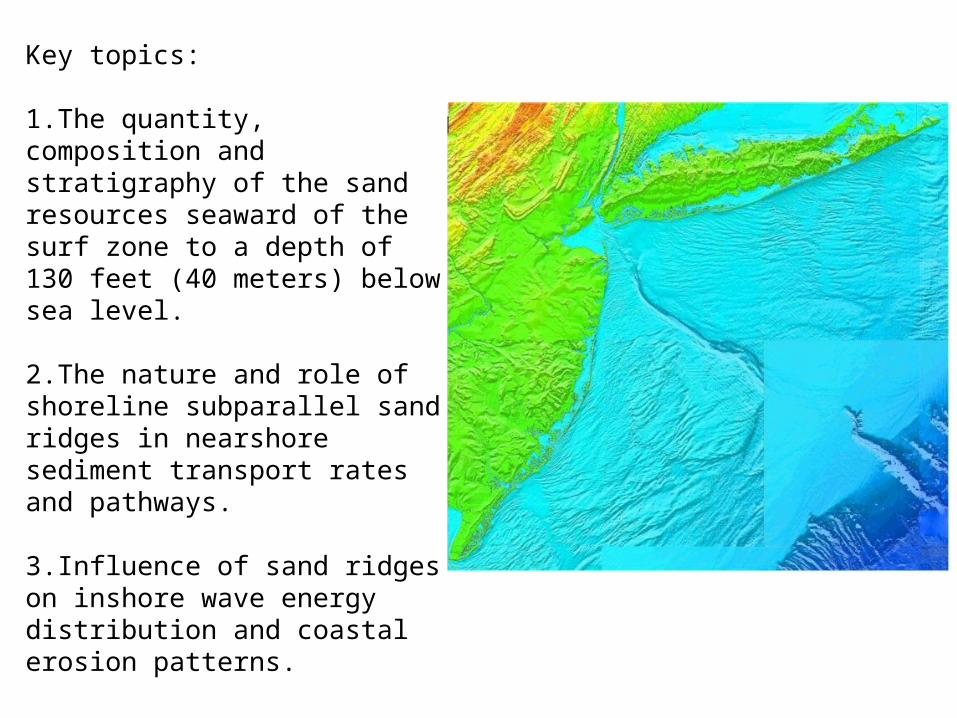
Key topics: 1.The quantity, composition and stratigraphy of the sand resources seaward of the surf zone to a depth of 130 feet (40 meters) below sea level. 2.The nature and role of shoreline subparallel sand ridges in nearshore sediment transport rates and pathways.
3.Influence of sand ridges on inshore wave energy distribution and coastal erosion patterns.
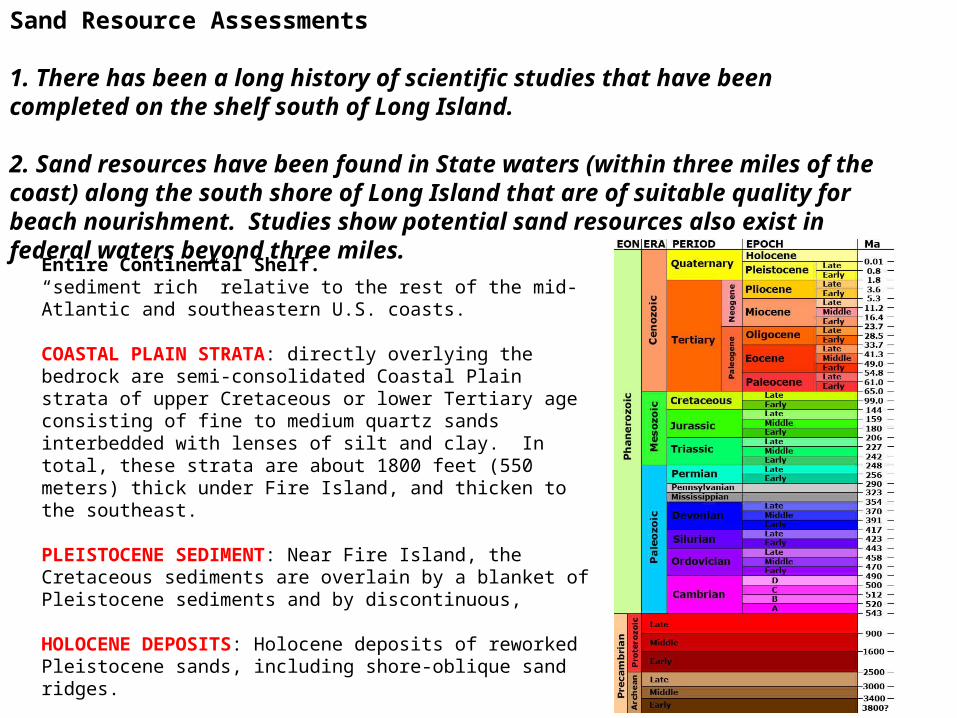
Sand Resource Assessments 1. There has been a long history of scientific studies that have been completed on the shelf south of Long Island.
2. Sand resources have been found in State waters (within three miles of the coast) along the south shore of Long Island that are of suitable quality for beach nourishment. Studies show potential sand resources also exist in federal waters beyond three miles.
Entire Continental Shelf. “sediment rich” relative to the rest of the mid-Atlantic and southeastern U.S. coasts.
COASTAL PLAIN STRATA: directly overlying the bedrock are semi-consolidated Coastal Plain strata of upper Cretaceous or lower Tertiary age consisting of fine to medium quartz sands interbedded with lenses of silt and clay. In total, these strata are about 1800 feet (550 meters) thick under Fire Island, and thicken to the southeast.
PLEISTOCENE SEDIMENT: Near Fire Island, the Cretaceous sediments are overlain by a blanket of Pleistocene sediments and by discontinuous,
HOLOCENE DEPOSITS: Holocene deposits of reworked Pleistocene sands, including shore-oblique sand ridges.

http://pubs.usgs.gov/of/1999/of99-559/fig5.htm
Pleistocene sediments are composed of sand, gravel, cobbles, silt and clay from glacial outwash, and from ground and terminal moraines deposited (Wisconsinan Glacial). (shelf = med-coarse sand with gravel)Thickness = 10-30 m
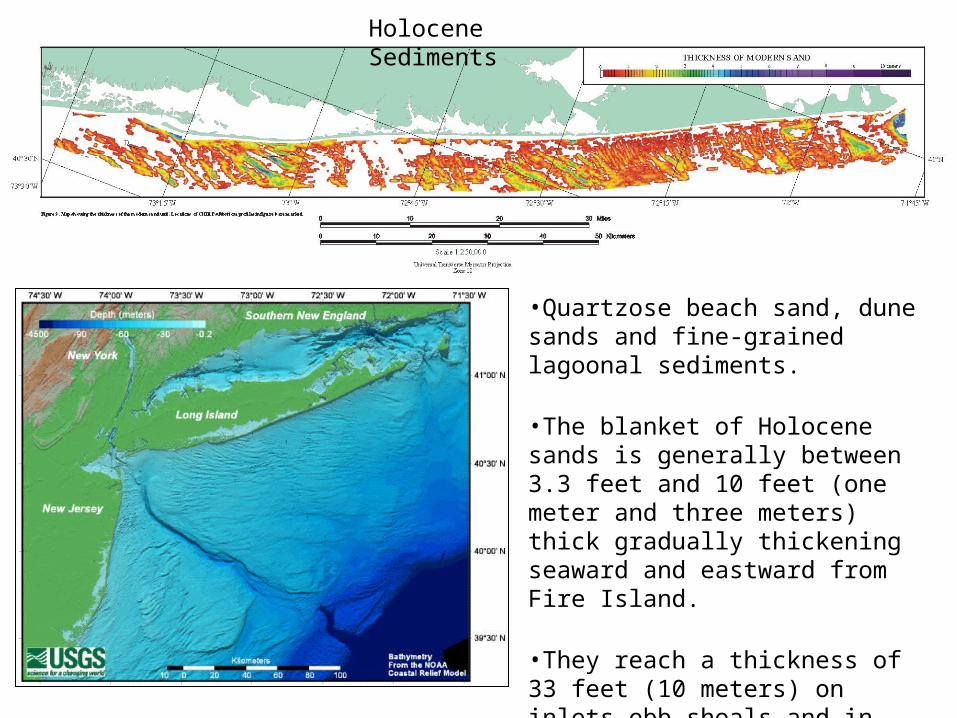
Holocene Sediments
•Quartzose beach sand, dune sands and fine-grained lagoonal sediments.
•The blanket of Holocene sands is generally between 3.3 feet and 10 feet (one meter and three meters) thick gradually thickening seaward and eastward from Fire Island.
•They reach a thickness of 33 feet (10 meters) on inlets ebb shoals and in large scale, linear sand ridges.

3. Estimated sand volume requirements for beach nourishment for the next 50 years for the Fire Island to Montauk Point Storm Damage Reduction project are not more than 5% of available volumes based on most recent geophysical surveys
“Fire Island Inlet to Montauk Point Storm Damage Reduction” (FIMP) project will require about 55 million cubic yards (44 million cubic meters) of sand for beach nourishment over its 50 year lifetime, or 1.1 million cubic yards (0.9 million cubic meters) per year.
Estimates of the volume of beach compatible sand found on the shelf in waters less than 130 feet (40 meters) depth range from about 1.3 billion cubic yards (1.0 billion cubic meters) to 7.3 billion cubic yards (5.6 billion cubic meters).

4. Accessible sand resources are found all along the coastline but are not uniformly distributed.
Table 1. Volume of material dredged from inlets.
InletExtraction
(cubic yards)Dredging
Cycle(years)
Average Annual Extraction
(cubic yards/yr)
300,000 2 150,000
East Rockaway 150,000 1 150,000
Shinnecock 350,000 4 87,500
Intracoastal 70,000 5 14,000/
Jones Inlet 640,000 5 128,000
1,500,000 2 750,000
Moriches 460,000 5 72,000
Natural Sand Sources and TransportUncertainty and concern with sediment budgets
Montauk Bluffs
Stream Input
Outwash plain of Eastern LI

5. There is geologic evidence that sand is being transported into the surf zone from beyond the surf zone.
6. The strongest evidence of onshore transport of sediment is from along western Fire Island and points west.
Outwash lobes and relict ebb shoals (possible reworking into the sand ridges)
Inner Continental Shelf Offshore Sources•profiles indicate large gains between spring and fall 1995•Onshore/offshore transport driven by wind-induced coastal upwelling/downwelling•Storm events largely produce shore parallel movement (offshore movement is secondary)

5. There is geologic evidence that sand is being transported into the surf zone from beyond the surf zone.
6. The strongest evidence of onshore transport of sediment is from along western Fire Island and points west.
•Glauconite grains, non-indigenous to terrestrial glacial deposits, were found in beach sands along Rockaway Beach, Long Beach and Jones Beach and traced to offshore deposits via vibracore samples.
•Glauconite was not found onshore east of Jones Beach.
•The occurrence of euhedral quartz crystals linked sediments from offshore glacial outwash lobes to beach deposits along the western end of Fire Island, especially in the vicinity of Democrat Point.

7. The published estimates of onshore transport range from 0% to 63% of the long shore transport estimates.
•Estimates of the longshore transport rate in western Fire Island range between 254,000 cubic yards (Gravens 1999) and 600,000 cubic yards (Panuzio 1969) .
•Updrift beach nourishment
•Erosion
•Uncertainty in data
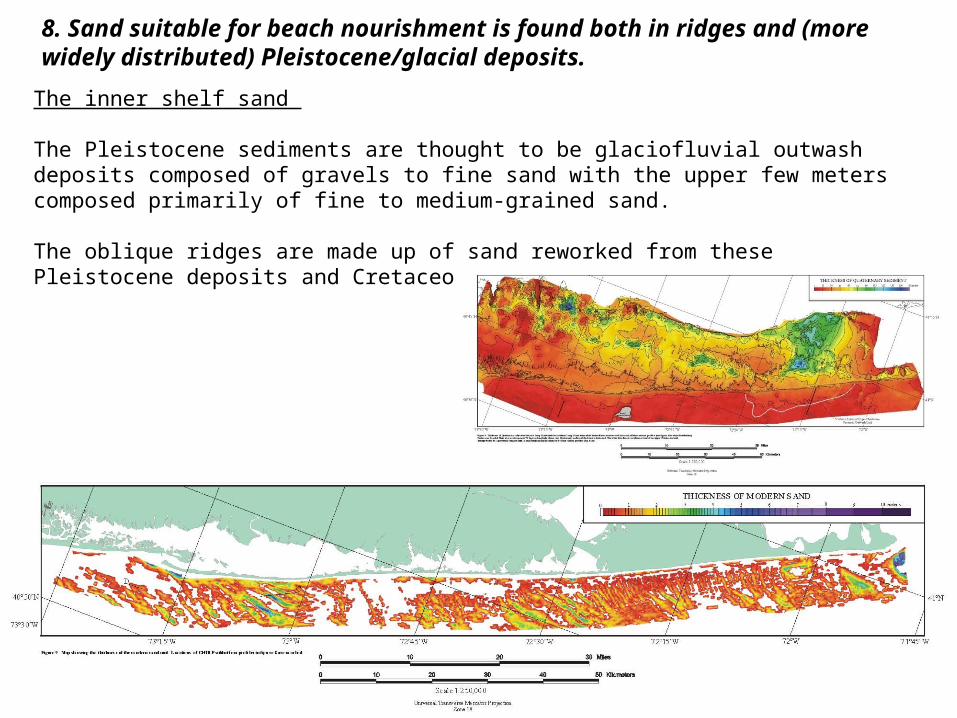
8. Sand suitable for beach nourishment is found both in ridges and (more widely distributed) Pleistocene/glacial deposits.
The inner shelf sand
The Pleistocene sediments are thought to be glaciofluvial outwash deposits composed of gravels to fine sand with the upper few meters composed primarily of fine to medium-grained sand.
The oblique ridges are made up of sand reworked from these Pleistocene deposits and Cretaceous outcrops (Schwab et al. 2000).

Topography of the Middle Atlantic Continental Shelf
•Dominated by the shore-subparallel ridges and swales
•Approximately northwest to southeast in orientation
•They are superimposed on large-scale, shoal-retreat massifs left by the Holocene transgression
•Inner shelf ridges in water depths of less than 66 feet
•Middle shelf ridges in water depths 66 to 131 feet
•Inner shelf ridges are oriented between 15º and 30º to the shoreline
•Middle shelf ridges are more nearly shoreparallel
shoal retreat massif A large sand accumulation that is preserved on the continental shelf during and after a marine transgression. The massifs represent former estuary-mouth sand bars (inlet-associated shoals) or former zones of longshore-drift convergence (cape-associated shoals).
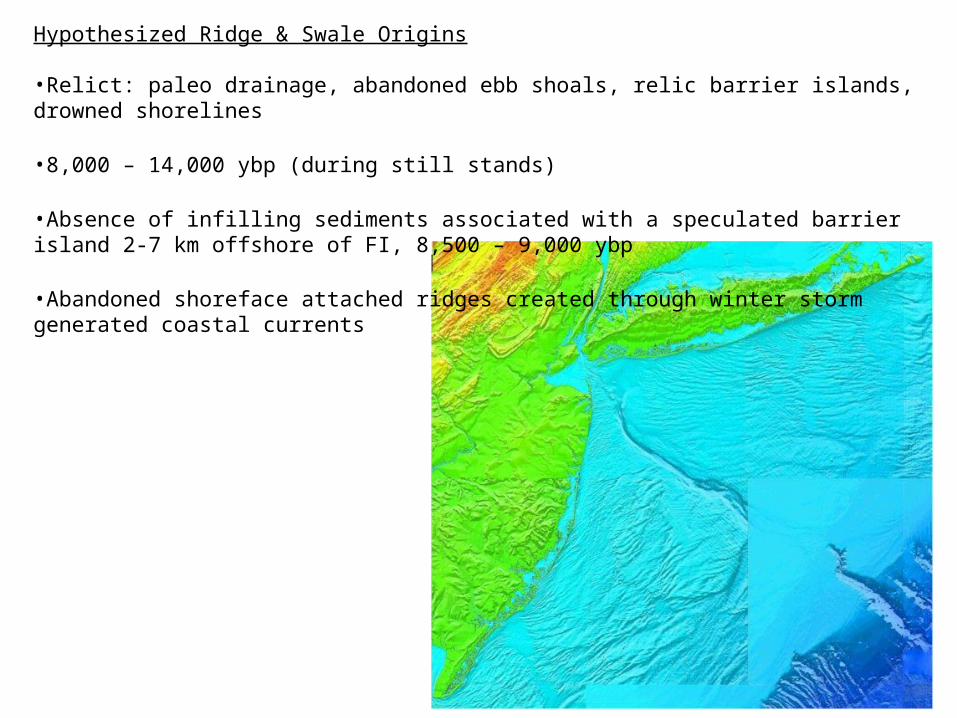
Hypothesized Ridge & Swale Origins
•Relict: paleo drainage, abandoned ebb shoals, relic barrier islands, drowned shorelines
•8,000 – 14,000 ybp (during still stands)
•Absence of infilling sediments associated with a speculated barrier island 2-7 km offshore of FI, 8,500 – 9,000 ybp
•Abandoned shoreface attached ridges created through winter storm generated coastal currents
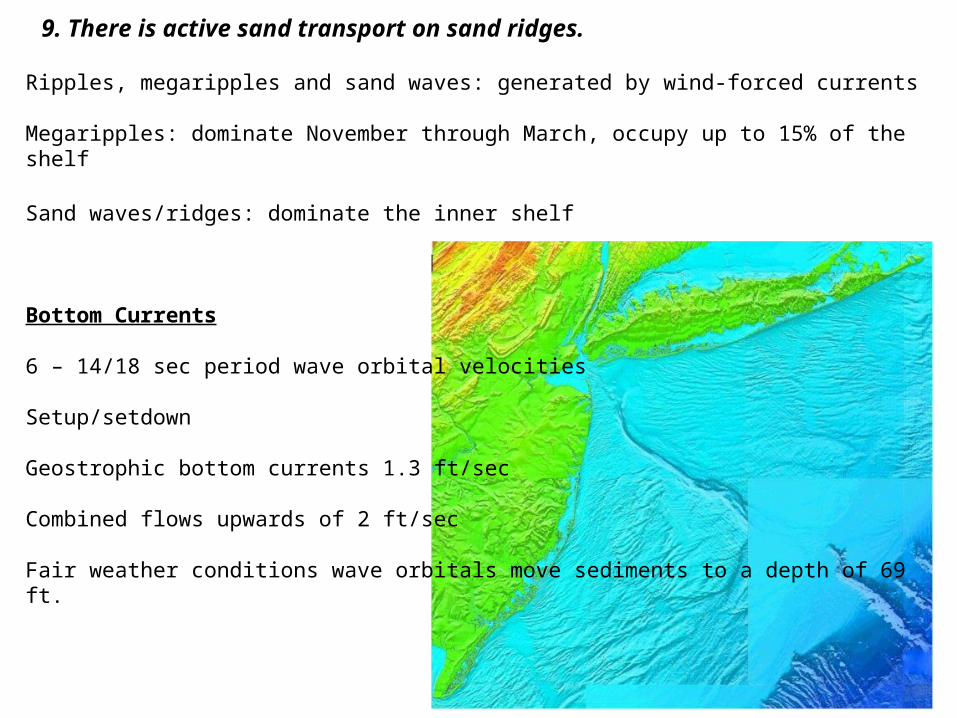
Ripples, megaripples and sand waves: generated by wind-forced currents
Megaripples: dominate November through March, occupy up to 15% of the shelf
Sand waves/ridges: dominate the inner shelf
Bottom Currents
6 – 14/18 sec period wave orbital velocities
Setup/setdown
Geostrophic bottom currents 1.3 ft/sec
Combined flows upwards of 2 ft/sec
Fair weather conditions wave orbitals move sediments to a depth of 69 ft.
9. There is active sand transport on sand ridges.

During large storms sediments (coarse sands) will be transported or stirred through much of the shelf.
Thermal breakdown during winter enhances the movement of sediments on the shelf
Hurricanes are not as critical as noreasters (winter storms) when considering the long term continental shelf transport system.
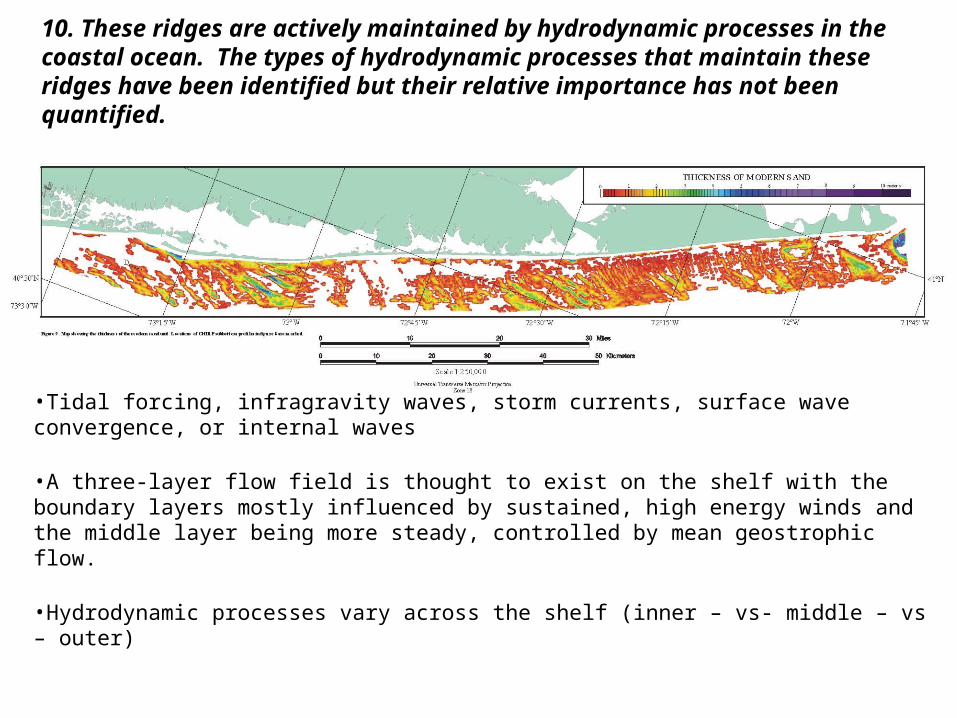
10. These ridges are actively maintained by hydrodynamic processes in the coastal ocean. The types of hydrodynamic processes that maintain these ridges have been identified but their relative importance has not been quantified.
•Tidal forcing, infragravity waves, storm currents, surface wave convergence, or internal waves
•A three-layer flow field is thought to exist on the shelf with the boundary layers mostly influenced by sustained, high energy winds and the middle layer being more steady, controlled by mean geostrophic flow.
•Hydrodynamic processes vary across the shelf (inner – vs- middle – vs – outer)

Spit Building Fire Island Inlet
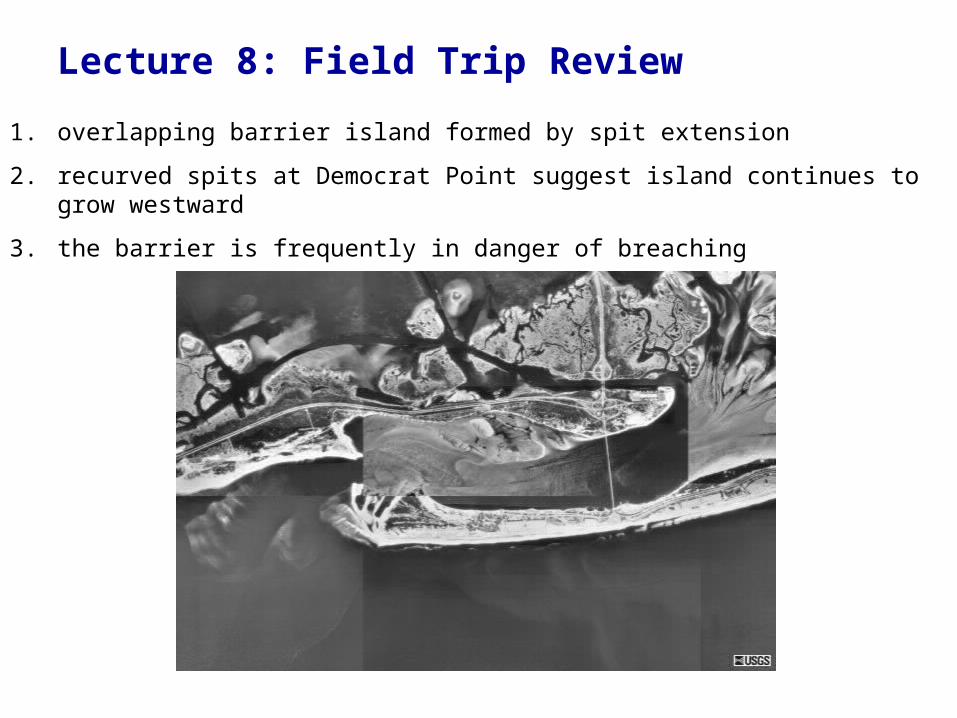
Lecture 8: Field Trip Review
1. overlapping barrier island formed by spit extension
2. recurved spits at Democrat Point suggest island continues to grow westward
3. the barrier is frequently in danger of breaching

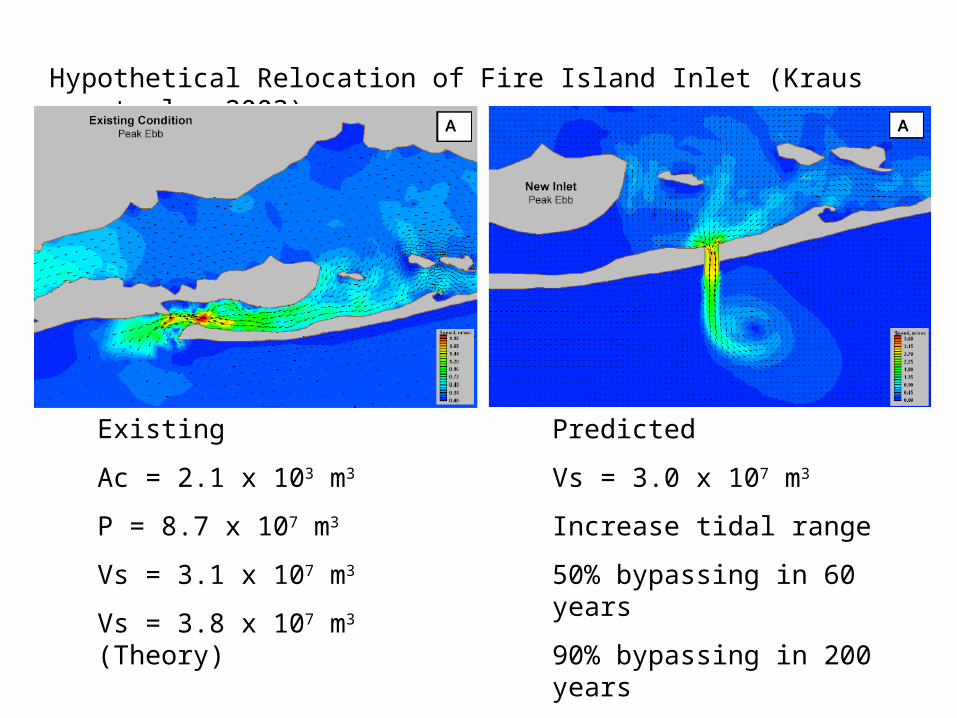
Hypothetical Relocation of Fire Island Inlet (Kraus et.al., 2003)
Present Configuration
1. Navigation Hazard
2. Minimal bypassing to Cedar Beach
3. Requires dredging of 400,000 m3/yr (~5 million dollars annually)

Hypothetical Relocation of Fire Island Inlet (Kraus et.al., 2003)
Proposed Relocation
1. 8 km east of present location (150 m west of Lighthouse)
2. Improve bypassing to Cedar Beach (old ebb shoal feed the downdrift barrier beaches for ~30 years)
3. Improved tidal flushing, reduce dredging requirement
New InletFill Old Inlet
Hypothetical Relocation of Fire Island Inlet (Kraus et.al., 2003)
Existing
Ac = 2.1 x 10³ m3
P = 8.7 x 10⁷ m3
Vs = 3.1 x 10⁷ m3
Vs = 3.8 x 10⁷ m3 (Theory)
Predicted
Vs = 3.0 x 10⁷ m3
Increase tidal range
50% bypassing in 60 years
90% bypassing in 200 years

Benefits and Drawbacks To Relocation ? (Think About)
1. Cross-sectional Area of the channel, tidal prism, tidal range in bay
2. Properties along the bay, potential for flooding
3. Evolution of the ebb and flood shoal, impact on down drift beaches
4. Impacts on biology in the bay, vegetation (ie. Wetlands), fish, and shellfish
5. Economics (charter fishing, state beaches, recreational boaters)
New InletFill Old Inlet
Hypothetical Relocation of Fire Island Inlet (Kraus et.al., 2003)

Why Abundant on Passive Margins?Factors Controlling Observed Water Levels
Fire Island Inlet Field Trip
Water moves to the right of the wind in the northern hemisphere
Volume of water displaced by the wind depends on
1. Wind Velocity
2. Duration
3. Fetch
Wind
Wind directionocean response
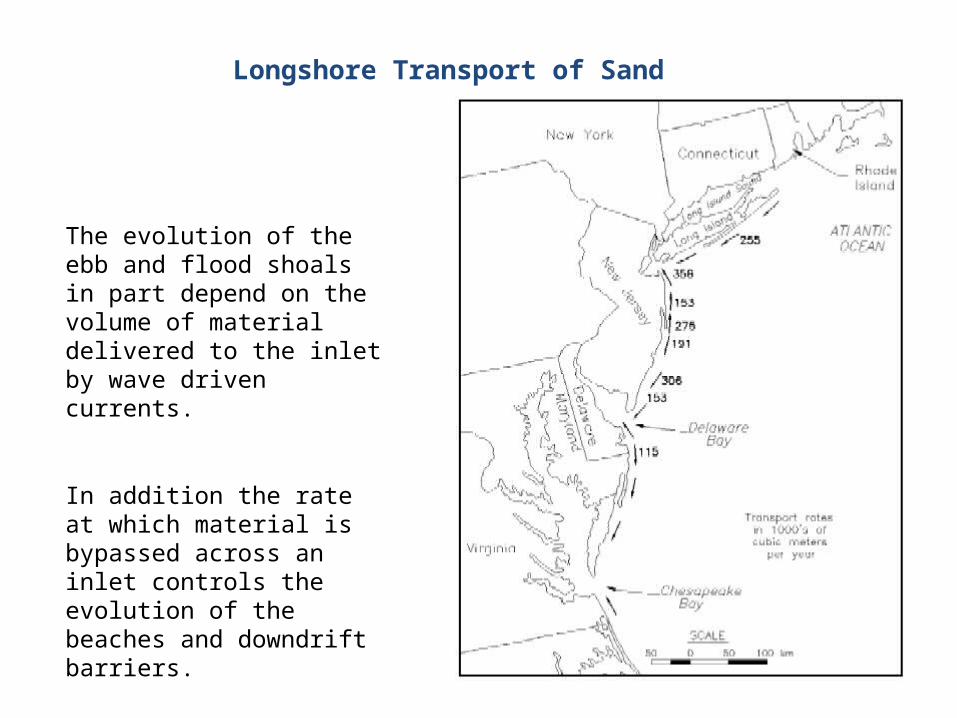
Longshore Transport of Sand
The evolution of the ebb and flood shoals in part depend on the volume of material delivered to the inlet by wave driven currents.
In addition the rate at which material is bypassed across an inlet controls the evolution of the beaches and downdrift barriers.
Regional Sediment Management: Impact of coastal inlets on the littoral transport of sediment
From 1920 to 2000, Long Island’s south-shore beaches have been nourished with over 128 million cubic yards of fill material.
Shore length = 625,370 linear feet (190.6 km)
Nourishment rate = 2.27 yd3/ft/yr (calculated from 1920 to 2000)
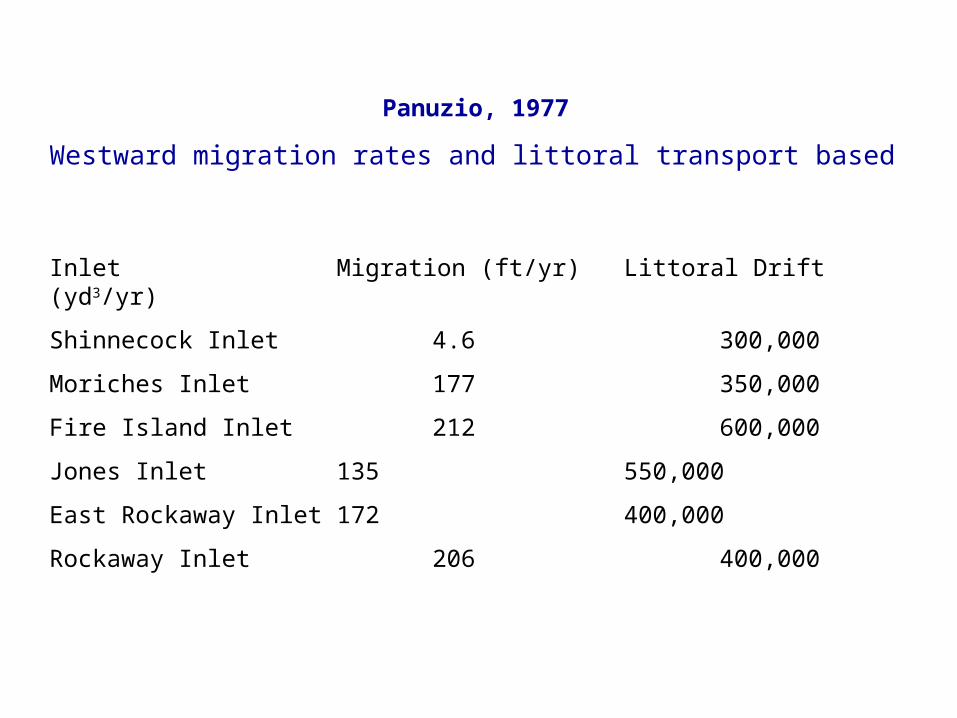
Panuzio, 1977
Westward migration rates and littoral transport based
Inlet Migration (ft/yr)Littoral Drift (yd3/yr)
Shinnecock Inlet 4.6 300,000
Moriches Inlet 177 350,000
Fire Island Inlet 212 600,000
Jones Inlet 135 550,000
East Rockaway Inlet 172 400,000
Rockaway Inlet 206 400,000
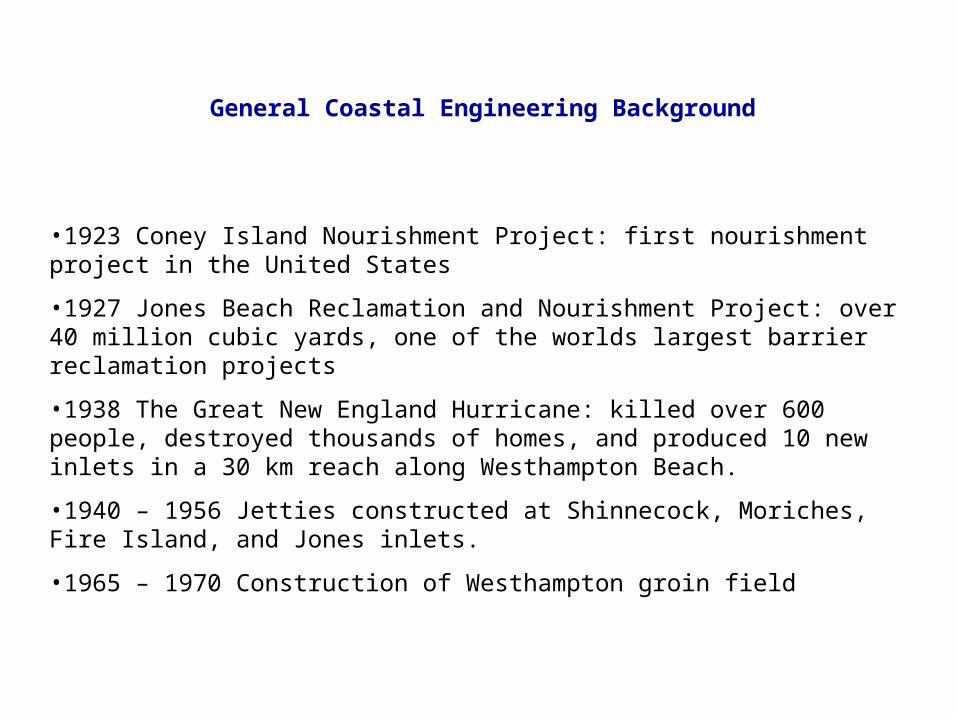
General Coastal Engineering Background
•1923 Coney Island Nourishment Project: first nourishment project in the United States
•1927 Jones Beach Reclamation and Nourishment Project: over 40 million cubic yards, one of the worlds largest barrier reclamation projects
•1938 The Great New England Hurricane: killed over 600 people, destroyed thousands of homes, and produced 10 new inlets in a 30 km reach along Westhampton Beach.
•1940 – 1956 Jetties constructed at Shinnecock, Moriches, Fire Island, and Jones inlets.
•1965 – 1970 Construction of Westhampton groin field

Reach: section of coastline generally constrained by an inlet or change in geologic characteristics
Coney Island
Rockaway
Long Beach
Jones Beach
Fire Island
Westhampton
East Hampton
Montauk

Results By Reach, (Kana 1999)
•Represents 3.7% of the shoreline
•Total of 6.6 million yd3 since the 1920’s or ~3.64 yd3/ft/yr
• ~5.2% of total fill material placed on Atlantic coast of NY
Coney Island
•Represents 8.6% of the shoreline
•Total of 25.7 million yd3 since the 1920’s or ~5.94 yd3/ft/yr
• ~20.2% of total fill material placed on Atlantic coast of NY
Rockaway Beach
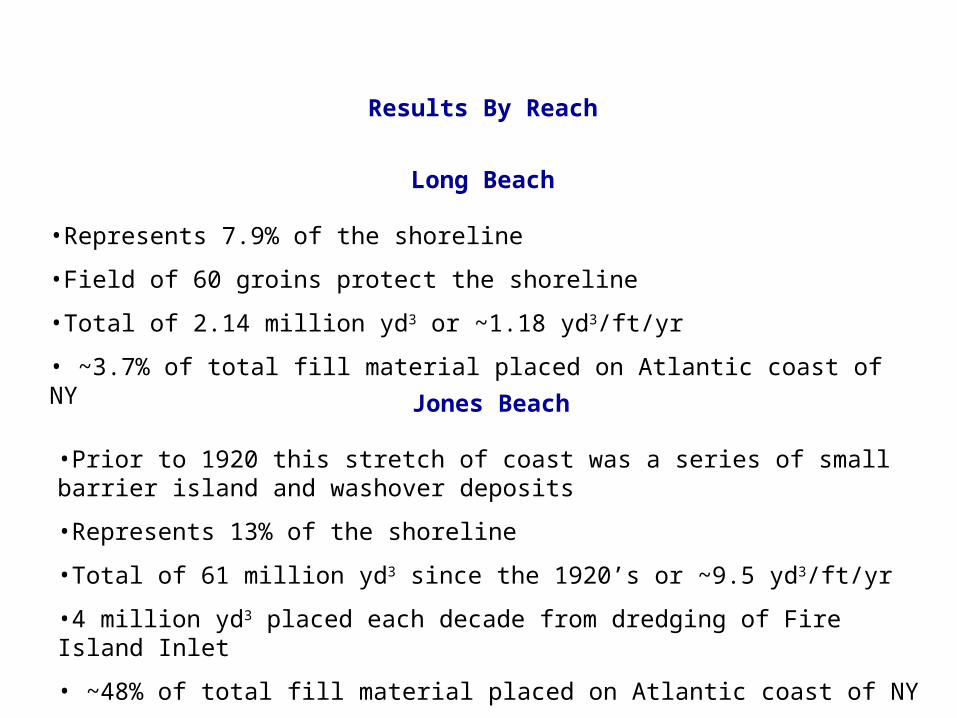
Results By Reach
•Represents 7.9% of the shoreline
•Field of 60 groins protect the shoreline
•Total of 2.14 million yd3 or ~1.18 yd3/ft/yr
• ~3.7% of total fill material placed on Atlantic coast of NY
Long Beach
•Prior to 1920 this stretch of coast was a series of small barrier island and washover deposits
•Represents 13% of the shoreline
•Total of 61 million yd3 since the 1920’s or ~9.5 yd3/ft/yr
•4 million yd3 placed each decade from dredging of Fire Island Inlet
• ~48% of total fill material placed on Atlantic coast of NY
Jones Beach
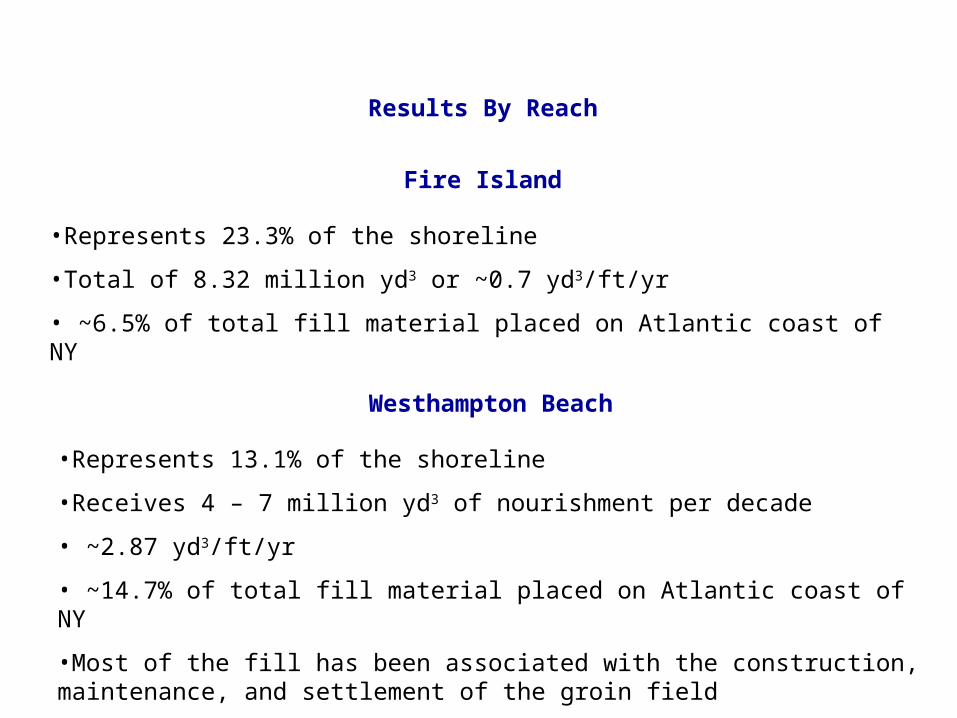
Results By Reach
•Represents 23.3% of the shoreline
•Total of 8.32 million yd3 or ~0.7 yd3/ft/yr
• ~6.5% of total fill material placed on Atlantic coast of NY
Fire Island
•Represents 13.1% of the shoreline
•Receives 4 – 7 million yd3 of nourishment per decade
• ~2.87 yd3/ft/yr
• ~14.7% of total fill material placed on Atlantic coast of NY
•Most of the fill has been associated with the construction, maintenance, and settlement of the groin field
Westhampton Beach

Results By Reach
•Total of 2.9 million yd3 or ~0.33 yd3/ft/yr
• ~2.3% of total fill material placed on Atlantic coast of NY
Easthampton Beaches
•Ronkonkoma terminal moraine abuts the Atlantic Ocean
•Steep coastal bluffs, rocky headlands, gravel beaches
•Considered the initial source of sediment to Long Island south shore
•No recorded nourishment projects
Montauk
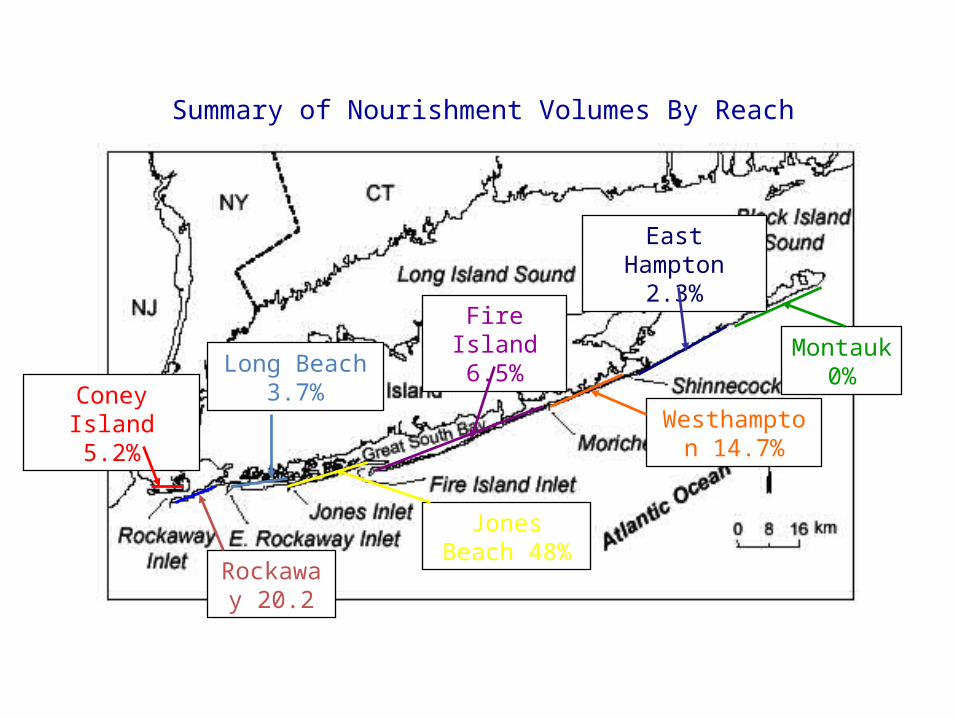
Coney Island 5.2%
Rockaway 20.2
Long Beach 3.7%
Jones Beach 48%
Fire Island 6.5%
Westhampton 14.7%
East Hampton
2.3%
Montauk 0%
Summary of Nourishment Volumes By Reach

Influence of Shelf Width
• Greater shoaling of tidal wave results in increased tidal range from Montauk Point to New York Harbor
•Larger tidal ranges suggest a greater portion of the beach could be impacted by waves
•Larger tidal ranges = increase in frequency of inlets
•Inlets that are not in equilibrium will trap littoral sand and starve the down drift beaches
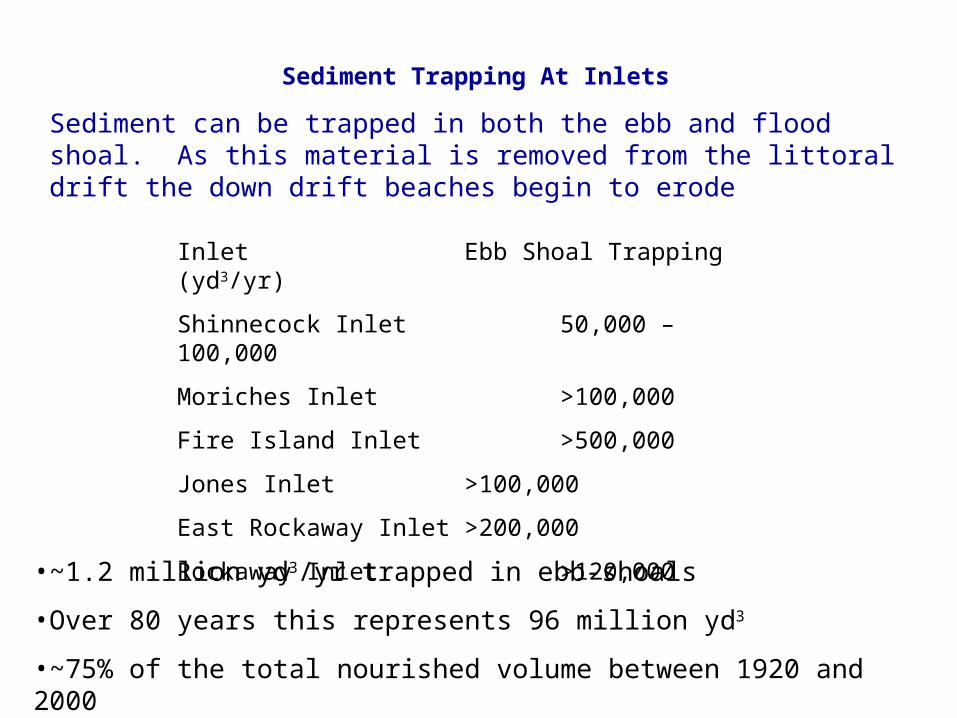
Sediment Trapping At Inlets
Sediment can be trapped in both the ebb and flood shoal. As this material is removed from the littoral drift the down drift beaches begin to erode
Inlet Ebb Shoal Trapping (yd3/yr)
Shinnecock Inlet 50,000 – 100,000
Moriches Inlet >100,000
Fire Island Inlet >500,000
Jones Inlet >100,000
East Rockaway Inlet >200,000
Rockaway Inlet >120,000•~1.2 million yd3/yr trapped in ebb-shoals
•Over 80 years this represents 96 million yd3
•~75% of the total nourished volume between 1920 and 2000

Sediment Trapping At Inlets
VEe = 10.5 x 10⁻⁵ P 1.23 (ft3) VEf = 2.04 x 10 4 P 0.296 (m3)
Inlet Vebb (yd3) Vflood (yd3)
Shinnecock Inlet 15,000,000 4,500,000
Moriches Inlet 21,000,000 4,900,000
Fire Island Inlet 26,000,000 5,100,000
Jones Inlet 20,000,000 4,800,000
East Rockaway Inlet 8,700,000 3,900,000
Rockaway Inlet 62,000,000 6,300,000
Total 154,000,000 30,000,000
•If the entire system was at equilibrium 184 million yd3 of material would be contained in the ebb and flood shoals.