long range alpha long range alpha detection for component monitoring ost/tms id 2382 deactivation...
TRANSCRIPT

DOE/EM-0497
Long Range AlphaDetection for
ComponentMonitoring
Deactivation and DecommissioningFocus Area
Prepared forU.S. Department of Energy
Office of Environmental ManagementOffice of Science and Technology
September 1999

ii
Long Range AlphaDetection for
ComponentMonitoring
OST/TMS ID 2382
Deactivation and DecommissioningFocus Area
Demonstrated at321-M Fuel Fabrication Facility
Savannah River SiteAiken, South Carolina

iii
Purpose of this document
Innovative Technology Summary Reports are designed to provide potential users with theinformation they need to quickly determine whether a technology would apply to a particularenvironmental management problem. They are also designed for readers who may recommendthat a technology be considered by prospective users.
Each report describes a technology, system, or process that has been developed and testedwith funding from DOE’s Office of Science and Technology (OST). A report presents the fullrange of problems that a technology, system, or process will address and its advantages to theDOE cleanup in terms of system performance, cost, and cleanup effectiveness. Most reportsinclude comparisons to baseline technologies as well as other competing technologies.Information about commercial availability and technology readiness for implementation is alsoincluded. Innovative Technology Summary Reports are intended to provide summaryinformation. References for more detailed information are provided in an appendix.
Efforts have been made to provide key data describing the performance, cost, and regulatoryacceptance of the technology. If this information was not available at the time of publication, theomission is noted.
All published Innovative Technology Summary Reports are available on the OST Web site athttp://ost.em.doe.gov under “Publications.”

iv
TABLE OF CONTENTS
1. SUMMARY page 1
2. TECHNOLOGY DESCRIPTION page 6
3. PERFORMANCE page 12
4. TECHNOLOGY APPLICABILITY AND ALTERNATIVES page 16
5. COST page 18
6. REGULATORY AND POLICY ISSUES page 22
7. LESSONS LEARNED page 23
APPENDICES
A. REFERENCES page 25
B. TECHNOLOGY COST COMPARISON page 26
C. TECHNOLOGY ACCURACY/PRECISION DATA page 30
D. IOSENSTM DATA REPORT page 35
E. ACRONYMS AND ABBREVIATIONS page 36
U. S. Department of Energy 1
SECTION 1
SUMMARY
The IonSensTM Cut Pipe Monitor is an application of the Long Range Alpha Detection method ofmeasuring alpha emitting contamination on surfaces of materials. The monitor provides amethod of measuring alpha contamination in areas that are inaccessible to the hand probe andsmear baseline, but accessible to the flow of ambient air. While the costs of surveying itemsusing the baseline technology varies with item complexity and surface area, measurement timeof the IonSensTM system is the same for all items regardless of surface area or complexity.Therefore, the IonSensTM system provides cost savings when monitoring large or complex itemsand multiple items during single measurement cycles. The cost for monitoring a single item withthe IonSensTM monitor was $8.49 versus $3.30 for the baseline. For multiple items, cost savingsbegin with three items per cycle and increase thereafter. The cost drops to $1.70 per item if fiveitems are monitored in a single measurement cycle. Items with surfaces inaccessible to thebaseline technology are normally managed as low level radioactive waste. One measurementcycle, costing approximately $8.49, can preclude the disposal of several cubic feet of waste,which costs $106.00/ft3 (SRS disposal rates).
Technology Summary
Problem
Many items (pipe, tools, fluorescent light bulbs, small equipment, etc.) in contamination areasmay not become contaminated with radioactive materials during their normal use. These itemseventually become low level radioactive waste unless they are proven to be free ofcontamination. For unrestricted release from a contamination area, these items must receiveradiological surveys to prove radioactive contamination is not present on any surface of the item.For items in areas with alpha contamination, this becomes difficult because of the very shortrange and poor penetration of alpha radiation. Contamination on inaccessible surfaces, such asthe internal surfaces of small diameter pipe, cannot be measured, and therefore the surfacescannot be released for recycle or clean landfill disposal.
The Long Range Alpha Detection (LRAD) technology provides an alternative method formeasuring alpha emitting contamination on surfaces that are accessible to ambient air. BNFLInstruments, Inc., developed and produced the IonSensTM monitoring system based on theprinciples of the LRAD technology.
How It Works
When air is exposed to alpha radiation, ionized air molecules are generated. The IonSensTM
system collects the ions on a collector grid and measures the number of ions produced by theradiation. The number of ions produced is proportional to the amount of contamination presenton the monitored surface. The system can measure contamination on any surface that hasaccess to an unrestricted air flow.

2 U. S. Department of Energy
The IonSensTM system consists ofthree basic units: an input filter, acomponent measurement chamber,and a detector unit. Air is drawnthrough the input filter andmeasurement chamber containing thecomponent under inspection by a fanlocated inside the detector unit. Theair passes over the surfaces of thecomponent. Ions produced by anyalpha contamination present are drawninto the collection grid. The resultantvoltage change on the collection grid ismeasured and converted to the amountof contamination on the surface. Theair is expelled through a HEPA filter. Figure 1. IonSens TM Cut Pipe Monitor
A personal computer controls the detector unit and contains software that guides the operatorthrough the system operation. The simple and straightforward operation makes the system easyto use by non-technical personnel. Figure 1 shows the equipment setup for the 321-Mdemonstration.
Potential Markets
The technology has potential for use at any DOE or commercial facility that has alpha producingradionuclides and the need to release suspect contaminated tools and materials.
Advantages Over the Base line
The IonSensTM technology has several advantages over the manual hand probe and smearmethod usually used for free release surveys. Advantages include:
• Cost reduction for free release surveys• Provides measurements on surfaces inaccessible to hand probes and smears• Provides computer printout of measurement data• Near real time analysis and display of contamination levels• Shorter measurement times for large items• Eliminates operator error and inconsistencies associated with baseline
Limitations of the Technology
The technology, as demonstrated, is not effective for the following conditions:
• Beta/gamma contamination• Components with a surface charge, e.g., plastic materials.• Surfaces inaccessible to the free flow of air
The IonSensTM monitoring system is used most effectively in the monitoring of components thatare candidates for unrestricted release and are known to have contamination levels at or belowunrestricted release limits.

U. S. Department of Energy 3
Demonstration Summary
The IonSensTM demonstration was held in the 321-M Fuel Fabrication Facility located at theSavannah River Site (SRS) for total of three weeks during the period October 28, 1998 toJanuary 26,1999. The 321-M facility was used to manufacture fuel and target assemblies forirradiation in the site’s production reactors. The facility was deinventoried in 1995 and theprocess area remains a high contamination area contaminated with highly enriched uranium(HEU).
During operation, many miscellaneous items and components were used in the process area butdid not become contaminated with HEU. These items are potential candidates for recycle orunrestricted release, but must be proven clean before releasing from the contamination area.Since HEU was the only radionuclide used in the 321-M facility, release limits were based onuranium limits of 1000 dpm/100 cm2 (transferable) and 5000 dpm/100 cm2 (total). This level waswell within the minimum detection limits of the IonSensTM monitoring system.
In addition to the technology vendor, BNFL Instruments Ltd, the demonstration participants were:
• WSRC Health Physics Technology• WSRC Radiological Control Operations (RCO)• Facilities Decommissioning Division (FDD)• Savannah River Technology Center (SRTC)
Key results
Based on the amortizement assumptions in Section 5, the cost per hour of operation of theIonSensTM equipment is $12.80, or approximately $0.30 per item. When more than three itemsare monitored in a single measurement cycle, the average cost is lower than the baseline. Singlemeasurements of larger or complex items are normally more cost efficient with the IonSensTM
system.
For pipe and similar tubular items that cannot be surveyed using the baseline, the IonSensTM
system may eliminate the contaminated waste produced by these items. A single measurementcycle costing $8.49 may save several cubic feet of waste costing $106 per cubic foot for disposal(SRS disposal rates).
One health protection technician may operate the IonSensTM system under normal operatingconditions.
The IonSensTM system is best used for monitoring items that are:
• Candidates for free release or clean disposal• Have surfaces that are inaccessible to hand probing and smears• Larger items with complex shapes• Items with surfaces available for free air flow
The IonSensTM system may not be economical for smaller items with surfaces and sizesconducive to hand surveys.
Regulatory/Policy Issues
None.

4 U. S. Department of Energy
Availability
From BNFL Instruments, Inc.
Future Plans
Based on the data collected during the demonstration, the IonSensTM system may be used atSRS for free release of components. Until additional production experience is obtained, 10% ofitems released by the system will be hand surveyed as a verification check. As confidence levelsincrease, the need for hand surveys will be re-evaluated. When operating software is available tomeasure contamination levels approaching plutonium release limits, further evaluation will also bemade.
Contacts
Technical
Jeffrey Lee, Westinghouse Savannah River Company, (803) 725-0652; [email protected]
Cecil May, Westinghouse Savannah River Technology Center, (803) 725-5813;[email protected]
Saleem Salaymeh, Westinghouse Savannah River Technology Center, (803) 725-1628;[email protected]
Vendor
Fred Gardner, BNFL Instruments Inc., (423) 675-4217; [email protected]
Ron Kapaun, BNFL Instruments, Inc., (727) 791-6487
Tony Marlow, BNFL Instruments, Inc., (505) 662-4192
Web Site: http://www.bnfl-instruments.com/
321-M Large-Scale Demonstration and Deployment Project
Martin Salazar, U.S. Department of Energy, Savannah River Operations Office; (803) 557-3617;[email protected]
George Mishra, U.S. Department of Energy, Savannah River Operations Office; (803) 725-7239; [email protected]
John Duda, Federal Energy Technology Center, (304) 285-4217; [email protected]
John Pierpoint, Project Manager, Westinghouse Savannah River Company, (803) 725-0649;[email protected]
Licensing Information
No licensing or permitting activities were required to support this demonstration.

U. S. Department of Energy 5
Web Site
The 321-M LSDDP Internet address is http://www.srs.gov/general/srtech/lstd/index.htm
Other
All published Innovative Technology Summary Reports are available online at http://em-50.em.doe.gov. The Technology Management System, also available through the EM50 Website, provides information about OST programs, technologies, and problems. The OST Referencenumber for Long Range Alpha Detection for Component Monitoring is 2382.
6 U. S. Department of Energy
SECTION 2
TECHNOLOGY DESCRIPTION
Overall Process Definition
Technology Principles of Operation
The demonstration goal was to evaluate the IonSensTM monitoring system technology forreleasing suspected clean items from a contamination area. During the demonstration, data werecollected that could support use of the IonSensTM system as an alternative method for releasingitems as compared to the manual probe and smear method. The probe and smear method isnormally used for free release monitoring at SRS.
The LRAD technology was developed at Los Alamos National Laboratories (LANL) and has beendemonstrated to be a highly sensitive method of measuring alpha activity. Alpha particles arehighly ionizing radiations which lose energy by creating electron/ion pairs in the medium theytraverse. In air they have a very short range of approximately 1.6 in. (4 cm). In most gases anenergy of approximately 35 electron volts is required to produce an electron/ion pair and thus atypical 5,000,000 eV alpha particle will produce around 150,000 ion pairs. These ions can becollected and measured directly as a current of several femtoamperes (10-15 amperes) perbecquerel (Bq).
The ions can be transported over a range of several meters in the air current created by using afan to pass air over the potentially contaminated item to be measured. The air and any ionsproduced are then transported to a collection grid. The ions collected are attracted to the grid byan electrostatic field and cause a small current flow proportional to the alpha activity present onthe item. This method relies on the fact that it takes several seconds for half of the ions in the airto recombine. Contamination in a pipe many meters long can therefore be measured if theairflow is sufficient to transport the ions from the contamination position to the measurement gridwithin this time.
The technique will not work if the item to be measured has a surface charge, e.g. plastic. Thesurface charge will tend to attract ions and thus reduce the measured ionization current. Alphaparticles must be able to escape from where they are emitted into the air, i.e., not covered bypaint, grease or liquid. Alpha particles must also deposit a large fraction of its energy into the air,i.e. cannot be located in very small grooves etc.
System Configuration
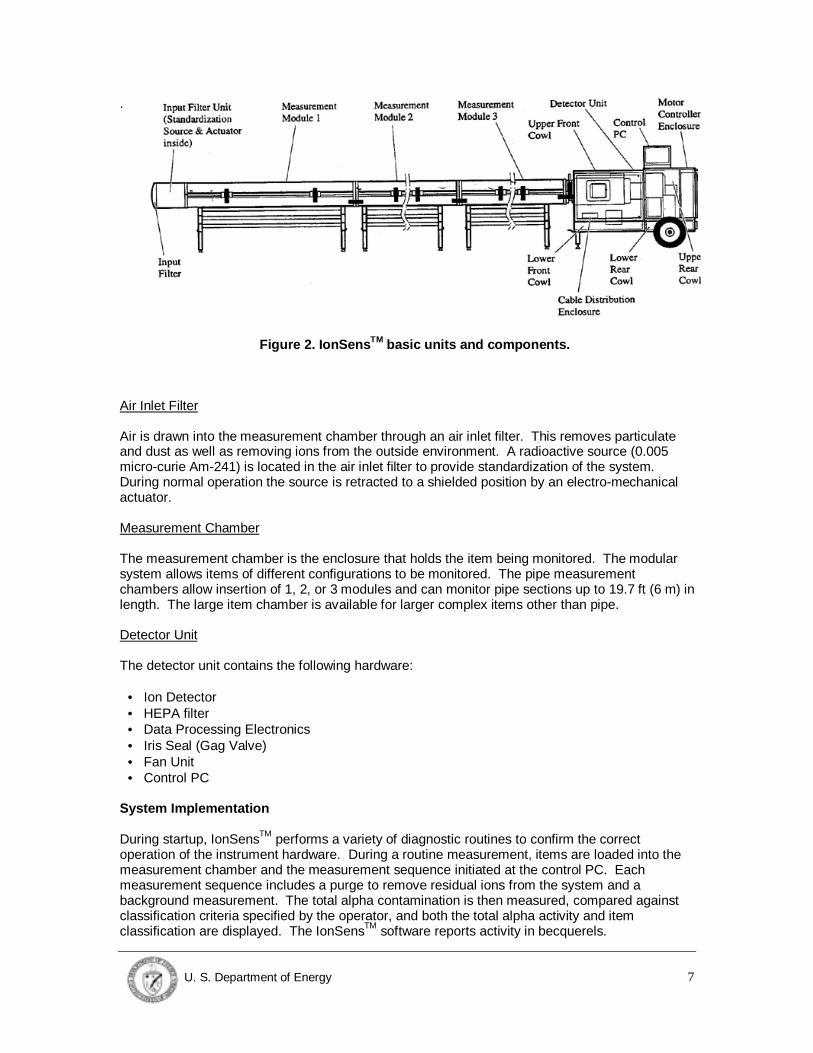
The IonSensTM monitoring system consists of three basic units: (1) input filter; (2) measurementchamber; and (3) detector unit. The units are connected together to form a complete monitoringsystem. The measurement chambers determine the size and shapes of items that can bemonitored. Figure 2 shows a schematic of the system with three 6.6-foot (2 m) pipemeasurement chambers connected to the detector unit.
U. S. Department of Energy 7
.
Figure 2. IonSens TM basic units and components.
Air Inlet Filter
Air is drawn into the measurement chamber through an air inlet filter. This removes particulateand dust as well as removing ions from the outside environment. A radioactive source (0.005micro-curie Am-241) is located in the air inlet filter to provide standardization of the system.During normal operation the source is retracted to a shielded position by an electro-mechanicalactuator.
Measurement Chamber
The measurement chamber is the enclosure that holds the item being monitored. The modularsystem allows items of different configurations to be monitored. The pipe measurementchambers allow insertion of 1, 2, or 3 modules and can monitor pipe sections up to 19.7 ft (6 m) inlength. The large item chamber is available for larger complex items other than pipe.
Detector Unit
The detector unit contains the following hardware:
• Ion Detector• HEPA filter• Data Processing Electronics• Iris Seal (Gag Valve)• Fan Unit• Control PC
System Implementation
During startup, IonSensTM performs a variety of diagnostic routines to confirm the correctoperation of the instrument hardware. During a routine measurement, items are loaded into themeasurement chamber and the measurement sequence initiated at the control PC. Eachmeasurement sequence includes a purge to remove residual ions from the system and abackground measurement. The total alpha contamination is then measured, compared againstclassification criteria specified by the operator, and both the total alpha activity and itemclassification are displayed. The IonSensTM software reports activity in becquerels.

8 U. S. Department of Energy
All measurement data is stored on the PC hard disk and can be cross-referenced to a uniqueserial number or identification of components. A computer printout of measurement dateprovides survey data for items monitored. For measurement cycles with single items, each itemcan be traced to its measurement data. For measurement cycles with multiple items, each lot ofitems can be traced to specific measurement data. See Appendix D for a printout example.
Standardization/Background Measurements
A standardization measurement confirms the correct operability of the instrument hardware.During standardization, the radioactive source in the inlet air filter is exposed while themeasurement chamber is empty and allows the efficiency of the system to be checked. Aninvalid standardization prohibits further item measurements until corrections are made.
A background measurement assures the accuracy and sensitivity of the system by measuring thebackground ionization of the environment surrounding the system. Both environmental conditionsand internal contamination of the instrument may contribute to the background result. If thebackground is above a preset limit, IonSensTM will prevent any further measurements.
Standardization and background measurements are run periodically in the normal operation ofthe system and may be prompted by the system software or initiated by the operator.
Software and Electronics
The operating software runs under Microsoft WindowsTM NT, and is written to provide theoperator with a familiar and user friendly interface. The software includes comprehensive errorhandling functions and diagnostic facilities to aid system maintenance. Password protection isprovided to allow controlled access to system manager functions such as system constants.
Operator Interface
All measurement and control functions are controlled by the operator from the PC. The softwareguides the operator through background, standardization, and item measurement routines;therefore, IonSensTM is easy to use by non-technical personnel. Item measurements are onlyallowed to proceed if IonSensTM has valid background and standardization results, and alldiagnostic checks are satisfactory. The instrument display panel shows the system status.During measurements, the time remaining and instantaneous activities are displayed.
IonSens TM Cut Pipe Monitor and 208 Large Item Monitor
The cut pipe monitor consists of up to three pipe measurement chamber modules connectedtogether for measuring the internal and external surfaces of pipe up to 19.7 ft (6 m) long. Amanually operated iris seal directs the air over both internal and external surfaces or just theinternal surface alone. Measuring the ion current with the iris seal open and then with it closedallows an assessment to be made of the total contamination level plus levels on both internal andexternal surfaces of pipe.
Each pipe chamber module is 6.6 ft (2 m) in length. A cradle system ensures that all pipediameters are held centrally in the chamber. Practical range of diameters run from 2 in. (5 cm) to5 in. (12.7 cm); however, the system can be specially calibrated for pipe with diameters as smallas 0.5 in. (1.3 cm). Only one 6.6-foot (2 m) measurement chamber was used during the 321-Mdemonstration. Figure 1 shows a photograph of the cut pipe monitor used in the demonstration.
The 208 Large Item measurement chamber is available for objects other than pipe. The systemis designed for larger items and can monitor items with dimensions up to 3.3 ft (1 m) x 3.3 ft (1 m)

U. S. Department of Energy 9
x 2.6 ft (0.8 m). A turntable is mounted inside the measurement chamber so items can be rotatedto expose all surfaces to air flow and improve measurement accuracy.
The large item monitor system configuration and operation is basically identical to the pipemonitor. Figure 3 shows a photograph of the large item monitor.
Figure 3. IonSens TM 208 Large Item Monitor
System Operation
System Setup
The setup of the IonSensTM monitoring system is simple and straightforward. The individual unitsare designed to mate together using alignment pins, locating dowels, and latches. Themeasurement chambers are positioned on stands and are designed for straight and leveloperation. Each pipe measurement chamber and stand weighs 99 lbs (45 kg) each and can belifted and positioned by two people. Each stand has four legs with adjustable feet for leveling.
The detector unit weighs 506 lbs (230 kg) and is mounted on two wheels. The unit can be movedby two people using mounted handles on the front top and sides and a wheeled tug handle. Thedetector unit connects to the measurement chambers using alignment pins, holes, and latches.The two legs of the detector unit have adjustable feet for leveling the unit with the measurementchambers.
The system operates on 110 Volts and 10 Amps. The Cut Pipe Monitor does not require anyadditional services for operation. The 208 Large Item Monitor requires a supply of compressedair (100 psi) to operate an internal turntable.
The footprints of the detection unit and measurement chambers are:
One 2-meter pipe measurement chamber 3.3 ft (1 m) x 13.8 ft (4.2 m)Two 2-meter pipe measurement chambers 3.3 ft (1 m) x 20.7 ft (6.3 m)Three 2-meter pipe measurement chambers 3.3 ft (1 m) x 27.5 ft (8.4 m)208 Large Item Monitor 6.9 ft (1.5 m) x 16.4 ft (5 m)

10 U. S. Department of Energy
Operational Information
For the 321-M demonstration, the pipe measurement chamber was located in the ContaminationArea (CA) and the detector unit was in a Radiological Buffer Area (RBA). This setup allowed theoperator to work outside the CA without protective clothing, but required someone in the CA toload and unload the measurement chamber. Under some radiological conditions, the operatormay be able to load, unload, and operate the system. Figures 4 and 5 shows the IonSensTM CutPipe Monitor used for the demonstration.
Figure 4. IonSens TM setup in RBA and CA Figure 5. Loading measurement chamber in CA .
The unit should be setup in an area where contamination is unlikely. Items with loose dust andparticles should be wiped with a clean lint-free cloth before placing in the measurement chamber.The inside surfaces of the measurement chambers are designed for decontamination and areeasily cleaned with wipes and a decontamination solution. Figure 6 shows a typical chamberdecontamination.
Figure 6. Measurement chamber decontamination
The internal surfaces of the detector unit that normally come in contact with contaminated air aredesigned for decontamination. Since the contaminated air passes through a HEPA filter beforeexiting into the unit enclosure, other surfaces and parts inside the unit enclosure should notbecome contaminated during normal operations. However, surfaces within the detector unitenclosure would be very difficult to clean if contaminated. Normal operation and maintenance

U. S. Department of Energy 11
requires opening the enclosure, so it is recommended that the detector unit not be placed in acontamination area.
Contamination can affect both the measurement chamber and the detector unit. A contaminatedmeasurement chamber will cause excessively high background readings and prevent furthermeasurements. Particles that pass into the detector unit may be lodged on the collector platesand cause erroneous readings. The detector unit is easily removed and replaced; however,detector plate decontamination requires more effort. Efficient cleaning of the detector is bestdone using lint-free wipes, clean compressed air, and a decontamination solution that does notleave residues.
Manpower Skills and Training Requirements
The IonSensTM system is relatively simple to operate. Once the material to be monitored isidentified and staged in the area of the equipment, system operation requires an operator andsomeone to load and unload the measurement chamber. In some cases, one person couldoperate, load, and unload the system.
A short training period with the vendor is recommended to become familiar with systemcomponents and software. A few days of on-the-job training on system trouble shooting, routinemaintenance, and system operation should be sufficient. A basic understanding of health physics’practices and personal computers is recommended, but not necessary.
12 U. S. Department of Energy
SECTION 3
PERFORMANCE
Demonstration Plan
The demonstration of the IonSensTM Cut Pipe Monitor was performed using components from thecontamination area in Building 321-M. The following components were monitored during thedemonstration:
• Items with contamination levels <2000 dpm/100 cm2
• Items that are candidates for free release• Radioactive alpha sources with known radiation levels
The contamination levels used for the demonstration were the uranium levels for offsite release ofprocess related materials, tools, and equipment. The limits are:
• 1000 dpm/100 cm2 transferable alpha• 5000 dpm/100 cm2 total alpha
The IonSensTM system measures total alpha contamination and does not determine surface area.For demonstration purposes, 1000 dpm was the release limit regardless of surface area. Anyitem, or batch of items, with total activity level below 1000 dpm was considered for free release.
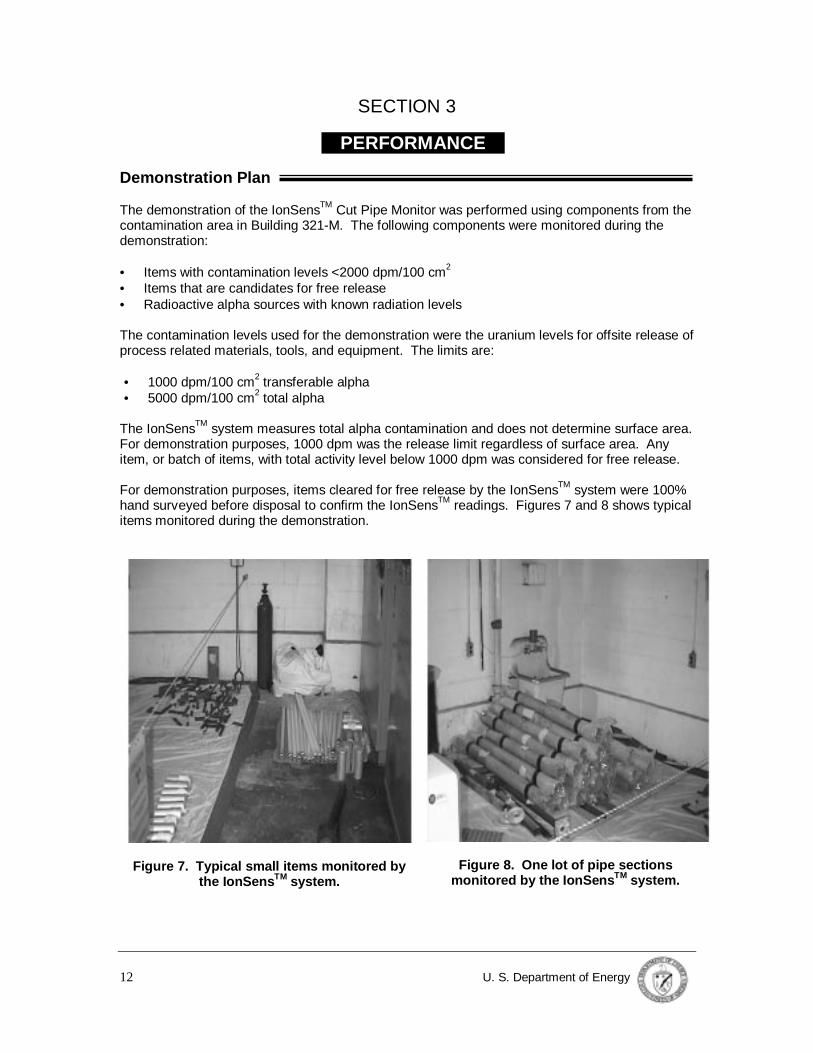
For demonstration purposes, items cleared for free release by the IonSensTM system were 100%hand surveyed before disposal to confirm the IonSensTM readings. Figures 7 and 8 shows typicalitems monitored during the demonstration.
Figure 7. Typical small items monitored bythe IonSens TM system.
Figure 8. One lot of pipe sectionsmonitored by the IonSens TM system.
U. S. Department of Energy 13
Performance Objectives
The primary objective of this demonstration was to evaluate the capabilities and performance ofthe IonSensTM monitoring system. The elements of the demonstration were:
• Evaluate system as an alternative to hand probes and smears for free release surveys• Evaluate capabilities for segregating waste into LLW and clean waste categories• Measure radioactive sources with known radiation levels for accuracy• Free release materials in support of the 321-M Deactivation Project
Results
Approximately 400 items weighing 2000 lbs (909 kg) were monitored by the IonSensTM system.The sizes and shapes of the items varied, but fit into one section of a 6.6-foot (2 m) pipemeasurement chamber. A mesh tray was fabricated to supported items such as hand tools andshort tubular pieces that were too small for the chamber’s support system. Using this setup,multiple items were monitored during a single measurement cycle to increase throughput andefficiency.
Of the 400 items monitored, approximately 300 items, or 1000 lbs (455 kg), were identified forfree release based on uranium free release criteria. The 300 items included approximately 500lbs (227 kg) of lead with contamination levels below free release levels. A manual free releasesurvey confirmed all items released by the IonSensTM system met free release criteria.
The time required for the IonSensTM Cut Pipe Monitor to perform a measurement is 4.3 minutes.Each measurement includes:
• Purge – 60 seconds• Background Measurement – 100 seconds• Measurement of Item – 100 seconds
The purge, background, and measurement times are parameters set by the system software.The operator may change parameters only if a preset password is entered.
Other tasks that are part of the normal operations of the IonSensTM system add to the overallmeasurement cycle time. The following tasks were considered in determining the averagemeasurement cycle time during the demonstration and are included in the total time in Tables 1and 2:
• Daily Start Up• Background measurements• Standardization measurements• Empty chamber measurements• Measurement chamber loading and unloading
Normal maintenance tasks for the equipment during the demonstration consisted of occasionalwipe down of the measurement chambers to remove loose particles. The time involved wasminimal. The detector plate unit was contaminated once during the demonstration. Thetroubleshooting and decontamination time was approximately two hours and was not included indetermining the average times.

14 U. S. Department of Energy
Table 1 represents the average time per item required to monitor items with the IonSensTM
system. Some measurement cycles included multiple items.
Table 1. Average Time Required for Measurements
No. of ItemsNo. of
MeasurementCycles
Multiple or SingleItems/Cycle
Total Time (min)
Average/Item(min)
239 72 Multiple 509 2.1164 164 Single 1095 6.7
Table 2 represents the average time of the measurement cycles during the demonstration. Thetotal time includes tasks for normal daily operations as discussed above.
Table 2. Average Time Per Measurement Cycle
No. of MeasurementCycles
Total Time(min)
Average/Cycle(min)
236 1604 6.8
Table 3 represents the time to perform the baseline probe and smear. All of the itemsrepresented in Table 3 were previously monitored during the IonSensTM demonstration. Nonewere large items and the average time per item should be considered an absolute minimum.
Table 3. Average Time for Baseline Measurements
No. of Items Total Time(min)
Average/Item(min)
132 465 3.5
NOTE: Times include report preparation.
For an overall cost evaluation of the IonSensTM system, the following points must be considered:
• Probe and smear costs are dependent on the size of the item and the rate at which thesurface can be frisked. The measurement time indicated in Table 3 is for small simple itemsthat can be frisked quickly.
• The measurement time of the IonSensTM system is the same for one item or multiple items, orfor a small item or large item, regardless of the configuration or surface area.
• Single item measurement cycles may not appear economical if only the minutes-per-item isconsidered. The IonSensTM system will be the best method for large complex items or itemswith surfaces inaccessible to probe and smear.
• Measurement of multiple items at once will reduce the average time and cost per itemmonitored by the IonSensTM system.
• A small item chamber could be designed especially for small tools and components. Thedesign would increase the number of items that could be monitored in a single measurementcycle, reduce measurement time, and increase sensitivity. This would considerably decreasethe unit costs in Section 5.

U. S. Department of Energy 15
Accuracy and Precision
During the demonstration sources with known activity were monitored to determine the accuracyand precision of the IonSensTM system. National Institute of Standards and Technology (NIST)traceable standards of 500 dpm and 1000 dpm were measured. The sources were placed in themeasurement chamber at the position of the standardization source, or the least sensitivitymeasurement position. The measurement data in Appendix C reflects the data collected fromthese source measurements.
The IonSensTM software reports total activity measurements that include standard deviations toreduce the uncertainty of the measurements. The software is set to report the measured activityplus three standard deviations to increase the confidence level of the total activity reported. (Thesoftware can be changed to add any number of standard deviations.) The added standarddeviations assure the system will overestimate any activity present. This gives confidence thatany item classified for free release is definitely free release.
Based on measurements of known sources and hand surveys of monitored items, the minimumdetection levels of the IonSensTM equipment as setup for the demonstration was approximately500 dpm.
See Appendix C for accuracy and precision calculations and data details.

16 U. S. Department of Energy
SECTION 4
TECHNOLOGY APPLICABILITYAND ALTERNATIVES
Competing Technologies
The hand probe and smear method is normally used for measuring alpha contamination. For thefree release of materials, 100% of surface area must measured with an alpha scintillation probeto determine the total contamination (fixed and transferable). In addition, the surface area mustbe smeared to measure transferable contamination. The smears are counted on a calibrated gasflow proportional counter.
Hand probe and smear method disadvantages:
• Many surfaces are inaccessible to probing and smearing. Due to the short range of alpharadiation, probes must be held extremely close to the surface being scanned for an accuratemeasurement. Both surface configuration and probe size and configuration may limit thesurfaces monitored by the probe and smear method.
• The accuracy is dependent on operator technique. Probe scanning speed and distance tothe surface being scanned determines the accuracy of the method. Sensitivity decreasesmarkedly when scan speed and distance are increased.
• Probing of many items may become tedious and prone to operator error. It may be difficult tomaintain accurate scan speeds and distances after hours of surveying.
Technology Applicability
The IonSensTM system removes the inaccuracies and inconsistencies of probing and smearing.The automated detection process completely eliminates error resulting from operator technique.The detection levels are within the range of the uranium limits identified in Section 3. The limitsfor other transuranic radionuclides are lower and may be below the detection level of the detector.
The IonSensTM monitoring system measures alpha contamination on any surface accessible tothe free flow of air. Measurement times are not dependent on the amount of surface area andare equal for small or large surfaces. A small item [i.e., 2 in. (5 cm) diameter rod, 1 ft (30.5cm) inlength] requires the same measurement time as a 18 in. (45.7 cm) diameter valve body. Themanhours for probes and smears for the valve body would be much longer than those for thesmall rod. In general, the IonSensTM system becomes more economical for larger items, orbatches of small items.
The IonSensTM monitoring system measures the total alpha contamination present on all surfacesof monitored items. The contamination level reported by the software is a total reading and not areading per unit area. Calculations of the surface area of items being monitored must be doneseparately by the operator and is not a capability of the system.
It should be noted that the pipe measurement chambers were designed for pipe sections and notsmall tools and items. A measurement chamber that would give optimum results for multiplesmall items could be designed if needed.

U. S. Department of Energy 17
The IonSensTM monitoring system is most efficient when used for the following purposes:
• Verifying contamination on surfaces inaccessible to hand probing and smearing butaccessible to a free flow of air
• Confirming the lack of contamination on materials that are candidates for free release butmust be proven clean
• Larger items where detailed hand probing and smearing requires additional time and numberof smears.
Patents/Commercialization/Sponsor
The IonSens is based on the "High Gas Flow Alpha Detector" patent (US # >5514872). Thepatent was licensed by LANL to BNFL Instruments (BI) for production of instruments such as theIonSens. Additional patents are pending (both in the US and the abroad) covering the IonSensinstrument itself as well as detector modifications. All of these pending patents are jointapplications between BI and LANL.
The IonSensTM Cut Pipe Monitor and 208 Large Item Monitor are available from BNFLInstruments, Inc.
Other LRAD based methods and equipment are also commercially available.
18 U. S. Department of Energy
SECTION 5
COST
Methodology
This cost analysis compares the innovative Long Range Alpha Detection (LRAD) Technology,used to survey alpha activity, to baseline technologies used for radiological surveying at DOE-Savannah River Site (SRS). The innovative technology was deployed for use in surveying 403items with an approximate total weight of 2000 pounds, for the Large Scale Demonstration andDeployment Project (LSDDP) located at building 321-M. The innovative technology costs arebased on the production rates of tasks observed during the LSDDP, for the LRAD. Cost for thealpha baseline technology is derived from the production rates observed during the LSDDPdemonstration on 132 items. The baseline data were recorded on site during the LSDDP atbuilding 321-M.
The cost analysis considers only purchase of the innovative technology equipment and contractpersonnel performing the demonstration; no training costs were required. The analysis includesmobilization, survey activities and demobilization. Mobilization costs include the cost of movingthe technology equipment to the work area, removing it from shipping crates, installation oftemporary work areas, and equipment setup in the work area. Demobilization includes removalof temporary work areas, decontamination of technology equipment, and disposal of wastesgenerated by removal of temporary work areas. PPE costs include all clothing, equipment, etc.,required for protection of crewmembers during the demonstration. The survey activity costincludes survey of 403 items
Cost Analysis
Data were collected during the demonstration for the cost elements. Survey productivity wasmeasured and unit costs determined on the basis of items surveyed per minute. For eachelement, detailed costs were determined from the data collected. For labor-intensive activities aproduction rate was calculated from the performance data.
Labor rates used in the analysis were those in effect for the SRS site labor agreement at the timeof the data collection. Crew labor rates are shown on Tables B-2 and B-3. Crews for the variousactivities were based on the tasks performed. The labor rates included department overhead, butdid not include site overheads. Engineering, quality assurance, administrative costs and taxeswere also omitted from the analysis. The bare unit costs determined by the analysis can bemodified by adding site specific indirect costs to produce a site-specific unit cost that includesindirect costs.
• Equipment costs were based on the cost of ownership. The IonSensTM Cut Pipe Monitor’scost is $123,000.00. The equipment cost includes the detector, one 2-meter pipemeasurement chamber and stands, and shipping from England . The large item monitor andadditional pipe chambers are extra. No information was collected to determine the projectedtime of use per year. The following assumptions are made to assign equipment cost dollarfigure to the project:
• expected useful life of the new technology equipment is 10 years;• equipment is operated one eight-hour shift per day for 24 weeks a year; and• equipment would be used by numerous projects and thus share the cost over the useful
life of the equipment.

U. S. Department of Energy 19
Based on these assumptions, the extended cost per hour of operation would be $12.80, whichtranslates to an additional equipment cost of approximately $0.30/item to survey.
For each technology, the cost data were entered into an MCACES Gold 5.30 software projectdatabase. Supporting databases for labor, equipment and crews were created for the LRAD.Laborers, equipment pieces and crews were added to these supporting databases. The projectdatabase was priced from the supporting databases. A hard copy of the complete MCACESGold 5.30 cost estimate has been provided to the project via the Detailed Cost Report.
For fixed cost elements (independent of the quantity of characterization work), costs werecalculated as lump sum costs instead of unit costs. Unit cost elements were based on thequantity of characterization work performed.
A comparison of the unit cost elements is shown in Table 4.
Table 4 Summary Unit Cost Comparison
Long Range Alpha Detection(IonSensTM Cut Pipe Monitor)
Probe and Smear Survey(Baseline)
Cost Element Unit Cost ProductionRate
Cost Element Unit Cost ProductionRate
MonitoringSingle Items andReporting
$8.49/cycle 7min/cycle Monitoring andReporting
$3.30/item 3.3 min/item
Multiple Items, 5items per cycle
$1.70/item 7 min/cycle
The cost of performing characterization work was found to be lower on the average for theIonSensTM system than hand probing and smearing for multiple items. It should be noted that thecosts of hand probing and smearing in Table 4 include small items only. Large or complex itemswill require higher costs for hand surveys. IonSensTM measurement times for small, large, ormultiple items are the same regardless of size, shape, or number. Multiple items can be loadedinto the IonSensTM measurement chamber and scanned together, thus lowering the effective costper item. The cost per item for single item measurements may appear more expensive than thebaseline, but the cost of frisking large or complex parts will be higher than indicated while theIonSensTM costs remain the same. The costs for single item measurements must be weighedappropriately. One Health Protection Technician is required both to operate the IonSensTM
system and to perform the baseline method. Hand probing and smearing cannot clear small pipe;this new technology would reduce the contaminated waste, and associated cost, resulting fromthese items.
Figure 9 is a cost comparison for the innovative and the baseline technologies The innovativetechnology (LRAD) costs are based on the purchase of the equipment. The cost of the capitalinvestment will be shared with numerous projects over a ten year service life as detailed in thecost analysis of this report.
20 U. S. Department of Energy
$0.00
$500.00
$1,000.00
$1,500.00
$2,000.00
$2,500.00
$3,000.00
Improved
Baseline
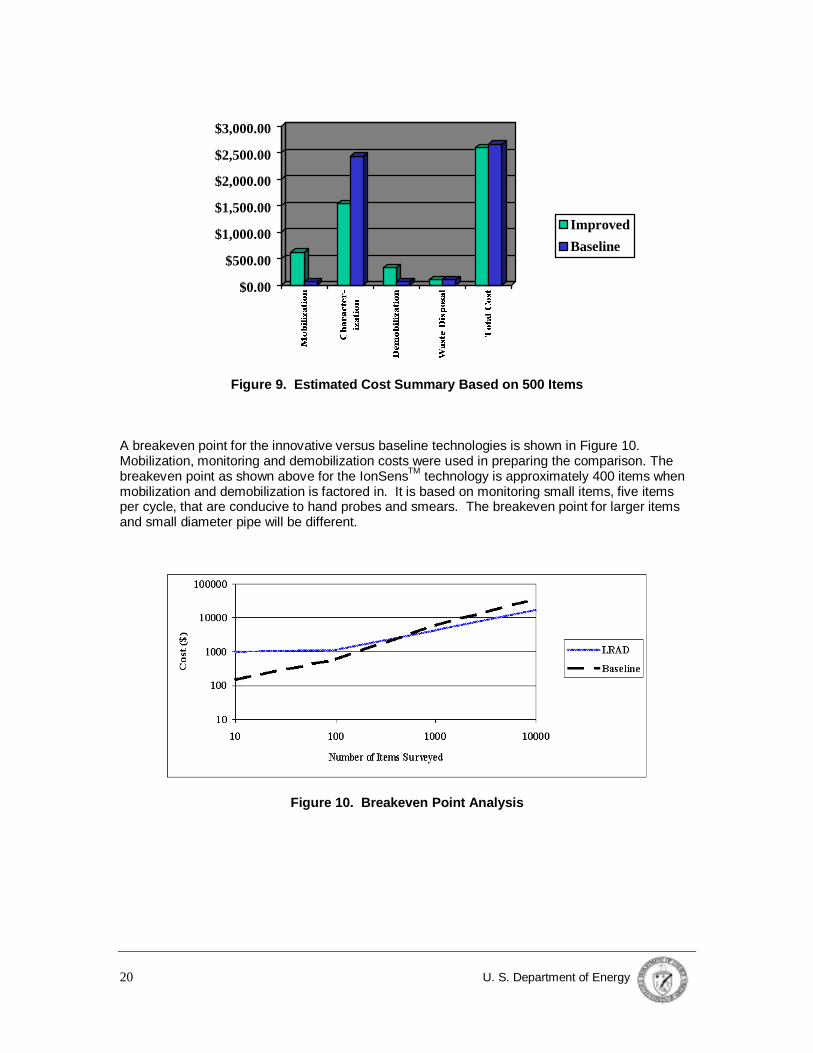
Figure 9. Estimated Cost Summary Based on 500 Items
A breakeven point for the innovative versus baseline technologies is shown in Figure 10.Mobilization, monitoring and demobilization costs were used in preparing the comparison. Thebreakeven point as shown above for the IonSensTM technology is approximately 400 items whenmobilization and demobilization is factored in. It is based on monitoring small items, five itemsper cycle, that are conducive to hand probes and smears. The breakeven point for larger itemsand small diameter pipe will be different.
Figure 10. Breakeven Point Analysis

U. S. Department of Energy 21
Cost Conclusions
The comparative unit costs for the two technologies for the demonstrated application are(excluding mobilization, demobilization and setup):
Table 5 Summary — Cost Conclusions
Labor Cost Equipment Cost Total CostProbe and Smear Method $3.30/Item N/A $3.30/ItemIonSensTM (Bulk Items) $1.40/Item $0.30/Item $1.70/ItemIonSensTM (Single Items) $7.00/Item $1.49/Item $8.49/Item
The innovative technology has a higher production rate than the baseline technology (2.3 timesfaster than manual alpha surveys). The IonSensTM Cut Pipe Monitor offers cost savings over thebaseline alternative for bulk items of characterization work performed during the demonstration.The capital cost of equipment is assumed to be amortized over a ten-year period and adds littlecost to the survey per item (approx. $0.30/item or $1.49 per cycle). The IonSensTM system wasmore costly for equipment, mobilization, and demobilization. The probe and smear method wasless costly for equipment (equipment is included in RCO labor rates) but more costly when bulkcounting of items and when monitoring cut pipe (which cannot be done manually). TheIonSensTM Cut Pipe Monitor would be best suited for clearing pipe and similar tubular items. Notethat the probe and smear method cannot scan and clear pipe. The cost for burial of low levelwaste at SRS is $106.00 per cubic foot. One cubic foot is approximately equal in cost to onemultiple survey by the IonSensTM system. Consequently, the IonSensTM system would bebeneficial in reducing contaminated waste. Cut pipe and similar objects with inaccessible internalvoids could be measured and cleared by the device. If the IonSensTM system was not used, cutpipe would be disposed of by burial and this would be more costly in comparison to theIonSensTM equipment.
The fixed costs for the equipment, mobilization and demobilization were higher for the innovativetechnology, but the cost to survey bulk items is approximately 50% the cost of hand frisking. Thecost to survey a single item with the IonSensTM system may be greater for small items, but thedifference decreases when large items are frisked, which require more time for hand surveying.For those items that can be surveyed with the IonSensTM system but not with the hand probe andsmear method, several cubic feet of LLW may be eliminated with one monitoring cycle. Here,savings are not limited by the production rate but in releasing items that would otherwise beconsidered low level waste.

22 U. S. Department of Energy
SECTION 6
REGULATORY AND POLICY ISSUES
Regulatory Considerations
There are no Comprehensive Environmental Response, Compensation, and Liability Act(CERCLA) or other regulatory considerations related to this technology.
The use of this technology as an alternative to the baseline technology requires approval byresponsible site or facility health physics departments.
Safety Risks, Benefits, and Community Reaction
No issues identified. Additionally, socioeconomic impacts and community perceptions areexpected to be positive, as the technology supports waste minimization and reuse/recycleconcepts.
U. S. Department of Energy 23
SECTION 7
LESSONS LEARNED
Implementation Considerations
The setup and use of the IonSensTM equipment is relatively simple and straightforward. Nospecial services are required for operation. The following should be considered when operatingthe system:
• The IonSensTM system was not designed to measure contamination levels. There is nobenefit of monitoring items with known contamination above release limits. Excessiveamounts of transferable contamination may contaminate the measurement chamber anddetector unit.
• For demonstration purposes, 1000 dpm was the release limit without regard for the surfacearea of components being monitored. The conservative view was that any item, or batch ofitems, with total contamination level less than 1000 dpm was considered clean. Thecontamination was not identified as a point source or uniformly spread over surface area. Forsurface areas larger than 100 cm2, the operator can calculate the surface area and relate to areading per 100 cm2 if desired.
• The location of the measurement chamber and detector during operation should be carefullyconsidered. The detector unit should be located where contamination is unlikely since theoperator will be removing the detector plate assembly for cleaning and decontamination.Decontamination of the inside of the detector unit may be difficult.
• For production operation, an extra detector plate assembly should be available as a spare.The detector plate unit is sensitive to foreign particles (i.e., lint, dust, contamination, etc.).The unit is easily removed and replaced, but may require time to decontaminate. Cleanwipes, decontamination solution, and clean compressed air is recommended for cleaning ofthe unit.
• If multiple items are monitored, only items with a high degree of certainty that nocontamination is present should be monitored. A single contaminated item will reject theentire batch. Then all items will be rejected or each item must be monitored to identify thecontaminated item.
• For items where contamination is highly improbable, it is reasonable and practical to put alarge number of items per batch through the system to reduce the unit cost of measuringsuch items.
• The system will only detect contamination on surfaces exposed to the flowing air in themeasurement chamber. Items may have areas where air flow is interrupted or blocked.Contamination on these areas will not be monitored.
• Radon will effect the sensitivity level of the system. High radon may raise the sensitivityabove acceptable levels. Radon levels did not affect the equipment operation during thedemonstration.
• Depending on the radiological conditions where the system is used, one operator may beable to load, unload, and operate the unit. Two operators were used during thedemonstration because the equipment was located in two differently classified radiologicalareas.

24 U. S. Department of Energy
Technology Limitations and Needs for Future Development
Limitations of the IonSensTM monitoring are:
• The IonSensTM system measures total contamination on surfaces being monitored. Thesurface area must be calculated by the operator.
• The minimum sensitivity level may not be low enough for some of the transuranicradionuclides release limits.
• Materials with surface charges, such as plastics, tend to attract ions and thus reduce themeasured ionization current.
• Alpha particles will not penetrate paint, grease, or liquid. Items should be free of thesematerials before monitoring.
• The Cut Pipe Monitor and 208 Large item monitor were not designed to monitor multiplesmall items and may not give the sensitivity levels required for these items. A small itemmeasurement chamber that would reduce cycle time and improve sensitivity levels can bedesigned for small multiple items.
Technology Selection Considerations
It may not be economical to monitor any and all items with the IonSensTM system. The technologywas designed as a tool for free releasing materials from contamination areas. The system worksbest on materials with areas inaccessible to hand probes and smears or large items where thebaseline technology may require an excessive amount time for each item.

U. S. Department of Energy 25
APPENDIX A
REFERENCES
C. Luff, T. Dockray, A. Messenger, and D.W. Macarthur, Free Release Monitoring of Pipes andDucts, Proceedings of WM'97, Tucson AZ, March 2-6 1997.
D. W. Macarthur, K. S. Allander, J. A. Bounds, and J. L. McAtee, LRAD-Based ContaminationMonitoring of Personnel and Equipment, Nuclear Technology v. 102, p. 270 (1993).
D. W. Macarthur, K. S. Allander, J. A. Bounds, K. B. Butterfield, and J. L. McAtee, Long-RangeAlpha Detector, Health Physics, Volume 63, Number 3, Page 324 (1992).
D. W. Macarthur, K. S. Allander, J. A. Bounds, and K. B. Butterfield, Small Long-Range AlphaDetector (LRAD) with Computer Readout, Los Alamos National Laboratory publication LA-12199-MS (1991).
D. W. Macarthur, K. S. Allander, J. A. Bounds, K. E. Koster, M. Rawool-Sullivan, and S. Rojas,Alpha Detection for D&D: Results and Possibilities, Proceedings of ER'95, Denver, CO, August14-17, 1995.
D. W. Macarthur, K. S. Allander, J. A. Bounds, M. M. Catlett, R. W. Caress, and D. A. Rutherford,Alpha Contamination Monitoring of Surfaces, Objects, and Enclosed Areas, IEEE Transactionson Nuclear Science, Volume 40, Number 4, Page 840 (1993) .
D. W. Macarthur, K. S. Allander, J. Koster, M. Rawool-Sullivan, S. Rojas, and L. Sprouse, AlphaDetection for Characterization of D&D Sites, Proceedings of the ANS Embedded TopicalSymposium on DDER, November 1994.
D. W. Macarthur, M. Rawool-Sullivan and T. Dockray, Detection of Alpha Contamination insidePipes, Proceedings of WM'96, Tucson AZ, Feb 25-29 1996.
D.W. Macarthur, R.D. Gunn, T. Dockray, C. Luff, and F. Gardner, Unrestricted ReleaseMeasurements with Ambient Air Ionization Monitors, Proceedings of WM'99, Tucson AZ, 1-5March 1999.
M. Rawool-Sullivan, K. S. Allander, J. A. Bounds, J. E. Koster, D. W. Macarthur, L. L. Sprouse, D.Stout, J. A. Vaccarella, and T. Q. Vu, Characterization of a D&D Site Using Long-Range AlphaDetectors, Proceedings of the ANS Embedded Topical Symposium on DDER, November 1994.
R. W. Caress, K. S. Allander, J. A. Bounds, M. M. Catlett, and D. W. Macarthur, LRAD- BasedAirflow Monitors, Los Alamos National Laboratory publication LA-12742-MS, March 1994.
S. P. Rojas, M. W. Rawool-Sullivan, K. G. Williams, and J. A. Vaccarella, Alpha CharacterizationInside Pipes Using Ion Transport Technology, Proceedings of WM'95, Tucson AZ, Feb. 26 -March 2, 1995.
T. W. Coffield, Solid Waste – Generator Services, WSRC; telecon with Cecil May, June, 1999.
Westinghouse Savannah River Company, 321-M Large Scale Demonstration and DeploymentProject, Demonstration Test Plan, IonSensTM Cut Pipe and 208 Large Item Monitor.

26 U. S. Department of Energy
APPENDIX B
TECHNOLOGY COST COMPARISON
This cost analysis provides a comparison of the IonSensTM Cut Pipe Monitor innovativetechnology to the baseline technology of manual probe and smear. The costs involved in thedemonstration were evaluated to provide realistic costs of both baseline and innovativetechnologies and are tabulated in Tables B-2 and B-3.
The following assumptions were used in the this cost analysis:
• No engineering, quality assurance, or administrative costs were included.
• The IonSensTM equipment cost includes shipping costs from England, but does not includeany procurement or material surcharges.
• Labor rates used in the cost analysis include SRS department overhead; however, do notinclude site G&A.
• A 10-hour day, four-day week was used during the demonstration.
Improved Technology IonSens TM Cut Pipe Monitor
MOBILIZATION (WBS 331.01)
Move Equipment to Work Area: Includes unloading equipment from truck and moving boxedequipment to work area with a fork lift.
Remove Equipment from Boxes: Includes removing equipment from boxes and installingmeasurement chamber on its support stand.
Setup Equipment in CA: Includes expansion of the CA as a work location for the equipment,and moving equipment into the CA.
Calibrate Detector: Includes initial standardization, calibration, and background runs.
DECONTAMINATION AND DISMANTLING ACTIVITY (WBS 331.17)
Identify/Survey Items: Includes initial identification of items that are candidates for free releasesurveys.
Stage Items to Monitor: Includes moving items to an area adjacent to the measurementchamber for convenience of loading and unloading the chamber.
Monitor Staged Items, Load, and Unload Chamber: Includes loading measurement chamber,monitoring items, unloading chamber, placing items in area marked for disposition, and dataloading for reports.
Monitor Known Sources, Gather Support Data: Includes additional monitoring of knownsources, standardizations, backgrounds, and other data collection to verify and supportacceptance of the technology.
Disposal of Material: Includes the movement of monitored items to disposal area or placing inwaste containers.

U. S. Department of Energy 27
Don/Removal of PPE: Includes the time for workers to don and remove PPE and the total costof PPE for the duration of the demonstration. Daily material costs for PPE for one worker at SRSare shown in Table B-1.
Table B-1 Daily Personnel Protective Equipment (PPE)
Description Cost each Time Used No. Used per day Cost Per DayBooties $1.00 2 $2.00Coveralls $5.00 2 $10.00Gloves $1.50 4 $6.00Glove Liners $0.30 2 $0.60Rubber Overshoes $2.00 2 $4.00
Total $22.60
DEMOBILIZATION (WBS 331.21)
Remove Equipment from CA, Wipe Down: Includes the removal of the measurement chamberand stand from the CA. Before removal from the CA, the equipment must be surveyed anddecontaminated if necessary. The decontamination of the internal surfaces of the detector unitexposed to contaminated air is included in this activity.
Survey Equipment for Release: Includes the time of RCO to perform free release surveys forremoval of equipment from the contaminated area.
WASTE DISPOSAL (WBS 331.18)
Waste Disposal: Includes the disposal of LLW waste created by the use of the innovativetechnoloogy.

28 U. S. Department of Energy
Table B-2. Improved IonSens TM Technology Cost Summary
Baseline Technology – Hand Probe and S mear
MOBILIZATION (WBS 331.01)
Prepare Instruments/Mobilize to Work Area: Includes daily calibration check of instrumentsand moving to work area.
DECONTAMINATION & DISMANTLING ACTIVITY (WBS 331.17)
Identify/Survey Items: Includes initial identification of items that are candidates for free releasesurveys.
Stage Items for Monitoring: Includes moving items to an area suitable for final free releasesurveys.
Survey Staged Items: Includes the hand probing and smearing of items.
Count Smears/Prepare Reports: Includes the counting of the smears taken during the surveysand preparing the final reports of the surveys.
Disposal of Material: Includes the movement of monitored items to disposal area or placing inwaste containers.
Work Breakdown Structure (WBS) Total UC Other
Total Quanity
(TQ)Unit of
Measure Total Cost (TC) Crew Comments
Hrs Rate Hrs Rate
$ 643.90 Move Equipment to work Area 1 $ 128.00 1 $ 6.55 $ 134.55 1 LS $ 134.55
I Forklift Operator, 2 Shop Mechanic
Remove equipment from 2 $ 188.00 $ 376.00 1 LS $ 376.00 3 Mechanics, 1 HP Tech.
Set up Equipment in CA
0.5 $ 146.69 $ 73.35 1 LS $ 73.35 2 Mechanic and 1 HP Tech.
Calibrate Detector 1 $ 60.00 $ 60.00 1 LS $ 60.00 1 HP Tech
$ 2,940.94 Identify / Survey items
4 $ 103.35 $ 458.60 $ 45.20 1 LS $ 458.60 1 Mechanic, 1 HP Tech.Other Rate is PPE, $22.60/day
Stage Items to Monitor
1 $ 43.34 $ 43.34 $ 22.60 1 LS $ 65.94 1 Mechanic Other Rate is PPE, 22.60/day
Monitor staged items, load and unload chamber 0.023 $ 60.00 0.023 $ 12.80 $ 1.70 403 EA $ 683.58 1 HP Tech
Monitor known sources, gather support data 10.6 $ 60.00 10.6 $ 12.80 $ 771.68 1 LS $ 771.68 1 HP Tech
Disposal of Material 1 $ 43.34 $ 43.34 1 LS $ 43.34 1 Mechanic
Don/Removal of Personal Protective
( )0.8 $ 60.00 $ 48.00 $ 22.60 13 Day $ 917.80 1 HP Tech
Other Rate is PPE, $22.60/day
$ 322.66
Remove equipment from CA, Wipe down, 1 $ 144.66 $ 210.66 $ 66.00 1 LS $ 210.66 1 HP Tech., 2 Mechanics
Other Rate is PPE, $22.60/day
Survey Equipment for release 1.5 $ 60.00 $ 112.00 $ 22.00 1 LS $ 112.00 1 HP Tech.
Other Rate is PPE, $22.60/day
$ 106.00 Waste Disposal $ 106.00 $ 106.00 1 cu ft $ 106.00
$ 4,013.50
NOTES
5. The Table B-1 was generated based on collected data during site demonstration. The data was evaluated and collected to give a good representation of a actual costs for a project.
6. Unit cost and hours for monitoring items are based on 5 items/cycle. The number of items monitored per cycle during the demonstration varied.
Unit Cost (UC)
Labor E quipment
Mobilization (WBS 331.01)
Decontamination & Dismantling Activity (WBS 331.17)
Demobliziation (WBS 331.21)
Waste Disposal (WBS 331.18)
Total Cost For The Demonstration
4. One HP Technician can operate the IonSens Equipment, during the initial demonstration one HP Tech., one mechanic and one vendor supplied technician were used. To keep cost realistic one HP Tech was used in the cost report.
1. TC = UC X TQ (where TC = total cost, UC = unit cost, and TQ = total quanity), LS = Lump Sum
2. Labor Rates ar $23.40/hr for Laborer, $43.34/hr for Mechanic, $33.60 Forklift Operator, $60.00/hr for Health Protection (HP) Technician
3. Equipment rates are $12.80/hr for the IonSens equipment, $6.55/hr for 6000# Forklift
U. S. Department of Energy 29
Don/Removal of PPE’s: Includes the time for workers to don and remove PPE’s and the totalcost of PPE’s.
DEMOBILIZATION (WBS 331.21)
Clear Instruments from Area: Includes probing, smearing, and counting of smears required toremove instruments from the contamination area.
WASTE DISPOSAL (WBS 331.18)
Waste Disposal: Includes the disposal of LLW created by the use of the baseline technology.
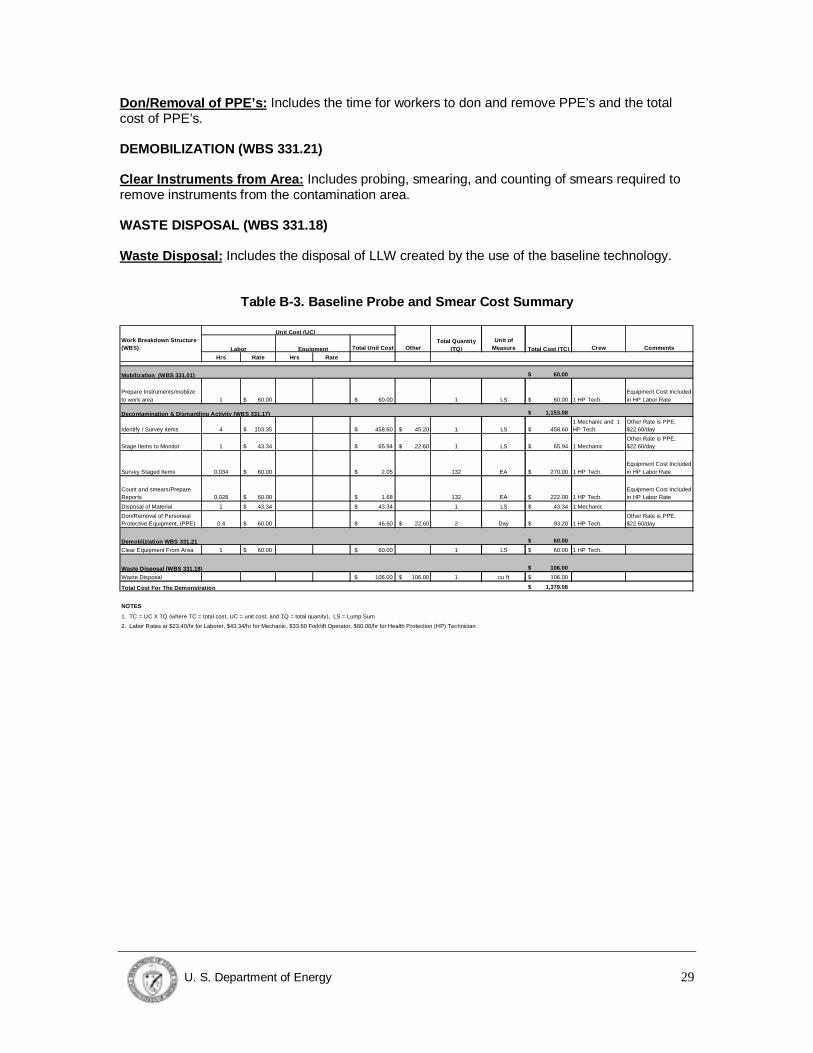
Table B-3. Baseline Probe and Smear Cost Summary
Work Breakdown Structure (WBS) Total Unit Cost Other
Unit of Measure Crew Comments
Hrs Rate Hrs Rate
$ 60.00
Prepare Instruments/moblize to work area 1 $ 60.00 $ 60.00 1 LS $ 60.00 1 HP Tech.
Equipment Cost Included in HP Labor Rate
$ 1,153.08
Identify / Survey items 4 $ 103.35 $ 458.60 $ 45.20 1 LS $ 458.60 1 Mechanic and 1 HP Tech.
Other Rate is PPE, $22.60/day
Stage Items to Monitor 1 $ 43.34 $ 65.94 $ 22.60 1 LS $ 65.94 1 Mechanic Other Rate is PPE, $22.60/day
Survey Staged Items 0.034 $ 60.00 $ 2.05 132 EA $ 270.00 1 HP Tech.Equipment Cost Included in HP Labor Rate
Count and smears/Prepare Reports 0.028 $ 60.00 $ 1.68 132 EA $ 222.00 1 HP Tech.
Equipment Cost Included in HP Labor Rate
Disposal of Material 1 $ 43.34 $ 43.34 1 LS $ 43.34 1 Mechanic
Don/Removal of Personeal Protective Equipment, (PPE) 0.4 $ 60.00 $ 46.60 $ 22.60 2 Day $ 93.20 1 HP Tech.
Other Rate is PPE, $22.60/day
$ 60.00
Clear Equipment From Area 1 $ 60.00 $ 60.00 1 LS $ 60.00 1 HP Tech.
$ 106.00
Waste Disposal $ 106.00 $ 106.00 1 cu ft $ 106.00
$ 1,379.08
NOTES
Waste Dis posal (WBS 331.18)
Total Cost For The Demonstration
1. TC = UC X TQ (where TC = total cost, UC = unit cost, and TQ = total quanity), LS = Lump Sum
2. Labor Rates ar $23.40/hr for Laborer, $43.34/hr for Mechanic, $33.60 Forklift Operator, $60.00/hr for Health Protection (HP) Technician
Total Cost (TC)
Mobilization (WBS 331.01)
Decontamination & Dismantlin g Activit y (WBS 331.17)
Demobliziation WBS 331.21
Labor E quipment
Unit Cost (UC)
Total Quantity (TQ)

30 U. S. Department of Energy
APPENDIX C
TECHNOLOGY ACCURACY/PRECISIONDATA
Precision and Accuracy
National Institute of Standards and Technology traceable standards with known alphaactivity were used to determine the precision and accuracy of the IonSensTM system.Table C-1 shows the results obtained from measuring a 500 dpm standard as themeasured activity in dpm with no uncertainty, the percent difference from the value of thestandard, and the upper activity limit including 3 σ uncertainty. Table C-2 shows theresults obtained from measuring a 1000 dpm standard as the measured activity in dpmwith no uncertainty, the percent difference from the value of the standard, and the upperactivity limit including 3 σ uncertainty.
The precision of the system is expressed in terms of Percent Relative Standard Deviation(%RSD) and its accuracy is expressed in terms of average percent difference (%Diff) fromthe original value of the standard. The precision of the system ranged between 13.17 and24.36 for results obtained from the 1000 dpm and the 500 dpm standards respectively.The accuracy of the system is expressed in terms of average percent difference (%Diff)from the original value of the standard. The accuracy of the system ranged between 5.97and 19.25 for results obtained from the 1000 dpm and the 500 dpm standardsrespectively. Table C-3, shows statistical parameters calculated for both standards. Forthe 500 dpm standard, the average measured activity was 596.25 dpm with a standarddeviation of 145.27, an average percent difference of 19.25, and a percent relativestandard deviation of 24.36. For the 1000 dpm standard, the average measured activitywas 1059.65 dpm with a standard deviation of 139.58, an average percent difference of5.97, and a percent relative standard deviation of 13.17.
Overall, the pooled standard deviation for the system is 141.57 and the overall average percentdifference is 12.61. The average percent relative standard deviation for the system is 18.77.
Table C-1. Results Obtained From Measuring a 500dpm Standard.
Measurementnumber using a500dpm source
MeasuredActivity in
(dpm)
Upper ActivityLimit at 3 σ
confidence level
PercentDifference
Meas 23 463 840 -7.4Meas 37 503 1020 0.6Meas 38 625 1140 25Meas 39 530 1140 6Meas 40 468 1020 -6.4Meas 41 494 960 -1.2Meas 42 845 1440 69Meas 43 548 1080 9.6Meas 44 842 1320 68.4Meas 45 736 1260 47.2Meas 46 505 1020 1

U. S. Department of Energy 31
Table C-2. Results obtained from measuring a 1000dpm standard.
Measurementnumber using a1000dpm source
MeasuredActivity(dpm)
Upper ActivityLimit at 3 σ
confidence level
PercentDifference
Meas 27 946 1500 -5.4Meas 28 888 1500 -11.2Meas 29 930 1440 -7Meas 30 927 1440 -7.3Meas 31 1011 1620 1.1Meas 32 917 1380 -8.3Meas 33 1076 1560 7.6Meas 34 1081 1620 8.1Meas 35 1088 1620 8.8Meas 36 898 1500 -10.2Meas 75 924 1440 -7.6Meas 76 1027 1500 2.7Meas 77 1347 1740 34.7Meas 78 1180 1740 18Meas 79 1210 1680 21Meas 80 1202 1860 20.2Meas 81 1260 1740 26Meas 82 1256 1800 25.6Meas 83 997 1440 -0.3Meas 84 1028 1500 2.8
Table C-3. Statistical parameters calculated for both standards
Standard(dpm)
Averagemeasured
Activity
StandardDeviation
AveragePercent
Difference
%RSD
500 596.27 145.27 19.25 24.361000 1059.65 139.58 5.97 13.17
Average N/A 141.57* 12.61 18.77
* pooled standard deviation

32 U. S. Department of Energy
Figure C-1. Precision control chart for the 500 dpm standard
Figure C-2. Precision control chart for the 1000 dpm standard
0
100
200
300
400
500
600
700
800
900
1000
0 2 4 6 8 10 12
Measurement Number
dpm
UCL
LCL
STD
0
200
400
600
800
1000
1200
1400
1600
0 5 10 15 20 25
Measurement Number
dpm
UCL
LCL
STD

U. S. Department of Energy 33
Limit of Detection
The limit of detection (LOD) depends on the background fluctuations and the efficiency (Eff) ofthe detector. For the IonSens Pipe Monitor, this is calculated as follows:
EffnLOD Bσ
2= ,
Where n is the number of standard deviations used, σB is the standard deviation of thebackground determined during the background measurement routine, and Eff is theefficiency factor of the detector determined during the standardization routine.
The standard error on a measurement is calculated from:
22
+
=
EffEffMB
T
σσσ
Where σM is the standard error on the measurement. If we put a completely clean objectinto the device,
σM = σB,
Simplifying the equation to:
EffB
T
σσ 2=
The total activity is calculated as
σnEff
BMT +−=
Where Μ is the mean of the electrometer readings during a measurement and Β is themean of the electrometer readings during a background measurement.
Given that nσT = LOD, and that Μ-Β is constrained to positive values, it is clear that forsamples which are essentially exempt from any contamination, the system can only reporta figure for total activity which is at or above the LOD.
The number of standard deviations, n, used in these calculations is a maintainableconstant. It was set at 3 during the IonSens demonstration.

34 U. S. Department of Energy
Measurement of Contaminated Pieces
In a real measurement the error on the activity is calculated using the full equation
22
+
=
EffEffMB
T
σσσ
And the total activity is thus given by
TnEff
BMT σ+−=
The activity displayed by the instrument is therefore an upper limit on the possible activity on theitem.
A further cause of a difference between the measured activity and the actual activity is thegeometrical uncertainty. The instrument is calibrated as if the activity in the chamber were at theposition of the standardization source, the least sensitive measurement position. This is becausethe instrument cannot give the position of the activity so we have to assume it is located in theworst measurement position.
Therefore we would expect the system to overestimate the activity present. This givesconfidence that any item classified as suitable for free release is definitely free release.

U. S. Department of Energy 35
APPENDIX D
IONSENSTM DATA REPORT
Pipe Serial Number meas 12Date And Time 09:21:07 03/11/98Measurement Type Dual SurfaceVoltage Mean 0.0310066067442602Voltage Stand Error 0.00113329131293443Total Activity 12.6772298198196Total Activity Stand Error 4.72173348597516External Activity 0External Activity Stand Error 0Internal Activity 0Internal Activity Stand Error 0Activity No Stnd Err 3Number of Modules 1Classification UnclassifiedPCM/Normal NormalBack Date And Time 09:06:25 03/11/98Stand Date And Time 09:09:30 03/11/98
Pipe Serial Number meas 13Date And Time 09:26:34 03/11/98Measurement Type Dual SurfaceVoltage Mean 0.0283622356376263Voltage Stand Error 0.000838132758939909Total Activity 6.35694382769882Total Activity Stand Error 4.35554171445231External Activity 0External Activity Stand Error 0Internal Activity 0Internal Activity Stand Error 0Activity No Stnd Err 3Number of Modules IClassification Free ReleasePCM/Normal NormalBack Date And Time 09:06:25 03/11/98Stand Date And Time 09:09:30 03/11/98
Printed 11/4/98 2:12:54PM Page 14

36 U. S. Department of Energy
APPENDIX E
ACRONYMS AND ABBREVIATIONS
Acronym/Abbreviation Description
BI BNFL Instruments Limited
BNFL British Nuclear Fuels Limited
Bq Becquerel
CA contamination area
DOE-SR Department of Energy – Savannah River
FDD Facilities Decommissioning Division
ft feet
HEPA high efficiency particulate air
in. inches
lbs pounds
LLW low level waste
LRAD Long Range Alpha Detection
LSDDP Large Scale Demonstration and Deployment Project
PC personal computer
RBA Radiological Buffer Area
RCO Radiological Control Operations
SRS Savannah River Site
SRTC Savannah River Technology Center
USACE U. S. Army Corps of Engineers
WSRC Westinghouse Savannah River Company