long-range hydrogen-bond structure in aqueous solutions...
TRANSCRIPT

Long-range hydrogen-bond structure in aqueous solutions and the vapor-water interfaceSheeba Jem Irudayam and Richard H. Henchman Citation: J. Chem. Phys. 137, 034508 (2012); doi: 10.1063/1.4735267 View online: http://dx.doi.org/10.1063/1.4735267 View Table of Contents: http://jcp.aip.org/resource/1/JCPSA6/v137/i3 Published by the American Institute of Physics. Additional information on J. Chem. Phys.Journal Homepage: http://jcp.aip.org/ Journal Information: http://jcp.aip.org/about/about_the_journal Top downloads: http://jcp.aip.org/features/most_downloaded Information for Authors: http://jcp.aip.org/authors
THE JOURNAL OF CHEMICAL PHYSICS 137, 034508 (2012)
Long-range hydrogen-bond structure in aqueous solutionsand the vapor-water interface
Sheeba Jem Irudayam1 and Richard H. Henchman2
1Department of Chemistry, University of North Carolina at Chapel Hill, 131 South Road, Chapel Hill,North Carolina 27599, USA2Manchester Institute of Biotechnology, The University of Manchester, 131 Princess Street,Manchester M1 7DN, United Kingdom and School of Chemistry, The University of Manchester, Oxford Road,Manchester M13 9PL, United Kingdom
(Received 25 April 2012; accepted 25 June 2012; published online 18 July 2012)
There is a considerable disagreement about the extent to which solutes perturb water structure. Onthe one hand, studies that analyse structure directly only show local structuring in a solute’s first andpossibly second hydration shells. On the other hand, thermodynamic and kinetic data imply indirectlythat structuring occurs much further away. Here, the hydrogen-bond structure of water around halideanions, alkali cations, noble-gas solutes, and at the vapor-water interface is examined using moleculardynamics simulations. In addition to the expected perturbation in the first hydration shell, deviationsfrom bulk behavior are observed at longer range in the rest of the simulation box. In particular, atthe longer range, there is an excess of acceptors around halide anions, an excess of donors aroundalkali cations, weakly enhanced tetrahedrality and an oscillating excess and deficiency of donors andacceptors around noble-gas solutes, and enhanced tetrahedrality at the vapor-water interface. Thestructuring compensates for the short-range perturbation in water-water hydrogen bonds induced bythe solute. Rather than being confined close to the solute, it is spread over as many water moleculesas possible, presumably to minimize the perturbation to each water molecule. © 2012 AmericanInstitute of Physics. [http://dx.doi.org/10.1063/1.4735267]
I. INTRODUCTION
The structure of aqueous solutions1–4 and interfaces5, 6 isa long-standing issue, not least because the structure of wateris still controversial. Dissolved solutes and interfaces affectthe structure of water and thereby exert an influence on nu-merous processes, from atmospheric reactions7 to the work-ings of biomolecules.2 Determining the nature and range ofthis perturbation is key to understanding how this takes place.That the range extends over many water molecules may beinferred indirectly by non-ideal variations in solution prop-erties such as the activity coefficient8 as predicted by theDebye-Huckel theory,9 viscosity,10 and partial volume11 inthe limit of infinite dilution, the non-additivity of water’s ro-tational dynamics for different salts,12 and the suppressionof broken hydrogen bonds (HBs) in anion-water clusters.13
In further support, computer simulations show an increasedmobility of water distant to ions,14 a non-zero long-rangecontribution to solvation entropy,15 and a long-range contri-bution to surface-tension at the vapor-water interface.16 En-ergy in the form of the electrostatic interaction undoubtablyplays a role in explaining this behavior but so too mustentropy, which quantifies the structural variability of a sys-tem. Otherwise, the long-range perturbation would be invari-ant to temperature, which is unlikely. Structuring is well-recognized in the first and possibly second hydration shellsof a solute as deduced from x-ray absorption and scatter-ing spectra,17, 18 vibrational spectra,19, 20 terahertz spectra,21, 22
distribution functions from neutron diffraction23–26 and com-
puter simulation25, 27–34 tetrahedrality,35, 36 or a number of hy-drogen bonds27, 35, 37–43 from computer simulation. Significantstructuring has also been observed in the first water layeror two of the vapor-water interfaces using vibrational sum-frequency experiments44–49 or computer simulation.50–54 Veryfew definitive studies have been put forward showing the ex-plicit molecular nature of any long-range structuring. How-ever, the limited ability to detect it does not imply that itis not present. Longer-range structural deviations in waterdensity around ions have been detected in neutron diffrac-tion studies24, 26 and at the oil-water interface from moleculardynamics simulation.55 Nonetheless, little evidence and con-flicting thermodynamic, kinetic, and structural data make thetopic of long-range water structuring an ongoing, controver-sial issue.56, 57
Here, we examine the nature and range of the HB struc-ture of water in dilute aqueous solutions and at the vapor-water interface using molecular dynamics simulations. Thesolutes studied are the noble gases Ne, Ar, Kr, and Xe, thehalide anions F−, Cl−, Br−, and I−, and the alkali cationsLi+, Na+, K+, Rb+, and Cs+. The property that we study isthe distributions of water molecules in the whole simulationbox with a given number of donor or acceptor HBs. Specifi-cally, we examine the number of these HB species comparedto bulk, their spatial variation using radial distribution func-tions, the spatial deviations of their number distributions com-pared to bulk, and the differences in the number of donors andacceptors. Effects of HB definition, box size, and charge arealso examined.
0021-9606/2012/137(3)/034508/11/$30.00 © 2012 American Institute of Physics137, 034508-1
034508-2 S. J. Irudayam and R. H. Henchman J. Chem. Phys. 137, 034508 (2012)
II. METHOD
A. Molecular dynamics protocol
The Lennard-Jones parameters for Ne, Ar, Kr, and Xe arethose of Guillot and Guissani58 and those for Li+, Na+, K+,Rb+, and Cs+, and those for the anions F−, Cl−, Br−, andI− are from the parm99 force field as implemented in assistedmodel building with energy refinement (AMBER) 9.59–62 Onesolute is placed in a cubic periodic box with 375 TIP4P/2005water molecules63 using the leap module of the AMBER 9software package.64 Five hundred steps of steepest-descentminimization eliminate high forces from any atomic overlaps.This is followed by molecular dynamics simulations in theNV T ensemble at 298 K using a Langevin thermostat for100 ps and in the NPT ensemble using a Berendsen barostatat 1 bar for a further 2 ns, all using AMBER’s sander mod-ule. Data collection proceeds over a further 1 ns under thesame NPT conditions. All simulations use SHAKE applied toall bonds, a 2 fs time step, a 8 Å cutoff, and particle meshEwald65 with default AMBER parameters. The sander codeof AMBER was altered to print out the hydrogen-bond infor-mation. Sander implicitly includes a neutralising backgroundfor systems containing ions by omitting the constant, zeroth-order energy term in the reciprocal space Ewald sum.66, 67
This standard procedure makes no difference to structure be-cause forces, being energy derivatives, which govern mo-tion in molecular dynamics simulations, are unaffected. Thesame protocol is used for Ar, F−, and Li+ in a larger box of1200 TIP4P/2005 water molecules and the series of artificialsodium ions in the smaller box with charges of ±1, ±2, and±3. Equilibrated boxes have sides of ∼2.2 nm and ∼3.3 nmfor the smaller and larger boxes, and concentrations of 0.15mol dm−3 and 0.046 mol dm−3, respectively. The vapor-waterinterface50 is a periodic rectangular prism of 864 TIP4P/2005water molecules in a box with dimensions 3 × 3 × 10 nm3
such that the water slab occupies the central third, has volume3 × 3 × 3 nm3, and lies in the xy plane. The same simulationprotocol is used as that of the solutions except that they arerun in the NV T ensemble throughout to preserve the interfaceand do not have the extra 1 ns of NPT equilibration. Finally,a simulation of 375 TIP4P/2005 water molecules is run us-ing the same protocol as for solutions to provide a bulk-waterreference for comparison with the solutions and vapor-waterinterface.
B. Structural analysis
HBs are assigned using the topological definition:68 a hy-drogen donates to the acceptor with the strongest force as longas this is the strongest hydrogen-acceptor force between thetwo species involved; if it is not the strongest, then that hy-drogen is deemed to have a broken HB. Given that the hydro-gens in this system have no van der Waals radii, the force isequal to the electrostatic force. The advantages of this defi-nition are that it accurately resolves HBs without recourse toarbitrary parameters and accommodates different types of ac-ceptors according to the size of their force-field charge. Wa-ter species are classified according to either the number ofdonor or acceptor hydrogen bonds. Water molecules with 0,
1, or 2 donors are called non-donors (NDs), single donors(SDs), or double donors (DDs); water molecules with 0, 1,2, 3, or 4 acceptors are called non-acceptors (NAs), single ac-ceptors (SAs), double acceptors (DAs), triple acceptors (TAs),or quadruple acceptors (QAs); water molecules that have onedonor to an ion and no other donor are called ion donors(IDs); and water molecules that have one donor to an ion andone donor to a water molecule are called ion-water donors(IWDs). Given that almost all waters have two donors by thetopological definition, SAs, DAs, and TAs can be described ashaving trigonal, tetrahedral, or trigonal bipyramidal geometry,respectively, even if they are slightly distorted. The HB distri-butions used here in terms of electrostatic force have slightlymore SDs than that obtained using distance68 for bulk waterwith the TIP4P/2005 model,63 2% versus 1.6%, and a corre-sponding shift from DAs to SAs. This is because the oxygen’scharge used for the electrostatic force calculation is offset by0.125 Å from the oxygen atom used for distance. To assesswhether the results are sensitive to the HB definition, we alsoapply the distance-angle HB definition69 to the solutions ofAr, F−, Li+, and the vapor-water interface. This defines an HBif a donor has an oxygen-oxygen distance less than 0.35 nmand a HOO angle less than 30◦; donor HBs from water to an-ions are defined using the same distance-angle criterion withthe anion in place of the acceptor oxygen. Unless otherwisestated, all HBs are calculated using the topological definition.
Four quantities concerning the number and distributionof the HB species are assessed:
1. �Ni: non-ideality of each HB species i in the solutionrelative to bulk water:
�Ni = Ni − N totali , (1)
where Ni and N totali are the average number of HB
species i in the solution and in bulk water, respectively.Being averages over multiple structures, they are typi-cally not integer values.
2. gi(r): radial distribution functions of the oxygen of eachHB species i:
gi(r) = Ni(r)
4πr2ρw(l), (2)
where Ni(r) is the number of HB species i with their oxy-gens at distance r from the solute and ρw(l) is the densityof pure water.
3. �Ni(r): cumulative spatial non-ideality of HB species iintegrated from the origin to a distance r:
�Ni(r) =∫ r
0d(Ni(r
′) − xiNtotali (r ′)
), (3)
where N totali (r ′) is the total number of water molecules
with their oxygens at distance r′ from the solute, and xi
is the mole fraction of HB species i in bulk water.4. �Nda(r): cumulative spatial donor-acceptor bias inte-
grated from the origin to a distance r:
�Nda(r) =donors∑
i
di
∫ r
0dNi(r
′) −acceptors∑
i
ai
∫ r
0dNi(r
′),
(4)

034508-3 S. J. Irudayam and R. H. Henchman J. Chem. Phys. 137, 034508 (2012)
where di and ai are the numbers of water-water donorHBs and acceptor HBs, respectively, of HB species i.
Similar quantities are calculated at the vapor-water interfaceas a function of z except that they are averaged per nm2 overthe two 9 nm2 interfaces and the origin is the Gibbs divid-ing surface (half the bulk density). Bin-widths used in dis-tance are 0.01 nm for all systems. All quantities are evaluatedsuch that each molecule in the simulation box contributes onlyonce so as to avoid double-counting periodic molecules. Er-rors in �Ni are determined by calculating for Ni and N total
i thestandard deviation divided by the square root of the numberof independent configurations. Correlation times between in-dependent configurations are determined to be 1 ps for thesolutions and 10 ps for the vapor-water interface based onthe time for the convergence of the standard deviation. Thisleads to 1000 configurations for solutions and 100×18 con-figurations for the vapor-water interface. Errors in �Ni(r) aresimilar to those of �Ni for the respective HB species i whileerrors in �Nda(r) are smaller and not considered becausetheir integrated total is exactly zero, every donor having anacceptor.
III. RESULTS AND DISCUSSION
A. Non-ideality of the HB species
Non-ideality is first examined using �Ni as defined inEq. (1). These values are listed in Table I. Around noble gases,the water is more tetrahedral, shown by a shift from SAs andTAs to DAs, that increases weakly on average with solute size.There are slightly more broken HBs, indicated by a shift fromDDs to SDs and by a greater loss of TAs than SAs. Aroundanions, there are more species with less acceptor HBs, notablythe SAs, fewer broken HBs, and the large expected increasein IWDs at the expenses of DDs. IDs are rare and negligiblefor larger anions. The broken donors of IDs almost alwaysoccur for hydrogens trying to point to a water molecule al-though about 0.02 water molecules have both donors boundby the anion in the case of F−. The coordination number ofanions, equal to the number of donating hydrogens, is ∼6 as
TABLE II. �Ni of each HB speciesa going from bulk water to solution orto the vapor-water interface using the distance-angle HB definition.
Acceptor Ar F− Li+ Vapor/waterb
NA − 0.1 0.2 2.5 0.1SA − 0.7 3.2 − 2.9 1.4DA 1.1 − 2.2 − 1.3 − 0.8TA − 0.2 − 1.3 1.6 − 0.7QA 0.0 0.0 0.0 0.0DonorND − 0.1 − 0.1 0.0 0.2SD − 0.6 − 1.5 0.4 1.8DD 0.7 − 4.4 − 0.4 − 2.0TD 0.0 0.0 0.0 0.0ID 2.9IWD 3.1
aErrors are ±0.1 for NAs, NDs, and TDs (triple donors), ±0.3 for SDs, SAs, and DDs,±0.4 for DAs, ±0.2 for TAs, and zero otherwise. They are the same at the vapor-waterinterface but in units of nm−2.bUnits are nm−2.
expected.70 Around cations, there is a large shift from tetra-hedral structure to almost all other species: NAs, TAs, QAs,SDs, and either fewer or more SAs, depending on the cation’ssize. Smaller cations have a decrease in SAs and more NAswhile larger cations have an increase in SAs and fewer NAs.The coordination number of cations is not determined usingthe topological HB definition because a hydrogen is not in-volved in the cation-water interaction. For all solutions, thereis an absence of NDs. Values of �Ni using the distance-angleHB definition69 are included in Table II. Most trends are sim-ilar and any differences largely arise from the greater numberof broken HBs detected by the distance-angle HB definition.There are larger falls in SDs around Ar and F−, indicatingfewer distorted HBs, and small changes in NAs and NDs forAr and F−. Even though the coordination numbers are thesame around F− using either definition, the distance-angledefinition gives roughly equal numbers of IDs and IWDs ver-sus the dominance of IWDs using the topological HB defini-tion; this is consistent with HBs being more distorted in thefirst hydration shell of anions.
TABLE I. �Ni of each HB speciesa going from bulk water to solution or to the vapor-water interface.
Acceptorb Ne Ar Kr Xe F− Cl− Br− I− Li+ Na+ K+ Rb+ Cs+ Vapor/waterc
NA 0.0 0.0 0.0 0.0 0.1 0.1 0.1 0.1 2.2 1.6 1.1 0.8 0.6 0.0SA − 0.1 − 0.4 − 0.2 − 0.6 3.2 3.1 3.7 3.0 − 1.7 − 0.6 0.1 0.8 1.2 1.1DA 0.4 1.0 0.5 1.3 − 1.0 − 0.5 − 1.6 − 0.6 − 3.0 − 3.4 − 3.2 − 3.6 − 3.8 − 0.2TA − 0.3 − 0.5 − 0.3 − 0.6 − 2.2 − 2.6 − 2.1 − 2.5 2.3 2.2 1.9 1.9 1.9 − 0.8QA 0.0 0.0 0.0 0.0 − 0.1 − 0.1 − 0.1 − 0.1 0.1 0.1 0.1 0.1 0.1 0.0Donord
SD 0.1 0.0 0.1 0.1 − 0.5 − 0.5 − 0.2 0.0 0.2 0.3 0.2 0.3 0.3 1.9DD − 0.1 0.0 − 0.1 − 0.1 − 5.3 − 5.8 − 6.0 − 5.7 − 0.2 − 0.3 − 0.2 − 0.3 − 0.3 − 1.9ID 0.1 0.1 0.0 0.0IWD 5.9 6.4 6.2 5.7
aErrors for solutions are ±0.1 for NAs, QAs, SDs, and DDs, ±0.2 for SAs, TAs, ±0.4 for DAs, and zero otherwise. They are the same at the vapor-water interface but in units of nm−2
and are ±0.2 nm−2 for SDs and DDs.bNA, SA, DA, TA, and QA are non, single, double, triple, and quadruple acceptors, respectively.cUnits are in nm−2.dSD and DD are single and double donors to water. ID is a single donor to an ion and IWD is a single donor to an ion and single donor to water.
034508-4 S. J. Irudayam and R. H. Henchman J. Chem. Phys. 137, 034508 (2012)
That water is marginally more tetrahedral around non-polar solutes is well-known and consistent with other find-ings by various measures.34, 71–73 That water is less tetrahe-dral around ions, more so for cations than anions, is againconsistent with other findings.18, 73–77 Less well studied havebeen the distributions of non-tetrahedral species around so-lutes. The favoring of SAs around anions necessarily arisesbecause of the overall deficiency of donors brought about bythe anion. Similarly, the favoring of TAs around cations arisesbecause of the overall deficiency of acceptors brought aboutby the cation. For the same reasons, there are more brokenHBs around cations than around anions. Having fewer bro-ken HBs around anions is similar to what has been observedin anion-water clusters.78 Relating the degree of HB break-ing primarily to the sign of the solute’s charge differs to otherstudies that relate it to the ion’s size and charge density.73, 74
Examining that trend further, Table I shows little variation inthe fraction of broken HBs with solute size for noble gasesand cations while there are even fewer broken HBs for theanions of higher charge density. The difference in these inter-pretations can be explained because HBs are more distortednear the ions of higher charge density and consequently aremore likely to be classified as broken by HB definitions withfixed geometric cut-offs.
At the vapor-water interface, there is a shift to specieswith fewer HBs, namely SAs and SDs and even NDs(0.01 nm−2) and NAs (0.03 nm−2) at the expense of DAsand more so TAs. Some water molecules would be simultane-ously SDs and SAs but we have not examined the joint pop-ulation of donors and acceptors here. The sizeable presenceof broken HBs at the vapor-water interface is consistent withthe findings elsewhere for the vapor-water interface44, 52, 79–81
and first observed at the oil-water interface.82 The surfacedensity of broken HBs at the vapor-water interface in TableI can be converted into a percentage by approximating theinterface as a single water layer having bulk density, giving10.3 molecules per nm2; the total number of SDs equals thechange of 1.9 SDs plus the 1.6% of SDs in bulk water,68
giving 1.9 + 0.16 = 2.1 SDs per nm2. Together with theamount of NDs, this yields 20% of molecules with a bro-ken HB. This is similar to the 25% from sum-frequencygeneration,44 21% from simulated spectra,83 and 23%(Ref. 47) and 27% (Ref. 84) from molecular dynamics sim-ulations using HB definitions that are less restrictive thanthose conventionally used but still containing arbitrary pa-rameters. Equivalently, all these values translate to 10%–14%broken HBs, assuming one broken HB per water molecule.This further validates the accuracy and versatility of the topo-logical HB definition. Incidentally, it was the large numberof clearly visible free hydrogens at the vapor-water interfacethat helped us formulate the topological HB definition ratherthan the case of bulk water in which free hydrogens are fewerand subtler.68 The distance-angle HB definition (Table II)also predicts a substantial breakage of HBs but differs bypredicting a greater loss of DAs and the non-negligible pres-ence of NDs. The inaccuracy of the distance-angle definitionis clear, first because the NDs that it predicts are believed tobe negligible at the vapor-water interface,52, 81 second becausethe 10% of broken HBs that it predicts in bulk68 is surprisingly
comparable to what is measured experimentally at the muchmore disruptive vapor-water interface, and third that the per-centage of molecules with a broken HB at the vapor-waterinterface is at least double that of experiment at 47%, com-parable to ≈50% or more from other works,51, 52, 54 which useoverly restrictive HB definitions. This significant discrepancywith experiment may be masked by erroneously equating thepercentage of broken HBs to the percentage of molecules witha broken HB; on the contrary, the former is about half thelatter, the very factor by which the distance-angle definitionoverestimates broken HBs at the vapor-water interface.
B. Non-ideal spatial distribution of HB species
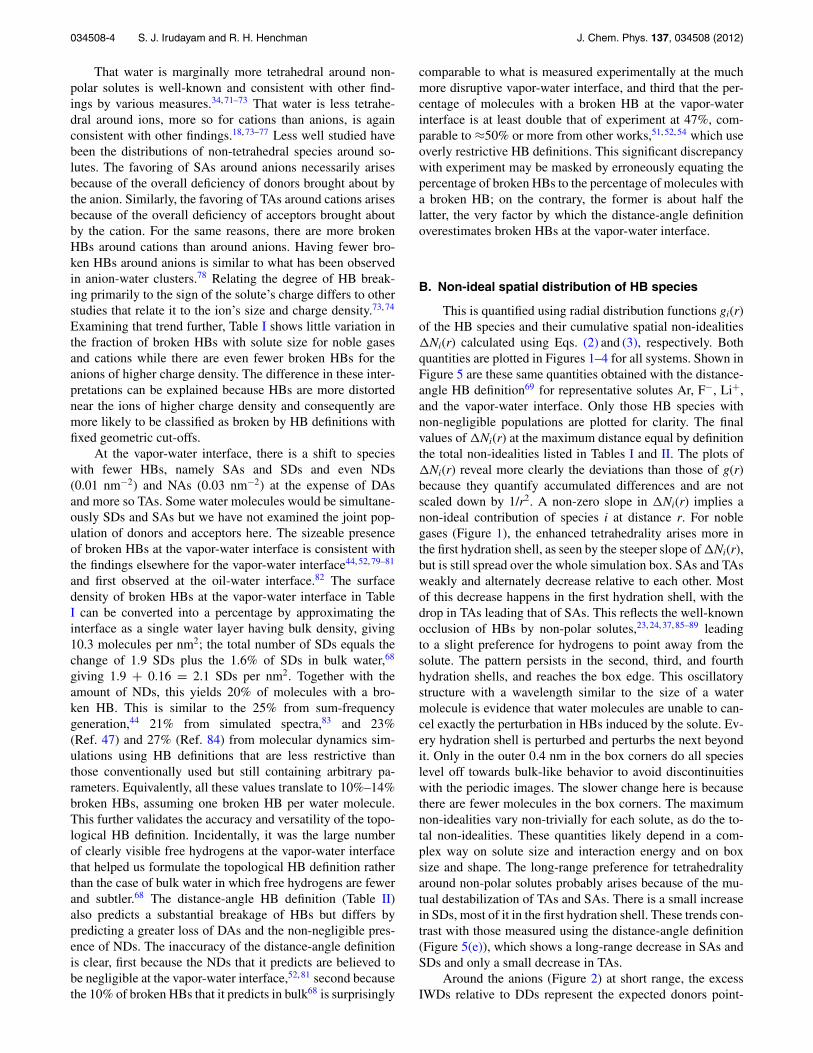
This is quantified using radial distribution functions gi(r)of the HB species and their cumulative spatial non-idealities�Ni(r) calculated using Eqs. (2) and (3), respectively. Bothquantities are plotted in Figures 1–4 for all systems. Shown inFigure 5 are these same quantities obtained with the distance-angle HB definition69 for representative solutes Ar, F−, Li+,and the vapor-water interface. Only those HB species withnon-negligible populations are plotted for clarity. The finalvalues of �Ni(r) at the maximum distance equal by definitionthe total non-idealities listed in Tables I and II. The plots of�Ni(r) reveal more clearly the deviations than those of g(r)because they quantify accumulated differences and are notscaled down by 1/r2. A non-zero slope in �Ni(r) implies anon-ideal contribution of species i at distance r. For noblegases (Figure 1), the enhanced tetrahedrality arises more inthe first hydration shell, as seen by the steeper slope of �Ni(r),but is still spread over the whole simulation box. SAs and TAsweakly and alternately decrease relative to each other. Mostof this decrease happens in the first hydration shell, with thedrop in TAs leading that of SAs. This reflects the well-knownocclusion of HBs by non-polar solutes,23, 24, 37, 85–89 leadingto a slight preference for hydrogens to point away from thesolute. The pattern persists in the second, third, and fourthhydration shells, and reaches the box edge. This oscillatorystructure with a wavelength similar to the size of a watermolecule is evidence that water molecules are unable to can-cel exactly the perturbation in HBs induced by the solute. Ev-ery hydration shell is perturbed and perturbs the next beyondit. Only in the outer 0.4 nm in the box corners do all specieslevel off towards bulk-like behavior to avoid discontinuitieswith the periodic images. The slower change here is becausethere are fewer molecules in the box corners. The maximumnon-idealities vary non-trivially for each solute, as do the to-tal non-idealities. These quantities likely depend in a com-plex way on solute size and interaction energy and on boxsize and shape. The long-range preference for tetrahedralityaround non-polar solutes probably arises because of the mu-tual destabilization of TAs and SAs. There is a small increasein SDs, most of it in the first hydration shell. These trends con-trast with those measured using the distance-angle definition(Figure 5(e)), which shows a long-range decrease in SAs andSDs and only a small decrease in TAs.
Around the anions (Figure 2) at short range, the excessIWDs relative to DDs represent the expected donors point-
034508-5 S. J. Irudayam and R. H. Henchman J. Chem. Phys. 137, 034508 (2012)
FIG. 1. Donor and acceptor radial distribution functions gi(r) of noble gases (a) Ne, (b) Ar, (c) Kr, and (d) Xe, and non-ideality �Ni(r) of HB species i around(e) Ne, (f) Ar, (g) Kr, and (h) Xe. The coloring is the following: total (grey), SA (aqua), DA (blue), TA (green), SD (red), DD (dark blue). The vertical lines arehalf the box edge (dotted) and half the box long diagonal (dashed).
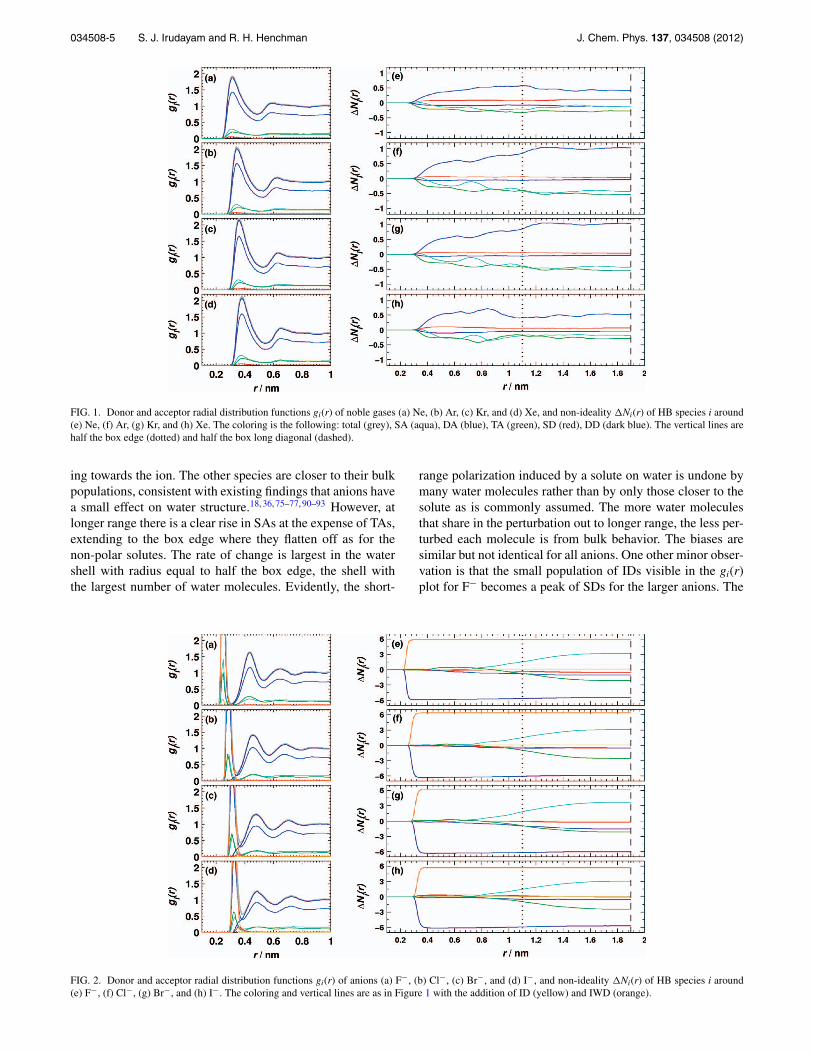
ing towards the ion. The other species are closer to their bulkpopulations, consistent with existing findings that anions havea small effect on water structure.18, 36, 75–77, 90–93 However, atlonger range there is a clear rise in SAs at the expense of TAs,extending to the box edge where they flatten off as for thenon-polar solutes. The rate of change is largest in the watershell with radius equal to half the box edge, the shell withthe largest number of water molecules. Evidently, the short-
range polarization induced by a solute on water is undone bymany water molecules rather than by only those closer to thesolute as is commonly assumed. The more water moleculesthat share in the perturbation out to longer range, the less per-turbed each molecule is from bulk behavior. The biases aresimilar but not identical for all anions. One other minor obser-vation is that the small population of IDs visible in the gi(r)plot for F− becomes a peak of SDs for the larger anions. The
FIG. 2. Donor and acceptor radial distribution functions gi(r) of anions (a) F−, (b) Cl−, (c) Br−, and (d) I−, and non-ideality �Ni(r) of HB species i around(e) F−, (f) Cl−, (g) Br−, and (h) I−. The coloring and vertical lines are as in Figure 1 with the addition of ID (yellow) and IWD (orange).
034508-6 S. J. Irudayam and R. H. Henchman J. Chem. Phys. 137, 034508 (2012)
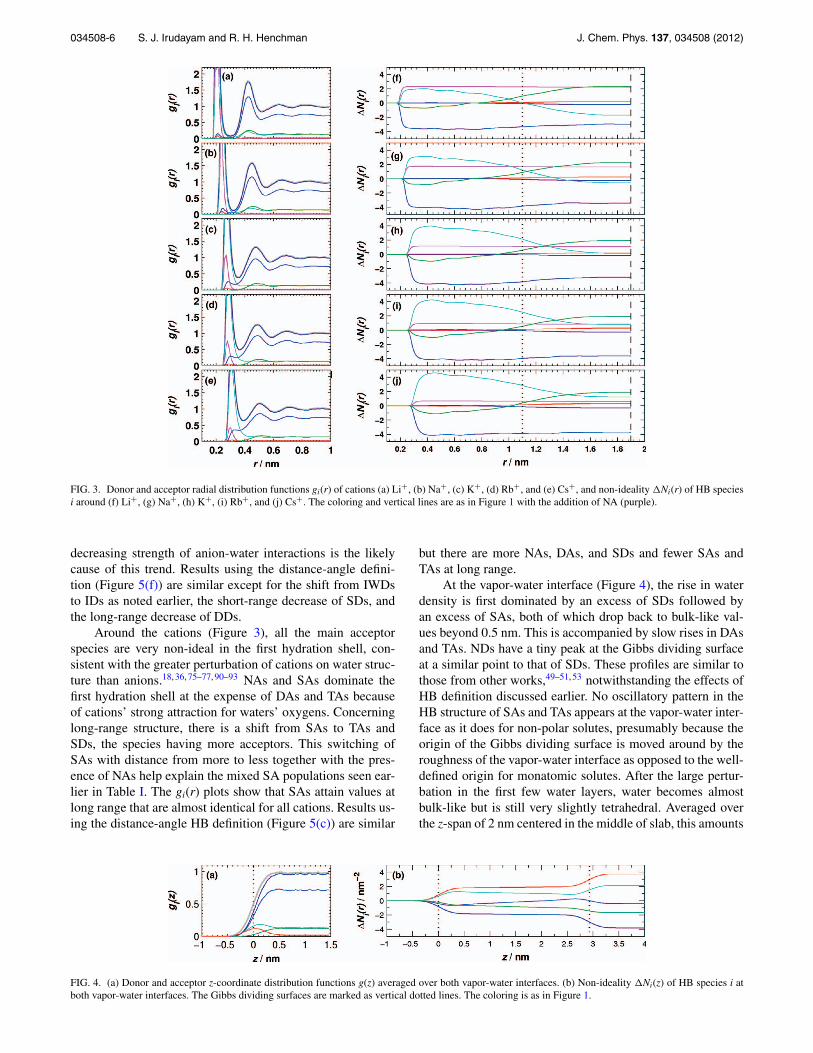
FIG. 3. Donor and acceptor radial distribution functions gi(r) of cations (a) Li+, (b) Na+, (c) K+, (d) Rb+, and (e) Cs+, and non-ideality �Ni(r) of HB speciesi around (f) Li+, (g) Na+, (h) K+, (i) Rb+, and (j) Cs+. The coloring and vertical lines are as in Figure 1 with the addition of NA (purple).
decreasing strength of anion-water interactions is the likelycause of this trend. Results using the distance-angle defini-tion (Figure 5(f)) are similar except for the shift from IWDsto IDs as noted earlier, the short-range decrease of SDs, andthe long-range decrease of DDs.
Around the cations (Figure 3), all the main acceptorspecies are very non-ideal in the first hydration shell, con-sistent with the greater perturbation of cations on water struc-ture than anions.18, 36, 75–77, 90–93 NAs and SAs dominate thefirst hydration shell at the expense of DAs and TAs becauseof cations’ strong attraction for waters’ oxygens. Concerninglong-range structure, there is a shift from SAs to TAs andSDs, the species having more acceptors. This switching ofSAs with distance from more to less together with the pres-ence of NAs help explain the mixed SA populations seen ear-lier in Table I. The gi(r) plots show that SAs attain values atlong range that are almost identical for all cations. Results us-ing the distance-angle HB definition (Figure 5(c)) are similar
but there are more NAs, DAs, and SDs and fewer SAs andTAs at long range.
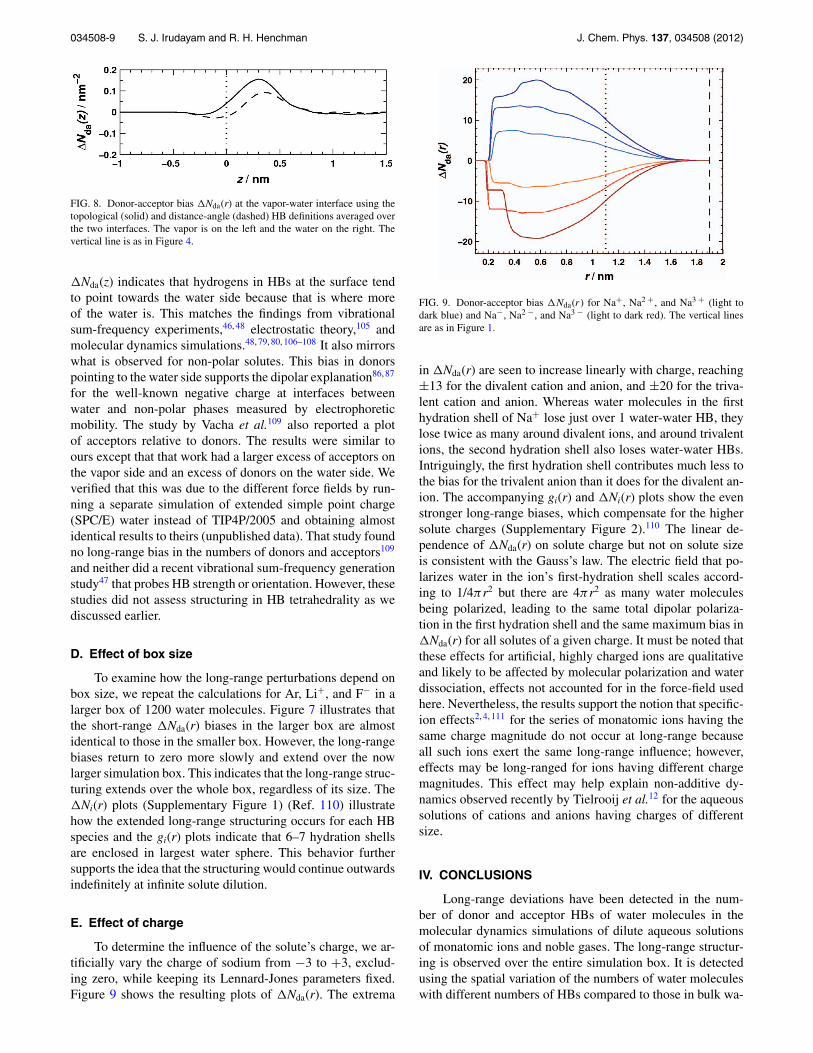
At the vapor-water interface (Figure 4), the rise in waterdensity is first dominated by an excess of SDs followed byan excess of SAs, both of which drop back to bulk-like val-ues beyond 0.5 nm. This is accompanied by slow rises in DAsand TAs. NDs have a tiny peak at the Gibbs dividing surfaceat a similar point to that of SDs. These profiles are similar tothose from other works,49–51, 53 notwithstanding the effects ofHB definition discussed earlier. No oscillatory pattern in theHB structure of SAs and TAs appears at the vapor-water inter-face as it does for non-polar solutes, presumably because theorigin of the Gibbs dividing surface is moved around by theroughness of the vapor-water interface as opposed to the well-defined origin for monatomic solutes. After the large pertur-bation in the first few water layers, water becomes almostbulk-like but is still very slightly tetrahedral. Averaged overthe z-span of 2 nm centered in the middle of slab, this amounts
FIG. 4. (a) Donor and acceptor z-coordinate distribution functions g(z) averaged over both vapor-water interfaces. (b) Non-ideality �Ni(z) of HB species i atboth vapor-water interfaces. The Gibbs dividing surfaces are marked as vertical dotted lines. The coloring is as in Figure 1.

034508-7 S. J. Irudayam and R. H. Henchman J. Chem. Phys. 137, 034508 (2012)
FIG. 5. Donor and acceptor radial distribution functions gi(r) of (a) Ar, (b) F−, (c) Li+, and (d) averaged over both vapor-water interfaces using the distance-angle HB definition, and non-ideality �Ni(r) of HB species i around (e) Ar, (f) F−, (g) Li+, and (h) �Ni(z) for both vapor-water interfaces using the distance-angle HB definition. The coloring and vertical lines are as in Figures 1–4, with red also indicating the small ND deviation.
to one extra DA per nm2 at the expense of SA and TA, or oneextra DA in 70 water molecules. A more tetrahedral structurewould be expected to have lower density, and the total g(r) isindeed only 0.98 instead of the bulk value of 1 in the central2 nm span (Figure 4(a)). This is supported elsewhere by sim-ilar reduced densities at the vapor-water interface16 and at theoil-water interface for a range of box-sizes.55 More evidenceelsewhere for the long-range structuring comes from a smallexcess in the pressure normal to the surface over the tangentialpressure across the middle of the water slab.16 This suggeststhat there is a contribution to surface tension, which dependson this pressure difference, even from water in the middle ofthe slab. The tetrahedrality is probably enhanced for a simi-lar reason as for the non-polar solutes because of the mutualSA-TA destabilization.
The long-range structuring, even for ions, is not large.It is just about detectable in radial distribution functions,which obscure the structuring because of 1/r2 dilution. Itwas easier to notice in the radial distribution functions us-ing the topological HB definition (Figures 2 and 3) than inthe plots using the distance-angle definition (Figures 5(a)–5(c)) because the relative variation of SAs and TAs, beingso similar, is more telling. We have resolved this differencemore distinctly by focusing on the numbers of HBs, consid-ering differences relative to the bulk or donors relative to ac-ceptors, and removing the dilution owing to the 1/r2 scalingthat spreads the structuring over more molecules at large dis-tances. Our results demonstrate the importance of looking atall water molecules in the simulation box and not only thosenear the solute as most simulation studies do27, 35, 38–43, 77, 88, 89
and as most experimental techniques can either detect, orassume.18, 19, 56, 94 Simulation studies also have the advantageof being able to study single ions whereas an experiment hasto contend with both cations and anions and their cancellingbehavior on long-range structure. In salt solutions, surfacesof bulk-like distributions would be expected to lie in betweencations and anions because they generate opposite perturba-tions in the populations of HB species. Surfaces between like-charged ions would be doubly-perturbed. Some related ex-perimental evidence for a short-ranged HB compensation isseen in the x-ray crystal structures of hydrated molecules.95, 96
Molecules having more acceptors are surrounded by wa-ter molecules with more donors while molecules withmore donors are surrounded by water molecules with moreacceptors.
The presence of long-range structuring around ionsagrees with the polarization out to infinite distance incontinuum-solvent electrostatic models such as the Bornmodel97 and Debye-Huckel theory.9 By explaining how ionsare preferentially surrounded by their counterions, regardlessof their distance apart, the long-range structuring, togetherwith energy which is also long-ranged, likely contributes tothe non-ideal square-root dependence on concentration of theactivity coefficients,9 viscosity,10 and partial volumes11 forions at low ionic concentration. In the case of ions, whoseentropies of solvation are much more negative,98 the presenceof a small, long-range entropic contribution to ionic solva-tion has recently been detected using quasichemical theory.15
In the case of non-polar solutes, the well-known and con-tentious decrease in the entropy of hydration of small non-

034508-8 S. J. Irudayam and R. H. Henchman J. Chem. Phys. 137, 034508 (2012)
polar molecules under ambient conditions99–101 is seen in ourwork to have a long-range contribution. As well as contribut-ing to the non-ideality of partial volumes, our findings furthersuggest why the partial volumes of cations are more nega-tive than those of anions3, 102 and why water’s density aroundcations is higher than that around anions, as observed by x-rayscattering and diffraction.103, 104 While an ion’s partial volumeis dominated by the ion’s size and changes in the first hydra-tion shell, our results show how the positive partial volumesof anions would have a small long-range contribution fromthe deficiency of water-water HBs brought about by the anionaccepting donors. The more abundant SAs have lower den-sity than TAs because SAs have fewer HBs in their coordi-nation shell.68 Likewise, our results suggest that there wouldbe a long-range contribution to cations’ more negative partialvolumes owing to the excess of HBs because of the repul-sion of donors from the cation. In this case, there are morehigh-density TAs than low-density SAs. Our explanation forthe structure of solutions in terms of the number of topolog-ically defined HBs bypasses the ambiguities inherent in theconcepts of structure-making or breaking,2, 3, 77 which may beused to encompass confinement, degree of tetrahedrality, andwater-solute and water-water interactions at any distance. Italso gives a clearer structural picture than one in terms of lo-cal density fluctuations.14, 103, 104
C. Donor-acceptor biases
The cumulative spatial donor-acceptor bias �Nda(r) cal-culated by Eq. (4) also quantifies non-ideality in the numberof donors or acceptors and implicitly indicates the directional-ity of HBs. It is plotted for all solutes in Figure 6. �Nda(r) val-ues using both topology and distance-angle HB definitions69
are plotted in Figure 7 for water around Ar, Li+, and F−. Asexpected, large biases are observed for �Nda(r) in the firsthydration shells of ions and small ones for noble-gas solutes.The biases grow with distance more rapidly for smaller ionswith higher charge densities. However, the extrema are verysimilar for all solutes of a given charge. Cations blockingwater molecules from accepting brings about an excess of
FIG. 6. Donor-acceptor bias �Nda(r) for water around Ne, Ar, Kr, Xe (darkto light green), F−, Cl−, Br−, I− (dark to light red), and Li+, Na+, K+, Rb+,Cs+ (dark to light blue). The vertical lines are as in Figure 1.
FIG. 7. Donor-acceptor bias �Nda(r) for water around Ar (green) F− (red)and Li+ (blue) in the box of 375 water molecules with the topological HBdefinition (solid), the box of 1200 water molecules with the topological HBdefinition (dotted-dashed), and the box of 375 water molecules with thedistance-angle HB definition (dashed). The vertical lines are as in Figure 1.
7–7.5 donors at the maximum in the cation’s first hydrationshell. Based on first-shell coordination numbers77 of 4.4, 5.8,6.7, 7.4, and 8.3, first-shell water molecules lose approxi-mately two water-water HBs per water molecule for Li+ downto one HB per water molecule for Cs+. The donating of hy-drogens to anions brings about an excess of 6–7 acceptors atthe maximum in the anion’s second hydration shell, which isslightly smaller than that for cations. Based on first-shell coor-dination numbers of77 6.1, 6.9, 7.5, and 7.6 and on the popula-tions of IWDs and IDs in Table II, almost all first-shell watermolecules around all anions lose approximately one water-water HB, the number being slightly less for larger anions.Beyond the extrema, �Nda(r) decreases slowly to zero, doingso most rapidly in the largest water shell at half the box length,as was seen before for the individual HB species (Figures 2and 3). �Nda(r) for the noble-gas solutes oscillates slightlyabove zero on average with values ∼100 times smaller thanfor the ions. This matches the weak tendency of hydrogens topoint outwards from non-polar solutes.23, 24, 37, 85–89 The samesmall oscillatory behavior in �Nda(r) is also seen for ions inFigure 6 on top of the contribution from the ion’s charge.For all solutes, �Nda(r) reaches zero at the furthest watermolecule as it must because the number of donor HBs equalsthe number of acceptor HBs. In all cases, the values usingeither of the two HB definitions are almost indistinguishablefrom each other (Figure 7). This further demonstrates that theoverall long-range structuring of HBs observed here is notsensitive to the HB definition.
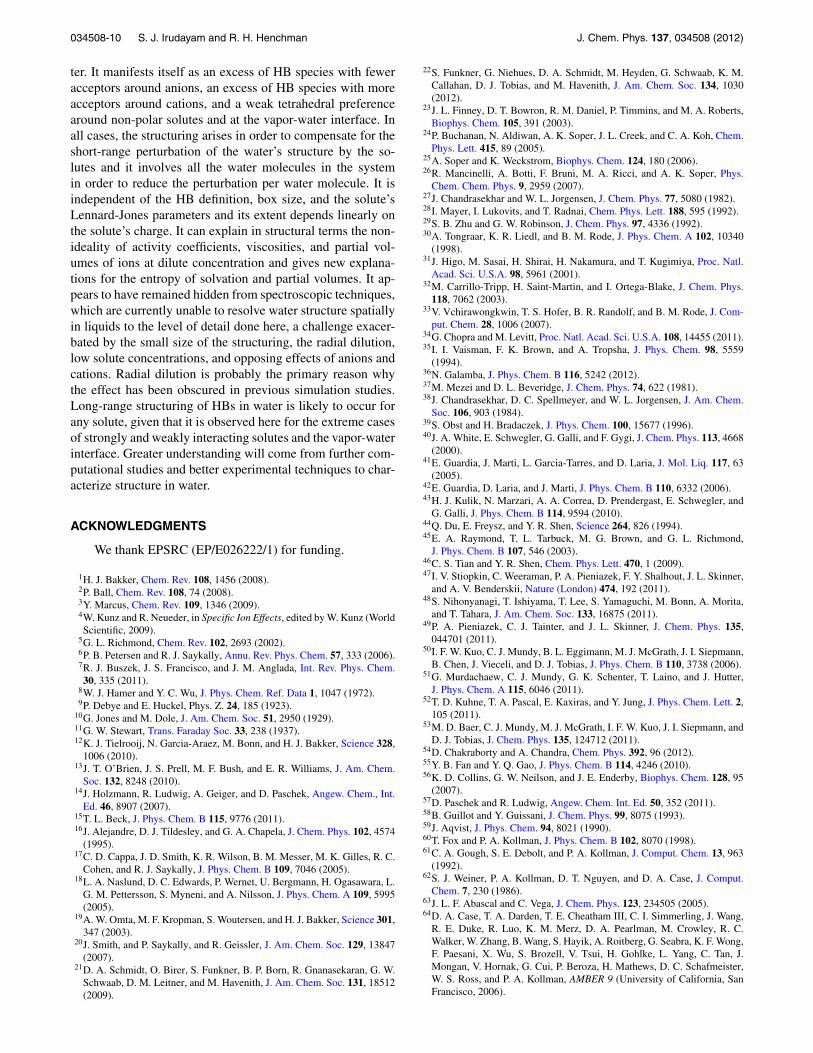
At the vapor-water interface (Figure 8), �Nda(z) detectsa tiny deficiency of donors on the vapor side, an excess ofdonors just within the Gibbs dividing surface, and a compara-ble deficiency of donors further into the water side. The freehydrogens pointing into the vapor are invisible in �Nda(z)because they are not involved in HBs. No bias is presentin the bulk. Similar results are obtained using the distance-angle HB definition, which are also plotted in Figure 8. Themain differences using this HB definition are that the peakis smaller and slightly deeper into the interface. The trend in
034508-9 S. J. Irudayam and R. H. Henchman J. Chem. Phys. 137, 034508 (2012)
FIG. 8. Donor-acceptor bias �Nda(r) at the vapor-water interface using thetopological (solid) and distance-angle (dashed) HB definitions averaged overthe two interfaces. The vapor is on the left and the water on the right. Thevertical line is as in Figure 4.
�Nda(z) indicates that hydrogens in HBs at the surface tendto point towards the water side because that is where moreof the water is. This matches the findings from vibrationalsum-frequency experiments,46, 48 electrostatic theory,105 andmolecular dynamics simulations.48, 79, 80, 106–108 It also mirrorswhat is observed for non-polar solutes. This bias in donorspointing to the water side supports the dipolar explanation86, 87
for the well-known negative charge at interfaces betweenwater and non-polar phases measured by electrophoreticmobility. The study by Vacha et al.109 also reported a plotof acceptors relative to donors. The results were similar toours except that that work had a larger excess of acceptors onthe vapor side and an excess of donors on the water side. Weverified that this was due to the different force fields by run-ning a separate simulation of extended simple point charge(SPC/E) water instead of TIP4P/2005 and obtaining almostidentical results to theirs (unpublished data). That study foundno long-range bias in the numbers of donors and acceptors109
and neither did a recent vibrational sum-frequency generationstudy47 that probes HB strength or orientation. However, thesestudies did not assess structuring in HB tetrahedrality as wediscussed earlier.
D. Effect of box size
To examine how the long-range perturbations depend onbox size, we repeat the calculations for Ar, Li+, and F− in alarger box of 1200 water molecules. Figure 7 illustrates thatthe short-range �Nda(r) biases in the larger box are almostidentical to those in the smaller box. However, the long-rangebiases return to zero more slowly and extend over the nowlarger simulation box. This indicates that the long-range struc-turing extends over the whole box, regardless of its size. The�Ni(r) plots (Supplementary Figure 1) (Ref. 110) illustratehow the extended long-range structuring occurs for each HBspecies and the gi(r) plots indicate that 6–7 hydration shellsare enclosed in largest water sphere. This behavior furthersupports the idea that the structuring would continue outwardsindefinitely at infinite solute dilution.
E. Effect of charge
To determine the influence of the solute’s charge, we ar-tificially vary the charge of sodium from −3 to +3, exclud-ing zero, while keeping its Lennard-Jones parameters fixed.Figure 9 shows the resulting plots of �Nda(r). The extrema
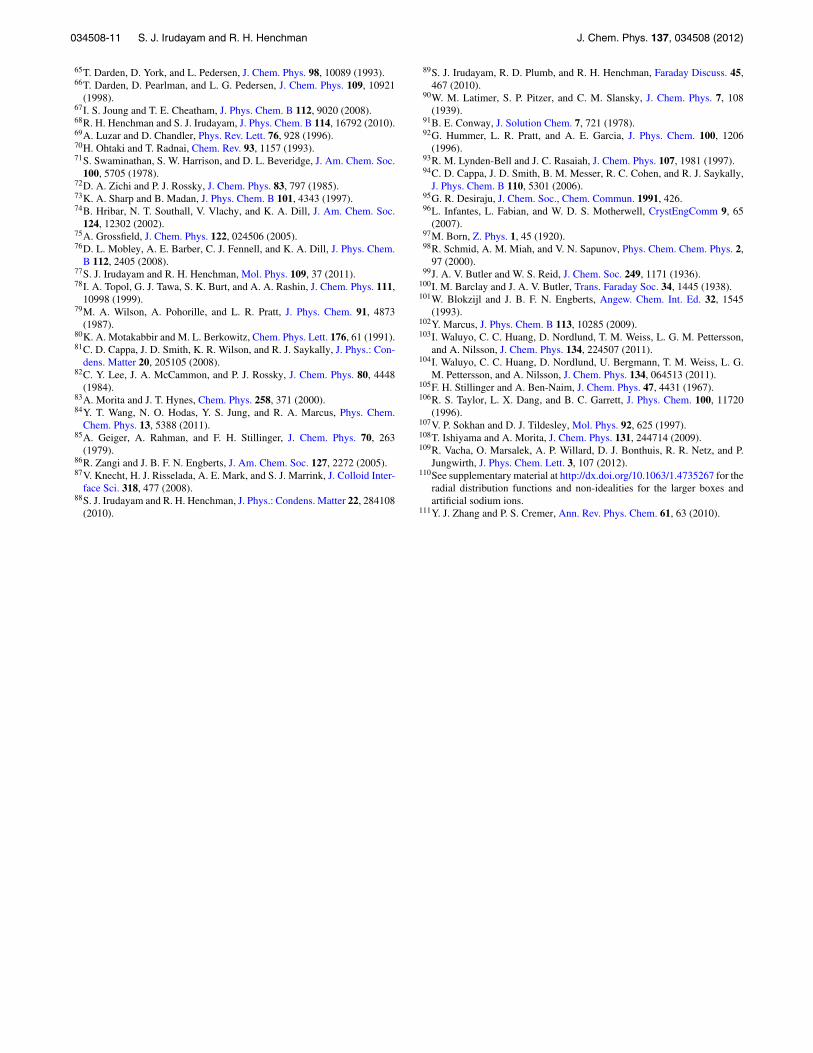
FIG. 9. Donor-acceptor bias �Nda(r) for Na+, Na2 +, and Na3 + (light todark blue) and Na−, Na2 −, and Na3 − (light to dark red). The vertical linesare as in Figure 1.
in �Nda(r) are seen to increase linearly with charge, reaching±13 for the divalent cation and anion, and ±20 for the triva-lent cation and anion. Whereas water molecules in the firsthydration shell of Na+ lose just over 1 water-water HB, theylose twice as many around divalent ions, and around trivalentions, the second hydration shell also loses water-water HBs.Intriguingly, the first hydration shell contributes much less tothe bias for the trivalent anion than it does for the divalent an-ion. The accompanying gi(r) and �Ni(r) plots show the evenstronger long-range biases, which compensate for the highersolute charges (Supplementary Figure 2).110 The linear de-pendence of �Nda(r) on solute charge but not on solute sizeis consistent with the Gauss’s law. The electric field that po-larizes water in the ion’s first-hydration shell scales accord-ing to 1/4πr2 but there are 4πr2 as many water moleculesbeing polarized, leading to the same total dipolar polariza-tion in the first hydration shell and the same maximum bias in�Nda(r) for all solutes of a given charge. It must be noted thatthese effects for artificial, highly charged ions are qualitativeand likely to be affected by molecular polarization and waterdissociation, effects not accounted for in the force-field usedhere. Nevertheless, the results support the notion that specific-ion effects2, 4, 111 for the series of monatomic ions having thesame charge magnitude do not occur at long-range becauseall such ions exert the same long-range influence; however,effects may be long-ranged for ions having different chargemagnitudes. This effect may help explain non-additive dy-namics observed recently by Tielrooij et al.12 for the aqueoussolutions of cations and anions having charges of differentsize.
IV. CONCLUSIONS
Long-range deviations have been detected in the num-ber of donor and acceptor HBs of water molecules in themolecular dynamics simulations of dilute aqueous solutionsof monatomic ions and noble gases. The long-range structur-ing is observed over the entire simulation box. It is detectedusing the spatial variation of the numbers of water moleculeswith different numbers of HBs compared to those in bulk wa-
034508-10 S. J. Irudayam and R. H. Henchman J. Chem. Phys. 137, 034508 (2012)
ter. It manifests itself as an excess of HB species with feweracceptors around anions, an excess of HB species with moreacceptors around cations, and a weak tetrahedral preferencearound non-polar solutes and at the vapor-water interface. Inall cases, the structuring arises in order to compensate for theshort-range perturbation of the water’s structure by the so-lutes and it involves all the water molecules in the systemin order to reduce the perturbation per water molecule. It isindependent of the HB definition, box size, and the solute’sLennard-Jones parameters and its extent depends linearly onthe solute’s charge. It can explain in structural terms the non-ideality of activity coefficients, viscosities, and partial vol-umes of ions at dilute concentration and gives new explana-tions for the entropy of solvation and partial volumes. It ap-pears to have remained hidden from spectroscopic techniques,which are currently unable to resolve water structure spatiallyin liquids to the level of detail done here, a challenge exacer-bated by the small size of the structuring, the radial dilution,low solute concentrations, and opposing effects of anions andcations. Radial dilution is probably the primary reason whythe effect has been obscured in previous simulation studies.Long-range structuring of HBs in water is likely to occur forany solute, given that it is observed here for the extreme casesof strongly and weakly interacting solutes and the vapor-waterinterface. Greater understanding will come from further com-putational studies and better experimental techniques to char-acterize structure in water.
ACKNOWLEDGMENTS
We thank EPSRC (EP/E026222/1) for funding.
1H. J. Bakker, Chem. Rev. 108, 1456 (2008).2P. Ball, Chem. Rev. 108, 74 (2008).3Y. Marcus, Chem. Rev. 109, 1346 (2009).4W. Kunz and R. Neueder, in Specific Ion Effects, edited by W. Kunz (WorldScientific, 2009).
5G. L. Richmond, Chem. Rev. 102, 2693 (2002).6P. B. Petersen and R. J. Saykally, Annu. Rev. Phys. Chem. 57, 333 (2006).7R. J. Buszek, J. S. Francisco, and J. M. Anglada, Int. Rev. Phys. Chem.30, 335 (2011).
8W. J. Hamer and Y. C. Wu, J. Phys. Chem. Ref. Data 1, 1047 (1972).9P. Debye and E. Huckel, Phys. Z. 24, 185 (1923).
10G. Jones and M. Dole, J. Am. Chem. Soc. 51, 2950 (1929).11G. W. Stewart, Trans. Faraday Soc. 33, 238 (1937).12K. J. Tielrooij, N. Garcia-Araez, M. Bonn, and H. J. Bakker, Science 328,
1006 (2010).13J. T. O’Brien, J. S. Prell, M. F. Bush, and E. R. Williams, J. Am. Chem.
Soc. 132, 8248 (2010).14J. Holzmann, R. Ludwig, A. Geiger, and D. Paschek, Angew. Chem., Int.
Ed. 46, 8907 (2007).15T. L. Beck, J. Phys. Chem. B 115, 9776 (2011).16J. Alejandre, D. J. Tildesley, and G. A. Chapela, J. Chem. Phys. 102, 4574
(1995).17C. D. Cappa, J. D. Smith, K. R. Wilson, B. M. Messer, M. K. Gilles, R. C.
Cohen, and R. J. Saykally, J. Phys. Chem. B 109, 7046 (2005).18L. A. Naslund, D. C. Edwards, P. Wernet, U. Bergmann, H. Ogasawara, L.
G. M. Pettersson, S. Myneni, and A. Nilsson, J. Phys. Chem. A 109, 5995(2005).
19A. W. Omta, M. F. Kropman, S. Woutersen, and H. J. Bakker, Science 301,347 (2003).
20J. Smith, and P. Saykally, and R. Geissler, J. Am. Chem. Soc. 129, 13847(2007).
21D. A. Schmidt, O. Birer, S. Funkner, B. P. Born, R. Gnanasekaran, G. W.Schwaab, D. M. Leitner, and M. Havenith, J. Am. Chem. Soc. 131, 18512(2009).
22S. Funkner, G. Niehues, D. A. Schmidt, M. Heyden, G. Schwaab, K. M.Callahan, D. J. Tobias, and M. Havenith, J. Am. Chem. Soc. 134, 1030(2012).
23J. L. Finney, D. T. Bowron, R. M. Daniel, P. Timmins, and M. A. Roberts,Biophys. Chem. 105, 391 (2003).
24P. Buchanan, N. Aldiwan, A. K. Soper, J. L. Creek, and C. A. Koh, Chem.Phys. Lett. 415, 89 (2005).
25A. Soper and K. Weckstrom, Biophys. Chem. 124, 180 (2006).26R. Mancinelli, A. Botti, F. Bruni, M. A. Ricci, and A. K. Soper, Phys.
Chem. Chem. Phys. 9, 2959 (2007).27J. Chandrasekhar and W. L. Jorgensen, J. Chem. Phys. 77, 5080 (1982).28I. Mayer, I. Lukovits, and T. Radnai, Chem. Phys. Lett. 188, 595 (1992).29S. B. Zhu and G. W. Robinson, J. Chem. Phys. 97, 4336 (1992).30A. Tongraar, K. R. Liedl, and B. M. Rode, J. Phys. Chem. A 102, 10340
(1998).31J. Higo, M. Sasai, H. Shirai, H. Nakamura, and T. Kugimiya, Proc. Natl.
Acad. Sci. U.S.A. 98, 5961 (2001).32M. Carrillo-Tripp, H. Saint-Martin, and I. Ortega-Blake, J. Chem. Phys.
118, 7062 (2003).33V. Vchirawongkwin, T. S. Hofer, B. R. Randolf, and B. M. Rode, J. Com-
put. Chem. 28, 1006 (2007).34G. Chopra and M. Levitt, Proc. Natl. Acad. Sci. U.S.A. 108, 14455 (2011).35I. I. Vaisman, F. K. Brown, and A. Tropsha, J. Phys. Chem. 98, 5559
(1994).36N. Galamba, J. Phys. Chem. B 116, 5242 (2012).37M. Mezei and D. L. Beveridge, J. Chem. Phys. 74, 622 (1981).38J. Chandrasekhar, D. C. Spellmeyer, and W. L. Jorgensen, J. Am. Chem.
Soc. 106, 903 (1984).39S. Obst and H. Bradaczek, J. Phys. Chem. 100, 15677 (1996).40J. A. White, E. Schwegler, G. Galli, and F. Gygi, J. Chem. Phys. 113, 4668
(2000).41E. Guardia, J. Marti, L. Garcia-Tarres, and D. Laria, J. Mol. Liq. 117, 63
(2005).42E. Guardia, D. Laria, and J. Marti, J. Phys. Chem. B 110, 6332 (2006).43H. J. Kulik, N. Marzari, A. A. Correa, D. Prendergast, E. Schwegler, and
G. Galli, J. Phys. Chem. B 114, 9594 (2010).44Q. Du, E. Freysz, and Y. R. Shen, Science 264, 826 (1994).45E. A. Raymond, T. L. Tarbuck, M. G. Brown, and G. L. Richmond,
J. Phys. Chem. B 107, 546 (2003).46C. S. Tian and Y. R. Shen, Chem. Phys. Lett. 470, 1 (2009).47I. V. Stiopkin, C. Weeraman, P. A. Pieniazek, F. Y. Shalhout, J. L. Skinner,
and A. V. Benderskii, Nature (London) 474, 192 (2011).48S. Nihonyanagi, T. Ishiyama, T. Lee, S. Yamaguchi, M. Bonn, A. Morita,
and T. Tahara, J. Am. Chem. Soc. 133, 16875 (2011).49P. A. Pieniazek, C. J. Tainter, and J. L. Skinner, J. Chem. Phys. 135,
044701 (2011).50I. F. W. Kuo, C. J. Mundy, B. L. Eggimann, M. J. McGrath, J. I. Siepmann,
B. Chen, J. Vieceli, and D. J. Tobias, J. Phys. Chem. B 110, 3738 (2006).51G. Murdachaew, C. J. Mundy, G. K. Schenter, T. Laino, and J. Hutter,
J. Phys. Chem. A 115, 6046 (2011).52T. D. Kuhne, T. A. Pascal, E. Kaxiras, and Y. Jung, J. Phys. Chem. Lett. 2,
105 (2011).53M. D. Baer, C. J. Mundy, M. J. McGrath, I. F. W. Kuo, J. I. Siepmann, and
D. J. Tobias, J. Chem. Phys. 135, 124712 (2011).54D. Chakraborty and A. Chandra, Chem. Phys. 392, 96 (2012).55Y. B. Fan and Y. Q. Gao, J. Phys. Chem. B 114, 4246 (2010).56K. D. Collins, G. W. Neilson, and J. E. Enderby, Biophys. Chem. 128, 95
(2007).57D. Paschek and R. Ludwig, Angew. Chem. Int. Ed. 50, 352 (2011).58B. Guillot and Y. Guissani, J. Chem. Phys. 99, 8075 (1993).59J. Aqvist, J. Phys. Chem. 94, 8021 (1990).60T. Fox and P. A. Kollman, J. Phys. Chem. B 102, 8070 (1998).61C. A. Gough, S. E. Debolt, and P. A. Kollman, J. Comput. Chem. 13, 963
(1992).62S. J. Weiner, P. A. Kollman, D. T. Nguyen, and D. A. Case, J. Comput.
Chem. 7, 230 (1986).63J. L. F. Abascal and C. Vega, J. Chem. Phys. 123, 234505 (2005).64D. A. Case, T. A. Darden, T. E. Cheatham III, C. I. Simmerling, J. Wang,
R. E. Duke, R. Luo, K. M. Merz, D. A. Pearlman, M. Crowley, R. C.Walker, W. Zhang, B. Wang, S. Hayik, A. Roitberg, G. Seabra, K. F. Wong,F. Paesani, X. Wu, S. Brozell, V. Tsui, H. Gohlke, L. Yang, C. Tan, J.Mongan, V. Hornak, G. Cui, P. Beroza, H. Mathews, D. C. Schafmeister,W. S. Ross, and P. A. Kollman, AMBER 9 (University of California, SanFrancisco, 2006).
034508-11 S. J. Irudayam and R. H. Henchman J. Chem. Phys. 137, 034508 (2012)
65T. Darden, D. York, and L. Pedersen, J. Chem. Phys. 98, 10089 (1993).66T. Darden, D. Pearlman, and L. G. Pedersen, J. Chem. Phys. 109, 10921
(1998).67I. S. Joung and T. E. Cheatham, J. Phys. Chem. B 112, 9020 (2008).68R. H. Henchman and S. J. Irudayam, J. Phys. Chem. B 114, 16792 (2010).69A. Luzar and D. Chandler, Phys. Rev. Lett. 76, 928 (1996).70H. Ohtaki and T. Radnai, Chem. Rev. 93, 1157 (1993).71S. Swaminathan, S. W. Harrison, and D. L. Beveridge, J. Am. Chem. Soc.
100, 5705 (1978).72D. A. Zichi and P. J. Rossky, J. Chem. Phys. 83, 797 (1985).73K. A. Sharp and B. Madan, J. Phys. Chem. B 101, 4343 (1997).74B. Hribar, N. T. Southall, V. Vlachy, and K. A. Dill, J. Am. Chem. Soc.
124, 12302 (2002).75A. Grossfield, J. Chem. Phys. 122, 024506 (2005).76D. L. Mobley, A. E. Barber, C. J. Fennell, and K. A. Dill, J. Phys. Chem.
B 112, 2405 (2008).77S. J. Irudayam and R. H. Henchman, Mol. Phys. 109, 37 (2011).78I. A. Topol, G. J. Tawa, S. K. Burt, and A. A. Rashin, J. Chem. Phys. 111,
10998 (1999).79M. A. Wilson, A. Pohorille, and L. R. Pratt, J. Phys. Chem. 91, 4873
(1987).80K. A. Motakabbir and M. L. Berkowitz, Chem. Phys. Lett. 176, 61 (1991).81C. D. Cappa, J. D. Smith, K. R. Wilson, and R. J. Saykally, J. Phys.: Con-
dens. Matter 20, 205105 (2008).82C. Y. Lee, J. A. McCammon, and P. J. Rossky, J. Chem. Phys. 80, 4448
(1984).83A. Morita and J. T. Hynes, Chem. Phys. 258, 371 (2000).84Y. T. Wang, N. O. Hodas, Y. S. Jung, and R. A. Marcus, Phys. Chem.
Chem. Phys. 13, 5388 (2011).85A. Geiger, A. Rahman, and F. H. Stillinger, J. Chem. Phys. 70, 263
(1979).86R. Zangi and J. B. F. N. Engberts, J. Am. Chem. Soc. 127, 2272 (2005).87V. Knecht, H. J. Risselada, A. E. Mark, and S. J. Marrink, J. Colloid Inter-
face Sci. 318, 477 (2008).88S. J. Irudayam and R. H. Henchman, J. Phys.: Condens. Matter 22, 284108
(2010).
89S. J. Irudayam, R. D. Plumb, and R. H. Henchman, Faraday Discuss. 45,467 (2010).
90W. M. Latimer, S. P. Pitzer, and C. M. Slansky, J. Chem. Phys. 7, 108(1939).
91B. E. Conway, J. Solution Chem. 7, 721 (1978).92G. Hummer, L. R. Pratt, and A. E. Garcia, J. Phys. Chem. 100, 1206
(1996).93R. M. Lynden-Bell and J. C. Rasaiah, J. Chem. Phys. 107, 1981 (1997).94C. D. Cappa, J. D. Smith, B. M. Messer, R. C. Cohen, and R. J. Saykally,
J. Phys. Chem. B 110, 5301 (2006).95G. R. Desiraju, J. Chem. Soc., Chem. Commun. 1991, 426.96L. Infantes, L. Fabian, and W. D. S. Motherwell, CrystEngComm 9, 65
(2007).97M. Born, Z. Phys. 1, 45 (1920).98R. Schmid, A. M. Miah, and V. N. Sapunov, Phys. Chem. Chem. Phys. 2,
97 (2000).99J. A. V. Butler and W. S. Reid, J. Chem. Soc. 249, 1171 (1936).
100I. M. Barclay and J. A. V. Butler, Trans. Faraday Soc. 34, 1445 (1938).101W. Blokzijl and J. B. F. N. Engberts, Angew. Chem. Int. Ed. 32, 1545
(1993).102Y. Marcus, J. Phys. Chem. B 113, 10285 (2009).103I. Waluyo, C. C. Huang, D. Nordlund, T. M. Weiss, L. G. M. Pettersson,
and A. Nilsson, J. Chem. Phys. 134, 224507 (2011).104I. Waluyo, C. C. Huang, D. Nordlund, U. Bergmann, T. M. Weiss, L. G.
M. Pettersson, and A. Nilsson, J. Chem. Phys. 134, 064513 (2011).105F. H. Stillinger and A. Ben-Naim, J. Chem. Phys. 47, 4431 (1967).106R. S. Taylor, L. X. Dang, and B. C. Garrett, J. Phys. Chem. 100, 11720
(1996).107V. P. Sokhan and D. J. Tildesley, Mol. Phys. 92, 625 (1997).108T. Ishiyama and A. Morita, J. Chem. Phys. 131, 244714 (2009).109R. Vacha, O. Marsalek, A. P. Willard, D. J. Bonthuis, R. R. Netz, and P.
Jungwirth, J. Phys. Chem. Lett. 3, 107 (2012).110See supplementary material at http://dx.doi.org/10.1063/1.4735267 for the
radial distribution functions and non-idealities for the larger boxes andartificial sodium ions.
111Y. J. Zhang and P. S. Cremer, Ann. Rev. Phys. Chem. 61, 63 (2010).