long range transportation plan financial forecast...
TRANSCRIPT

Los Angeles County Metropolitan Transportation Authority
Long Range Transportation Plan
Financial Forecast Update
Attachment B
Financial Forecast Update
LACMTA Board Meeting
March 22, 2012

Long Range Transportation Plan
• Worldwide economic recession– Hit just as Measure R was approved in 2008
• Reduced forecast from $40 B to $36 B
• Long Range Plan adopted October 2009– Depth of recession not yet fully understood
• Forecast captured full recession in April 2010
2
• Forecast captured full recession in April 2010
• LACMTA Board takes action to protect Long RangePlan schedules– Emphasis on project development work
– Measure R schedules preserved
– America Fast Forward (30/10) accelerations sought
• LACMTA Board mandates periodic updates

Worldwide Economic Recession Impacts Tax Forecasts
Through FY 2040:6% decrease
4% decrease
10% totaldecrease
3

Long Range Transportation Plan
• LACMTA Board priorities, policies, and updates ensureLong Range Plan success
• Depth of recession better understood by April 2010
• Lower priority projects deferred from first decade
• Additional borrowing assumed
• Further policy actions taken by LACMTA Board
4
• Further policy actions taken by LACMTA Board– Cost Management Process and Policy
– Measure R Contingency Policy
– State Repayment of Capital Project Loans Fund
– Light Rail Yard Cost Allocations
• Long Range Plan Financial Forecast updates
– April 2010 and November 2011 (this report)

Long Range Plan Financial Update
Board Approved Priorities
5

Board Updates Priorities to Accomplish Measure R
• Board priority-setting was updated in April 2011-- Reporting requirements added for CEO delegations
• Directed staff to report back to Board when transfers occur-- What money was moved and which projects are impacted?
6

Priority-Setting Categories as of April 2011
First Decade Priority-Setting Categories (FY 2011–2019):
1. Projects already under construction: $ 2.76 B2. Projects with bids advertised: $ 2.35 B
Over 100 line items in Category 5 were prioritized into 12 sub-categories
7
2. Projects with bids advertised: $ 2.35 B3. Right-of-way activities/purchases: $ 0.35 B4. Begin or continue all 1st decade
project development phases: $ 1.97 B5. Complete const. of priority projects $10.66 B6. Identify needs for other projects $ 2.02 B
Total $20.11 B

Priority-Setting Categories Deferred
• Two of the 12 construction sub-categories totaling about$1 billion have been deferred to second decade of LRTPby LACMTA Board
– Half deferred in March 2010, half in April 2011
• Priority lines 177 – 185 were wholly deferred in March 2010PriorityLine #
Projects Wholly Deferred in March 2010 2011 Amount(millions)
177 Call for Projects Gateway Cities Traffic Signal Corridor Ph V $ 5.8
8
178 Call for Projects Gateway Cities Traffic Signal Corridor Ph VI $ 10.5
179 Call for Projects San Gabriel Valley Traffic Signal Corridors $ 15.7
180 Call for Projects San Gabriel Valley Traffic Signal Corridors $ 7.8
181 Call for Projects South Bay Traffic Signal Corridors $ 8.3
182 Call for Projects North County Traffic Forum ITS Expansion $ 9.0
183 Future Call for Projects $ 265.0
184 I-405/Arbor Vitae Interchange south half $ 63.4
185 Metrolink capital projects $ 37.6
Total Deferred in March 2010 $ 423.1

Priority-Setting Categories Deferred
PriorityLine #
Projects Partially Deferred or At Risk in April 2011 2011 Amount(millions)
171 Metrolink renovation and rehabilitation $ 62.6
172 Rail System Improvements - Red Line ventilation NorthHollywood
$ 160.0
• Priority lines 171 – 176 were partially deferred in April 2011
9
173 Rail System Improvements - Red Line train control to support2.5 minute headways (in trunk)
$ 60.0
174 Rail System Improvements - Red Line North HollywoodTerminal
$ 94.2
175 Rail System Improvements - Red Line traction power tosupport headways
$ 94.2
176 Rail System Improvements - Red Line Union Station upgradeDivision 20
$ 113.6
Total Deferred or At Risk in April 2011 $ 584.6

Long Range Plan Financial Update
Financial Forecast Update
• Financial forecast is complex and dynamic
We seek to strategically assign funding sources to
10
We seek to strategically assign funding sources tomaximize our ability to achieve the Long RangeTransportation Plan

Long Range Plan Financial Update
• First decade financial forecast changes (FY 2012-2021)– March 2010 forecast compared to November 2011 forecast
• Cost increases (not off-set): ($287 M)
• Sales taxes, fares, & STA revenues are lower: ($480 M)
• Other LACMTA-controlled revenues are up $ 13 M
• Additional borrowing planned: $331 M
• Net LACMTA-controlled revenues are down: ($136 M)
11
• Net LACMTA-controlled revenues are down: ($136 M)
• Total impact ($423 M)
– New Starts process assumptions (Board actions pending)• Westside Subway Extension(to La Cienega, not Fairfax) ($381 M)*
• Regional Connector ($293 M)**
* Board action pending. Off-set by New Starts and transfers from a later phase.
**Board approved motion: “Funding beyond the LRTP cost assumption has not beenidentified.”

Long Range Plan Cost Increases through Oct. 2011
• Capital program cost increases (not off-set by 2021)
Expo Phase I safety enhancements $ 36.6 M
Congestion Reduction Demo. $ 37.2 M
Expo Phase I claims $ 28.5 M
Light Rail Yards Cost Allocation $ 170.0 M*
All others $ 14.7 MAll others $ 14.7 M
Subtotal – not off-set $287.0 M
Union Station purchase $ 69.7 M**Crenshaw/LAX $ 34.4 M***
Total $ 396.4 M
* To be recouped for deferred projects after the year 2021.
** Capital cost increase to be recouped through lease revenues over time.
*** Off-set by cancellation of I-405/Arbor Vitae interchange project.
12

Revenue Sources Update FY 2012-2021 (millions)
Revenue Source Detail (FY 2012-2021) April 2010Forecast
Nov. 2011Forecast
Change Subtotal
Propositions A and C and TDA Sales Taxes $ 20,861 $ 20,676 $ (185)
Measure R Sales Tax $ 8,343 $ 8,256 $ (87)
Metro Fare Revenues $ 4,624 $ 4,491 $ (133)
State Transit Assistance $ 1,065 $ 990 $ (75)
Subtotal ($ 480)
FTA New Starts funds $ 1,701 $ 1,966 $ 265
13
FTA New Starts funds $ 1,701 $ 1,966 $ 265
State Regional Improvement Program $ 1,210 $ 1,153 $ (57)
Interest earnings on Meas. R Hwy & Transit $ 0 $ 38 $ 38
All Other Funds $ 3,053 $ 2,820 $ (233)
Subtotal $ 13
Bond Proceeds Subtotal $ 6,372 $ 6,703 $ 331 $ 331
Subtotal – LACMTA Funds $ 47,229 $47,093 ($ 136)
HOT Lanes Tolls (off-set by related costs) $ 0 $ 187 $ 187
Other Funds – Non-Metro (Reference Only) $ 29,399 $ 30,237 $ 838
TOTAL $ 76,628 $ 77,517 $ 889

Bond Proceeds Update FY 2012-2021 (millions)
Planned Bond Proceed Detail (FY 12-21) April 2010Forecast
Nov. 2011Forecast
Change
Measure R TIFIA Proceeds(Crenshaw /LAX $545 M & West. Sub. Ext. $642 M)
$ 0 $ 1,187 $ 1,187
Measure R 35% Transit(Long-term Bonds and Short-term Commercial Paper )
$ 1,473 $ 820 $ (653)
Measure R 20% Highway Bonds $ 511 $ 420 $ (91)
14
Measure R 2%(Short-term Commercial Paper )
$ 324 $ 144 $ (180)
Subtotal – Measure R $ 2,308 $ 2,571 $ 263
Propositions A and C Bonds $ 4,064 $ 3,082 $ (982)
Capital Grant Receipt Revenue Bonds(in advance of New Starts funds)
$ 0 $ 1,050 $ 1,050
Total $ 6,372 $ 6,703 $ 331

New Starts Assumptions in this Forecast
• Financial forecast assumes LACMTA Board approvalof New Starts Assumptions
• Assumptions improve our New Starts financial rating
• Westside Subway Phase 1 (Terminus at La Cienega,not Fairfax)
– Total cost for all 3 phases does not change– Total cost for all 3 phases does not change
– First phase will now require $381 M more
– Off-set by more New Starts funds & transfers from Phase 2» $176 M more New Starts
» $ 11 M more local agency contribution (transferred from Phase 2)
» $106 M Cost transfer from Phase 2
» Timing overlaps with first phase (FY 2017-2024)
» $ 88 M accelerated (Timing does not overlap w/ 1st phase)
» Funding off-set by deferring Wilshire BRT project15

New Starts Assumptions in this Forecast
• Regional Connector change previously reported
– Regional Connector will require $293 M more
» Refined cost estimate changed from $1,073 M to $1,366 M
– Board approved Regional Connector motion:
» “Funding beyond the LRTP cost assumption [$1,073 M] has notbeen identified.”been identified.”
– Cost increases off-set by more New Starts funds andstation elimination at 5th/Flower» [5th/Flower elimination already assumed in $1,366 M figure]
» $135 M more New Starts
» $ 9 M more local agency contribution
» $149 M from other sources» Leases, Federal formula (RSTP/CMAQ), State Regional Improvement Program
16

Measure RContingency Policy
Long Range Plan Financial Update
17

LRTP Financial Forecast Update
• Implementing Measure R Contingency Policy
– May 2011 Policy: Measure R Bond interest costs may notexceed levels forecasted in April 2010
• Except for America Fast Forward acceleration strategies
• Financial Forecast complies with policy
– Does not comply without grandfathering 2010 bonds– Does not comply without grandfathering 2010 bonds• Build America Bonds (BABs)/tax exempt bond package were issued in November
2010 -- after the 2010 Forecast, before the Measure R contingency policy
• Policy silent on BABs & Measure R interest earnings• BABs pre-dated the policy and were not in the prior forecast
– Updated forecast assumes that BABs package is exempt
• Measure R 35% Transit earnings (to 2039) $415 M
• Measure R 20% Highway earnings (to 2039) $ 91 M– Updated forecast assumes bond interest costs are net of interest earnings
18

LRTP Financial Forecast Update
Measure R 35% Transit
Bond Interest April 2010 November 2011 Above/(Below) Policy(millions)
Gross $ 1,356 $ 2,167 $ 811
Interest Earnings - $ 415
BABs (100% transit?) - $ 474
Net $ 1,356 $ 1,277 ($ 79)
Measure R 20% Highway
19
Measure R 20% Highway
Bond Interest April 2010 November 2011 Above/(Below) Policy(millions)
Gross $ 490 $ 519 $ 29
Interest Earnings $ 91
BABs (100% transit?) TBD
Net $ 490 $ 428 ($ 62)
April 2010 November 2011 Above/(Below) Policy(millions)
Total Net $ 1,846 $ 1,705 ($ 141)

LRTP Financial Forecast Update
• Impact of not grandfathering BABs
– More first decade projects would be delayed byrestricted borrowing
• Approximately $220 M of projects next lowest inline on priority list would be delayed
20

Measure RAdvance Funding Policy
Long Range Plan Financial Update
21
Advance Funding Policy

Measure R Advance Funding Policy: FY 2011 Budget
• FY 2011 Budget Policy Action: Funding advanced ahead ofMeasure R schedules must be repaid
• Clarifications necessary to avoid LRTP impacts– Applies only to Measure R projects with a “Funds Available Beginning”
date of July 1, 2011 or later:• Regional Connector
• Gold Line Eastside Extension• Gold Line Eastside Extension
• Green Line Extension: Redondo Beach Station to South Bay Corridor
• San Fernando Valley I-405 Corridor Connection (match to total project cost)
• San Fernando Valley East North-South Rapidways – project acceleration
• West Santa Ana Branch Corridor (match to total project cost)
• Westside Subway Extension – to be opened in segments
– Applies to FY 2011 and beyond (FY 2010 and prior exempted)
– Applies only to LACMTA’s own funds (mainly State Loan Repayments)
– Repayments must occur before “Expected Completion” column date
– Repayments may be planned for subsequent project segments per LRTP
22

Project Repaying From ItsMeasure R Funds
Estimated AmountTo Be Repaid
Account ToBe Repaid
Year To BeRepaid
East San Fernando Valley North-South Corridor
$ 0.14 M SRCPL* FY 2013
East San Fernando Valley North-South Corridor
$ 2.40 M Prop. C 25% FY 2018
Regional Connector $ 64.63 M SRCPL FY 2019
Westside Subway Extension Phase I $104.42 M SRCPL FY 2021
Measure R Advance Funding Policy: FY 2011 Budget
23
Westside Subway Extension Phase I $104.42 M SRCPL FY 2021
Eastside Extension Phase II $ 9.00 M SRCPL FY 2024
Eastside Extension Phase II $ 0.10 M SRCPL FY 2025
West Santa Ana Branch $ 0.54 M Prop. C 25% FY 2025
South Bay Green Line Extension $ 3.63 M SRCPL FY 2029
TOTAL $ 184.9 M
*State Repayment of Capital Project Loans fund

Other Issues
Long Range Plan Financial Update
24

Other Issues
• ADA compliance needs expected to exceed LRTP set-asides
• Uncertain State funding situation
• Reauthorization of Federal Funds “MAP-21”
– Two-Year bill avoids highway formula cuts to LA• State implementation decisions probably required
– Includes America Fast Forward TIFIA changes
• America Fast Forward (locally 30/10)• America Fast Forward (locally 30/10)– Congressional support needed for QTIBs*
– Requires New Starts program commitments
– Alternatives approaches under study
• Senator Wyden’s TRIPs bill– Transportation and Regional Infrastructure Project bonds to be distributed as grants
• Sovereign Wealth Funds – potential private international financing
• Extend Measure R with expanded TIFIA borrowing
25* Proposed Qualified Transportation Improvement Bonds would include a federal tax credit in lieu of interest costs.

Funding For Ten LargestProjects
Long Range Plan Financial Update
26
Projects

Ten Largest Projects by Dollar Value
27

Funding Strategy Changes for 10 Largest Projects (by Dollar Value)
AppendixAppendix
28
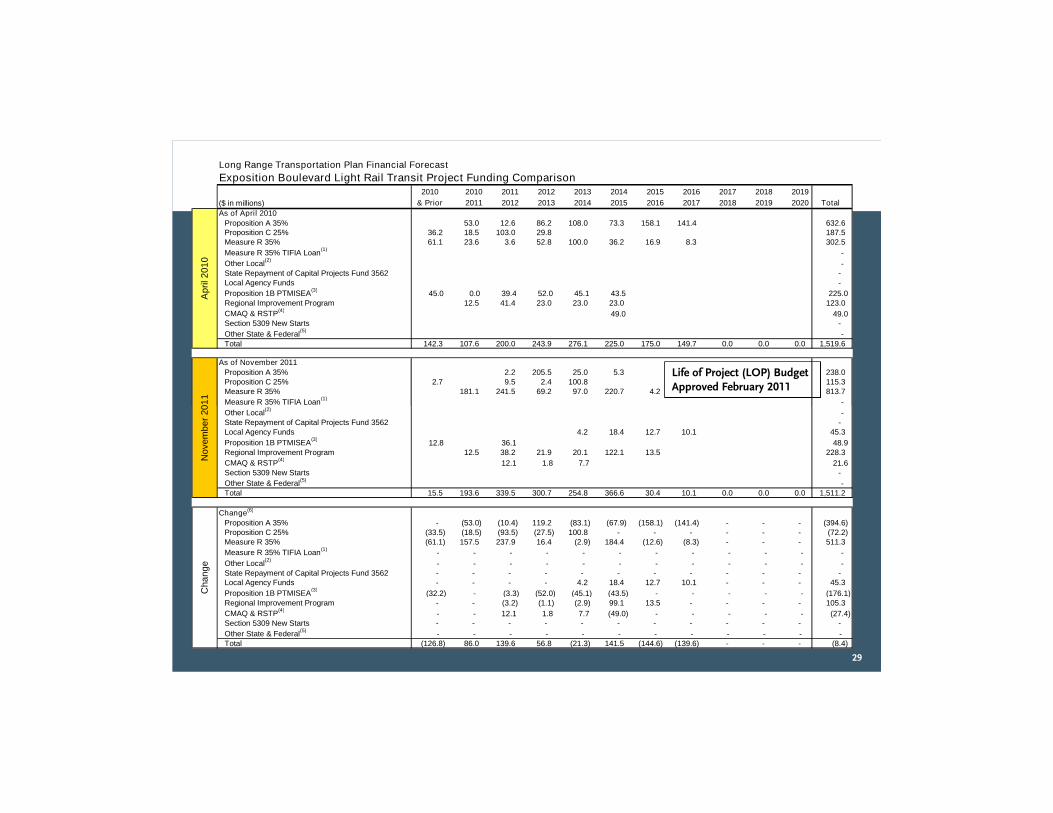
Long Range Transportation Plan Financial Forecast
Exposition Boulevard Light Rail Transit Project Funding Comparison2010 2010 2011 2012 2013 2014 2015 2016 2017 2018 2019
($ in millions) & Prior 2011 2012 2013 2014 2015 2016 2017 2018 2019 2020 Total
As of April 2010
Proposition A 35% 53.0 12.6 86.2 108.0 73.3 158.1 141.4 632.6Proposition C 25% 36.2 18.5 103.0 29.8 187.5Measure R 35% 61.1 23.6 3.6 52.8 100.0 36.2 16.9 8.3 302.5
Measure R 35% TIFIA Loan(1)
-
Other Local(2)
-State Repayment of Capital Projects Fund 3562 -Local Agency Funds -
Proposition 1B PTMISEA(3)
45.0 0.0 39.4 52.0 45.1 43.5 225.0Regional Improvement Program 12.5 41.4 23.0 23.0 23.0 123.0
CMAQ & RSTP(4)
49.0 49.0Section 5309 New Starts -
Other State & Federal(5)
-Total 142.3 107.6 200.0 243.9 276.1 225.0 175.0 149.7 0.0 0.0 0.0 1,519.6
As of November 2011
Proposition A 35% 2.2 205.5 25.0 5.3 238.0Proposition C 25% 2.7 9.5 2.4 100.8 115.3Measure R 35% 181.1 241.5 69.2 97.0 220.7 4.2 813.7
Measure R 35% TIFIA Loan(1)
-
Ap
ril2
01
0N
ovem
be
r20
11
Life of Project (LOP) BudgetApproved February 2011
29
Measure R 35% TIFIA Loan -
Other Local(2)
-State Repayment of Capital Projects Fund 3562 -Local Agency Funds 4.2 18.4 12.7 10.1 45.3
Proposition 1B PTMISEA(3)
12.8 36.1 48.9Regional Improvement Program 12.5 38.2 21.9 20.1 122.1 13.5 228.3
CMAQ & RSTP(4)
12.1 1.8 7.7 21.6Section 5309 New Starts -
Other State & Federal(5)
-Total 15.5 193.6 339.5 300.7 254.8 366.6 30.4 10.1 0.0 0.0 0.0 1,511.2
Change(6)
Proposition A 35% - (53.0) (10.4) 119.2 (83.1) (67.9) (158.1) (141.4) - - - (394.6)Proposition C 25% (33.5) (18.5) (93.5) (27.5) 100.8 - - - - - - (72.2)Measure R 35% (61.1) 157.5 237.9 16.4 (2.9) 184.4 (12.6) (8.3) - - - 511.3
Measure R 35% TIFIA Loan(1)
- - - - - - - - - - - -
Other Local(2)
- - - - - - - - - - - -State Repayment of Capital Projects Fund 3562 - - - - - - - - - - - -Local Agency Funds - - - - 4.2 18.4 12.7 10.1 - - - 45.3
Proposition 1B PTMISEA(3)
(32.2) - (3.3) (52.0) (45.1) (43.5) - - - - - (176.1)Regional Improvement Program - - (3.2) (1.1) (2.9) 99.1 13.5 - - - - 105.3
CMAQ & RSTP(4)
- - 12.1 1.8 7.7 (49.0) - - - - - (27.4)Section 5309 New Starts - - - - - - - - - - - -
Other State & Federal(5)
- - - - - - - - - - - -Total (126.8) 86.0 139.6 56.8 (21.3) 141.5 (144.6) (139.6) - - - (8.4)
No
vem
be
r20
11
Cha
ng
e

Long Range Transportation Plan Financial Forecast
Gold Line Foothill Light Rail Transit Extension Project Funding Comparison2010 2010 2011 2012 2013 2014 2015 2016 2017 2018 2019
($ in millions) & Prior 2011 2012 2013 2014 2015 2016 2017 2018 2019 2020* Total
As of April 2010
Proposition A 35% 75.5 75.5Proposition C 25% -Measure R 35% 10.3 66.9 75.5 93.9 100.9 96.6 59.7 51.3 74.6 60.0 45.4 735.0
Measure R 35% TIFIA Loan(1)
-
Other Local(2)
-State Repayment of Capital Projects Fund 3562 -Local Agency Funds 2.5 23.0 25.5
Proposition 1B PTMISEA(3)
-Regional Improvement Program -
CMAQ & RSTP(4)
-Section 5309 New Starts -
Other State & Federal(5)
15.0 15.0Total 25.3 66.9 75.5 96.4 123.9 96.6 59.7 51.3 74.6 60.0 120.9 851.1
As of November 2011
Proposition A 35% 42.1 33.5 75.6Proposition C 25% -Measure R 35% 49.7 92.0 183.6 205.6 110.8 42.7 47.7 2.0 1.0 735.0
Measure R 35% TIFIA Loan(1)
-(2)
Ap
ril2
01
0N
ove
mber
201
1
30
Other Local(2)
-State Repayment of Capital Projects Fund 3562 -Local Agency Funds 2.5 23.0 25.5
Proposition 1B PTMISEA(3)
-Regional Improvement Program -
CMAQ & RSTP(4)
-Section 5309 New Starts -
Other State & Federal(5)
15.0 15.0Total 15.0 49.7 92.0 186.1 228.6 110.8 42.7 47.7 44.1 34.5 0.0 851.1
Change(6)
Proposition A 35% - - - - - - - - 42.1 33.5 (75.5) 0.1Proposition C 25% - - - - - - - - - - - -Measure R 35% (10.3) (17.3) 16.5 89.7 104.7 14.2 (17.0) (3.6) (72.6) (59.0) (45.4) (0.0)
Measure R 35% TIFIA Loan(1)
- - - - - - - - - - - -
Other Local(2)
- - - - - - - - - - - -State Repayment of Capital Projects Fund 3562 - - - - - - - - - - - -Local Agency Funds - - - - - - - - - - - -
Proposition 1B PTMISEA(3)
- - - - - - - - - - - -Regional Improvement Program - - - - - - - - - - - -
CMAQ & RSTP(4)
- - - - - - - - - - - -Section 5309 New Starts - - - - - - - - - - - -
Other State & Federal(5)
- - - - - - - - - - - -Total (10.3) (17.3) 16.5 89.7 104.7 14.2 (17.0) (3.6) (30.5) (25.5) (120.9) 0.0
*April 2010 amount includes $60.9 M shown in FY 2021.
Nove
mber
201
1C
hang
e
LOP Budget ApprovedMarch 2011
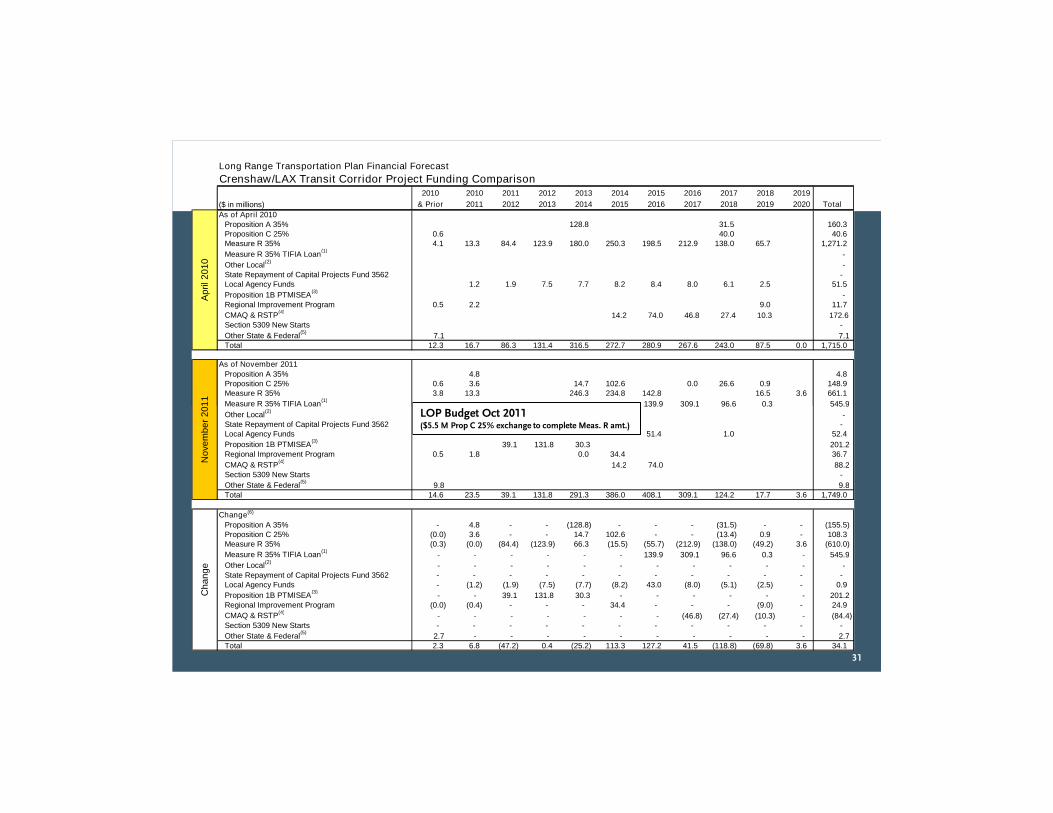
Long Range Transportation Plan Financial Forecast
Crenshaw/LAX Transit Corridor Project Funding Comparison2010 2010 2011 2012 2013 2014 2015 2016 2017 2018 2019
($ in millions) & Prior 2011 2012 2013 2014 2015 2016 2017 2018 2019 2020 Total
As of April 2010
Proposition A 35% 128.8 31.5 160.3Proposition C 25% 0.6 40.0 40.6Measure R 35% 4.1 13.3 84.4 123.9 180.0 250.3 198.5 212.9 138.0 65.7 1,271.2
Measure R 35% TIFIA Loan(1)
-
Other Local(2)
-State Repayment of Capital Projects Fund 3562 -Local Agency Funds 1.2 1.9 7.5 7.7 8.2 8.4 8.0 6.1 2.5 51.5
Proposition 1B PTMISEA(3)
-Regional Improvement Program 0.5 2.2 9.0 11.7
CMAQ & RSTP(4)
14.2 74.0 46.8 27.4 10.3 172.6Section 5309 New Starts -
Other State & Federal(5)
7.1 7.1Total 12.3 16.7 86.3 131.4 316.5 272.7 280.9 267.6 243.0 87.5 0.0 1,715.0
As of November 2011
Proposition A 35% 4.8 4.8Proposition C 25% 0.6 3.6 14.7 102.6 0.0 26.6 0.9 148.9Measure R 35% 3.8 13.3 246.3 234.8 142.8 16.5 3.6 661.1
Measure R 35% TIFIA Loan(1)
139.9 309.1 96.6 0.3 545.9
Ap
ril2
010
No
vem
be
r2
01
1
31
Measure R 35% TIFIA Loan 139.9 309.1 96.6 0.3 545.9
Other Local(2)
-State Repayment of Capital Projects Fund 3562 -Local Agency Funds 51.4 1.0 52.4
Proposition 1B PTMISEA(3)
39.1 131.8 30.3 201.2Regional Improvement Program 0.5 1.8 0.0 34.4 36.7
CMAQ & RSTP(4)
14.2 74.0 88.2Section 5309 New Starts -
Other State & Federal(5)
9.8 9.8Total 14.6 23.5 39.1 131.8 291.3 386.0 408.1 309.1 124.2 17.7 3.6 1,749.0
Change(6)
Proposition A 35% - 4.8 - - (128.8) - - - (31.5) - - (155.5)Proposition C 25% (0.0) 3.6 - - 14.7 102.6 - - (13.4) 0.9 - 108.3Measure R 35% (0.3) (0.0) (84.4) (123.9) 66.3 (15.5) (55.7) (212.9) (138.0) (49.2) 3.6 (610.0)
Measure R 35% TIFIA Loan(1)
- - - - - - 139.9 309.1 96.6 0.3 - 545.9
Other Local(2)
- - - - - - - - - - - -State Repayment of Capital Projects Fund 3562 - - - - - - - - - - - -Local Agency Funds - (1.2) (1.9) (7.5) (7.7) (8.2) 43.0 (8.0) (5.1) (2.5) - 0.9
Proposition 1B PTMISEA(3)
- - 39.1 131.8 30.3 - - - - - - 201.2Regional Improvement Program (0.0) (0.4) - - - 34.4 - - - (9.0) - 24.9
CMAQ & RSTP(4)
- - - - - - - (46.8) (27.4) (10.3) - (84.4)Section 5309 New Starts - - - - - - - - - - - -
Other State & Federal(5)
2.7 - - - - - - - - - - 2.7Total 2.3 6.8 (47.2) 0.4 (25.2) 113.3 127.2 41.5 (118.8) (69.8) 3.6 34.1
No
vem
be
r2
01
1C
ha
ng
e
LOP Budget Oct 2011($5.5 M Prop C 25% exchange to complete Meas. R amt.)
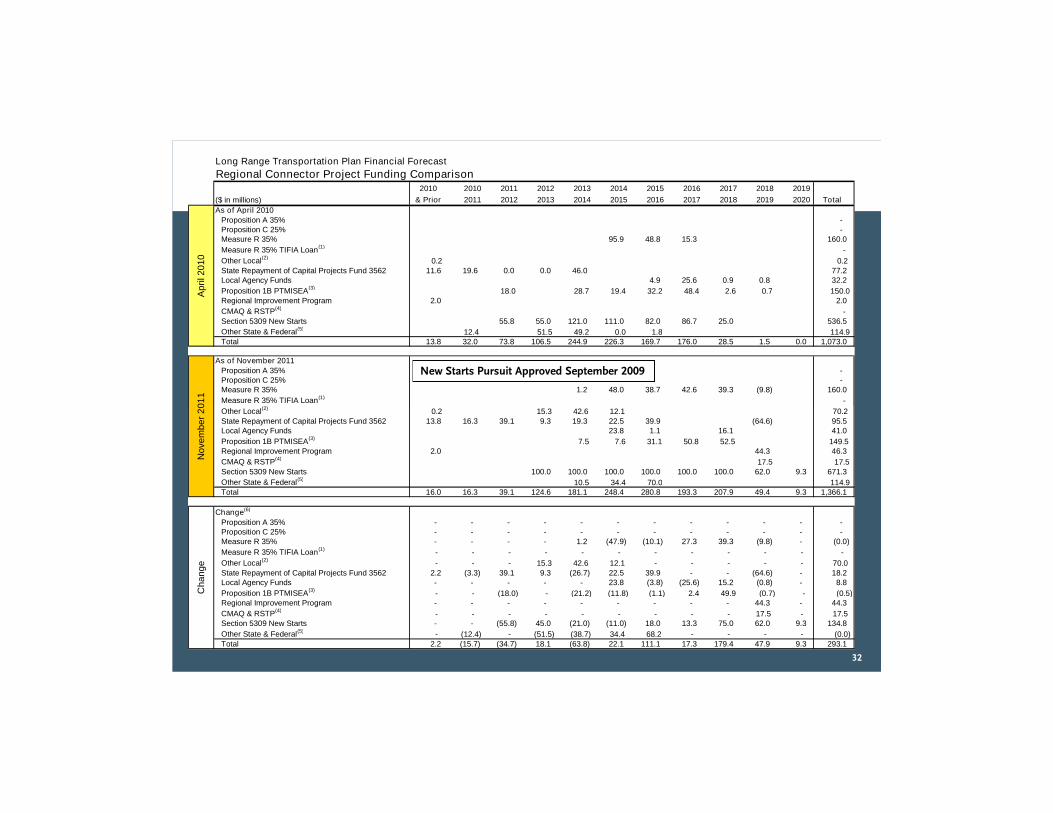
Long Range Transportation Plan Financial Forecast
Regional Connector Project Funding Comparison2010 2010 2011 2012 2013 2014 2015 2016 2017 2018 2019
($ in millions) & Prior 2011 2012 2013 2014 2015 2016 2017 2018 2019 2020 Total
As of April 2010
Proposition A 35% -Proposition C 25% -Measure R 35% 95.9 48.8 15.3 160.0
Measure R 35% TIFIA Loan(1)
-
Other Local(2)
0.2 0.2State Repayment of Capital Projects Fund 3562 11.6 19.6 0.0 0.0 46.0 77.2Local Agency Funds 4.9 25.6 0.9 0.8 32.2
Proposition 1B PTMISEA(3)
18.0 28.7 19.4 32.2 48.4 2.6 0.7 150.0Regional Improvement Program 2.0 2.0
CMAQ & RSTP(4)
-Section 5309 New Starts 55.8 55.0 121.0 111.0 82.0 86.7 25.0 536.5
Other State & Federal(5)12.4 51.5 49.2 0.0 1.8 114.9
Total 13.8 32.0 73.8 106.5 244.9 226.3 169.7 176.0 28.5 1.5 0.0 1,073.0
As of November 2011
Proposition A 35% -Proposition C 25% -Measure R 35% 1.2 48.0 38.7 42.6 39.3 (9.8) 160.0
Measure R 35% TIFIA Loan(1)-
(2)
Ap
ril2
01
0N
ove
mb
er
20
11
New Starts Pursuit Approved September 2009
32
Other Local(2)0.2 15.3 42.6 12.1 70.2
State Repayment of Capital Projects Fund 3562 13.8 16.3 39.1 9.3 19.3 22.5 39.9 (64.6) 95.5Local Agency Funds 23.8 1.1 16.1 41.0
Proposition 1B PTMISEA(3)
7.5 7.6 31.1 50.8 52.5 149.5Regional Improvement Program 2.0 44.3 46.3
CMAQ & RSTP(4)
17.5 17.5Section 5309 New Starts 100.0 100.0 100.0 100.0 100.0 100.0 62.0 9.3 671.3
Other State & Federal(5)10.5 34.4 70.0 114.9
Total 16.0 16.3 39.1 124.6 181.1 248.4 280.8 193.3 207.9 49.4 9.3 1,366.1
Change(6)
Proposition A 35% - - - - - - - - - - - -Proposition C 25% - - - - - - - - - - - -Measure R 35% - - - - 1.2 (47.9) (10.1) 27.3 39.3 (9.8) - (0.0)
Measure R 35% TIFIA Loan(1)
- - - - - - - - - - - -
Other Local(2)
- - - 15.3 42.6 12.1 - - - - - 70.0State Repayment of Capital Projects Fund 3562 2.2 (3.3) 39.1 9.3 (26.7) 22.5 39.9 - - (64.6) - 18.2Local Agency Funds - - - - - 23.8 (3.8) (25.6) 15.2 (0.8) - 8.8
Proposition 1B PTMISEA(3)
- - (18.0) - (21.2) (11.8) (1.1) 2.4 49.9 (0.7) - (0.5)Regional Improvement Program - - - - - - - - - 44.3 - 44.3
CMAQ & RSTP(4)
- - - - - - - - - 17.5 - 17.5Section 5309 New Starts - - (55.8) 45.0 (21.0) (11.0) 18.0 13.3 75.0 62.0 9.3 134.8
Other State & Federal(5)- (12.4) - (51.5) (38.7) 34.4 68.2 - - - - (0.0)
Total 2.2 (15.7) (34.7) 18.1 (63.8) 22.1 111.1 17.3 179.4 47.9 9.3 293.1
No
ve
mb
er
20
11
Ch
an
ge

Long Range Transportation Plan Financial Forecast
Westside Subway Extension- "to be opened in segments"* Phase 1 Project Funding Comparison2010 2010 2011 2012 2013 2014 2015 2016 2017 2018 2020
($ in millions) & Prior 2011 2012 2013 2014 2015 2016 2017 2018 2019 & Beyond Total
As of April 2010
Proposition A 35% -Proposition C 25% -Measure R 35% 109.6 173.2 140.3 188.1 143.4 103.0 5.9 863.4
Measure R 35% TIFIA Loan(1)
-
Other Local(2)
6.2 6.2State Repayment of Capital Projects Fund 3562 12.2 16.5 74.2 (46.5) 56.5Local Agency Funds** 1.3 2.8 5.8 4.6 6.3 9.1 8.8 7.3 1.0 46.9
Proposition 1B PTMISEA(3)
-Regional Improvement Program 2.9 2.9
CMAQ & RSTP(4)
-Section 5309 New Starts 80.0 195.0 129.0 139.0 168.0 124.0 134.0 5.1 974.1
Other State & Federal(5)
-Total 21.3 17.8 157.0 263.9 306.8 285.6 365.2 276.2 244.3 11.9 0.0 1,950.0
As of November 2011
Proposition A 35% -Proposition C 25% -Measure R 35% 10.5 0.0 169.5 85.6 0.0 0.0 0.0 104.4 370.0
Measure R 35% TIFIA Loan(1)
282.0 182.0 113.3 63.5 640.8
Other Local(2)
6.0 2.5 8.5State Repayment of Capital Projects Fund 3562 11.3 34.9 69.5 0.0 (104.4) 11.3
Ap
ril2
01
0N
ove
mb
er
201
1
New Starts Pursuit Approved September 2009
33
State Repayment of Capital Projects Fund 3562 11.3 34.9 69.5 0.0 (104.4) 11.3Local Agency Funds 34.2 29.4 6.2 69.9
Proposition 1B PTMISEA(3)
-Regional Improvement Program 2.9 2.9
CMAQ & RSTP(4)
4.4 45.7 12.1 15.4 77.7Section 5309 New Starts 100.0 100.0 100.0 100.0 100.0 100.0 100.0 450.4 1,150.4
Other State & Federal(5)
-Total 20.2 34.9 69.5 113.0 100.0 269.5 219.8 415.9 333.9 225.4 529.2 2,331.4
Change(6)
Proposition A 35% - - - - - - - - - - - -Proposition C 25% - - - - - - - - - - - -Measure R 35% - - - (99.1) (173.2) 29.2 (102.5) (143.4) (103.0) (5.9) 104.4 (493.4)
Measure R 35% TIFIA Loan(1)
- - - - - - - 282.0 182.0 113.3 63.5 640.8
Other Local(2)
(0.2) - - 2.5 - - - - - - - 2.3State Repayment of Capital Projects Fund 3562 (0.9) 18.4 (4.7) 46.5 - - - - - - (104.4) (45.1)Local Agency Funds - (1.3) (2.8) (5.8) (4.6) (6.3) 25.1 20.6 (1.1) (1.0) - 22.9
Proposition 1B PTMISEA(3)
- - - - - - - - - - - -Regional Improvement Program - - - - - - - - - - - -
CMAQ & RSTP(4)
- - - - - - - 4.4 45.7 12.1 15.4 77.7Section 5309 New Starts - - (80.0) (95.0) (29.0) (39.0) (68.0) (24.0) (34.0) 94.9 450.4 176.3
Other State & Federal(5)
- - - - - - - - - - - -Total (1.1) 17.1 (87.5) (150.9) (206.8) (16.1) (145.4) 139.7 89.6 213.5 529.2 381.4Cost shift from second phase (2017-2024) 20.1 171.8 49.4 (346.9) (105.7)Total (1.1) 17.1 (87.5) (150.9) (206.8) (16.1) (145.4) 159.7 261.3 262.9 182.4 275.7
*The first phase now includes work between Fairfax and La Cienega formerly assumed to be in the second phase.**Local Agency contribution of 3% of $1,950 M should have been $58.5 M instead of $46.9 M.
No
vem
be
r2
01
1C
han
ge

Long Range Transportation Plan Financial Forecast
Interstate 5 North Carpool Lanes from State Route 170 to State Route 134 Project Funding Comparison2010 2010 2011 2012 2013 2014 2015 2016 2017 2018 2019
($ in millions) & Prior 2011 2012 2013 2014 2015 2016 2017 2018 2019 2020 Total
As of April 2010
Proposition C 25% 60.1 5.5 64.2 72.8 65.6 42.7 63.2 22.4 39.4 436.0Proposition C 10% -Measure R 20% 9.0 9.0 18.0Local Agency Funds -
Proposition 1B CMIA(7)
23.7 21.9 21.9 5.5 73.0
Proposition 1B SLPP(8)
-Proposition 1B Highway-Railroad Crossing Safety -Traffic Congestion Relief Program -
CMAQ & RSTP(4)
13.3 13.3Regional Improvement Program 45.2 30.5 38.2 0.0 4.5 13.2 32.1 163.7
Other State & Federal(5)
15.1 31.5 1.1 47.7To Be Determined Highway Strategy Funding -Total 133.7 67.5 102.4 72.8 70.1 79.6 118.3 53.3 53.9 0.0 0.0 751.7
As of November 2011
Proposition C 25% 60.2 5.5 1.5 104.3 65.6 32.0 269.1Proposition C 10% -Measure R 20% -Local Agency Funds -
Ap
ril2
01
0N
ove
mb
er
20
11
34
Local Agency Funds -
Proposition 1B CMIA(7)
23.7 21.9 21.9 5.5 73.0
Proposition 1B SLPP(8)
20.0 11.2 31.2Proposition 1B Highway-Railroad Crossing Safety -Traffic Congestion Relief Program -
CMAQ & RSTP(4)
13.3 88.7 20.3 122.3Regional Improvement Program 58.6 116.4 175.0
Other State & Federal(5)
36.1 25.0 2.2 63.3To Be Determined Highway Strategy Funding -Total 168.2 119.2 160.4 115.5 65.6 55.7 21.9 21.9 5.5 0.0 0.0 733.9
Change(6)
Proposition C 25% 0.0 - (62.7) 31.5 - (10.7) (63.2) (22.4) (39.4) - - (166.9)Proposition C 10% - - - - - - - - - - - -Measure R 20% - - - - - - - (9.0) (9.0) - - (18.0)Local Agency Funds - - - - - - - - - - - -
Proposition 1B CMIA(7)
- - - - - - - - - - - -
Proposition 1B SLPP(8)
- - 20.0 11.2 - - - - - - - 31.2Proposition 1B Highway-Railroad Crossing Safety - - - - - - - - - - - -Traffic Congestion Relief Program - - - - - - - - - - - -
CMAQ & RSTP(4)
(0.0) 88.7 20.3 - - - - - - - - 109.0Regional Improvement Program 13.4 (30.5) 78.2 - (4.5) (13.2) (32.1) - - - - 11.3
Other State & Federal(5)
21.0 (6.5) 2.2 - - - (1.1) - - - - 15.6To Be Determined Highway Strategy Funding - - - - - - - - - - - -Total 34.4 51.7 58.0 42.7 (4.5) (23.9) (96.4) (31.4) (48.4) - - (17.8)
No
vem
be
r2
01
1C
ha
ng
e
CEO Changes to Utilize State & Federal Funds First

Long Range Transportation Plan Financial Forecast
Interstate 405 Northbound Carpool Lanes from Interstate 10 to US-101 Project Funding Comparison2010 2010 2011 2012 2013 2014 2015 2016 2017 2018 2019
($ in millions) & Prior 2011 2012 2013 2014 2015 2016 2017 2018 2019 2020 Total
As of April 2010
Proposition C 25% 2.0 5.0 3.0 3.0 13.0Proposition C 10% -Measure R 20% -Local Agency Funds -
Proposition 1B CMIA(7)
44.3 284.0 222.0 63.7 614.0
Proposition 1B SLPP(8)
-Proposition 1B Highway-Railroad Crossing Safety -Traffic Congestion Relief Program 42.0 8.0 8.0 8.0 8.0 8.0 8.0 90.0
CMAQ & RSTP(4)
7.1 3.0 10.1Regional Improvement Program -
Other State & Federal(5)
138.7 131.0 16.0 21.2 306.9To Be Determined Highway Strategy Funding -Total 227.0 427.1 252.0 95.9 8.0 8.0 8.0 8.0 0.0 0.0 0.0 1,034.0
As of November 2011
Proposition C 25% 2.0 5.0 6.0 13.0Proposition C 10% -Measure R 20% -Local Agency Funds 6.0 6.0
Ap
ril20
10
No
vem
be
r2
011
LOP Budget ApprovedApril 2009
LOP Budget AmendedFebruary 2011
35
Local Agency Funds 6.0 6.0
Proposition 1B CMIA(7)
44.3 26.9 210.0 281.8 51.0 614.0
Proposition 1B SLPP(8)
-Proposition 1B Highway-Railroad Crossing Safety -Traffic Congestion Relief Program 42.0 8.0 8.0 8.0 8.0 8.0 8.0 90.0
CMAQ & RSTP(4)
7.1 3.0 10.1Regional Improvement Program -
Other State & Federal(5)
138.7 131.0 16.0 21.2 306.9To Be Determined Highway Strategy Funding -Total 227.0 165.0 242.0 317.0 65.0 8.0 8.0 8.0 0.0 0.0 0.0 1,040.0
Change(6)
Proposition C 25% - (5.0) 2.0 3.0 - - - - - - - -Proposition C 10% - - - - - - - - - - - -Measure R 20% - - - - - - - - - - - -Local Agency Funds - - - - 6.0 - - - - - - 6.0
Proposition 1B CMIA(7)
- (257.1) (12.0) 218.1 51.0 - - - - - - -
Proposition 1B SLPP(8)
- - - - - - - - - - - -Proposition 1B Highway-Railroad Crossing Safety - - - - - - - - - - - -Traffic Congestion Relief Program - - - - - - - - - - - -
CMAQ & RSTP(4)
- - - - - - - - - - - -Regional Improvement Program - - - - - - - - - - - -
Other State & Federal(5)
- - - - - - - - - - - -To Be Determined Highway Strategy Funding - - - - - - - - - - - -Total - (262.1) (10.0) 221.1 57.0 - - - - - - 6.0
No
vem
be
r2
011
Ch
ang
e
February 2011

Long Range Transportation Plan Financial Forecast
Interstate 10 Carpool Lanes from Interstate 605 to State Route 57 Project Funding Comparison2010 2010 2011 2012 2013 2014 2015 2016 2017 2018 2019
($ in millions) & Prior 2011 2012 2013 2014 2015 2016 2017 2018 2019 2020 Total
As of April 2010
Proposition C 25% 1.6 5.0 36.2 30.0 9.1 16.0 97.8Proposition C 10% -Measure R 20% -Local Agency Funds -
Proposition 1B CMIA(7)
19.7 19.7
Proposition 1B SLPP(8)
-Proposition 1B Highway-Railroad Crossing Safety -Traffic Congestion Relief Program 27.6 10.3 10.3 10.3 10.3 10.3 10.3 89.4
CMAQ & RSTP(4)
31.9 19.9 30.0 26.5 27.1 2.8 138.1Regional Improvement Program 167.9 3.6 171.5
Other State & Federal(5)
4.9 4.9To Be Determined Highway Strategy Funding -Total 233.9 0.0 53.5 45.3 72.9 67.4 22.2 26.3 0.0 0.0 0.0 521.4
As of November 2011
Proposition C 25% 2.1 20.0 26.0 4.7 52.8Proposition C 10% -Measure R 20% -Local Agency Funds -
Ap
ril20
10
Novem
ber
20
11 Consistent with 2009 LRTP
36
Local Agency Funds -
Proposition 1B CMIA(7)
26.1 26.1
Proposition 1B SLPP(8)
-Proposition 1B Highway-Railroad Crossing Safety -Traffic Congestion Relief Program 27.6 20.6 20.6 20.6 89.4
CMAQ & RSTP(4)
60.3 26.1 33.9 84.8 205.1Regional Improvement Program 126.3 41.6 3.6 23.1 194.6
Other State & Federal(5)
4.9 4.9To Be Determined Highway Strategy Funding -Total 221.2 41.6 55.8 33.9 84.8 63.7 46.6 25.3 0.0 0.0 0.0 573.0
Change(6)
Proposition C 25% 0.5 - - (5.0) (36.2) (10.0) 16.9 (11.3) - - - (45.0)Proposition C 10% - - - - - - - - - - - -Measure R 20% - - - - - - - - - - - -Local Agency Funds - - - - - - - - - - - -
Proposition 1B CMIA(7)
- - 6.4 - - - - - - - - 6.4
Proposition 1B SLPP(8)
- - - - - - - - - - - -Proposition 1B Highway-Railroad Crossing Safety - - - - - - - - - - - -Traffic Congestion Relief Program - - (10.3) (10.3) (10.3) 10.3 10.3 10.3 - - - -
CMAQ & RSTP(4)
28.4 - 6.2 4.0 58.4 (27.1) (2.8) - - - - 67.1Regional Improvement Program (41.6) 41.6 - - - 23.1 - - - - - 23.1
Other State & Federal(5)
- - - - - - - - - - - -To Be Determined Highway Strategy Funding - - - - - - - - - - - -Total (12.6) 41.6 2.3 (11.4) 11.9 (3.7) 24.4 (0.9) - - - 51.5
Novem
ber
20
11
Ch
an
ge
Consistent with 2009 LRTP(Corrects 2010 Omissions)

Long Range Transportation Plan Financial Forecast
Interstate 5 South from Orange County Line to Interstate 605 (includes Carmenita Interchange) Project Funding Comparison2010 2010 2011 2012 2013 2014 2015 2016 2017 2018 2019
($ in millions) & Prior 2011 2012 2013 2014 2015 2016 2017 2018 2019 2020 Total
As of April 2010
Proposition C 25% 4.4 44.8 54.1 26.9 34.9 200.1 12.9 0.0 17.7 15.4 411.1Proposition C 10% -Measure R 20% 5.0 20.2 25.0 24.8 75.0Local Agency Funds 0.5 0.5
Proposition 1B CMIA(7)
61.9 80.3 47.4 130.0 56.8 10.0 0.6 387.0
Proposition 1B SLPP(8)
0.0 0.0 71.0 26.5 0.0 97.5Proposition 1B Highway-Railroad Crossing Safety -Traffic Congestion Relief Program 77.0 19.8 19.8 19.8 19.8 19.8 19.8 196.0
CMAQ & RSTP(4)
8.2 44.3 0.0 1.2 22.7 1.0 0.0 13.1 16.3 14.4 121.2Regional Improvement Program 150.2 32.1 57.1 85.6 0.0 10.6 21.9 0.0 0.8 358.2
Other State & Federal(5)
25.2 4.0 8.2 7.9 3.2 5.3 2.2 55.9To Be Determined Highway Strategy Funding -Total 265.5 145.0 206.1 292.6 154.5 366.8 133.8 48.1 60.1 29.8 0.0 1,702.4
As of November 2011
Proposition C 25% 5.7 72.1 30.0 141.5 57.7 39.7 346.7Proposition C 10% -Measure R 20% -Local Agency Funds 0.5 0.5
Ap
ril20
10
Novem
ber
20
11 Utilizes State and Federal Funds First &
37
Local Agency Funds 0.5 0.5
Proposition 1B CMIA(7)
72.3 314.7 387.0
Proposition 1B SLPP(8)
14.9 62.7 77.6Proposition 1B Highway-Railroad Crossing Safety -Traffic Congestion Relief Program 77.0 19.8 19.8 19.8 19.8 19.8 19.8 196.0
CMAQ & RSTP(4)
44.4 40.0 44.2 33.3 161.8Regional Improvement Program 109.0 67.8 74.2 66.1 54.9 22.7 0.0 394.7
Other State & Federal(5)
25.2 4.0 2.5 15.6 5.4 3.2 0.0 55.9To Be Determined Highway Strategy Funding -Total 276.7 276.0 441.2 305.7 137.9 85.4 64.0 33.3 0.0 0.0 0.0 1,620.2
Change(6)
Proposition C 25% 1.3 27.3 (24.1) 114.6 22.9 (160.3) (12.9) - (17.7) (15.4) - (64.4)Proposition C 10% - - - - - - - - - - - -Measure R 20% - - (5.0) - - - (20.2) (25.0) (24.8) - - (75.0)Local Agency Funds - - - - - - - - - - - -
Proposition 1B CMIA(7)
- 72.3 252.9 (80.3) (47.4) (130.0) (56.8) (10.0) (0.6) - - (0.0)
Proposition 1B SLPP(8)
14.9 - - (8.3) (26.5) - - - - - - (19.9)Proposition 1B Highway-Railroad Crossing Safety - - - - - - - - - - - -Traffic Congestion Relief Program - - - - - - - - - - - -
CMAQ & RSTP(4)
36.2 (4.3) - (1.2) (22.7) (1.0) 44.2 20.2 (16.3) (14.4) - 40.6Regional Improvement Program (41.2) 35.7 17.1 (19.5) 54.9 12.1 (21.9) - (0.8) - - 36.5
Other State & Federal(5)
- - (5.7) 7.7 2.2 (2.1) (2.2) - - - - (0.0)To Be Determined Highway Strategy Funding - - - - - - - - - - - -Total 11.2 131.0 235.2 13.1 (16.6) (281.4) (69.8) (14.8) (60.1) (29.8) - (82.2)
Novem
ber
20
11
Ch
an
ge
Enhancements Split from Mainline Project

Long Range Transportation Plan Financial Forecast
Alameda Corridor East Project Funding Comparison2010 2010 2011 2012 2013 2014 2015 2016 2017 2018 2019
($ in millions) & Prior 2011 2012 2013 2014 2015 2016 2017 2018 2019 2020 Total
As of April 2010
Proposition C 25% 101.3 26.0 85.5 25.0 25.1 7.9 270.8Proposition C 10% 1.9 1.9Measure R 20% 34.0 50.1 58.0 50.0 54.9 43.2 59.8 50.0 400.0Local Agency Funds -
Proposition 1B CMIA(7)
-
Proposition 1B SLPP(8)
-Proposition 1B Highway-Railroad Crossing Safety 12.0 13.6 25.6Traffic Congestion Relief Program 72.2 72.2
CMAQ & RSTP(4)
-Regional Improvement Program -
Other State & Federal(5)
254.2 254.2To Be Determined Highway Strategy Funding 50.0 50.0 50.0 50.0 39.0 30.0 22.0 80.0 371.0Total 475.7 139.7 193.5 125.0 130.0 90.1 89.8 72.0 80.0 0.0 0.0 1,395.7
As of November 2011
Proposition C 25% 101.3 26.0 28.0 82.5 25.1 7.9 270.8Proposition C 10% 1.9 1.9Measure R 20% 34.0 40.1 22.1 60.0 54.9 79.1 59.8 50.0 400.0Local Agency Funds -
Ap
ril2
01
0N
ove
mbe
r2
01
1
38
Proposition 1B CMIA(7)
-
Proposition 1B SLPP(8)
-Proposition 1B Highway-Railroad Crossing Safety 12.0 13.6 25.6Traffic Congestion Relief Program 72.2 72.2
CMAQ & RSTP(4)
-Regional Improvement Program -
Other State & Federal(5)
254.2 254.2To Be Determined Highway Strategy Funding 50.0 100.0 50.0 39.0 30.0 22.0 80.0 371.0Total 475.7 79.7 100.1 242.5 130.0 126.0 89.8 72.0 80.0 0.0 0.0 1,395.7
Change(6)
Proposition C 25% - - (57.5) 57.5 - - - - - - - (0.0)Proposition C 10% - - - - - - - - - - - -Measure R 20% - (10.0) (35.9) 10.0 - 35.9 - - - - - (0.0)Local Agency Funds - - - - - - - - - - - -
Proposition 1B CMIA(7)
- - - - - - - - - - - -
Proposition 1B SLPP(8)
- - - - - - - - - - - -Proposition 1B Highway-Railroad Crossing Safety - - - - - - - - - - - -Traffic Congestion Relief Program - - - - - - - - - - - -
CMAQ & RSTP(4)
- - - - - - - - - - - -Regional Improvement Program - - - - - - - - - - - -
Other State & Federal(5)
- - - - - - - - - - - -To Be Determined Highway Strategy Funding - (50.0) - 50.0 - - - - - - - -Total - (60.0) (93.4) 117.5 - 35.9 - - - - - (0.0)
Nove
mbe
r2
01
1C
ha
nge
ACE Updates Consistent with2009 LRTP
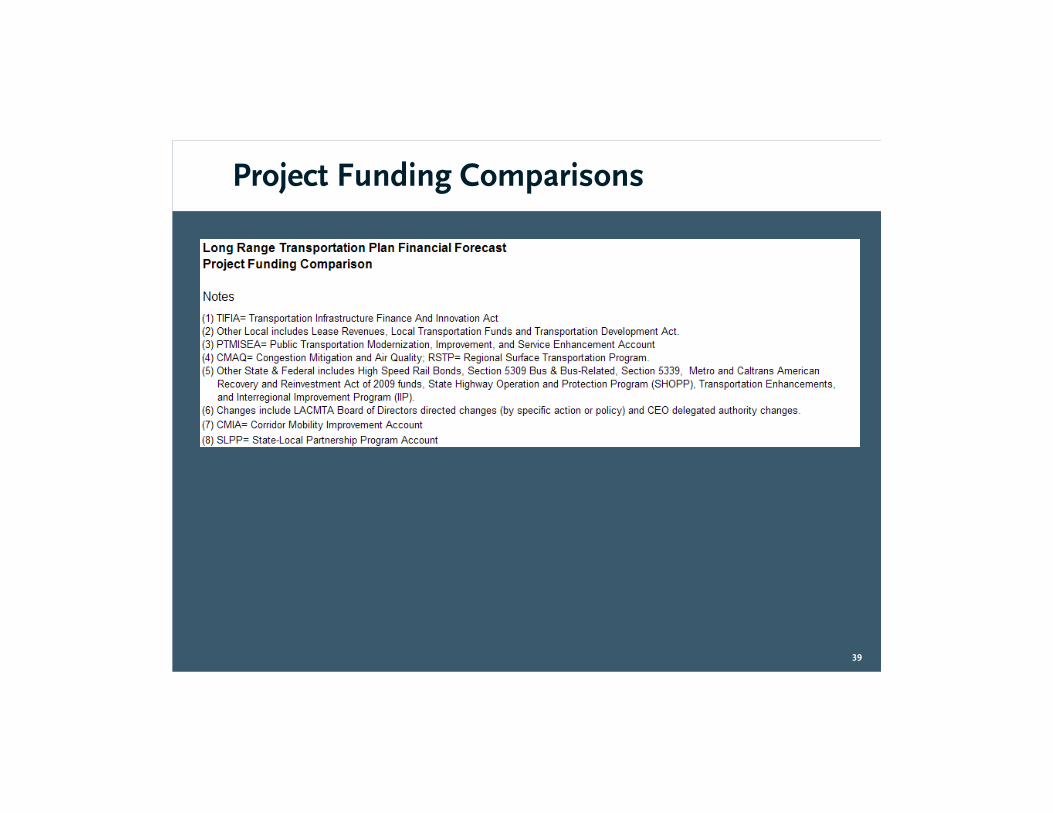
Project Funding Comparisons
39