long-run investment decisions, operating performance and ... · long-run investment decisions,...
TRANSCRIPT
Long-Run Investment Decisions, Operating Performance and Shareholder Value Creation of Firms
Adopting Compensation Plans Based on Economic Profits
Chris E. Hogan Edwin L. Cox School of Business
Southern Methodist University P.O. Box 750333
Dallas, Texas 75275-0333 [email protected]
Craig M. Lewis Owen Graduate School of Management
Vanderbilt University Nashville, Tennessee 37203
August 2004 The authors thank seminar participants at the 2000 Summer Symposium at the Hong Kong University of Science and Technology, University of Arizona, Goethe University, London School of Business, Ohio State University (Accounting and Finance), Southern Methodist University, Texas A&M University, and Vanderbilt University; especially Bill Christie, Gerald Garvey, Tim Loughran, Ron Masulis, and Ralph Walkling. The authors also would like to thank Flora Chen, Oliver Chen, Ping Dong, Brad Ogle and Stephan Schulze for capable research assistance.
2
Long-Run Investment Decisions, Operating Performance and Shareholder Value Creation of Firms Adopting Compensation
Plans Based on Economic Profits
Abstract: For firms adopting economic profit plans between 1983 and 1996, we document changes in investment behavior that lead to improvements in operating performance and growth opportunities relative to their own past performance. These improvements, however, are similar to those realized by a set of nonadoptong control firms that are selected on the basis of a logistic regression model of adoption choice. We then consider the possibility that some firms are better candidates for economic profit plans than others and classify adopters according to whether they made anticipated or surprising choices based on the adoption choice model. We find that anticipated adopters make changes in investment behavior that reduce invested capital and allow them to become more profitable than a sample of control firms that were expected to adopt but chose to continue using a traditional plan. A similar analysis of surprise adopters does not reveal significant performance differences relative to a sample of anticipated nonadopters. The classification analysis suggests that economic profit plans work best for firms that are expected to adopt such plans based on pre-adoption operating, organizational, financial, and compensation characteristics. Keywords: Economic profits, investment policy, operating performance, compensation plans, shareholder value creation Data Availability: Data are publicly available from sources identified in the paper
1
I. Introduction
A recent trend in executive compensation is to pay managers performance bonuses
based on the creation of economic profits rather than accounting earnings.1 Economic
Profit Plans (EPPs) reward managers if earnings exceed a charge for the use of the capital
employed in the business and provide incentives to accept new projects and maintain
existing lines of business only if they have positive net present value. This implies that an
appropriately designed EPP should provide incentives for improving investment decisions
and operating performance because it links executive compensation to a performance metric
that directly corresponds to shareholder value creation.2
The main hypothesis we consider is simple. If EPPs provide managers with better
incentives to improve shareholder value, firms that adopt such plans should invest more
efficiently and experience improved long-run operating performance.3 Wallace (1997) finds
that firms adopting economic profit plans do in fact produce higher levels of economic
profits. He shows that adopting firms decrease new investment, increase asset dispositions,
and repurchase more shares and argues that economic profit improvements are primarily
driven by capital management decisions that reduce invested capital.4
1 The concept of economic profits, the need to earn more than the cost of capital to create wealth, dates back centuries (Biddle et al. 1997; Hamilton 1777) and has been operationalized as residual income in the 1950s (Zimmerman 1997; Biddle et al. 1997). Recently, plans that compensate managers on the basis of economic profits have gained wide acceptance, with adoption by blue-chip companies that include Boise Cascade Corp., the Coca-Cola Company, and Eli Lilly & Co. The management consulting firm of Stern Stewart and Co. is the leading advocate of the economic profit approach, which it markets under the name of Economic Value Added (EVATM). Other consulting firms such as the Boston Consulting Group, KPMG, and LEK/Alcar Consulting Group offer similar plans. 2 A problem that these plans share with all bonus plans is that they only reflect current operating performance and tend to induce a short-term orientation. To address this concern, many EPPs include long-run incentives not used in traditional bonus plans. For example, Stern, Stewart and Company advocates an approach that includes a bonus-banking system whereby a portion of a manager’s bonus each year is banked and only paid if economic profits continue to rise. Another approach uses the discounted sum of forecasted economic profits as a measure of long-run value creation. Both of these approaches create long-term incentives by requiring bonus payments to explicitly reflect a longer horizon. 3 Murphy (1998) argues that incentives are an important driver of managerial actions and corporate performance and that “fully analyzing and documenting the effect of executive incentives on subsequent performance is a fruitful, if not critical, direction for future research in executive compensation.” 4 Although not related to operating performance, other studies examine the effect of economic profit plan adoptions. Biddle, Bowen, and Wallace (1997) suggest that stock prices respond more to traditional earnings
2
Two econometric design problems make it difficult to draw inferences from Wallace
(1997). First, he fails to control for past operating performance when identifying control
firms. Barber and Lyon (1996) show that failing to account for past performance results in
biased test statistics. This is particularly important when the firms being studied are relatively
poor performers, which is likely to be the case when firms make significant changes in their
compensation structure.
Second, compensation plans reflect an endogenous choice made by the firm’s Board
of Directors. Since Board compensation committees presumably choose the compensation
plan that works best, it is important to control for this endogeneity bias when constructing
empirical tests. That is, certain firms may be better candidates for EPPs, and compensation
committees optimally select these plans. For example, Garvey and Milbourn (2000) argue
that the capital charge may make EPPs more attractive to firms that would benefit from the
added incentive to manage capital.5 Other firms may find it optimal to choose traditional
plans. If all firms are optimizing, then each may realize significant performance
improvements. As a result, there may not be any differences in performance across a sample
of EPP adopters and a sample of control firms if you do not control for the endogeneity of
the decision. 6
We examine the investment behavior, operating performance and changes in
shareholder value of firms adopting EPPs in the nine-year window around the adoption
year. We find that the operating performance of companies adopting EPPs, as measured by
numerous accounting measures, significantly improves in the four-year period following plan
than economic profits. Lehn and Makhija (1997) show that CEO turnover is lower in firms that have higher levels of economic profits. 5 Garvey and Milbourn (2000) argue that EPPs provide value beyond traditional earnings-based plans when economic profits are more highly correlated with stock returns and argue that a switch to an EPP should result in improved performance if economic profits combined with stock prices are more informative. Biddle et al. (1997) and Garvey and Milbourn (2000) both find that, on average, earnings tend to have a higher correlation with stock returns than does economic profit. However, Garvey and Milbourn (2000) examine when and why economic profits beats earnings, and whether this is associated with adoption.
3
adoption. In addition, managers respond to plan incentives to reduce invested capital by
selling underperforming assets. This finding is consistent with Wallace (1997) who notes that
“you get what you measure and reward.”
Before concluding that these improvements are attributable to the economic profits
approach, we address the endogenous nature of the choice of a compensation plan. We
propose two econometric procedures based on the propensity score matching methods of
Dehejia and Wahba (1998). The main advantage of the propensity score approach is that,
unlike other matching methods that only control for a relatively small number of factors (e.g.
Barber and Lyon (1996)), it accommodates as many factors as are deemed important. For
example, in addition to the typical controls for industry, size, and past operating
performance, we include other factors such as compensation structure, managerial
ownership levels, diversification measures, and capital structure.
When evaluated as a group, EPP adopters do not produce better operating
performance or larger increases in shareholder value relative to firms with traditional
compensation plans. In fact, there are very few significant differences in operating
performance and shareholder value across adopters and nonadopters either before or after
adoption. The only consistently significant difference is that asset turnover is significantly
higher for EPP adopters.
Of course, these tests may not be sufficiently powerful to detect significant
differences if, for example, some firms are more committed to the change than others. When
we partition the sample into anticipated and surprise adopters, a different picture emerges.
Anticipated adopters do attain many of the benefits that EPP proponents advocate. We find
that assets are managed more efficiently, key profitability measures are higher, although,
surprisingly, not economic profits, and more shareholder value is created than a set of
6 Ittner and Larcker (2001) make this point in a study that examines the choice of accounting systems.
4
comparable firms that were expected to adopt but chose traditional plans instead. By
contrast, surprise adopters fail to achieve similar improvements. We conclude that economic
profit plans work best for firms that are expected to adopt such plans based on pre-adoption
operating, organizational, financial, and compensation characteristics.
The paper is organized as follows. We describe our data sources and sample selection
procedure in section 2. In section 3, we evaluate both pre-adoption and post-adoption
operating performance of firms that adopt EPPs. In section 4, we consider whether
managers endogenously select EPPs or traditional compensation plans. Section 5
summarizes and concludes.
II. Sample Description and Data Sources
The sample consists of all adoptions of EPPs during the 1983-1996 period. The
initial sample of EPP adopters was obtained based on a keyword search of proxy statements
on the LEXIS/NEXIS database. The keywords used to perform this search are: Economic
Value Added, EVA, Residual Income, Economic Value Management, and Economic Profit.
For all Stern Stewart & Co. clients, we use the adoption date identified by Stern
Stewart & Co. For all other EPP adopters, we read proxy statements for each company to
determine that the firms did in fact adopt an EPP. We verify the adoption year by reading
prior year proxy statements to ensure that the adoption year was the first year the firm
mentioned economic profits in its proxy statements. We also add three firms identified in
Wallace’s (1997) study that were not identified by our above search.
Regulated utilities (SIC = 481 and 491-494) and financial institutions and their
holding companies (SIC = 600-699) are excluded from the final sample. Since our study uses
accounting-based measures of operating performance, we also require that the adopting
company appear on the Compustat Annual Research database in the year of and the year
5
prior to the EPP adoption. These industry and data restrictions result in a final sample of
108 firms.7
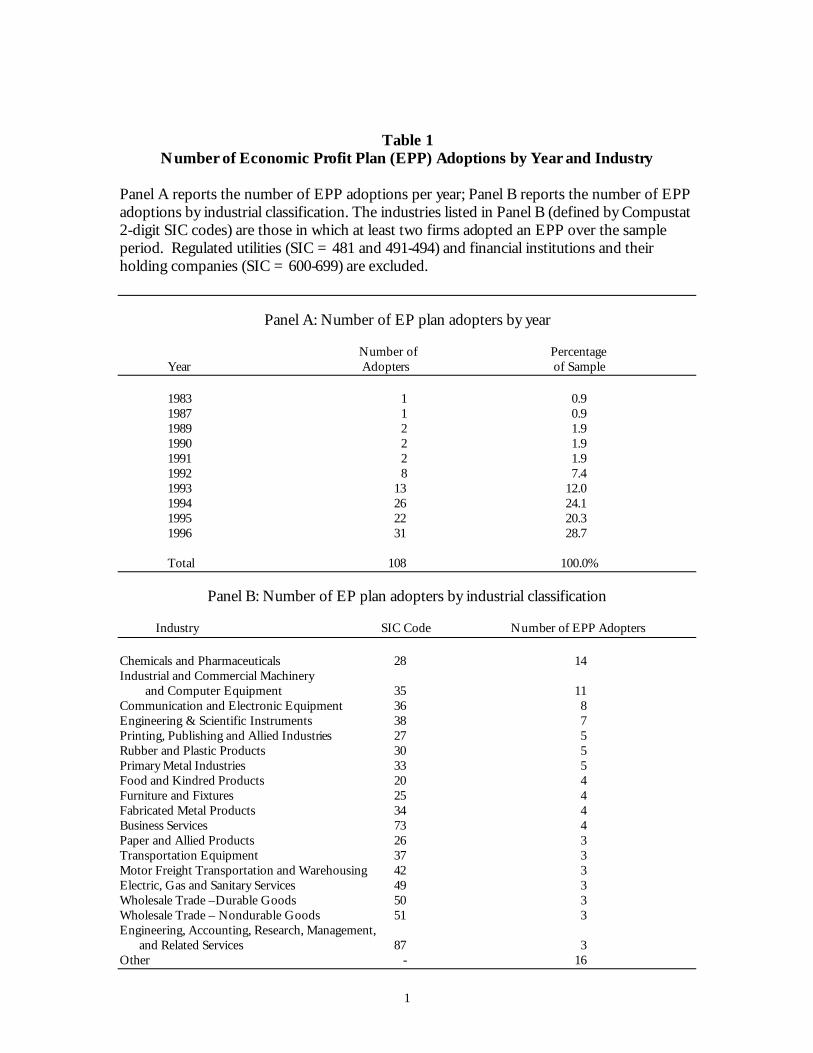
Summary information on the number of EPP adopters by year of adoption and
industry affiliation is provided in Table 1. The number of adoptions has mainly increased
through 1996 suggesting the popularity of these plans continued to increase during the early
1990s. Balachandran (2003) notes, however, that this trend reverses in the two years that
immediately follow the end of our sample period.
Panel B of Table 1 provides two-digit SIC codes for our sample. EPP firms
represent a broad cross-section of industries, suggesting that EPPs are considered a useful
tool for motivating managers in a variety of business contexts.
III. Analysis of Investment Decisions, Operating Performance and Shareholder Value of Firms Adopting Economic Profit Plans
We examine how EPP adoptions affect investment decisions, operating performance
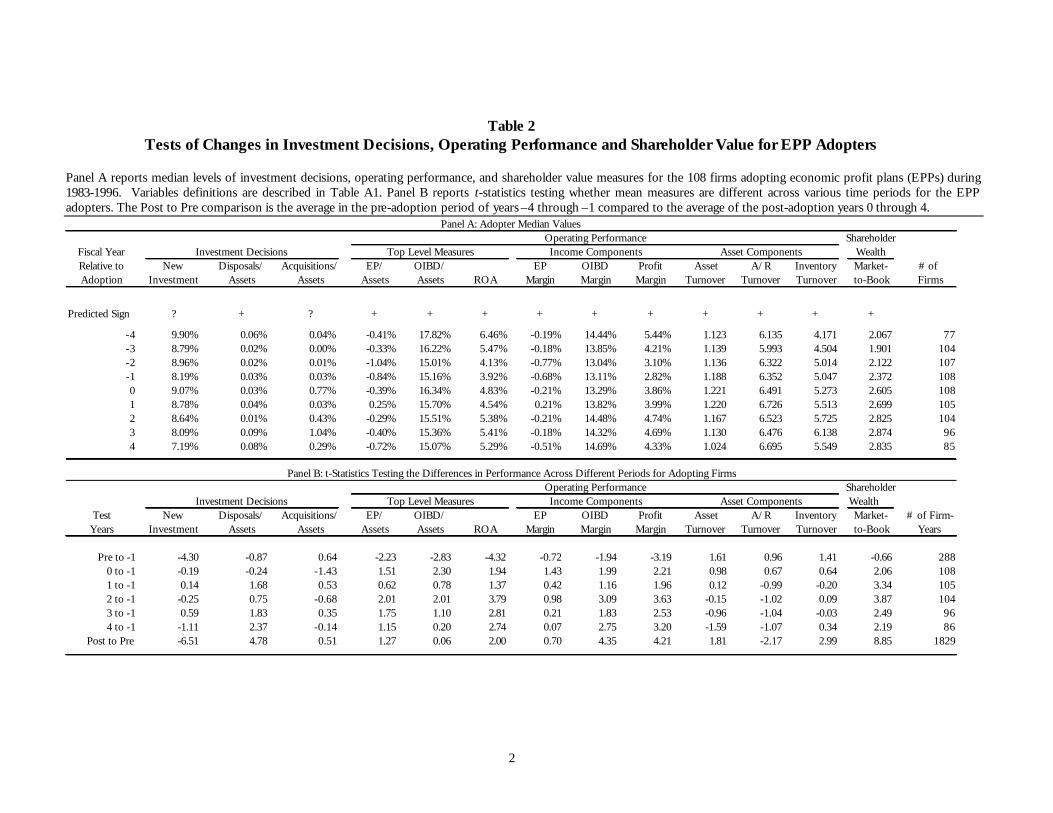
and shareholder value. Table 2 reports median values for three investment decision variables,
nine operating performance variables, and one measure of shareholder value. The variable
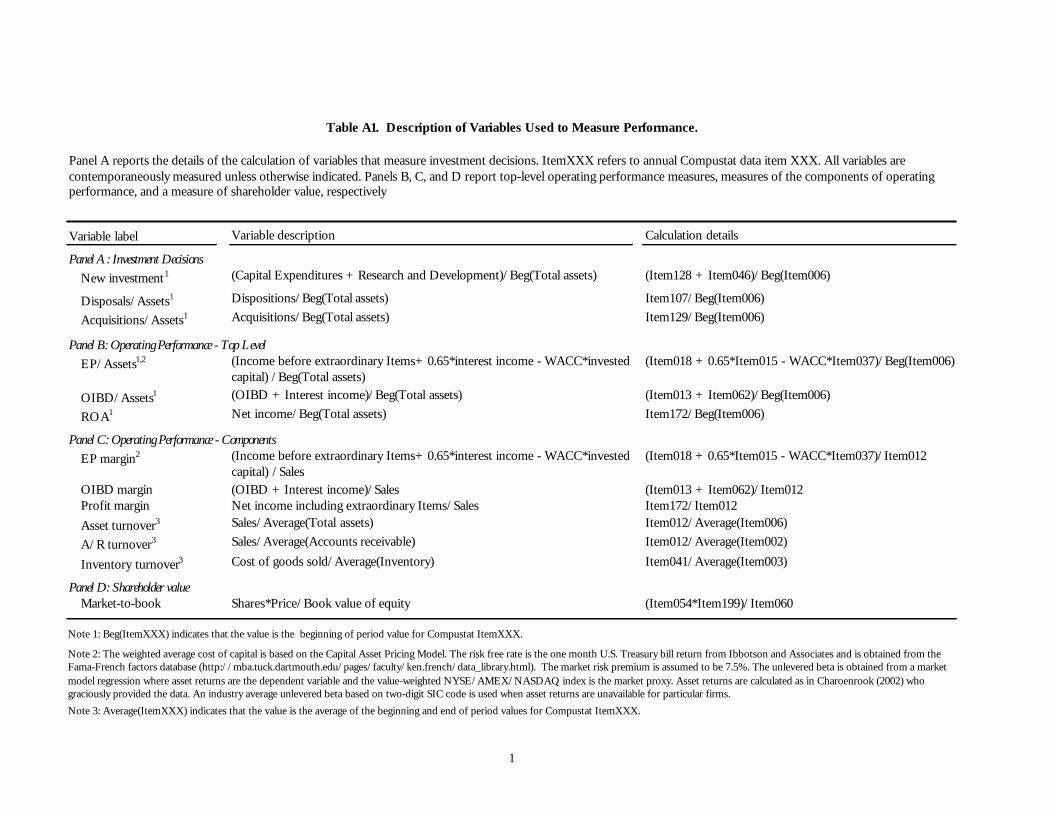
definitions and calculation details are described in Table A1.
We report results for years -4 through +4, where year 0 is the fiscal year of the EPP
adoption.8 We test for differences in performance over different time periods using t-tests
for differences in mean values. T-tests are appropriate here, even though operating
performance data tends to be skewed, because each firm is compared to its own past
performance rather than that of other firms. Differences taken relative to “own” past
performance mitigate the skewness problem found in cross-sectional comparisons.9
7 A complete list of adopting companies and the years of adoption is available upon request. 8 We lose observations due to firms delisting over the four-year period following adoption. Twenty-three adopters delist over this period: eighteen delist as a result of a merger and 5 were delisted by the exchange. 9 Nonparametric tests based on the Wilcoxon rank sum test are qualitatively similar.
6
The investment policy variables include new investment, asset disposals, and
acquisitions, all of which are scaled by total assets. These measures reflect the rate of
incremental long-term investment and the rate of asset disposals.
Proponents of EPPs argue that managers have incentives to invest in positive NPV
projects because bonuses are only earned if income exceeds a charge on all capital. Since all
assets incur capital charges, managers will sell underperforming assets that generate
accounting earnings but fail to earn their cost of capital. We expect asset disposals to
increase following an EPP adoption.
Unfortunately, the prediction for new investment is less clear. To the extent that
some firms overinvest in negative NPV projects that generate accounting profits, new
investment should decrease. However, if firms underinvest in positive NPV projects that
have relatively low profitability rates, EPP adoptions could increase new investment. As a
result, the predicted sign is indeterminate.
Any compensation plan, however, can undermine the selection of positive NPV
projects if bonuses are based on short run realizations, whether it is cash flow, earnings, or
economic profits. Given that the typical investment has poor operating performance in the
early periods, upwardly mobile managers are likely to avoid such projects because they want
to be promoted before middle-to-late period cash flows can offset early “losses.” Under this
scenario, new investment would decrease following an EPP adoption because managers wish
to avoid the additional capital charges.
It is similarly difficult to predict how acquisition activity changes. For analogous
reasons, the predicted sign for changes in acquisition activity is indeterminate.
Our analysis of operating performance provides evidence on economic profits,
accounting rates of profitability and the use of assets-in-place. We first examine “top-level”
7
operating performance measures. These include economic profits, operating income before
depreciation (OIBD), and net income, a ll scaled by total assets.
We then break the “top-level” measures into components so that we can determine
whether changes result from managing the asset base or from changes in margins. We
examine economic profit, OIBD, and profit margins. These represent the same definitions
of operating performance used to evaluate top-level performance except that we scale by
sales rather than assets. All of these “margin” measures are expected to increase following
an EPP adoption. Since EPPs are designed to reward managers for creating higher economic
profits, improvements are expected to be greatest for economic profit margins and smallest
for profit margins.
We then examine three measures of asset turnover to analyze asset utilization: asset
turnover, accounts receivable turnover, and inventory turnover. Since managers of firms
adopting economic profit plans are predicted to use assets more efficiently and have
incentives to reduce the asset base, all of the turnover ratios are expected to increase
following adoption.
Finally, we examine changes in shareholder value following the adoption of an EPP
using the market-to-book ratio. We expect the market-to-book ratio to increase following an
adoption if performance improvements are expected to be permanent.
A. Changes in Investment Policy for EPP Adopters
Panel A of Table 2 presents median investment measures for adopting firms, and
Panel B presents t-statistics from tests of the differences in mean investment measures
across various time periods.
As noted above, we predict that the capital charge implicit in EPPs provides an
incentive to sell underperforming assets. Consistent with this prediction, we find that asset
8
sales increase (t-stat = 4.78) in the post-adoption period. There also is a significant decrease
in new investment (t-stat = -6.51) but no significant change in acquisition activity.
It is interesting that adopting managers respond by finding ways to decrease the
capital charges on invested capital. As we document later in section III.C, market-to-book
ratios increase following adoptions, which suggests that investors believe these changes are
beneficial. If so, the reduction in new investment is consistent with the idea that managers
invest more efficiently following the adoption of an EPP.
B. Changes in Operating Performance
Operating performance measures are also presented in Table 2. Panels A and B of
Table 2 indicate that “top-level” operating performance of EPP firms generally improves
following adoption. The median value of economic profits to assets increases from the pre-
to post-adoption period, although the changes based on t-tests for differences in mean
values are only significant in years 2 and 3 relative to year -1.
With one exception, the median economic profit to assets ratio is negative over the
nine-year period surrounding adoption. This is consistent with evidence presented by Biddle
et al. (1999) who note “near-zero EVA is consistent with a competitive economy in which
even the typical large firm has difficulty earning more than its cost of capital.”
The median ratio of OIBD to assets increases from 15.16% in the year prior to
adoption to 16.34% in the year of adoption and then reverts to levels comparable to those
immediately prior to adoption. Increases in return on assets are significant in four of the
years following adoption. For the median adopter, return on assets increases from 3.92% in
the year preceding adoption to a high of 5.41% three years after adoption before falling back
to 5.29% four years following adoption. The t-tests for differences in mean performance
measures in the pre-adoption period (years –4 through –2 compared to year –1) presented in

9
Panel B of Table 2, suggest that the adopter firms were experiencing a decline in profitability
prior to adoption.
Turning to the components of the top-level operating performance measures, the
median EP margin does not change significantly following the adoption of an EPP. By
contrast the median OIBD margin, a measure that is not affected by a change in the
adopting firm’s assets-in-place and/or interest expense, significantly increases from 13.11%
in the year prior to adoption to 14.69% four years following adoption. Median profit
margins significantly increase from 2.82% in the year prior to adoption to 4.33% four years
following adoption. Increases in OIBD and profit margins are generally significant in all
years following adoption.
Note that the ratio of economic profits to assets shows significant improvement in
two of the four post-adoption years while the economic profit margin is insignificant. This
suggests that improvements in economic profits are caused by capital management decisions
rather than margin improvements.
The changes in the asset components are consistent with this observation. We find
that total asset turnover and inventory turnover both increase significantly in the post-
adoption period as compared to the pre-adoption period, although the annual increases
relative to year –1 are not significant. Average accounts receivable turnover actually
decreases in the post-adoption period as compared to the pre-adoption period, although the
annual decreases relative to year –1 are not significant.
C. Shareholder Value Measure
The median adopter’s market-to-book ratio increases from 2.372 in the year
preceding adoption to 2.835 four years after adoption, suggesting the market is anticipating
positive effects from EPP adoptions. It appears that investors believe that the changes are
permanent as evidenced by the significant increases in market-to-book ratios.
10
IV. The Endogenous Nature of the Adoption Decision
Table 2 documents that firms change their investment behavior, experience
improvements in certain operating performance measures and increase shareholder value
following the adoption of an EPP. The question remains as to whether these results are
significantly different than what would have been expected had the firm not selected an
EPP. One possible approach for evaluating expected performance is to compare the
operating performance of our sample of adopters to a sample of control firms matched on
size and industry membership, similar to Wallace (1997).10
Unfortunately, this approach ignores prior profitability and the endogeneity inherent
in the selection of a compensation plan. The problem here is that, if all firms choose optimal
compensation plans, whether it be an EPP or a more traditional plan, we may not observe
differences in performance across a sample of EPP adopters and nonadopters (Ittner and
Larcker 2001). The question we seek to answer then is really whether the adopting firms are
performing better subsequent to adoption than they otherwise would have had they not
adopted an economic profit plan.
Ideally, we would like to compare the operating performance of adopting firms to
their performance had they not adopted. Since this obviously is not possible, we use the
method of matching based on propensity scores to identify the “best” control firms.
Propensity score matching methods, as used by Dehejia and Wahba (1998) and
Villalonga (2000) are useful when there are numerous characteristics across which firms may
be matched (for example, industry, size, operating performance, compensation structure, and
capital structure.). The propensity score is a measure of the likelihood of an EPP adoption.
It is the fitted value from a logistic prediction model that incorporates these different
10 When we select control firms matched on year, industry, size and prior profitability, and compare performance between adopter firms and control firms, our results are qualitatively similar to those presented in Table 5.
11
characteristics. The basic idea is to use the propensity scores from the prediction model to
select a set of control firms that are most similar to the adopter firms. This produces a set of
control firms that provide the best indication of how an adopter would have performed had
they not adopted.11
As an additional test, we compare the investment decisions, operating performance
and shareholder wealth creation of an adopting firm to the operating performance of a
comparable firm that was expected to adopt based on the adoption prediction model but
selected a traditional compensation plan instead. If firms endogenously choose the best
compensation plan, those that choose as anticipated should outperform a matched sample of
firms that make surprising choices. The inability to reject the null hypothesis of no
performance improvement suggests that both plans are equally effective.
A. A Model to Predict EPP Adoptions
In an effort to identify characteristics of firms that adopt EPP plans, we estimate a
logitistic regression model where the dependent variable is equal to one if the firm adopts an
EPP during the current fiscal year and zero otherwise.
The sample includes all EPP adopters (108 firms) in their year of adoption, and all
firms in the Execucomp database with the same 2-digit SIC code and year as the EPP
adopters plus one hand-collected control firm for each adoption prior to 1992, for a total of
11 The propensity score matching method outperforms other methods, such as the Heckman’s two-stage model when self-selection is a concern, in terms of estimating treatment effects (see Rosenbaum and Rubin 1983; Villalonga 2000; and Dehejia and Wahba 1998) because it discards potential control firms that are not comparable. Methods such as Heckman’s two-stage model can result in biased estimates of the treatment effect when noncomparable firms are included in the estimation. The extent of this bias depends on the comparability of the sample of adopters and the control sample. The more comparable the samples are across several dimensions, the less biased output from OLS or two-stage methods will be. Given that there are several factors that could influence a firm’s decision to adopt an EPP, the propensity score matching method selects the most relevant group for comparison.
12
2,541 potential control firm-years.12 Data requirements reduce the actual number of
observations used in the logistic analysis.
The optimal compensation structure for a given firm should be driven by the
underlying characteristics of the firm. Thus our model includes variables capturing growth
opportunities, profitability, investment policy, capital and organizational structure, and
compensation structure prior to adoption.
Since there are many more firms that choose traditional compensation plans, the
factors that explain adoption choices in the cross-section will reflect the decisions of firms
that want the discipline inherent in an EPP as well as those that actively avoid EPP plans.
For example, a firm with economically unprofitable lines of business may prefer to adopt an
EPP because this type of liquidation decision is explicitly rewarded. However, if these same
assets generate accounting profits, managers may prefer traditional plans because they help
increase bonus payments.
1. Discussion of explanatory variables
In this section, we discuss the variables that are used to estimate the logistic model of
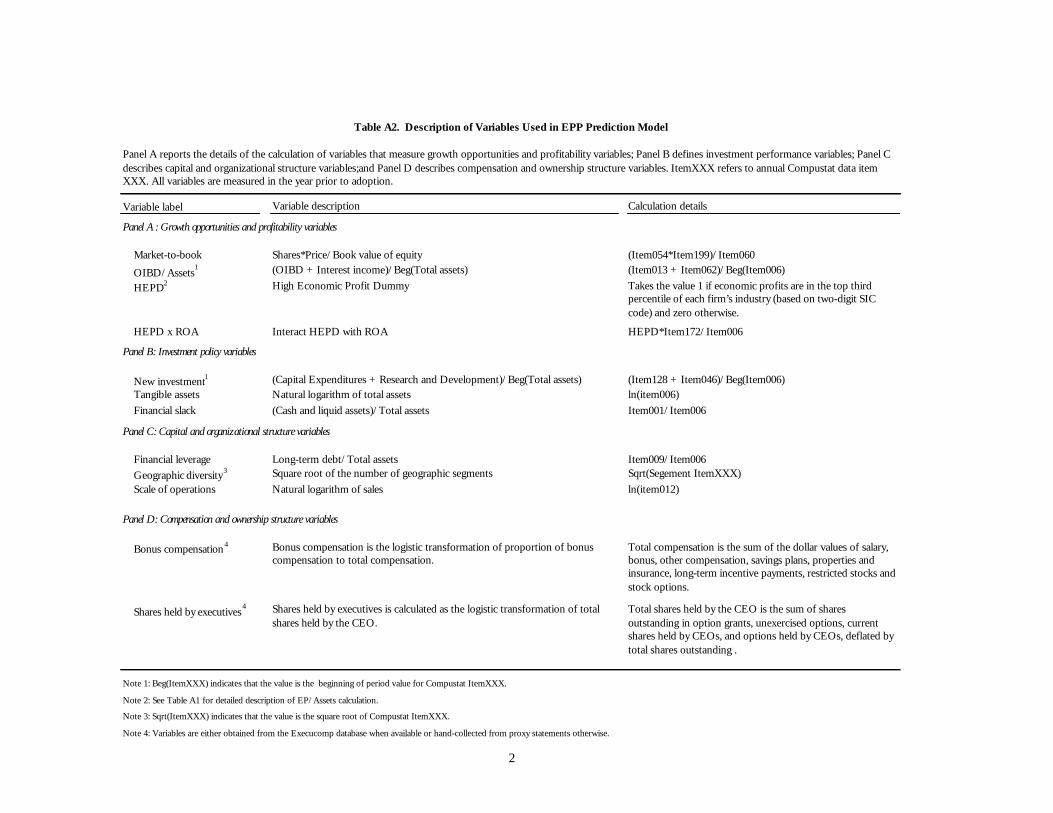
the decision to adopt an EPP. Variable definitions and calculation details are provided in
Table A2.
Growth opportunities and profitability. Firms with high growth opportunities but relatively
low income levels from assets-in-place will prefer stock-based compensation because the
opportunity to earn an earnings bonus is limited. We include the market-to-book ratio as a
measure of growth opportunities and expect the variable to be inversely related to EPP
12 For firms that adopted prior to the availability of Execucomp data in 1992, we select one control firm using the following algorithm: in the fiscal year prior to adoption (using Compustat’s fiscal year convention), we first select all firms in the same 2-digit SIC code with assets within 25% to 200% of the EPP firm, and then we select the firm with the closest OIBD to assets ratio that has a proxy statement available, since we need compensation data. This process ensures we have at least one control firm for each adopter. We obtain qualitatively similar results if we only consider firms that adopt EPPs after 1991.

13
adoption. Garvey and Milbourn (2000) also note that the calculation of economic profits is
more problematic for growth firms, making adoption less likely.
Managers of firms with relatively high accounting profitability would be content to
continue a more traditional earnings-based plan. We include the ratio of operating income
before depreciation to total assets as a measure of accounting profitability and expect this
measure to be inversely related to EPP adoption. Alternatively, firms with relatively high
economic profits will prefer a compensation plan that rewards economic profits. We expect
firms with relatively high economic profits to be more likely to adopt an EPP, particularly if
traditional accounting measures limit the manager’s ability to earn a bonus with an earnings-
based plan. We include a dummy variable that equals 1 if the firm’s economic profits are in
the top third of their industry (defined as 2-digit SIC code), and 0 otherwise. We also interact
this indicator variable with return on assets to determine whether, for this subset of firms
with high economic profits relative to their industry counterparts, adoption is more likely
when accounting profits are relatively low.
Investment policy. A firm’s existing investment policy will likely play a major role in the
choice of compensation plans, although the implications are not always clear. Managers of
firms with high capital expenditures may not want to be constrained by compensation plans
that require a charge for the cost of invested capital. By contrast, the Board and shareholders
of firms with relatively high rates of capital expenditures may encourage an EPP adoption
because the explicit capital charge creates incentives to select positive net present value
projects and sell underperforming assets. We include capital expenditures plus R&D
expenses relative to total assets as a proxy for the rate of new investment.
A similar argument can be made for firms with high levels of tangible assets and high
levels of financial slack. Firms with high levels of tangible assets may benefit more from
plans that create incentives to manage invested capital, but managers may prefer to avoid the

14
capital charges associated with an EPP. We use the natural log of total assets as a proxy for
tangible assets.
Financial slack is measured as the ratio of cash and liquid assets to total assets. Large
levels of cash suggest that managers may have significant levels of discretionary funds and
would benefit from the implicit discipline inherent in an EPP with respect to new
investment. However, the pecking order theory (Myers and Majluf 1984) suggests that firms
with long-term investment plans will accumulate retained earnings because it is a low cost
source of capital when managers have better information than shareholders. Such firms
would be less likely to adopt an EPP because a capital charge is applied to financial slack
even though it does not earn the cost of capital.
Capital and Organizational Structure. More highly leveraged firms may already
experience significant levels of external monitoring making an EPP adoption less likely. On
the other hand, an economic profit plan may provide a complement to leverage in
monitoring management. Debt holders may prefer the margin of safety provided by the
incentive for management to cover the cost of all capital, not just interest on debt. We
include long-term debt to total assets as a measure of the amount of financial leverage.
One advantage of using an EPP relative to stock-based compensation is that
economic profits can be calculated at the divisional or business unit level, and thus is
appealing for decentralized organizations. We use a measure of geographic diversity as a
proxy for the extent of decentralization, which is calculated as the square root of the number
of geographic segments. We use the natural log of sales as a second measure of
decentralization because it reflects the scale of a firm’s operations. We expect both of these
measures to be positively associated with EPP adoption.
Compensation Structure: Since EPPs are bonus-based plans, we include the percentage
of total compensation from bonuses to control for the existing structure of the
15
compensation plan. It is measured as the logistic transformation of the proportion of bonus
compensation to total compensation (the sum of the dollar values of salary, bonus, other
compensation, savings plans, properties and insurance, long-term incentive payments,
restricted stocks and stock options). Shareholders and/or Boards of firms with managers
that have lower bonus-based compensation may favor adopting an EPP if they believe that
bonuses based on economic profits give managers better incentives to focus on projects
where returns exceed the cost of capital. This predicts an inverse relationship between EPP
adoption and existing bonus compensation.
Ownership structure: The percentage of total shares held by the CEO is used to control
for the existing ownership structure. If managements’ interests are already aligned with
shareholders as a result of their existing share ownership, the firm may be less likely to adopt
an EPP. The total shares held by the CEO is measured as the sum of shares outstanding in
option grants, unexercised options, and current shares held by CEOs divided by total shares
outstanding plus options held by CEOs.
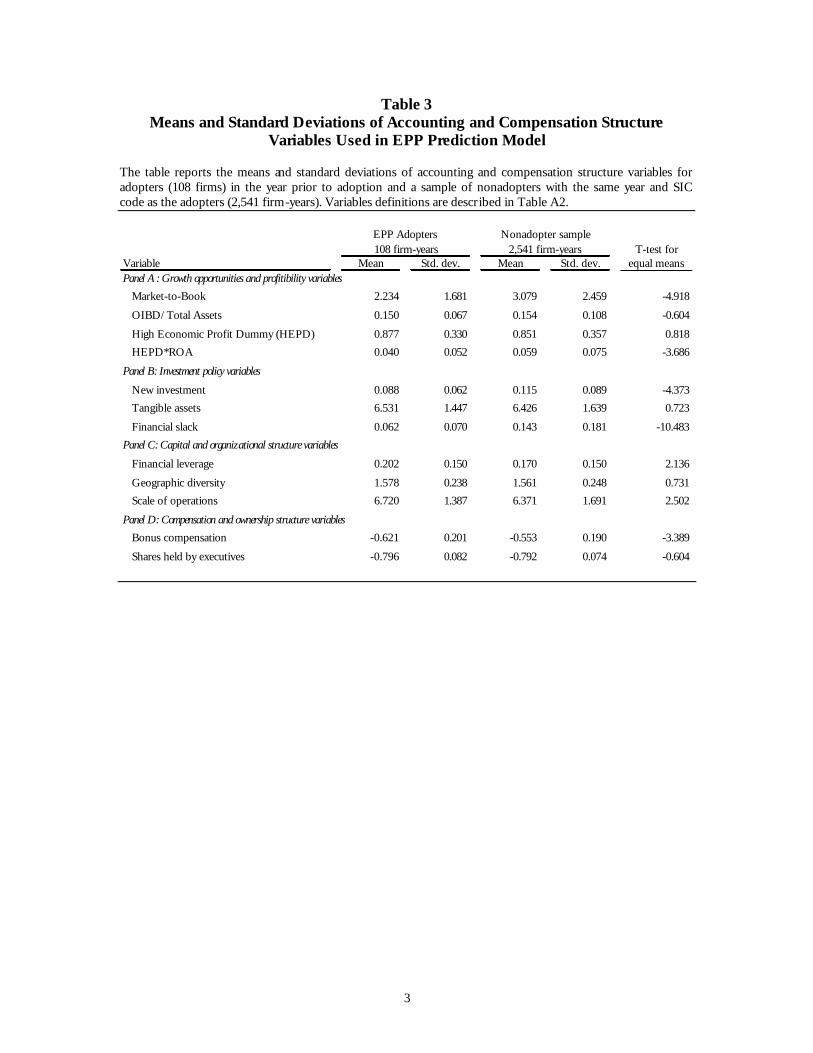
Table 3 shows the means and standard deviations for these variables for the adopter
and nonadopter samples. Extreme outliers for all variables are winsorized at the 1% and
99% levels. Since the univariate differences are consistent with the estimates we obtain in the
EPP prediction model, we do not discuss them here.
B. Estimation of the EPP Adoption Model
Since the sample is relatively large (2,649 firm-year observations) but contains few
firms that actually choose to adopt an EPP (108 observations), the parameter estimates from
a logistic regression model that uses the entire sample are likely to be poor. It has been
shown that it is possible to obtain better coefficient estimates by stratifying the sample, with
strata based on the decision to adopt an EPP (Manski and Lerman (1977) and Cosslett
(1981)).
16
1. A Stratified Sampling Approach
A feature of the stratified sampling approach is that it oversamples adopters relative
to nonadopters. If no adjustment is made, the maximum likelihood estimates are
asymptotically biased. Manski and Lerman (1977) show how to correct for this by weighting
the likelihood function for each observation by ( ) ( )iHiQ where ( )iQ is the fraction of the
total sample that select outcome i, { }nonadopteradopteri ,∈ , and ( )iH is the analogous
fraction in the stratified sample.
We estimate the prediction model by selecting a stratified sample comprised of 100
adopters and 100 nonadopters.13 Rather than relying on the results of a single logistic
estimation, we estimate the model parameters using the bootstrap method. Specifically, we
draw 1000 stratified samples ( 000,1=N ) and estimate a separate logistic regression for each
sample. The resulting sample of bootstrapped parameter estimates represents the sampling
distribution of the estimators. The boostrapped coefficient estimates and associated standard
errors are estimated in the usual way.
2. Parameter Estimates of the EPP Prediction Model
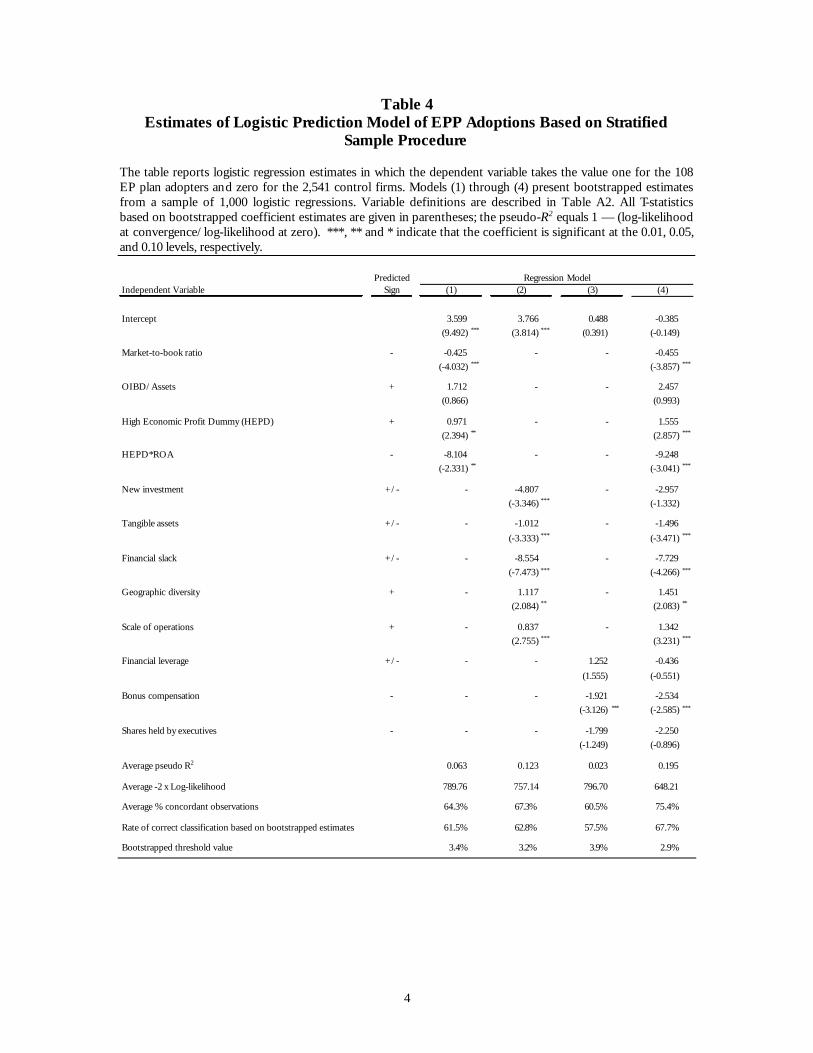
Table 4 provides parameter estimates for four EPP prediction models.14 Focusing on
the complete Model, we find that EPP adoptions are less likely for firms with higher market-
to-book ratios (t-stat of -3.857), consistent with expectations. Also as expected, firms with
relatively high economic profits (in the top third of their industry) are more likely to adopt
EPPs (t-stat of 2.857). This effect is even more pronounced in the subset of firms with
relatively high economic profits (HEPD=1) if accounting profits are relatively low. The
coefficient estimate for HEPD interacted with ROA (t-stat of -3.041) suggests that the firms
13 We obtain similar results using samples of 50 and 75 adopters. 14 We also estimate the logistic model using the full sample without bootstrapping. The signs and the significance levels of the parameter estimates are qualitatively similar to those presented in column (4) of Table 4.

17
most likely to adopt an EPP are those that can benefit from switching from a traditional
earnings-based plan. Managers are less likely to receive an earnings-based bonus as the
accounting profitability is relatively low, but more likely to receive a bonus based on
economic profits given that economic profits are relatively high.
Firms with fewer tangible assets (t-stat of -3.471) and less financial slack (t-stat of
-4.266) are more likely to adopt EPPs. This suggests that firms are likely to avoid EPPs if
they have high levels of invested capital unless they have opportunities to sell
underperforming assets. Firms with greater geographic diversity (t-stat of 2.083) and greater
scale of operations (t-stat of 3.231) are more likely to adopt an EPP, consistent with
expectations.
Not surprisingly, firms that pay managers relatively high bonuses under traditional
plans are less likely to adopt an EPP (t-stat of –2.585). Prior profitability (OIBD/assets),
new investment, financial leverage, and shares held by executives are insignificant
determinants of EPP adoption.
Table 4 also reports the pseudo R-square, which is calculated as 1 minus the ratio of
the log-likelihood of the fully specified model to the log likelihood of a model that only
includes an intercept. For Model (4), the average pseudo R-square over the 1,000 estimations
equals 0.195.15 We also find that the average percentage of concordant observations across
the 1,000 individual estimations equals 75.4%.
Using the bootstrapped parameter estimates, we estimate the threshold probability
level (the probability cutoff value above which an observation would be classified as an
adopter) that minimizes the sum of the probabilities of type I and type II errors. At the
estimated threshold value for Model (4) of 2.9%, we find that the rate of correct
classification for the entire sample is 67.7%. This compares to a predicted 50% rate of
18
correct classification from the naïve model. The 50% correct classification rate is the
appropriate benchmark in this context because the models are estimated using an equal
number of adopters and nonadopters. Our findings indicate that the bootstrapped estimates
of the EPP prediction model do a good job discriminating between adopters and
nonadopters.
C. The Propensity Score Matching Method
We use an algorithm for implementing the propensity score matching method that is
described in Dehejia and Wahba (1998). First, we use the fitted values from the EPP
adoption model as the propensity scores. Next we rank all adopters based on their
propensity scores and divide them into quartiles. We eliminate all potential control firms
with propensity scores less than the minimum propensity score for adopters or greater than
the maximum propensity score for adopters. We then slot the remaining control firms into
the propensity score quartiles based on the cutoffs for the adopting firms.
The final step is to ensure that the control firms within each quartile are good
(comparable) matches for the adopters. T-tests for differences in means are performed
across adopters and control firms, and within each quartile, for both the propensity scores
and all other covariates from the logistic regression. If the matching procedure is successful,
we expect very few significant differences in the propensity scores or the explanatory
variables. If there are significant differences, Dehejia and Wahba (1998) suggest procedures
to fine-tune the process.
1. Investment Decisions, Operating Performance and Shareholder Value Comparison Based on Propensity Score Matching
We calculate the propensity scores, or fitted values, using the bootstrapped estimates
from Model (4) in Table 4. Using the algorithm described above, we obtain a sample of
15 Garvey and Milbourn (2000) report a pseudo-R2 of .0725 in their EVA adoption model without industry dummies and 0.128 with industry dummies.
19
control firms. We find that there are few significant differences in the mean values of the
propensity scores and the covariates between the adopters and control firms in the four
quartiles, and conclude there is no need to fine-tune the matching process.
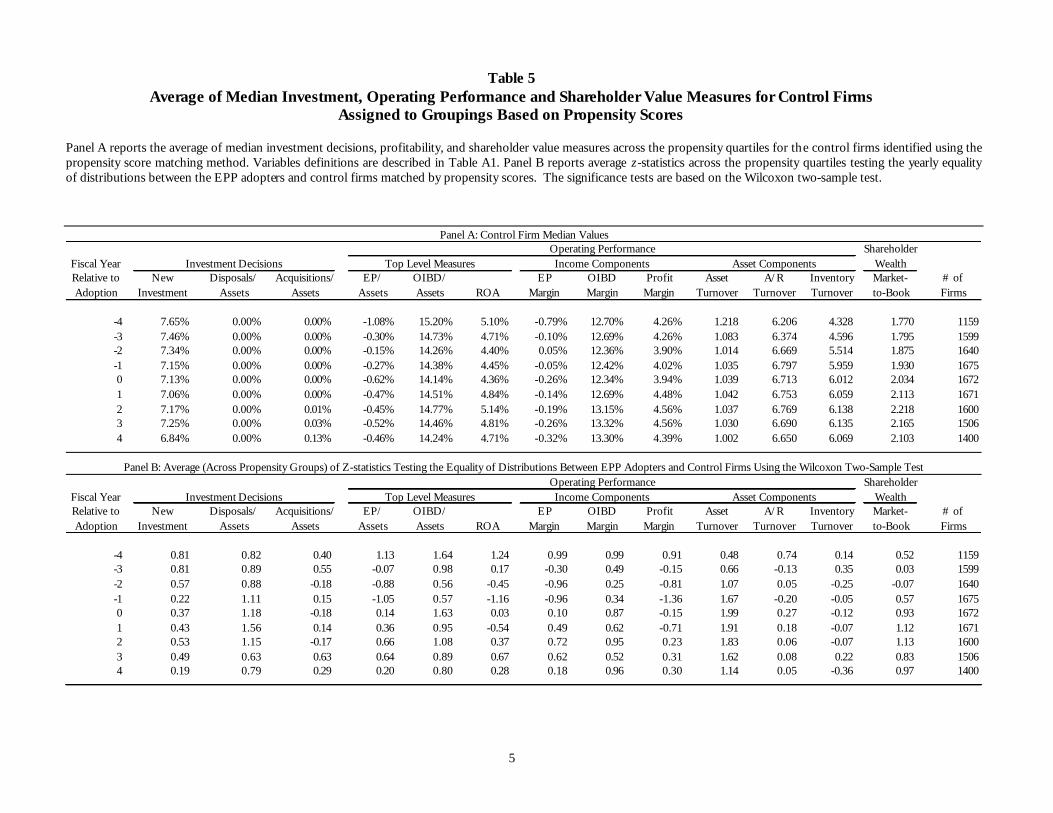
Panel A of Table 5 presents the median investment, operating performance and
shareholder value measures for the nonadopters, averaged across the four quartiles. These
measures can be compared to the same measures for the sample of adopters reported in
panel A of Table 2. It is important to remember that the numbers presented in Table 5 are
averages of the medians across the four quartiles, not the medians of the entire sample of
nonadopters. For this reason, we do not present t-tests for differences in mean values across
time periods. The z-statistics presented in Panel B represent average (across propensity
groups) z-statistics from tests of the equality of distributions across EPP adopters and
nonadopters using the Wilcoxon two-sample test. A positive sign indicates that the adopters
tend to have higher values than the nonadopters.
The z-statistics suggest that asset turnover is significantly higher for the adopter
firms in years –1 through year 2. The only other significant difference is that OIBD/Assets
is higher for adopters in years –4 and 0. Overall, there are no significant differences in the
investment policy and shareholder value variables and relatively few significant differences in
operating performance between adopters and the control sample of nonadopters. Although
we report average z-statistics here, the results are the same if we examine z-statistics for
individual propensity groups.
D. A Second Endogeneity Test
The second endogeneity test compares the operating performance of firms that
choose compensation plans according to the EPP prediction model to firms that make
surprising choices. If an adopting firm makes the optimal choice, it should have better
operating performance than a comparable firm that should have adopted but chose a
20
traditional plan instead. Similarly, if firms endogenously choose to compensate their
managers with traditional plans, they should have better operating performance than firms
that were expected to use a traditional plan but switched to an EPP.
The endogeneity test is conducted as follows.16 First, we build a 2×2 frequency table
by cross-classifying the observed and predicted responses. There are four possible
classifications: (1) firms that choose EPPs as predicted (anticipated adopters), (2) firms that
choose EPPs even though they resemble firms that use traditional plans (surprise adopters),
(3) firms that choose traditional plans as predicted (anticipated nonadopters), and (4) firms
that choose traditional plans even though they resemble firms that use EPPs (surprise
nonadopters). The next step compares the operating performance of the firms that behave
as predicted to that of firms that make surprising choices using the same testing approach
described in Section 4.
Using Model (4) and its threshold value of 2.9%, we cross-classify the entire sample
of adopters and nonadopters based on the observed and predicted responses. This
procedure identifies 72 anticipated adopters, 36 surprise adopters, 1,721 anticipated
nonadopters, and 820 surprise nonadopters.
1. The Operating Performance of Anticipated EPP Adopters
A direct comparison of the 72 “anticipated” adopters and 820 “surprise”
nonadopters is not particularly informative because the nonadopters have not been matched
by industry or year. Since it is important to control for these characteristics as well as prior
operating performance, we identify a sample of 72 matched firms from the sample of 820
“surprise” nonadopters using industry affiliation (two-digit SIC code), firm size (25% to
16 This test is motivated by Jung, Kim, and Stulz (1996) . They use qualitative dependent variable models to predict the outcomes of the endogenous decision to choose debt or equity. They then compare the stock market performance of firms that made issue decisions as predicted to those that issued against type.
21
200% of total assets in the year prior to adoption), and operating income (the firm with the
closest OIBD/assets ratio in the year prior to adoption).17
If “anticipated” adopters endogenously choose the optimal compensation plan, they
should experience better operating performance than firms that were predicted to adopt but
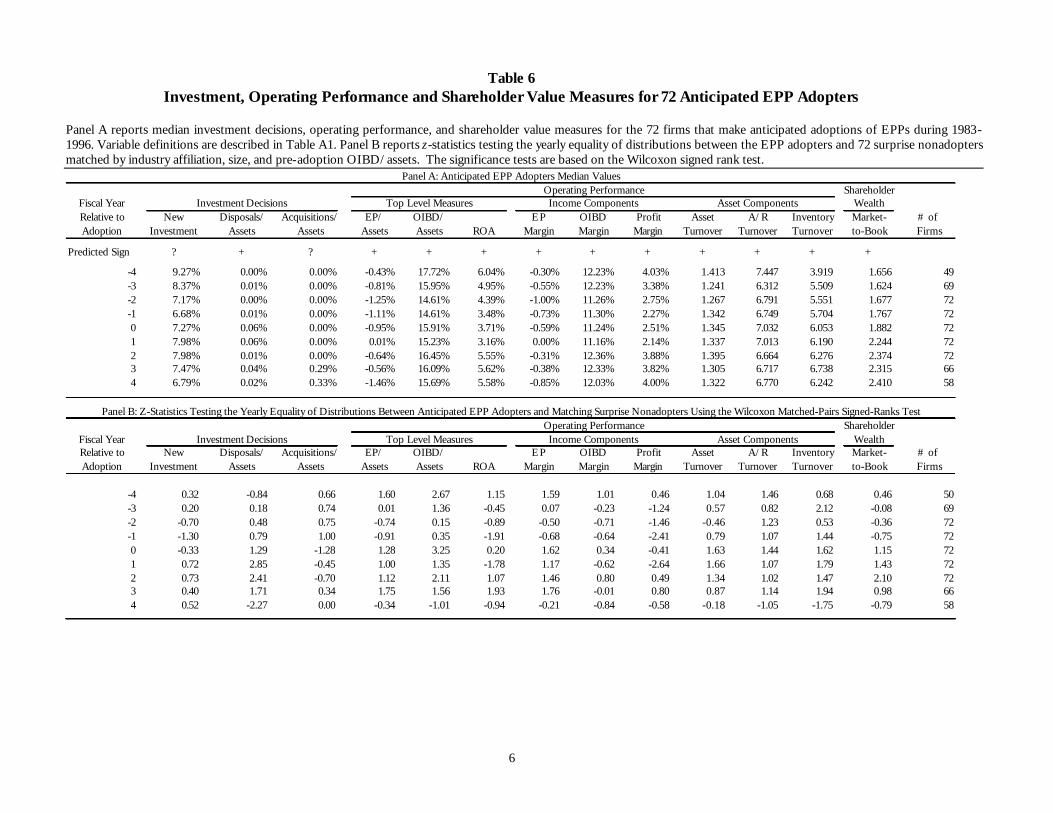
did not. Panel A of Table 6 reports the same median investment, operating performance,
and shareholder value measures for the 72 anticipated adopters as those in Panel A of Table
2. These results are consistent with those presented for the full sample of 108 adopters. In
unreported t-tests for differences across time periods, the anticipated adopters show
significant improvements in performance relative to their own past performance.
Panel B of Table 6 presents z-statistics from the Wilcoxon rank sum tests of the
performance differences between the “anticipated” adopters and the matched sample of
“surprise” nonadopters. The z-statistics indicate that anticipated adopters had significantly
higher levels of EP/assets and OIBD/assets in the past (year -4) relative to surprise
nonadopters, but their relative performance declined to the point where they became
indistinguishable. By contrast, accounting profits (ROA) were significantly lower in the year
prior to adoption, which likely resulted in smaller accounting-based bonuses. Firms may
decide to switch to an EPP to reinforce desirable behavior. Since managers already generate
relatively high levels of economic profits, an EPP makes it less attractive to pursue new ways
of improving accounting profitability that also sacrifice economic profits.
Consistent with expectations, anticipated adopters make changes in their investment
policies that improve operating performance and increase shareholder value. Table 6
indicates anticipated adopters sell more assets and have higher asset and inventory turnover
17 If no match is available using this criterion, then all firms that fail to adopt as predicted with (year prior to adoption) assets of 90% to 110% of the adopter are ranked, and the firm with the closest, but higher, Operating Income Before Depreciation/Assets ratio is selected as the matching firm. If an EPP adopter delists following adoption, both the adopter and the control firm are dropped from the analysis going forward. If a
22
rates than surprise nonadopters. They also generate higher levels of economic profits and
OIBD than control firms. Unfortunately, these results are not particularly strong because,
even though most of these measures have the correct sign, many of them are insignificant.
There are a number of cases where differences are significantly different from zero.
The EP to assets ratio is significantly greater than the comparable firms in year +3 and EP
margin is greater in years 0 and +3. In addition, the ratio of OIBD to assets is significantly
greater for anticipated adopters relative to the surprise nonadopters in the year of adoption
and in year 2, while ROA and profit margin are significantly lower in years –1 and +1.
Taken together, our results suggest that anticipated EPP adopters appear to make
changes in their investment behavior that reduce invested capital and for the most part allow
them to become more profitable. Although the evidence is not overwhelming, it is sufficient
to conclude that improvements have occurred both relative to their own past performance
and relative to firms that were expected to adopt but chose to remain with a traditional plan.
Finally, investors respond to adoptions by anticipated adopters as though the
improvements are expected to be permanent. Table 6 indicates that the market-to-book ratio
increases from 1.767 in the year prior to adoption to 2.410 in year 4. Not only is this increase
highly significant but the change in the market-to-book ratio is significantly greater than the
surprise nonadopters in year 2 (z-statistic of 2.10).
2. The Operating Performance of “Surprise” Adopters
The logistic model identifies 36 “surprise” adopters and 1,721 anticipated
nonadopters that choose a traditional compensation plan as predicted. Using the same
algorithm described above, we identify a sample of 36 matched firms from the sample of
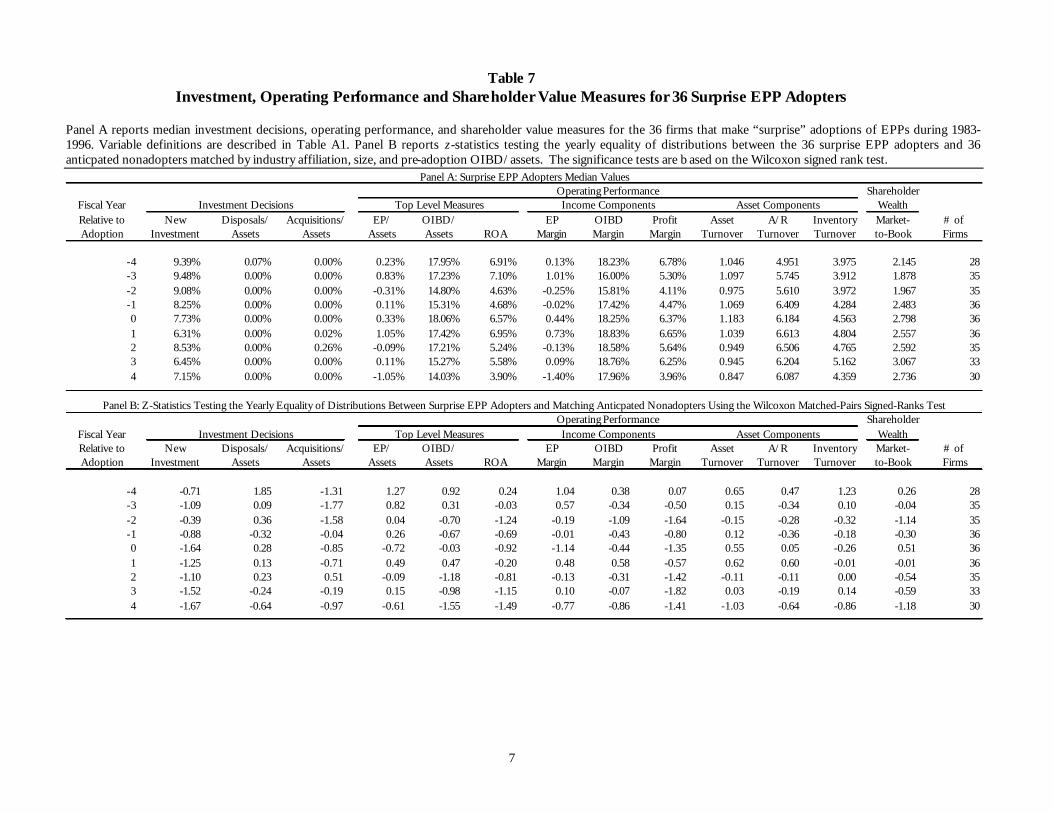
1,721 anticipated nonadopters. Table 7 shows there is no clear pattern of improvements in
investment decisions, operating performance or shareholder value for these firms, and there
control firm delists, we splice in an alternate control firm, also matched as of the year prior to adoption, going
23
is no evidence of significant differences between “surprise” adopters and nonadopting
comparison firms. When this result is combined with our previous finding that anticipated
adopters experience improved performance, it suggests that, on average, firms appear to be
making compensation choices that work best for them.
V. Conclusion
We have analyzed the long-run investment decisions, operating performance and
changes in shareholder wealth of firms adopting economic profit plans. For a sample of 108
firms that adopted EPPs between 1983 and 1996, we document significant improvements in
operating performance and shareholder value in the years following adoption. While these
results appear to support the hypothesis that EPPs motivate managers to make efficient
investment decisions that ultimately improve profitability and shareholder value, we seek to
answer the question of whether these firms are performing better than they would have had
they not adopted an EPP, i.e., whether firms endogenously choose the “optimal”
compensation plan.
Using our sample of EPP adopters and a sample of firms from Execucomp, we
estimate a logistic model of the decision to adopt an EPP. We use the fitted values from this
logistic regression to create a control sample matched on propensity scores, and also to
classify firms into four groups: anticipa ted adopters, surprise adopters, anticipated
nonadopters, and surprise nonadopters. We compare the investment decisions, operating
performance and shareholder value creation of adopters to those of the propensity score
control sample and are unable to reject the null hypothesis of no difference in investment
decisions or shareholder value creation and find relatively few significant differences in
operating performance between adopters and nonadopters.
forward.
24
We then compare the performance of “anticipated” adopters to “surprise”
nonadopters to examine whether firms that were predicted to adopt an economic profit plan
and did outperformed those predicted to adopt an economic profit plan but did not. Here
we find evidence consistent with our main hypothesis. Firms manage assets more efficiently,
operating performance improves, and shareholder value increases following an anticipated
adoption. By contrast, when compared to a sample of “anticipated” nonadopters, “surprise”
adopters fail to experience similar improvements.
We believe anticipated adopters have better experiences with EPPs because they
have more to gain from the adoption. Since they were identified as better candidates for
adoption ex ante, they were perhaps more likely to take the implementation seriously. This
may also explain the absence of significant findings in our full sample tests. The inclusion of
firms that make suspect choices may result in a loss of power because the level of
measurement error is too high to detect significant differences. Thus, the findings in this
study also highlight the importance of controlling for the endogeneity inherent in the choice
of a new compensation plan when evaluating subsequent changes in performance.
25
Bibliography
Balachandran, S.V., “How Does Residual Income Affect Investment? The Role of Prior
Performance Measures.” Working Paper, Columbia University (2003). Barber, B., and J. Lyon, “Detecting Abnormal Operating Performance: The Empirical Power
and Specification of Test Statistics.” Journal of Financial Economics, 41 (1996), 359-399. Biddle, G.C., R.M. Bowen, and J.S. Wallace, “Does EVA Beat Earnings? Evidence on
Associations with Stock Returns and Firm Values.” Journal of Accounting and Economics, 24 (1997), 301-336.
_____________, “Evidence on EVA.” Journal of Applied Corporate Finance, 12 (1999), 69-79. Charoenrook, A., “The Role of Capital Structure in Tests of Asset-Pricing Models,”
Working Paper, Vanderbilt University, (2002). Cosslett, S. R., “Maximum Likelihood Estimator for Choice-Based Samples,” Econometrica, 49
(1981), 1289 – 1316. Dehejia, R.H., and S. Wahba, “Propensity Score Matching Methods for Non-Experimental
Causal Studies.” Working Paper 6829, National Bureau of Economic Research (1998).
Garvey, G.T. and T.T. Milbourn, “EVA versus Earnings: Does it Matter Which Is More
Highly Correlated with Stock Returns?” Journal of Accounting Research 38 (2000 Supplement), 209-243.
Hamilton, R., An Introduction to Merchandize. Edinburgh (1777). Ittner, C.D., and D.F. Larcker, “Assessing Empirical Research in Managerial Accounting: A
Value-Based Management Perspective.” Journal of Accounting and Economics, 32 (2001), 349-410.
Jung, K., Y. Kim, and R. Stulz, “Timing, Investment Opportunities, Managerial Discretion,
and the Security Issuance Decision.” Journal of Financial Economics, 42 (1996), 159-185. Lehn, K., and A. Makhija, “EVA, Accounting Profits, and CEO Turnover: An Empirical
Examination 1985-1984.” Journal of Applied Corporate Finance, 10 (1997), 90-97. Manski, C. F., and S. R. Lerman, “The Estimation of Choice Probabilities from Choice
Based Samples.” Econometrica, 45 (1977), 1977-1988. Murphy, K. “Executive Compensation.” Working Paper, University of Southern California
(1998).
26
Myers, S. and N. Majluf, “Corporate Financing and Investment Decisions when Firms Have Information that Investors Do Not Have.” Journal of Financial Economics, 13 (1984), 187-221
Rosenbaum, P. and D. Rubin, “The Central Role of the Propensity Score in Observational
Studies for Casual Effects.” Biometrica, 70 (1983), 41-55. Wallace, J.S., “Adopting Residual Income-Based Compensation Plans: Do You Get What
You Pay For?” Journal of Accounting and Economics, 24 (1997), 275-300. Villalonga, B., “Does Diversification Cause the ‘Diversification Discount’?” Financial
Management, 33 (2004), 5-29. Zimmerman, J., “EVA and Divisional Performance Measurement: Capturing Synergies and
Other Issues.” Journal of Applied Corporate Finance, 10 (1997): 98-109.
1
Variable description Calculation details
Panel A: Investment DecisionsNew investment1 (Capital Expenditures + Research and Development)/Beg(Total assets) (Item128 + Item046)/Beg(Item006)
Disposals/Assets1 Dispositions/Beg(Total assets) Item107/Beg(Item006)
Acquisitions/Assets1 Acquisitions/Beg(Total assets) Item129/Beg(Item006)
Panel B: Operating Performance - Top LevelEP/Assets1,2 (Income before extraordinary Items+ 0.65*interest income - WACC*invested
capital) /Beg(Total assets)(Item018 + 0.65*Item015 - WACC*Item037)/Beg(Item006)
OIBD/Assets1 (OIBD + Interest income)/Beg(Total assets) (Item013 + Item062)/Beg(Item006)
ROA1 Net income/Beg(Total assets) Item172/Beg(Item006)
Panel C: Operating Performance - ComponentsEP margin2 (Income before extraordinary Items+ 0.65*interest income - WACC*invested
capital) /Sales(Item018 + 0.65*Item015 - WACC*Item037)/Item012
OIBD margin (OIBD + Interest income)/Sales (Item013 + Item062)/Item012Profit margin Net income including extraordinary Items/Sales Item172/Item012Asset turnover3 Sales/Average(Total assets) Item012/Average(Item006)
A/R turnover3 Sales/Average(Accounts receivable) Item012/Average(Item002)
Inventory turnover3 Cost of goods sold/Average(Inventory) Item041/Average(Item003)
Panel D: Shareholder valueMarket-to-book Shares*Price/Book value of equity (Item054*Item199)/Item060
Note 1: Beg(ItemXXX) indicates that the value is the beginning of period value for Compustat ItemXXX.
Note 3: Average(ItemXXX) indicates that the value is the average of the beginning and end of period values for Compustat ItemXXX.
Variable label
Table A1. Description of Variables Used to Measure Performance.
Panel A reports the details of the calculation of variables that measure investment decisions. ItemXXX refers to annual Compustat data item XXX. All variables are contemporaneously measured unless otherwise indicated. Panels B, C, and D report top-level operating performance measures, measures of the components of operating performance, and a measure of shareholder value, respectively
Note 2: The weighted average cost of capital is based on the Capital Asset Pricing Model. The risk free rate is the one month U.S. Treasury bill return from Ibbotson and Associates and is obtained from the Fama-French factors database (http://mba.tuck.dartmouth.edu/pages/faculty/ken.french/data_library.html). The market risk premium is assumed to be 7.5%. The unlevered beta is obtained from a market model regression where asset returns are the dependent variable and the value-weighted NYSE/AMEX/NASDAQ index is the market proxy. Asset returns are calculated as in Charoenrook (2002) who graciously provided the data. An industry average unlevered beta based on two-digit SIC code is used when asset returns are unavailable for particular firms.
2
Variable description Calculation details
Panel A: Growth opportunities and profitability variables
Market-to-book Shares*Price/Book value of equity (Item054*Item199)/Item060
OIBD/Assets1 (OIBD + Interest income)/Beg(Total assets) (Item013 + Item062)/Beg(Item006)
HEPD2 High Economic Profit Dummy Takes the value 1 if economic profits are in the top third percentile of each firm’s industry (based on two-digit SIC code) and zero otherwise.
HEPD x ROA Interact HEPD with ROA HEPD*Item172/Item006
Panel B: Investment policy variables
New investment1 (Capital Expenditures + Research and Development)/Beg(Total assets) (Item128 + Item046)/Beg(Item006)Tangible assets Natural logarithm of total assets ln(item006)Financial slack (Cash and liquid assets)/Total assets Item001/Item006
Panel C: Capital and organizational structure variables
Financial leverage Long-term debt/Total assets Item009/Item006Geographic diversity3 Square root of the number of geographic segments Sqrt(Segement ItemXXX)Scale of operations Natural logarithm of sales ln(item012)
Panel D: Compensation and ownership structure variables
Bonus compensation4 Bonus compensation is the logistic transformation of proportion of bonus compensation to total compensation.
Total compensation is the sum of the dollar values of salary, bonus, other compensation, savings plans, properties and insurance, long-term incentive payments, restricted stocks and stock options.
Shares held by executives4 Shares held by executives is calculated as the logistic transformation of total shares held by the CEO.
Total shares held by the CEO is the sum of shares outstanding in option grants, unexercised options, current shares held by CEOs, and options held by CEOs, deflated by total shares outstanding .
Note 1: Beg(ItemXXX) indicates that the value is the beginning of period value for Compustat ItemXXX.
Note 3: Sqrt(ItemXXX) indicates that the value is the square root of Compustat ItemXXX.
Note 4: Variables are either obtained from the Execucomp database when available or hand-collected from proxy statements otherwise.
Table A2. Description of Variables Used in EPP Prediction Model
Panel A reports the details of the calculation of variables that measure growth opportunities and profitability variables; Panel B defines investment performance variables; Panel C describes capital and organizational structure variables;and Panel D describes compensation and ownership structure variables. ItemXXX refers to annual Compustat data item XXX. All variables are measured in the year prior to adoption.
Variable label
Note 2: See Table A1 for detailed description of EP/Assets calculation.
1
Table 1 Number of Economic Profit Plan (EPP) Adoptions by Year and Industry
Panel A reports the number of EPP adoptions per year; Panel B reports the number of EPP adoptions by industrial classification. The industries listed in Panel B (defined by Compustat 2-digit SIC codes) are those in which at least two firms adopted an EPP over the sample period. Regulated utilities (SIC = 481 and 491-494) and financial institutions and their holding companies (SIC = 600-699) are excluded.
Panel A: Number of EP plan adopters by year Number of Percentage Year Adopters of Sample 1983 1 0.9 1987 1 0.9 1989 2 1.9 1990 2 1.9 1991 2 1.9 1992 8 7.4 1993 13 12.0 1994 26 24.1 1995 22 20.3 1996 31 28.7 Total 108 100.0%
Panel B: Number of EP plan adopters by industrial classification
Industry SIC Code Number of EPP Adopters Chemicals and Pharmaceuticals 28 14 Industrial and Commercial Machinery and Computer Equipment 35 11 Communication and Electronic Equipment 36 8 Engineering & Scientific Instruments 38 7 Printing, Publishing and Allied Industries 27 5 Rubber and Plastic Products 30 5 Primary Metal Industries 33 5 Food and Kindred Products 20 4 Furniture and Fixtures 25 4 Fabricated Metal Products 34 4 Business Services 73 4 Paper and Allied Products 26 3 Transportation Equipment 37 3 Motor Freight Transportation and Warehousing 42 3 Electric, Gas and Sanitary Services 49 3 Wholesale Trade –Durable Goods 50 3 Wholesale Trade – Nondurable Goods 51 3 Engineering, Accounting, Research, Management, and Related Services 87 3 Other - 16
2
Table 2 Tests of Changes in Investment Decisions, Operating Performance and Shareholder Value for EPP Adopters
Panel A reports median levels of investment decisions, operating performance, and shareholder value measures for the 108 firms adopting economic profit plans (EPPs) during 1983-1996. Variables definitions are described in Table A1. Panel B reports t-statistics testing whether mean measures are different across various time periods for the EPP adopters. The Post to Pre comparison is the average in the pre-adoption period of years –4 through –1 compared to the average of the post-adoption years 0 through 4.
Fiscal Year WealthRelative to New Disposals/ Acquisitions/ EP/ OIBD/ EP OIBD Profit Asset A/R Inventory Market- # of Adoption Investment Assets Assets Assets Assets ROA Margin Margin Margin Turnover Turnover Turnover to-Book Firms
Predicted Sign ? + ? + + + + + + + + + +
-4 9.90% 0.06% 0.04% -0.41% 17.82% 6.46% -0.19% 14.44% 5.44% 1.123 6.135 4.171 2.067 77-3 8.79% 0.02% 0.00% -0.33% 16.22% 5.47% -0.18% 13.85% 4.21% 1.139 5.993 4.504 1.901 104-2 8.96% 0.02% 0.01% -1.04% 15.01% 4.13% -0.77% 13.04% 3.10% 1.136 6.322 5.014 2.122 107-1 8.19% 0.03% 0.03% -0.84% 15.16% 3.92% -0.68% 13.11% 2.82% 1.188 6.352 5.047 2.372 1080 9.07% 0.03% 0.77% -0.39% 16.34% 4.83% -0.21% 13.29% 3.86% 1.221 6.491 5.273 2.605 1081 8.78% 0.04% 0.03% 0.25% 15.70% 4.54% 0.21% 13.82% 3.99% 1.220 6.726 5.513 2.699 1052 8.64% 0.01% 0.43% -0.29% 15.51% 5.38% -0.21% 14.48% 4.74% 1.167 6.523 5.725 2.825 1043 8.09% 0.09% 1.04% -0.40% 15.36% 5.41% -0.18% 14.32% 4.69% 1.130 6.476 6.138 2.874 964 7.19% 0.08% 0.29% -0.72% 15.07% 5.29% -0.51% 14.69% 4.33% 1.024 6.695 5.549 2.835 85
ShareholderWealth
Test New Disposals/ Acquisitions/ EP/ OIBD/ EP OIBD Profit Asset A/R Inventory Market- # of Firm-Years Investment Assets Assets Assets Assets ROA Margin Margin Margin Turnover Turnover Turnover to-Book Years
Pre to -1 -4.30 -0.87 0.64 -2.23 -2.83 -4.32 -0.72 -1.94 -3.19 1.61 0.96 1.41 -0.66 2880 to -1 -0.19 -0.24 -1.43 1.51 2.30 1.94 1.43 1.99 2.21 0.98 0.67 0.64 2.06 1081 to -1 0.14 1.68 0.53 0.62 0.78 1.37 0.42 1.16 1.96 0.12 -0.99 -0.20 3.34 1052 to -1 -0.25 0.75 -0.68 2.01 2.01 3.79 0.98 3.09 3.63 -0.15 -1.02 0.09 3.87 1043 to -1 0.59 1.83 0.35 1.75 1.10 2.81 0.21 1.83 2.53 -0.96 -1.04 -0.03 2.49 964 to -1 -1.11 2.37 -0.14 1.15 0.20 2.74 0.07 2.75 3.20 -1.59 -1.07 0.34 2.19 86
Post to Pre -6.51 4.78 0.51 1.27 0.06 2.00 0.70 4.35 4.21 1.81 -2.17 2.99 8.85 1829
Panel B: t-Statistics Testing the Differences in Performance Across Different Periods for Adopting Firms
Investment Decisions Top Level MeasuresOperating PerformanceIncome Components Asset Components
Panel A: Adopter Median ValuesShareholder
Investment Decisions Top Level MeasuresOperating PerformanceIncome Components Asset Components
3
Table 3 Means and Standard Deviations of Accounting and Compensation Structure
Variables Used in EPP Prediction Model The table reports the means and standard deviations of accounting and compensation structure variables for adopters (108 firms) in the year prior to adoption and a sample of nonadopters with the same year and SIC code as the adopters (2,541 firm-years). Variables definitions are described in Table A2.
T-test forVariable Mean Std. dev. Mean Std. dev. equal meansPanel A: Growth opportunities and profitibility variables
Market-to-Book 2.234 1.681 3.079 2.459 -4.918
OIBD/Total Assets 0.150 0.067 0.154 0.108 -0.604
High Economic Profit Dummy (HEPD) 0.877 0.330 0.851 0.357 0.818HEPD*ROA 0.040 0.052 0.059 0.075 -3.686
Panel B: Investment policy variables
New investment 0.088 0.062 0.115 0.089 -4.373Tangible assets 6.531 1.447 6.426 1.639 0.723
Financial slack 0.062 0.070 0.143 0.181 -10.483Panel C: Capital and organizational structure variables
Financial leverage 0.202 0.150 0.170 0.150 2.136
Geographic diversity 1.578 0.238 1.561 0.248 0.731Scale of operations 6.720 1.387 6.371 1.691 2.502
Panel D: Compensation and ownership structure variablesBonus compensation -0.621 0.201 -0.553 0.190 -3.389
Shares held by executives -0.796 0.082 -0.792 0.074 -0.604
EPP Adopters Nonadopter sample108 firm-years 2,541 firm-years
4
Table 4 Estimates of Logistic Prediction Model of EPP Adoptions Based on Stratified
Sample Procedure The table reports logistic regression estimates in which the dependent variable takes the value one for the 108 EP plan adopters and zero for the 2,541 control firms. Models (1) through (4) present bootstrapped estimates from a sample of 1,000 logistic regressions. Variable definitions are described in Table A2. All T-statistics based on bootstrapped coefficient estimates are given in parentheses; the pseudo-R2 equals 1 — (log-likelihood at convergence/log-likelihood at zero). ***, ** and * indicate that the coefficient is significant at the 0.01, 0.05, and 0.10 levels, respectively.
PredictedIndependent Variable Sign
Intercept 3.599 3.766 0.488 -0.385(9.492) *** (3.814) *** (0.391) (-0.149)
Market-to-book ratio - -0.425 - - -0.455(-4.032) *** (-3.857) ***
OIBD/Assets + 1.712 - - 2.457(0.866) (0.993)
High Economic Profit Dummy (HEPD) + 0.971 - - 1.555(2.394) ** (2.857) ***
HEPD*ROA - -8.104 - - -9.248(-2.331) ** (-3.041) ***
New investment +/- - -4.807 - -2.957(-3.346) *** (-1.332)
Tangible assets +/- - -1.012 - -1.496(-3.333) *** (-3.471) ***
Financial slack +/- - -8.554 - -7.729(-7.473) *** (-4.266) ***
Geographic diversity + - 1.117 - 1.451(2.084) ** (2.083) **
Scale of operations + - 0.837 - 1.342(2.755) *** (3.231) ***
Financial leverage +/- - - 1.252 -0.436 (1.555) (-0.551)
Bonus compensation - - - -1.921 -2.534(-3.126) *** (-2.585) ***
Shares held by executives - - - -1.799 -2.250(-1.249) (-0.896)
Average pseudo R2 0.063 0.123 0.023 0.195
Average -2 x Log-likelihood 789.76 757.14 796.70 648.21
Average % concordant observations 64.3% 67.3% 60.5% 75.4%
Rate of correct classification based on bootstrapped estimates 61.5% 62.8% 57.5% 67.7%
Bootstrapped threshold value 3.4% 3.2% 3.9% 2.9%
Regression Model(1) (2) (4)(3)
5
Table 5 Average of Median Investment, Operating Performance and Shareholder Value Measures for Control Firms
Assigned to Groupings Based on Propensity Scores Panel A reports the average of median investment decisions, profitability, and shareholder value measures across the propensity quartiles for the control firms identified using the propensity score matching method. Variables definitions are described in Table A1. Panel B reports average z-statistics across the propensity quartiles testing the yearly equality of distributions between the EPP adopters and control firms matched by propensity scores. The significance tests are based on the Wilcoxon two-sample test.
Fiscal Year WealthRelative to New Disposals/ Acquisitions/ EP/ OIBD/ EP OIBD Profit Asset A/R Inventory Market- # of Adoption Investment Assets Assets Assets Assets ROA Margin Margin Margin Turnover Turnover Turnover to-Book Firms
-4 7.65% 0.00% 0.00% -1.08% 15.20% 5.10% -0.79% 12.70% 4.26% 1.218 6.206 4.328 1.770 1159-3 7.46% 0.00% 0.00% -0.30% 14.73% 4.71% -0.10% 12.69% 4.26% 1.083 6.374 4.596 1.795 1599-2 7.34% 0.00% 0.00% -0.15% 14.26% 4.40% 0.05% 12.36% 3.90% 1.014 6.669 5.514 1.875 1640-1 7.15% 0.00% 0.00% -0.27% 14.38% 4.45% -0.05% 12.42% 4.02% 1.035 6.797 5.959 1.930 16750 7.13% 0.00% 0.00% -0.62% 14.14% 4.36% -0.26% 12.34% 3.94% 1.039 6.713 6.012 2.034 16721 7.06% 0.00% 0.00% -0.47% 14.51% 4.84% -0.14% 12.69% 4.48% 1.042 6.753 6.059 2.113 16712 7.17% 0.00% 0.01% -0.45% 14.77% 5.14% -0.19% 13.15% 4.56% 1.037 6.769 6.138 2.218 16003 7.25% 0.00% 0.03% -0.52% 14.46% 4.81% -0.26% 13.32% 4.56% 1.030 6.690 6.135 2.165 15064 6.84% 0.00% 0.13% -0.46% 14.24% 4.71% -0.32% 13.30% 4.39% 1.002 6.650 6.069 2.103 1400
Fiscal Year WealthRelative to New Disposals/ Acquisitions/ EP/ OIBD/ EP OIBD Profit Asset A/R Inventory Market- # of Adoption Investment Assets Assets Assets Assets ROA Margin Margin Margin Turnover Turnover Turnover to-Book Firms
-4 0.81 0.82 0.40 1.13 1.64 1.24 0.99 0.99 0.91 0.48 0.74 0.14 0.52 1159-3 0.81 0.89 0.55 -0.07 0.98 0.17 -0.30 0.49 -0.15 0.66 -0.13 0.35 0.03 1599-2 0.57 0.88 -0.18 -0.88 0.56 -0.45 -0.96 0.25 -0.81 1.07 0.05 -0.25 -0.07 1640-1 0.22 1.11 0.15 -1.05 0.57 -1.16 -0.96 0.34 -1.36 1.67 -0.20 -0.05 0.57 16750 0.37 1.18 -0.18 0.14 1.63 0.03 0.10 0.87 -0.15 1.99 0.27 -0.12 0.93 16721 0.43 1.56 0.14 0.36 0.95 -0.54 0.49 0.62 -0.71 1.91 0.18 -0.07 1.12 16712 0.53 1.15 -0.17 0.66 1.08 0.37 0.72 0.95 0.23 1.83 0.06 -0.07 1.13 16003 0.49 0.63 0.63 0.64 0.89 0.67 0.62 0.52 0.31 1.62 0.08 0.22 0.83 15064 0.19 0.79 0.29 0.20 0.80 0.28 0.18 0.96 0.30 1.14 0.05 -0.36 0.97 1400
Panel A: Control Firm Median ValuesShareholder
Investment Decisions Top Level MeasuresOperating PerformanceIncome Components Asset Components
Panel B: Average (Across Propensity Groups) of Z-statistics Testing the Equality of Distributions Between EPP Adopters and Control Firms Using the Wilcoxon Two-Sample TestOperating Performance
Investment Decisions Top Level Measures Income Components Asset ComponentsShareholder
6
Table 6 Investment, Operating Performance and Shareholder Value Measures for 72 Anticipated EPP Adopters
Panel A reports median investment decisions, operating performance, and shareholder value measures for the 72 firms that make anticipated adoptions of EPPs during 1983-1996. Variable definitions are described in Table A1. Panel B reports z-statistics testing the yearly equality of distributions between the EPP adopters and 72 surprise nonadopters matched by industry affiliation, size, and pre-adoption OIBD/assets. The significance tests are based on the Wilcoxon signed rank test.
Fiscal Year WealthRelative to New Disposals/ Acquisitions/ EP/ OIBD/ EP OIBD Profit Asset A/R Inventory Market- # of Adoption Investment Assets Assets Assets Assets ROA Margin Margin Margin Turnover Turnover Turnover to-Book Firms
Predicted Sign ? + ? + + + + + + + + + +
-4 9.27% 0.00% 0.00% -0.43% 17.72% 6.04% -0.30% 12.23% 4.03% 1.413 7.447 3.919 1.656 49-3 8.37% 0.01% 0.00% -0.81% 15.95% 4.95% -0.55% 12.23% 3.38% 1.241 6.312 5.509 1.624 69-2 7.17% 0.00% 0.00% -1.25% 14.61% 4.39% -1.00% 11.26% 2.75% 1.267 6.791 5.551 1.677 72-1 6.68% 0.01% 0.00% -1.11% 14.61% 3.48% -0.73% 11.30% 2.27% 1.342 6.749 5.704 1.767 720 7.27% 0.06% 0.00% -0.95% 15.91% 3.71% -0.59% 11.24% 2.51% 1.345 7.032 6.053 1.882 721 7.98% 0.06% 0.00% 0.01% 15.23% 3.16% 0.00% 11.16% 2.14% 1.337 7.013 6.190 2.244 722 7.98% 0.01% 0.00% -0.64% 16.45% 5.55% -0.31% 12.36% 3.88% 1.395 6.664 6.276 2.374 723 7.47% 0.04% 0.29% -0.56% 16.09% 5.62% -0.38% 12.33% 3.82% 1.305 6.717 6.738 2.315 664 6.79% 0.02% 0.33% -1.46% 15.69% 5.58% -0.85% 12.03% 4.00% 1.322 6.770 6.242 2.410 58
Fiscal Year WealthRelative to New Disposals/ Acquisitions/ EP/ OIBD/ EP OIBD Profit Asset A/R Inventory Market- # of Adoption Investment Assets Assets Assets Assets ROA Margin Margin Margin Turnover Turnover Turnover to-Book Firms
-4 0.32 -0.84 0.66 1.60 2.67 1.15 1.59 1.01 0.46 1.04 1.46 0.68 0.46 50-3 0.20 0.18 0.74 0.01 1.36 -0.45 0.07 -0.23 -1.24 0.57 0.82 2.12 -0.08 69-2 -0.70 0.48 0.75 -0.74 0.15 -0.89 -0.50 -0.71 -1.46 -0.46 1.23 0.53 -0.36 72-1 -1.30 0.79 1.00 -0.91 0.35 -1.91 -0.68 -0.64 -2.41 0.79 1.07 1.44 -0.75 720 -0.33 1.29 -1.28 1.28 3.25 0.20 1.62 0.34 -0.41 1.63 1.44 1.62 1.15 721 0.72 2.85 -0.45 1.00 1.35 -1.78 1.17 -0.62 -2.64 1.66 1.07 1.79 1.43 722 0.73 2.41 -0.70 1.12 2.11 1.07 1.46 0.80 0.49 1.34 1.02 1.47 2.10 723 0.40 1.71 0.34 1.75 1.56 1.93 1.76 -0.01 0.80 0.87 1.14 1.94 0.98 664 0.52 -2.27 0.00 -0.34 -1.01 -0.94 -0.21 -0.84 -0.58 -0.18 -1.05 -1.75 -0.79 58
Panel B: Z-Statistics Testing the Yearly Equality of Distributions Between Anticipated EPP Adopters and Matching Surprise Nonadopters Using the Wilcoxon Matched-Pairs Signed-Ranks TestOperating Performance
Investment Decisions Top Level Measures Income Components Asset ComponentsShareholder
Panel A: Anticipated EPP Adopters Median ValuesOperating Performance Shareholder
Investment Decisions Top Level Measures Income Components Asset Components
7
Table 7 Investment, Operating Performance and Shareholder Value Measures for 36 Surprise EPP Adopters
Panel A reports median investment decisions, operating performance, and shareholder value measures for the 36 firms that make “surprise” adoptions of EPPs during 1983-1996. Variable definitions are described in Table A1. Panel B reports z-statistics testing the yearly equality of distributions between the 36 surprise EPP adopters and 36 anticpated nonadopters matched by industry affiliation, size, and pre-adoption OIBD/assets. The significance tests are b ased on the Wilcoxon signed rank test.
Fiscal Year WealthRelative to New Disposals/ Acquisitions/ EP/ OIBD/ EP OIBD Profit Asset A/R Inventory Market- # of Adoption Investment Assets Assets Assets Assets ROA Margin Margin Margin Turnover Turnover Turnover to-Book Firms
-4 9.39% 0.07% 0.00% 0.23% 17.95% 6.91% 0.13% 18.23% 6.78% 1.046 4.951 3.975 2.145 28-3 9.48% 0.00% 0.00% 0.83% 17.23% 7.10% 1.01% 16.00% 5.30% 1.097 5.745 3.912 1.878 35-2 9.08% 0.00% 0.00% -0.31% 14.80% 4.63% -0.25% 15.81% 4.11% 0.975 5.610 3.972 1.967 35-1 8.25% 0.00% 0.00% 0.11% 15.31% 4.68% -0.02% 17.42% 4.47% 1.069 6.409 4.284 2.483 360 7.73% 0.00% 0.00% 0.33% 18.06% 6.57% 0.44% 18.25% 6.37% 1.183 6.184 4.563 2.798 361 6.31% 0.00% 0.02% 1.05% 17.42% 6.95% 0.73% 18.83% 6.65% 1.039 6.613 4.804 2.557 362 8.53% 0.00% 0.26% -0.09% 17.21% 5.24% -0.13% 18.58% 5.64% 0.949 6.506 4.765 2.592 353 6.45% 0.00% 0.00% 0.11% 15.27% 5.58% 0.09% 18.76% 6.25% 0.945 6.204 5.162 3.067 334 7.15% 0.00% 0.00% -1.05% 14.03% 3.90% -1.40% 17.96% 3.96% 0.847 6.087 4.359 2.736 30
Fiscal Year WealthRelative to New Disposals/ Acquisitions/ EP/ OIBD/ EP OIBD Profit Asset A/R Inventory Market- # of Adoption Investment Assets Assets Assets Assets ROA Margin Margin Margin Turnover Turnover Turnover to-Book Firms
-4 -0.71 1.85 -1.31 1.27 0.92 0.24 1.04 0.38 0.07 0.65 0.47 1.23 0.26 28-3 -1.09 0.09 -1.77 0.82 0.31 -0.03 0.57 -0.34 -0.50 0.15 -0.34 0.10 -0.04 35-2 -0.39 0.36 -1.58 0.04 -0.70 -1.24 -0.19 -1.09 -1.64 -0.15 -0.28 -0.32 -1.14 35-1 -0.88 -0.32 -0.04 0.26 -0.67 -0.69 -0.01 -0.43 -0.80 0.12 -0.36 -0.18 -0.30 360 -1.64 0.28 -0.85 -0.72 -0.03 -0.92 -1.14 -0.44 -1.35 0.55 0.05 -0.26 0.51 361 -1.25 0.13 -0.71 0.49 0.47 -0.20 0.48 0.58 -0.57 0.62 0.60 -0.01 -0.01 362 -1.10 0.23 0.51 -0.09 -1.18 -0.81 -0.13 -0.31 -1.42 -0.11 -0.11 0.00 -0.54 353 -1.52 -0.24 -0.19 0.15 -0.98 -1.15 0.10 -0.07 -1.82 0.03 -0.19 0.14 -0.59 334 -1.67 -0.64 -0.97 -0.61 -1.55 -1.49 -0.77 -0.86 -1.41 -1.03 -0.64 -0.86 -1.18 30
Panel A: Surprise EPP Adopters Median ValuesOperating Performance Shareholder
Investment Decisions Top Level Measures Income Components Asset Components
Panel B: Z-Statistics Testing the Yearly Equality of Distributions Between Surprise EPP Adopters and Matching Anticpated Nonadopters Using the Wilcoxon Matched-Pairs Signed-Ranks TestOperating Performance
Investment Decisions Top Level Measures Income Components Asset ComponentsShareholder