long-term record of nss-sulfate and nitrate in …dust.ess.uci.edu/ppr/ppr_psa03.pdf · miami, fl...
TRANSCRIPT

Long-Term Record of nss-Sulfate and Nitrate in Aerosols on Midway Island,
1981-2000: Evidence of Increased (now Decreasing?) Anthropogenic Emissions from Asia
Joseph M. Prospero and Dennis L. Savoie
Division of Marine and Atmospheric Chemistry
Rosenstiel School of Marine and Atmospheric Science
University of Miami
Miami, FL 33149, USA
Tel: 305-361-4159; Fax: 305-361-4457
E-mail: [email protected]
Richard Arimoto
CEMRC/New Mexico State University
Carlsbad, NM 88220, USA
Tel: 505-234-5503; Fax: 505-887-3051
E-mail: [email protected]
Submitted to:
Journal of Geophysical Research
Submitted: November 2001
Revised: May 2002

2
Abstract: Increasing anthropogenic emissions from Asia, especially from regions undergoing rapid industrial development, have raised interest in the outflow of chemically and radiatively important gases and aerosols. Previous studies have shown that high concentrations of Asian pollution spread over a broad region of the North Pacific every spring. Here we report on studies of aerosol concentrations at Midway Island (28º13’N, 177º22’W) in the central North Pacific over the period 1981-2000. Using a relatively simple procedure we estimate the natural and anthropogenic fractions of sulfate and nitrate aerosol and show that the estimated anthropogenic component almost doubled from 1981 to the mid 1990's. This increase closely parallels estimates of increased emissions of SO2 from China. However measurements in the late 1990’s suggest that sulfate and nitrate concentrations have stabilized and perhaps decreased. Thus pollution emissions from Asia over the longer term may be less than earlier projections, a factor which has implications for the assessment of future climate trends.
1. Introduction Airborne particles (aerosols) play an important role in climate by scattering and absorbing
both solar and terrestrial radiation and by modifying the distribution of clouds and their radiative properties. The recent assessment of the Intergovernmental Panel on Climate Change [IPCC, 2001] finds that models that incorporate the effects of anthropogenic sulfate aerosol along with greenhouse gases are better able to reproduce the surface temperature trends in the 20th century than models that do not consider aerosols.
The level of scientific understanding of aerosol effects is, however, very low and the uncertainty in estimates can be very large [IPCC, 2001; Haywood and Boucher, 2000]. At present our knowledge of global aerosol distributions and associated climate effects is largely dependent on models [IPCC, 2001; Haywood and Boucher, 2000]. There are few aerosol data from remote locations against which such models can be tested [IPCC, 2001; Haywood and Boucher, 2000] especially over the oceans [Prospero, 1996; Heintzenberg et al., 2000]. Such data are especially critical in areas impacted by transport from regions with rapidly developing economies where emission controls are often minimal and emission rates poorly documented. Much interest focuses on China, a major source of SO2 and nitrogen oxides (NOx) [Streets and Waldhoff, 2000; Streets et al., 2000; Lefohn et al., 1999; van Aardenne et al., 1999], species which react to form a large portion of the atmospheric aerosol burden. In 1990, China emitted 20% of the world’s SO2 making it the single largest source [Lefohn et al., 1999]; emissions are projected to more than double between 1995 and 2020 [Streets and Waldhoff, 2000; Streets et al., 2000; Lefohn et al., 1999; van Aardenne et al., 1999]. There is, however, considerable uncertainty in these estimates and there are often large differences among them.
Past studies have shown that large quantities of pollutants are transported eastward out of Asia during the spring [Hoell et al., 1997] yielding high concentrations of aerosols over a large area of the Pacific [Prospero et al., 1989; Savoie et al., 1989a] and sporadically over North America [Wilkening et al., 2000; Berntsen et al., 1999; Jaffe et al., 1999; Husar et al., 2001]. While such events are indicative of the potential for impacts from Asia, there is no firm evidence of the frequency and pervasiveness of such events or of long-term trends that could be linked to Asian emissions and thus might provide the basis for assessing future impacts.
Here we present the results from 20 years of almost continuous aerosol chemical measurements on Midway Island in the central North Pacific, about 5000 km distant from the coasts of North America and mainland Asia (Fig. 1). The objective of this study is to see if we can detect any trends in the data and if these trends could be associated with changes in

3
emissions. To this end we compare the Midway aerosol record with estimates of anthropogenic emissions in Asia.
There are many physical and chemical processes that can affect the transport of gases and particles over such great distances. Indeed the year-to-year variability in meteorology and longer term climate trends over this 20-year period could seriously complicate this simple approach. . The strongest climatic influence is likely to be the El Niño Southern Oscillation (ENSO). Although the effects of ENSO conditions on the transport of aerosols from Asia have not yet been studied explicitly, changes in rainfall patterns and in tropospheric winds associated with ENSO events [McPhaden, 1999] presumably affect the production, deposition and transport of various types of aerosol particles. Nonetheless the direct comparison of emissions with concentrations at a distant receptor site such as Midway is a necessary first step to a more complete understanding of these factors.
2. History and Procedures
Sampling began in 1981 [Prospero et al., 1989; Savoie et al., 1989a; Arimoto et al., 1989] and continued through the 1990’s [Arimoto et al., 1996; 1997]. Sampling is carried out on the climatological wind-ward shore on the eastern end of Sand Island. Initially we used a free-standing system at ground (2m) level on a pier. In December 1985 a 15 meter fold-over sampling tower was erected on a nearby beach where it remains in operation to this day. Samples were collected over week-long periods during on-shore winds (greater than 1 m s-1) from the ocean sector (330º through North to 150º). There are no major aerosol sources on Midway. Although Midway has been an active military air base since World War II, activity decreased sharply after the Vietnam War and in October 1978 Midway was redesignated as a Naval Air Facility. In April 1988 Midway Atoll was designated as an overlay National Wildlife Refuge and in October 1996 jurisdiction was transferred to the Department of the Interior. At present the resident population of Midway totals approximately 150; visitors are limited to 100 at a time.
Throughout the program we used Whatman-41 filters (20 x 25 cm) which in the marine boundary layer have a collection efficiency greater than 99% for nss SO4
=, 95% for NO3- marine
aerosols, and 99% for dust. Filters were subsequently analyzed for species that have both anthropogenic and natural sources. Non-sea-salt (nss) SO4
= (i.e., SO4= from sources other than
the salts in ocean-water spray droplets) is primarily derived from pollution sources and from the oxidation of dimethyl sulfide (DMS) emitted by marine phytoplankton [Kettle et al., 1999]. In remote ocean regions DMS is the dominant source of nss-SO4
= aerosol [Savoie et al., 1989a, 1994; Davis et al., 1999], and the ratio of methanesulfonate (MSA, another product of DMS oxidation) to nss SO4
= can be used to estimate the strength of this source [Savoie et al., 1989a, 1994]. Nitrate aerosol is derived from both natural and pollution sources [Holland et al., 1999]. Operational blanks are taken every fourth week. In Miami a quarter of each filter was extracted with water and analyzed for soluble species [Savoie et al., 1989a]. A quarter section of the filter was analyzed for Al by instrumental neutron activation analysis [Arimoto et al., 1996, 1997]; the Al concentration was converted to an equivalent soil aerosol value assuming an average crustal abundance, 8% Al [Taylor and McLennan, 1985]. Nss SO4
= is calculated as total SO4= minus the
Na+ concentration times 0.2517 (i.e., the SO4=:Na+ mass ratio in bulk sea water). Under most
conditions, especially during the spring when continental impacts are greatest, concentrations are well in excess of detection limits. Flow rates were determined from the differential pressure across a calibrated sharp-edged orifice plate (traceable to NBS standards) located in the sampler exhaust. Excluding some periods when the system suffered from obvious leaks, the flow rates were very stable. In 1987, the beginning of a long period when the sampling configuration was

4
basically unchanged, the annual mean flow rate (and standard deviation, SD) was 56.96 m3 hr-1 (SD 1.32); in 1998, the end of this period, it was 56.84 m3 hr-1 (SD 1.04). To eliminate marginal samples, we deleted all sample values where the sampler run time was less than 10% during the sampling week.
3. Results 3.1. Aerosol Temporal Variability and Trends
Nss-SO4= and NO3
- aerosol (Fig. 2) show considerable short-term variability but with a strong spring maximum. Peak monthly means (Fig. 3 and Table 1) occur in April and May largely due to transport from Asia [Prospero et al., 1989; Savoie et al., 1989a; Arimoto et al., 1989; Gao et al., 2001] as confirmed by the concurrent increase in mineral dust [Prospero et al., 1989] and 210Pb (half-life 22 years), a radioactive decay product of 222Rn emitted from soils and often used as a tracer of continental air masses [Turekian et al., 1989]. In spring back trajectories from Midway [Merrill, 1989] frequently lead to Asia. Air parcels emerge from the Asian coast generally between the altitudes of 5-10 km and travel rapidly to the east. Over the central Pacific trajectories turn southward, descend into the boundary layer over the ocean and eventually reach Midway after 4-6 days [Merrill, 1989]. Thus measurements made at Midway reflect the presence and properties of deep aerosol layers over a large area of the Pacific.
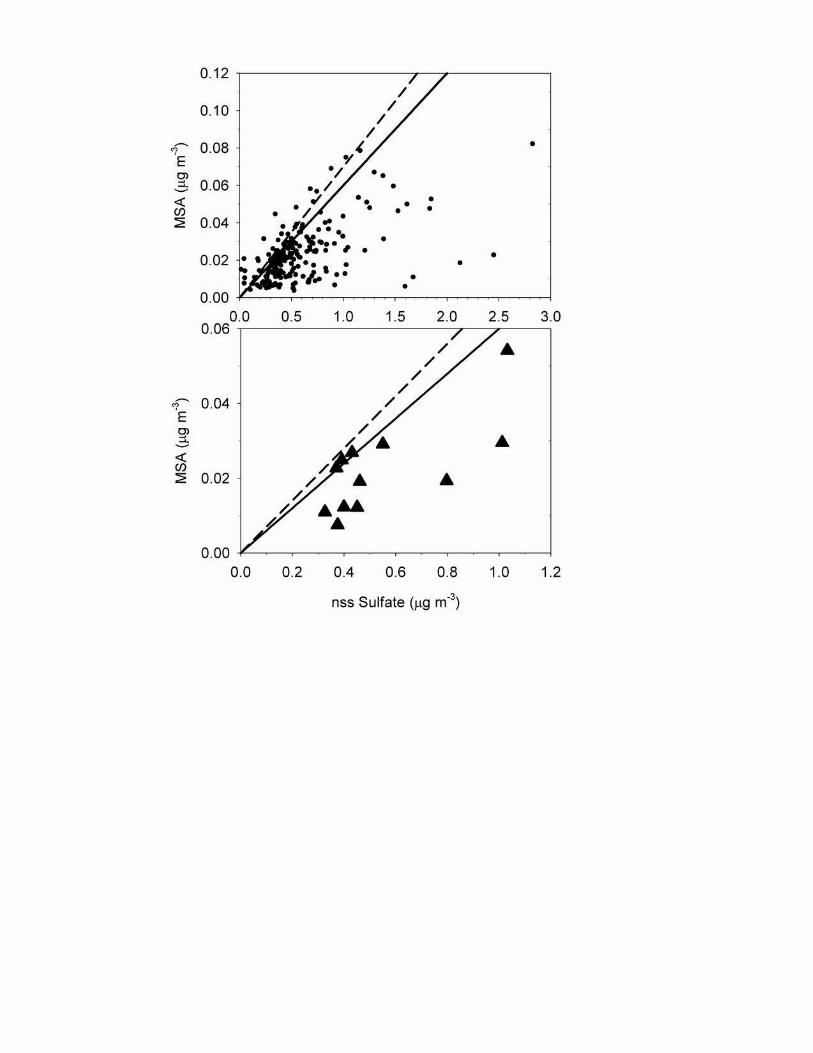
MSA also peaks in spring synchronous with oceanic DMS emissions [Kettle et al., 1999] (Fig. 3). A scatter plot of the individual sample data for MSA vs. nss-SO4
= yields a broad distribution which nonetheless shows a well-defined upper boundary (Fig. 4, top). A line drawn along this boundary yields a mass ratio of 0.06-0.07 for MSA vs. nss-SO4
=, a value that is consistent with ratios obtained in remote pollution-free tropical-subtropical regions [Wilkening et al., 2000; Savoie et al., 1994]. A scatter plot of monthly mean MSA vs. nss-SO4
= (Fig. 4, bottom) also yields a broad scatter. But here too there is an upper bound with the data points for July, August, and September falling in the slope range 0.06-0.07. The scatter plots support the conclusion that in July, August, and September, nss-SO4
= is primarily derived from DMS oxidation.
We use the MSA concentration and the “natural” tropical-subtropical mass ratio of MSA/nss-SO4
=, 0.07, to estimate the concentration of “natural” (DMS-derived) SO4= and we subtract this
from total nss-SO4= to obtain “anthropogenic” SO4
=. Figure 5 shows the monthly mean (1981-
2000) values of total nss-SO4= and the estimated “natural” and “anthropogenic” fractions
(henceforth, “nat-SO4=” and “anth-SO4
=” respectively). Anth-SO4= increases strongly in March
(0.52 µg m-3) along with mineral dust [Prospero et al., 1989; Gao et al., 2001] and peaks in April (0.59 µg m-3); in these months anth-SO4
= composes 65% and 58% of total nss-SO4=. In May
anth-SO4= falls off sharply along with dust while nat-SO4
= peaks sharply to 75% of total nss-SO4
=. In spring, 50% of nss-SO4= in the boundary layer at Midway is estimated to be
“anthropogenic”; on an annual basis, about 40%. Monthly mean NO3
- shows minimum values around 0.20 µg m-3 in winter and summer. We take this to be an estimate of “background” NO3
- which could conceivably contain both natural and anthropogenic contributions [Savoie et al., 1989b]. We subtract this from total monthly-mean NO3
- to estimate anth-NO3-. Anth-NO3
- reaches a maximum in spring, accounting for about half the total NO3
- (Fig. 5), on an annual basis, about a third. It should be noted that the anth-NO3
- and anth-SO4= peaks do not coincide; the NO3
- peak is shifted one month later. To elucidate trends we focus on spring, summer and winter data. We use summer and winter
data in two ways. First, on the assumption that pollution is minimal and natural long-term variability small, we use summer and winter data as a quality check, looking for changes that

5
might be a sign of operational or analytical difficulties. Second, we look for trends in the differences between spring values and those for summer and winter. Table 2 presents a summary of the grouped spring (March, April, May), summer (June, July, August), and winter (December, January, February) aerosol concentrations for the period 1981 to 2000; these are displayed in (Fig. 6).
The aerosol record at Midway is affected by climate and weather as well as by emissions from source regions in Asia. As previously stated two of the strongest ENSO events of the century occurred during our program, in 1982-1983 and 1997-1998, the latter being followed by a strong La Niña in 1998-1999 [McPhaden, 1999]. At the simplest level, ENSO-associated changes could affect our sampling statistics because the system is activated according to wind direction and speed. The sampler is located on the climatological windward shore; thus a change in wind climatology affects sampling times (and sample size) which results in smaller samples (and, hence, possibly “noisier” data) or no samples at all. ENSO could also affect transport out of Asia. Studies show a strong relationship between the El Niño/La Niña cycle and the East Asian Winter Monsoon (EAWM) [Wang, 2000; Li and Mu, 2000]. An et al. (1990) showed that over geological time scales, the highest dust fluxes to the Chinese loess plateau occurred during the cold and dry conditions associated with a strong EAWM. Thus we might expect ENSO events to affect the transport of pollutants as well as dust to the Pacific. Nonetheless, the tracking of aerosol concentrations at Midway with emissions in Asia suggests that meteorological variability was averaged out over the longer term. Also ENSO affects ocean hydrographic properties and biological processes [Chavez et al., 1999; Turk et al., 2001] over large areas of the Pacific, changes which could conceivably affect the production and emission of DMS to the atmosphere.
Nonetheless, while there are large deviations in spring concentrations in some years (e.g., 1983), there is no indication of trends in summer or winter data. Nitrate means remain essentially flat from 1986 to 1999. Summer nss-SO4
= is more variable due to low summertime nss-SO4=
values and to statistical variability introduced in computing nss-SO4=. Winter nss-SO4
= also shows increased variability because of high sea-salt concentrations often present in that season. Even so, taken as a whole, summer and winter data suggest that station operations and sampling protocols did not introduce any long-term biases in the data sets.
In contrast, mean springtime NO3- and nss-SO4
= show considerable year-to-year variability (Fig. 6) which makes it difficult to clearly discern trends. Nevertheless, the comparison of the springtime versus summertime data suggests an increasing divergence of values over the late 1980’s and early-middle 1990’s.
To investigate for trends in anth-SO4= we separated out DMS-derived SO4
= from total SO4=
using two different procedures. First, for the six years in which we measured MSA (1981, 1983, 1990, 1991, 1993, 1994), we converted the measured MSA values to equivalent nss-SO4
= using the “natural” tropical-subtropical MSA/nss-SO4
= mass ratio, 0.07. Second, using the same ratio we converted the mean springtime MSA for the entire data set, 33.3 ng m-3, to the equivalent SO4
=, 0.48 µg m-3, and subtracted this from the individual springtime nss-SO4= means. Although
there are considerable year-to-year changes in MSA concentrations (and, presumably, DMS-derived SO4
=), this should not obscure any large long-term trend in anth-SO4=. We also estimated
the long-term trend in anth-NO3- using the assumed “background” NO3
- concentration, 0.2 µg m-
3, and subtracting this from the spring means. These data (Fig. 7) show an increasing trend from the early 1980’s, with anth-SO4
= and anth-NO3- almost doubling by the mid-1990’s. As
expected anth-SO4= values calculated on the assumption of a constant DMS-SO4
= source are considerably more variable than those based on actual MSA measurements but both yield similar trends.

6
Our conclusion that anthropogenic aerosols increased at Midway from the early 1980’s to the middle 1990’s is based on the visual inspection of concentrations. It is difficult to assess the statistical significance of trends in atmospheric composition because of the stringent requirements on data sets [Weatherhead et al., 1998] especially for aerosols because of their great temporal variability. To statistically test the trends at Midway, we calculated the arithmetic mean concentrations for springtime anth-SO4
= for three years in which MSA data were available for estimating the biogenic SO4
= fraction directly. The mean anth-SO4= concentrations increased
from 0.24 µg m-3 (standard error, SE = 0.12) in 1981 to 0.48 µg m-3 (SE = 0.13) in 1990 to 0.65 µg m-3 in 1993. However the difference in the means as tested by an analysis of variance was at most marginally significant, with a probability for chance occurrence of 0.076. A comparable calculation for total NO3
- shows that concentrations increased from 0.38 µg m-3 in 1981 (SE = 0.055) to 0.45 µg m-3 (SE = 0.060) in 1990 to 0.58 µg m-3 (SE = 0.057) in 1993, with the difference in NO3
- means being closer to conventional levels of statistical significance, p = 0.050. Thus, even though these analyses are only marginally significant statistically, they support our conclusion that there has been an increase in NO3
- and SO4= aerosol at Midway.
3.2. Comparison with Asian Emissions
There are many estimates of Asian emissions to be found in the literature but only two track annual emissions over a multi year period during our program [Lefohn et al., 1999; Streets et al., 2000]. Both show strong increases over the 1980’s which continues into the mid-1990’s [Streets et al., 2000]. In East Asia (China, Japan, the Koreas), China is by far the largest source, emitting in 1997 24,971 Gg yr-1 SO2, 91.6% of the total in the region [Streets et al., 2000]. In Fig. 8 we show the Midway record of estimated anth-SO4
= along with the emissions reported by Lefohn et al. and Streets et al. There are substantial differences between these two estimates both in terms of absolute amounts and the rates of increase. Nonetheless, the trend in anth-SO4
= at Midway matches the estimated emissions in a general way, most closely those of Streets et al. More specifically, we compare the average anth-SO4
= calculated on the basis of the measured MSA concentrations using two-year means to minimize year-to-year variations. The mean spring anth-SO4
= for 1981 and 1983 was 0.35 µg m-3; for 1990-91, 0.50 µg m-3; and for 1993-94, 0.65 µg m-3. Thus the concentration of anth-SO4
= in 1990-91 was 1.43 times that in 1981 and 1983 while that for 1993-94 was 1.85 times greater. The emission data in Streets et al. [2000] yield increases of 1.49 and 1.61 for these same time periods. A similar comparison using the Lefohn et al. data for 1989-1990 relative to 1981 and 1983 yields an increase of 1.60.
There are no long-term data available on NOx emissions in Asia, but recent trends suggest they are increasing relative to SO2. From 1990 to 1997, NOx emissions in China increased 60% while those for East Asia as a whole increased by 49% [Streets and Waldhoff, 2000]; in contrast, SO2 emissions increased 12% in China and 8% for East Asia [Streets et al., 2000]. At Midway over the period 1981 to 1995 we see no systematic change in the relative concentrations of anth-SO4
= to anth-NO3-. However the ratios are quite variable from year-to-year, ranging from 1.4 to
3.1 (mean, 2.1) based on years where MSA was measured and from 1.5 to 2.8 (mean 2.0) using the mean MSA for the entire period. Thus it is not clear that we would be able to readily detect a relative change of about 50% over this time period, given the many variables beyond emission rates that effect the concentration of these two species. Another factor might be that NO3
- and SO4
= are largely produced from the combustion of fossil fuels; the source distributions could differ substantially. For example, in Asia, 76% of the sulfur emissions are from the combustion of coal [Streets et al., 2000], much of which is used for domestic heating which is highly

7
seasonal. This could also explain the fact that the seasonal peak in anth-SO4= occurs one month
before that in NO3- (Fig. 5).
4. Discussion and Conclusions
Our measurements on Midway Island show that estimated anthropogenic sulfate and nitrate aerosol concentrations almost doubled from 1981 to the mid 1990's paralleling increased emissions from China. Our estimates must be qualified by certain assumptions that we make in our assessment. First of all we assume that all spring-time SO4
= in excess of the DMS-derived (MSA-based) SO4
= is due to anthrogenic sources in Asia. With the exception of volcanoes [Graf et al., 1997], there are no natural sources on the continents that could account for the large amounts of “anth-SO4
=” that we see on Midway. Volcanic emissions would be sporadic and we would not expect to see coherent long-term trends as we do in our data. In contrast there are substantial natural NOx sources on the continents - e.g., lightning, soil emissions, biomass burning [Holland et al., 1999]. In total, these are relatively small compared to anthropogenic sources and furthermore some of them (e.g., biomass burning) would not be strong in the spring. Finally, the long term coherence of the Midway NO3
- trends and the match to anthropogenic emissions argues against a substantial and changing natural contribution.
Midway aerosols certainly contain materials from non-Asian sources but their contribution is probably minor. The North Pacific is impacted by pollutants from Europe and the former Soviet Union [Newell and Evans, 2000]. Over the period of our study, however, the emissions of SO2 from these regions have been relatively flat [Lefohn et al., 1999]. Moreover the impact of these sources over the North Pacific is greatest (but still small) during the winter, decreases during the spring, and is minimal during the summer [Newell and Evans, 2000].
The good match between our estimates of anthropogenic SO4= and NO3
- aerosol at Midway and the temporal trends of emissions in China suggests that either our assumptions are reasonable or that there was a remarkable coincidence of offsetting factors that result in an fortuitous match.
We point out that our data also suggest that anth-SO4= and anth-NO3
- at Midway have decreased since the mid 1990’s. We caution that we have less confidence in the later data although we have no specific reason to exclude it. During that time the US Navy Air Facility was in the process of being decommissioned and island operations turned over to the US Fish and Wildlife Service. Our sampling program was often compromised during that time. The number of useable samples decreased (Table 2) and the accumulated run times on samples was somewhat reduced. Also, as previously stated, the strong El Niños in 1982-1983 and 1997-1998 complicates interpretations because of expected changes in transport paths and precipitation.
Nonetheless, a downward trend in anth-SO4= concentrations in the late 1990’s would be
consistent with recent estimates [Streets et al., 2000] which show that in the middle 1990’s fossil fuel emissions from China had flattened and had begun to decline [Streets et al., 2001]. The estimate for 2000 [Streets, D.G., personal communication, July 2001] puts SO2 emissions at 20,753 Tg, a value comparable to that in the late 1980’s and early 1990’s. This value (plotted in Fig. 8) is broadly consistent with the reduced Midway concentrations. Thus the quantities of SO2 and associated pollutants emitted from Asian sources over the longer term may be less than that projected in many emission scenarios [IPCC, 2001; Streets and Waldhoff, 2000; van Aardenne et al., 1999; Foell et al., 1995; Grübler, 1998]. There is some evidence that NOx emissions in China have also begun to decline but the picture is not so clear as for SO2 [Streets, D.G., personal communication, July 2001].

8
We point out a curious feature in the data (Fig. 7) where over much of the record we see a very pronounced “saw-tooth” pattern in the concentrations of spring-time anth-SO4
=. This pattern in not seen in the six years when anth-SO4
= was estimated from measured MSA. This suggests that the saw-tooth pattern is largely an artifact generated by assuming constant DMS emissions. We see a similar saw-tooth pattern in spring-time NO3
- which matches that of nss-SO4
=. This suggests that the “background” NO3-, which we assumed to be constant in our
estimates (0.2 µg m-3), is also variable in phase with the oceanic source of DMS-SO4=. The
variability could be due to meteorological or hydrological factors that modulate the “background” concentrations of these species or of their production processes.
Our measurements focused on a limited number of aerosol species. The springtime air masses also carry high concentrations of other pollutants [Hoell et al., 1997]. Of particular interest are organic species including black carbon (BC) aerosols which can have a strong effect on radiative forcing [Jacobson, 2001]. There is evidence that aerosols emitted from Asia contain relatively large amounts of BC due to the widespread use of fossil fuels and biofuels under conditions where emissions are largely uncontrolled [Lelieveld et al., 2001]. Thus the air masses emerging from China in the spring carry with them a complex mix of aerosol and gas species which could have a strong impact on chemical processes and the oxidizing capacity of the atmosphere [Lelieveld et al., 2001]. Moreover, the high concentration of dust could further complicate the chemical processes in such air masses because of the large surface area afforded by the dust [Phadnis and Carmichael, 2001]. The evolution of these chemical processes with time, and the changing profile of emissions in China, could have implications for the long-range transport of pollutants across the North Pacific to North America.
Taken as a whole, the Midway data show that Asian emissions have had a great impact on aerosols over a large area of the North Pacific and possibly North America. This impact has changed markedly and rapidly over the past two decades. The assessment of the future climate effects of Asian aerosols over the Pacific will be challenging because of the complex composition of the windborne particles and their rapidly changing concentrations. This has implications regarding estimates of global warming because aerosols as a whole are believed to have, on balance, a cooling effect that partially offsets the warming due to greenhouse gases [IPCC, 2001].
Acknowledgements: This work was supported by grants from the National Science Foundation (ATM-94148461, 9414812, 9414808) and the National Aeronautics and Space Administration (NAG-57674). The authors thank L. Custals, T. Snowdon, D. Cullen, U. Tomza, and B. Ray for technical assistance and D. G. Streets for emissions data and helpful discussions. Finally we thank the many persons on Midway who have operated our station and carried out the sampling program, in particular H. Gunasekera.

9
References An, Z.S., T.S. Liu, Y.C. Lu, S.C. Porter, G. Kukla, X.H. Wu, Y.M. Hua, The long-term
paleomonsoon variation recorded by the loess-paleosol sequence in central China, Quat. Internat., 718, 91-95, 1990.
Arimoto, R., R.A. Duce and B.J. Ray, Concentrations, sources, and air/sea exchange of trace elements in the atmosphere over the Pacific Ocean, in Chemical Oceanography, vol. 10, edited by J.P. Riley, R. Chester, and R.A. Duce, pp. 107-149, Academic Press, London, 1989.
Arimoto, R., R.A. Duce, D.L. Savoie, J.M. Prospero, R. Talbot, J.D. Cullen, U. Tomza, N.F. Lewis, and B.J. Ray, Relationships among aerosol constituents from Asia and the North Pacific during PEM-West A, J. Geophys. Res., 101, 2011-2024, 1996.
Arimoto, R., R.A. Duce, J.M. Prospero, D.L. Savoie, R.W. Talbot, J.E. Dibb, B.G. Heikes, B.J. Ray, N.F. Lewis, and U. Tomza, Comparisons of trace constituents from ground stations and the DC-8 aircraft during PEM-West B, J. Geophys. Res., 102, 28,539-28,550, 1997.
Berntsen, T. K., S. Karlsdóttir, and D.A. Jaffe, Influence of Asian emissions on the composition of air reaching the northwestern United States, Geophys. Res. Lett., 26, 2171-2174, 1999.
Chavez, F.P., P.G. Strutton, G.E. Friederich, R.A. Feely, G.C. Feldman, D.G. Foley, M.J. McPhaden, Biological and Chemical Response of the Equatorial Pacific Ocean to the 1997-98 El Niño, Science, 286, 2126-2131, 1999.
Davis, D., G. Chen, A. Bandy, D. Thornton, F. Eisele, L. Mauldin, D. Tanner, D. Lenschow, H. Fuelberg, B. Huebert, J. Heath, A. Clarke, and D. Blake, Dimethyl sulfide oxidation in the equatorial Pacific: Comparison of model simulations with field observations for DMS, SO2, H2SO4(g), MSA(g), MS, and NSS, J. Geophys. Res., 104, 5765-5784, 1999.
Foell, W., C. Green, M. Amann, S. Bhattacharya, G. Carmichael, M. Chadwick, S. Cinderby, T. Haugland, J.-P. Hettelingh, L. Hordijk, J. Kuylenstierna, J. Shah, R. Shrestha, D. Streets, D. Zhao, Energy use, emissions and air pollution reduction strategies in Asia, Water Air Soil Poll., 85, 2277-2282, 1995.
Gao, Y., Y. Kaufman, D. Tanre, D. Kolber, and P.G. Falkowski, Seasonal distributions of aeolian iron fluxes to the global ocean, Geophys. Res. Lett., 28, 29-32, 2001.
Graf, H.-F., J. Feichter, and B. Langmann, Volcanic sulfur emissions: Estimates of source strength and its contribution to the global sulfate distribution, J. Geophys. Res., 102, 10,727-10,738, 1997.
Grübler, A., A review of global and regional sulfur emission scenarios. Mitigation and Adaptation Strategies for Global Change, 3, 383-418, 1998.
Haywood, J. and O. Boucher, Estimates of the direct and indirect radiative forcing due to tropospheric aerosols, Rev. Geophys., 38, 513-543, 2000.
Heintzenberg, J., D.C. Covert, R Van Dingenen, Size distribution and chemical composition of marine aerosols: A compilation and review, Tellus, Series B, 52, 1104-1122, 2000.
Hoell, J.M., D.D. Davis, S.C. Liu, R.E. Newell, H. Akimoto, R.J. McNeal, and R.J. Bendura, The Pacific Exploratory Mission-West Phase B: February-March 1994, J. Geophys. Res., 102, 28,223-28,240, 1997.
Holland, E.A., F.J. Dentener, B.H. Braswell and J.M. Sulzman, Contemporary and pre-industrial global reactive nitrogen budgets, Biogeochem., 46, 7-43, 1999.
Husar, R.B., D. M. Tratt, B. A. Schichtel, S. R. Falke, F. Li, D. Jaffe, S. Gassó, T. Gill, N. S. Laulainen, F. Lu, M.C. Reheis, Y. Chun, D. Westphal, B. N. Holben, C. Gueymard, I. McKendry, N. Kuring, G. C. Feldman, C. McClain, R. J. Frouin, J. Merrill, D. DuBois, F.

10
Vignola, T. Murayama, S. Nickovic, W. E. Wilson, K. Sassen, N. Sugimoto, W.C. Malm, The Asian dust events of April 1998, J. Geophys. Res, in press, 2001.
IPCC, Technical Summary of Working Group 1 Report, May 2001. The Intergovernmental Panel on Climate Change (IPCC), World Meteorological Organisation (WMO) and United Nations Environment Programme (UNEP). (Accepted by Working Group I of the IPCC but not approved in detail.). http://www.ipcc.ch/.
Jaffe, D., T. Anderson, D. Covert, R. Kotchenruther, B. Trost, J. Danielson, W. Simpson, T. Berntsen, S. Karlsdottir, D. Blake, J. Harris, G. Carmichael, and I. Uno, Transport of Asian air pollution to North America, Geophys. Res. Lett., 26, 711-714, 1999.
Jacobson, M. Z., Global direct radiative forcing due to multicomponent anthropogenic and natural aerosols, J. Geophys. Res., 106 (D2), 1551-1568, 2001.
Kettle, A.J., M.O. Andreae, D. Amouroux, T.W. Andreae, T.S. Bates, V. Berrresheim, H. Bingemer, R. Boniforti, M.A.J. Curran, G.R. DiTullio, G. Helas, G.B. Jones, M.D. Keller, R.P. Kiene, C. Leck, M. Levasseur, G. Malin, M. Maspero, P. Matrai, A.R. McTaggart, N. Mihalopoulos, B.C. Nguyen, A. Novo, J.P. Putaud, S. Rapsomanikis, G. Roberts, G. Schebeske, S. Sharma, R. Simo, R. Staubes, S. Turner and G. Uher, A global database of sea surface dimethylsulfide (DMS) measurements and a procedure to predict sea surface DMS as a function of latitude, longitude and month, Global Biogeochem. Cyc., 13, 399-444, 1999.
Lefohn, A.S., J.D. Husar, R.B. Husar, Estimating historical anthropogenic global sulfur emission patterns for the period 1850-1990, Atmos. Environ., 33, 3435-3444, 1999.
Lelieveld, J., P.J. Crutzen, V. Ramanathan, M.O. Andreae, C.A.M. Brenninkmeijer, T. Campos, G.R. Cass, R.R. Dickerson, H. Fischer, J.A. de Gouw, A. Hansel, A. Jefferson, D. Kley, A.T.J. de Laat, S. Lal, M.G. Lawrence, J.M. Lobert, O.L. Mayol-Bracero, A.P. Mitra, T. Novakov, S.J. Oltmans, K.A. Prather, T. Reiner, H. Rodhe, H.A. Scheeren, D. Sikka, and J. Williams, The Indian Ocean Experiment: Widespread air pollution from South and Southeast Asia, Science, 291 (5506), 1031-1036, 2001.
Li C., and M. Mu, Relationship between the East Asian winter monsoon, warm pool situation and ENSO cycle, Chinese Science Bulletin, 45, 1448-1455, 2000.
McPhaden, M.J., Genesis and Evolution of the 1997-98 El Niño, Science, 283, 950-954, 1999. Merrill, J.T., Atmospheric long-range transport to the Pacific Ocean, in Chemical
Oceanography, vol. 10, edited by J.P. Riley, R. Chester, and R.A. Duce, pp 15-50, Academic Press, London, 1989.
Newell, R.E. and M.J. Evans, Seasonal changes in pollutant transport to the North Pacific: the relative importance of Asian and European sources, Geophys. Res. Lett., 27 (16), 2509-2512, 2000.
Phadnis, M.J. and G.R. Carmichael, Numerical investigation of the influence of mineral dust on the tropospheric chemistry of East Asia, J. Atmos. Chem., 36 (3), 285-323, 2000.
Prospero, J.M., M. Uematsu and D. Savoie, Mineral aerosol transport to the Pacific Ocean, in Chemical Oceanography, vol. 10, edited by J.P. Riley, R. Chester, and R. A. Duce, pp. 188-218, Academic Press, London, 1989.
Prospero, J.M., The Atmospheric Transport of Particles to the Ocean, in Particle Flux in the Ocean, edited by V. Ittekkott, S. Honjo, and P.J. Depetris, SCOPE Report 57, pp. 19.52, John Wiley, New York, 1996.
Savoie, D.L., J.M. Prospero and E.S. Saltzman, Nitrate, non-seasalt sulfate and methanesulfonate over the Pacific Ocean, in Chemical Oceanography, vol. 10, edited by J.P. Riley, R. Chester, and R.A. Duce, pp. 219-250, Academic Press, London 1989a.

11
Savoie, D.L., J.M. Prospero, and E.S. Saltzman, Non-sea-salt sulfate and nitrate in tradewind aerosols at Barbados: Evidence for long-range transport, J. Geophys. Res., 94, 5069-5080, 1989b.
Savoie, D. L., J. M. Prospero, R. Arimoto, and R. A. Duce, Non-sea-salt sulfate and methanesulfonate at American Samoa, J. Geophys. Res., 99, 3587-3596, 1994.
Streets, D.G. and S.T. Waldhoff, Present and future emissions of air pollutants from China: SO2, NOx, and CO, Atmos. Environ., 34, 363-374, 2000.
Streets, D.G., N.Y. Tsai, H. Akimoto and K. Oka, Sulfur dioxide emissions in Asia in the period 1985-1997, Atmos. Environ., 34, 4413-4424, 2000.
Taylor, S.R., and S.M. McLennan, The Continental Crust: Its Composition and Evolution, Blackwell, Cambridge, Mass., 1985.
Turekian, K.K., W.C. Graustein and J.K. Cochran, Lead-210 in the SEAREX Program: An aerosol tracer across the Pacific, in Chemical Oceanography, vol. 10, edited by J.P. Riley, R. Chester, and R.A. Duce, pp. 51-81, Academic Press, London, 1989.
Turk, D., M.J. McPhaden, A.J. Busalacchi, M.R. Lewis, Remotely Sensed Biological Production in the Equatorial Pacific, Science, 293, 471-474, 2001
van Aardenne, J.A., G.R. Carmichael, H. Levy II, D. Streets, and L. Hordijk, Anthropogenic NOx Emissions in Asia in the Period 1990-2020, Atmos. Environ., 33, 633-646, 1999.
Wang, H., The interannual variability of East Asian Monsoon and its relationship with SST in a couple atmosphere-ocean-land climate model, Advances Atmos. Sci., 17, 31-47, 2000.
Weatherhead, E.C., G.C. Reinsel, G.C. Tiao, X.-L Meng, D. Choi, W.-K. Cheang, T. Keller, J. DeLuisi, D.J. Wuebbles, J.B. Kerr, A.J. Miller, S.J. Oltmans, J.E. Frederick, Factors affecting the detection of trends: Statistical considerations and applications to environmental data, J. Geophys. Res., 103, 17,149- 17,162, 1998.
Wilkening, K.E., L.A. Barrie and M. Engle, Trans-Pacific air pollution, Science, 290, 65-67, 2000.

Table 1. Midway Monthly Mean Aerosol Concentration Data, 1981-2000* ________________________________________________________________________________________________
Species
Jan Feb Mar Apr May Jun Jul Aug Sep Oct Nov Dec Annual
nss-Sulfate Mean 0.375 0.400 0.797 1.012 1.032 0.550 0.370 0.431 0.391 0.461 0.451 0.326 0.558
(µg m-3)
Median 0.334 0.329 0.725 0.965 0.885 0.514 0.377 0.375 0.391 0.452 0.367 0.300 0.444
Std Dev 0.312 0.273 0.433 0.594 0.738 0.214 0.140 0.260 0.199 0.245 0.381 0.232 0.453
Count 48 47 49 57 60 50 58 60 57 49 51 49 635
Nitrate Mean 0.209 0.270 0.370 0.475 0.458 0.265 0.185 0.205 0.240 0.280 0.280 0.218 0.289
(µg m-3) Median 0.218 0.241 0.372 0.477 0.432 0.248 0.189 0.187 0.229 0.260 0.262 0.196 0.247
Std Dev 0.092 0.126 0.143 0.217 0.198 0.097 0.056 0.070 0.106 0.096 0.164 0.107 0.162
Count 50 51 51 58 60 50 58 60 59 49 53 52 651
Dust Mean 0.322 0.863 2.070 2.745 1.925 0.492 0.110 0.104 0.253 0.406 0.620 0.278 1.030
(µg m-3) Median 0.251 0.627 1.639 1.526 1.266 0.271 0.098 0.091 0.147 0.319 0.361 0.228 0.413
Std Dev 0.285 0.713 1.687 3.416 1.756 0.528 0.058 0.132 0.317 0.515 0.607 0.224 1.749
Count 21 30 36 50 55 32 30 33 32 27 30 31 407
MSA Mean 7.529 12.279 19.332 29.485 54.111 29.066 22.731 26.853 24.855 19.095 12.187 10.946 23.41
(ng m-3) Median 7.259 9.649 17.544 25.549 50.009 28.231 21.810 21.368 20.626 15.584 11.824 7.841 20.32
Std Dev 2.507 6.949 5.950 11.470 20.811 6.400 6.433 15.248 13.307 7.364 3.154 6.911 15.83
Count 12 14 13 18 19 18 21 21 22 17 20 15 210
*Maximum monthly mean and median for each species shown in bold.

Table 2. Seasonal Aerosol Concentration Statistics: Spring, Summer, Winter __________________________________________________________________________________________________________________________________________________________________________________________________________________________________________________________________________________________________________________
Spring: March, April, May __________________________________________________________________________________________________________________________________________________________________________________________________________________________________________________________________________________________________________________ 1981 1982 1983 1984 1985 1986 1987 1988 1989 1990 1991 1992 1993 1994 1995 1996 1997 1998 1999 2000 __________________________________________________________________________________________________________________________________________________________________________________________________________________________________________________________________________________________________________________
nss sulfate (µg m3) Average 0.896 0.825 0.915 0.768 0.914 1.066 0.891 1.080 0.918 1.215 1.052 0.870 1.224 0.439 0.848 0.649 1.066 Standard Deviation 0.693 0.342 0.722 0.540 0.519 0.585 0.499 0.599 0.404 0.409 0.547 0.443 0.723 0.210 0.583 0.451 0.475 Count 13 13 12 12 13 12 12 10 11 6 13 13 3 7 10 11 7 Nitrate (µg m3) Average 0.368 0.408 0.371 0.396 0.358 0.508 0.385 0.525 0.422 0.587 0.563 0.410 0.465 0.304 0.437 0.394 0.501 Standard Deviation 0.132 0.141 0.130 0.1.95 0.194 0.199 0.131 0.204 0.213 0.172 0.242 0.187 0.183 0.120 0l.268 0.219 0.187 Count 14 13 12 12 13 12 12 10 122 6 13 14 5 7 10 11 7 Dust (µg m3) Average 1.923 1.378 2.154 2.189 1.467 3.681 1.903 4.958 1.446 2.218 1.895 1.501 0.814 0.870 3.618 2.146 3.080 Standard Deviation 1.863 0.922 1.706 1.454 1.237 3.439 1.098 3/072 1.288 0.742 1.606 0.990 0.785 7.095 2.293 3.607 Count 14 13 12 12 13 8 9 9 4 2 11 14 1 6 6 11 7 MSA (ng m3) Average 44.3 33.4 32.3 46.5 28.4 15.3 Standard Deviation 28.5 9.6 18.8 10.6 15.6 6.7 Count 14 6 12 6 13 4 __________________________________________________________________________________________________________________________________________________________________________________________________________________________________________________________________________________________________________________
Summer: June, July August __________________________________________________________________________________________________________________________________________________________________________________________________________________________________________________________________________________________________________________
nss sulfate (µg m3) Average 0.577 0.513 0.298 0.494 0.498 0.437 0.549 0.393 0.446 0.468 0.468 0.498 0.271 0.337 0.462 0.324 Standard Deviation 0.141 0.271 0.278 0.199 0.161 0.170 0.343 0.104 0.165 0.112 0.280 0.376 0.320 0.003 0.138 0.063 Count 11 14 11 13 12 14 13 14 13 13 12 13 3 2 7 12 Nitrate (µg m3) Average 0.301 0.256 0.156 0.227 0.241 0.218 0.239 0.198 0.241 0.221 0.242 0.186 0.212 0.153 0.230 0.176 Standard Deviation 0.114 0.130 0.119 0.033 0.100 0.096 0.104 0.043 0.071 0.046 0.092 0.048 0.166 0.023 0.068 0.030 Count 12 14 11 13 12 14 13 14 13 13 12 13 3 2 7 12 Dust (µg m3) Average 0.925 0.275 0.273 0.423 0.295 0.374 0.162 0.137 0.129 0.215 Standard Deviation 2.185 0.171 0.348 0.363 0.114 0.743 0.117 0.120 0.317 0.158 Count 12 14 11 6 2 13 12 10 7 12 MSA (ng m3) Average 38.1 22.0 21.8 27.0 28.0 Standard Deviation 24.9 6.4 7.4 7.3 16.7 Count 12 14 13 13 12

14
Table 2 (cont’d). Seasonal Aerosol Concentration Statistics: Spring, Summer, Winter
Winter: December, January, February ______________________________________________________________________________________________________________________________________________________________________________________________________________________________________________________________________________________________________________________________________________________________________________________________________________________________________________________________________________
nss sulfate (µg m3) Average 0.328 0.302 0.516 0.051 0.35 0.35 0.711 0.445 0.381 0.496 0.401 0.398 0.447 0.303 0.217 0.359 0.327 0.226 Standard Deviation 0.039 0.244 0.193 0.198 0.098 0.18 0.218 0.226 0.233 0.265 0.226 0.214 0.401 0.164 0.213 0.218 0.216 0.188 Count 2 9 5 13 2 6 11 5 8 12 4 7 11 7 4 10 13 13 Nitrate (µg m3) Average 0.19 0.258 0.254 0.137 0.23 0.281 0.234 0.197 0.207 0.292 0.232 0.258 0.234 0.23 0.232 0.242 Standard Deviation 0.071 0.08 0.072 0.152 0.096 0.137 0.084 0.055 0.084 0.193 0.08 0.114 0.091 0.071 0.133 0.152 Count 2 9 5 13 6 11 5 8 12 9 11 10 6 12 13 13 Dust (µg m3) Average 1.013 0.44 0.455 0.597 0.375 0.243 0.428 0.393 0.441 0.606 Standard Deviation 0.866 0.592 0.253 0.882 0.245 0.104 0.475 0.192 0.422 0.352 Count 2 9 5 13 3 4 8 9 13 13 MSA (ng m3) Average 20.55 9.967 8.92 6.977 10.76 8.899 Standard Deviation 2.051 2.998 4.564 0.887 7.715 3.19 Count 2 6 8 4 9 11 ___________________________________________________________________________________________________________________________________________________________________________________________________________________________________________________________________________________________________________________

Figure Captions
Figure 1. Map of the North Pacific Figure 2. Time series of aerosol NO3
-, nss-SO4=, and MSA concentrations at Midway Island,
1981-2000, measured on week-long filter samples. Units: aerosol concentration, nss-SO4= and
NO3-, µg m-3; methanesulfonate (MSA), ng m-3. Years from 1981 to 2000.
Figure 3. Annual cycle of concentration distributions of: a., nss-SO4
=; b., NO3-; c., mineral dust;
d., methanesulfonate (MSA). Units: aerosol concentration, µg m-3 except MSA, ng m-3. Small dots represent individual week-long sample data over the period 1981-2000. Heavy filled triangles show monthly means; bars show ± one standard deviation. Figure 4. Top, scatter plot of MSA vs nss-SO4
=, weekly samples; bottom, the same using monthly means. The dashed line has a slope of 0.07, the solid line, 0.06. Figure 5. Annual cycle of monthly mean total nss-SO4
=, NO3-, and mineral dust along with the
estimated natural and anthropogenic SO4= and NO3
- contributions (see text). The figure is based on the entire data set, 1981-1990. Units: aerosol concentration, µg m-3. Figure 6. Mean winter, spring, and summer concentrations of nss-SO4
= (top) and NO3- (bottom)
for the years 1981 to 2000. Units: aerosol concentration, µg m-3. Figure 7. Estimated spring concentrations of anthropogenic SO4
= and NO3- (see text). Units:
aerosol concentration, µg m-3. Figure 8. Anthropogenic sulfate aerosol concentrations on Midway and SO2 emissions from China. Springtime concentrations of estimated anthropogenic SO4
= at Midway (see Fig. 7) are shown along with estimates of SO2 emissions from China: “Lefohn et al., China” [Lefohn et al., 1999]; “Streets et al., China” [Streets et al., 2000]. To facilitate comparison with the data by Lefohn et al. the data shown as “Streets et al., extrapolate” were linearly back-extrapolated from Streets et al. [2000] using data for the years 1985-1990 which are themselves linear. The emission rate for 2000 (“Streets, 2000”) is an estimate provided by Streets (personal communication, July 2001) using the same data sources and procedures as those in Streets et al. [2000].