long-term shrinkage empirical model of high performance
DESCRIPTION
ÂTRANSCRIPT
Civil and Environmental Research www.iiste.org
ISSN 2222-1719 (Paper) ISSN 2222-2863 (Online) Vol.3, No.2, 2013
35
Long-term Shrinkage Empirical Model of High Performance
Concrete in Humid Tropical Weather
Chatarina Niken1*
Elly Tjahjono2*
Franciscus Supartono3*
1. School of Civil Engineering, Indonesia University, Depok Campus 16424, Bogor, Indonesia
2. School of Civil Engineering, Indonesia University, Depok Campus 16424, Bogor, Indonesia
3. Engineering Consultant, Pusat Niaga Roxy Mas Block C4 No 16, Jakarta Pusat 10150, Indonesia
*E-mail of the corresponding author: [email protected]
Abstract
This paper represents a long-term shrinkage empirical model of high performance concrete (HPC) with and without
fly ash based on experimental research in which compressive strength was 60MPa. Specimens measuring
150x150x600 mm3 were used. Observations were conducted over the two year periode using an embeded vibrating
wire strain gauge. As a result, the empirical model was in agreement with experimental results. Addicionally
comparisons were made with ACI 209R, AS 3600-2009 and Eurocode 2. The results showed that ACI 209R was
about 60% and 75% of HPC with and without fly ash respectively. Eurocode 2 was underestimated for both HPC
(58%) and HPC without fly ash (73%). AS 3600-2009 was 16% higher than HPC with fly ash but this condition is
suspectable to change during longer observation periode because AS 3600-2900 has a lower slope than the empirical
model, while HPC without fly ash was overestimated (93%). Model representation shows significant differences in
form compared to ACI 209R; and AS 3600, and similarity in form compared to Eurocode 2.
Keywords: Shrinkage, High performance concrete, Empirical model, Humid tropical weather
1. Introduction
The most difficult, uncertain and risky aspect in designing a concrete structure is the prediction of time-dependent
behavior. Along with the development of the construction industry, the use of high performance concrete is also
developing. High performance concrete (HPC) is often defined as concrete with a compressive strength exeeding 60
MPa and a resistance to damaging influences (Nishiyama, 2009). More cement is used in HPC than in normal
concrete, but the use of water is much lower. Therefore, the low water to cementitious ratio causes refined pores, and
the HPC is more sensitive to cracking at early shrinkage than normal concrete, even when good curing is applied. A
better understanding of long-term shrinkage will ensure good performance of the concrete structure during its
service-life.
Drying shrinkage is influenced by external supply water, so climate plays an important role especially in long-term
shrinkage. All of the regulations have inserted humidity and temperature as shrinkage factors, except for ACI 209R
and AS 3600-2009, which do not include temperature as a shrinkage factor. Because the hydration process may
occur in 416 days (Morin,Cohen-Tenoudji,Feylessoufi, and Richard,2002), drying shrinkage may occur
simultaneously with hydration, causing the shrinkage mechanism to be complex.
Just as approximately 60% of research studies about shrinkage refer to ACI, the concrete design code in Indonesia
refers to ACI too, it is based on research studies from four-season countries, despite some significant differences that
are displayed in Figures 1 and 2 in below.
Civil and Environmental Research www.iiste.org
ISSN 2222-1719 (Paper) ISSN 2222-2863 (Online) Vol.3, No.2, 2013
36
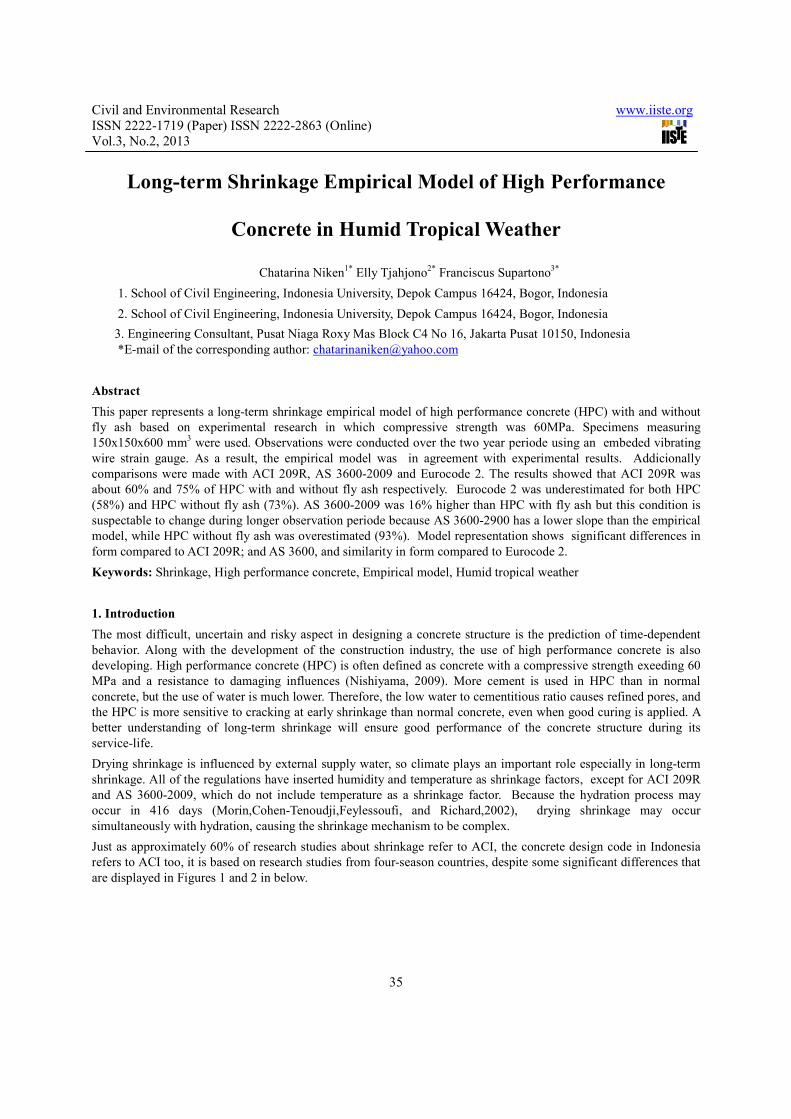
A. Jakarta B. New York
40
50
60
70
80
90
100
Jan Feb Mar Apr May Jun July Agt Sept Oct Nov Dec
Hu
mid
ity
, %
Humidity at Jakarta
Range of humidity
40
50
60
70
80
90
100
Jan Feb Mar Apr May Jun July Agt Sept Oct Nov Dec
Humidity at New York
(National Oceanic and Atmospheric Administration)
Range of humidity
Figure 1. Relative humidity at Indonesia and New York.
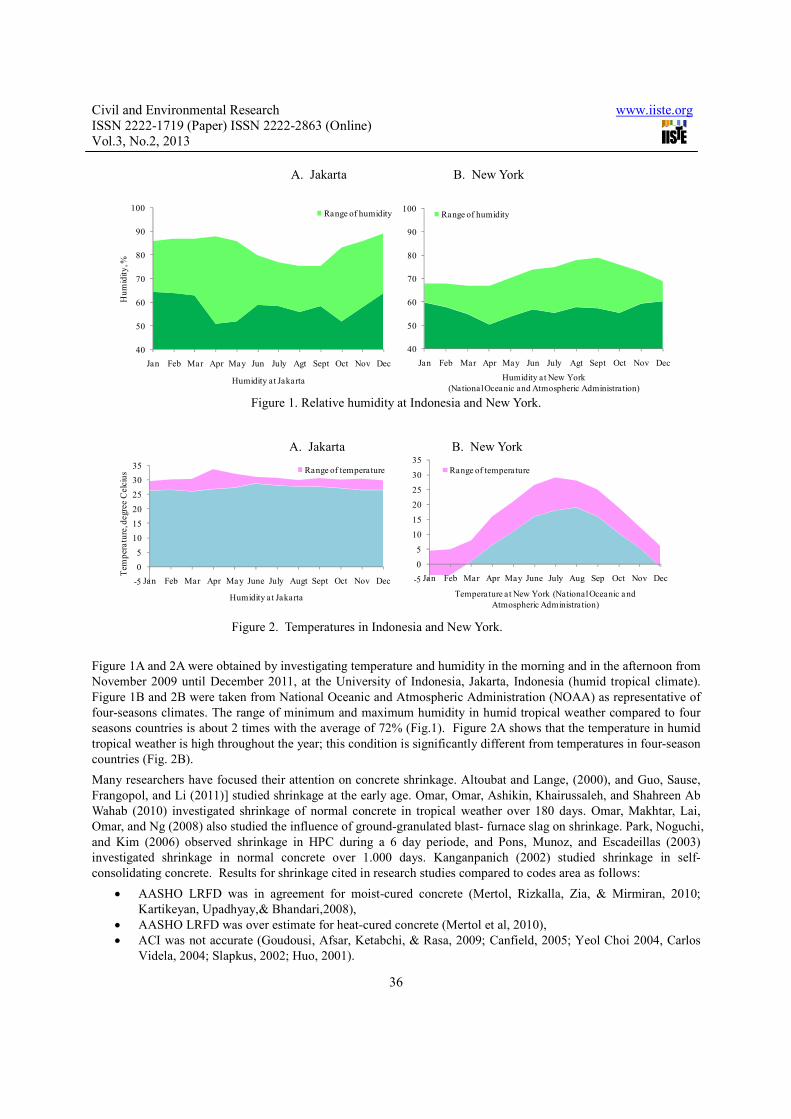
A. Jakarta B. New York
-5
0
5
10
15
20
25
30
35
Jan Feb Mar Apr May June July Augt Sept Oct Nov Dec
Tem
per
atu
re, d
egre
e C
elc
ius
Humidity at Jakarta
Range of temperature
-5
0
5
10
15
20
25
30
35
Jan Feb Mar Apr May June July Aug Sep Oct Nov Dec
Temperature at New York (National Oceanic and
Atmospheric Administration)
Range of temperature
Figure 2. Temperatures in Indonesia and New York.
Figure 1A and 2A were obtained by investigating temperature and humidity in the morning and in the afternoon from
November 2009 until December 2011, at the University of Indonesia, Jakarta, Indonesia (humid tropical climate).
Figure 1B and 2B were taken from National Oceanic and Atmospheric Administration (NOAA) as representative of
four-seasons climates. The range of minimum and maximum humidity in humid tropical weather compared to four
seasons countries is about 2 times with the average of 72% (Fig.1). Figure 2A shows that the temperature in humid
tropical weather is high throughout the year; this condition is significantly different from temperatures in four-season
countries (Fig. 2B).
Many researchers have focused their attention on concrete shrinkage. Altoubat and Lange, (2000), and Guo, Sause,
Frangopol, and Li (2011)] studied shrinkage at the early age. Omar, Omar, Ashikin, Khairussaleh, and Shahreen Ab
Wahab (2010) investigated shrinkage of normal concrete in tropical weather over 180 days. Omar, Makhtar, Lai,
Omar, and Ng (2008) also studied the influence of ground-granulated blast- furnace slag on shrinkage. Park, Noguchi,
and Kim (2006) observed shrinkage in HPC during a 6 day periode, and Pons, Munoz, and Escadeillas (2003)
investigated shrinkage in normal concrete over 1.000 days. Kanganpanich (2002) studied shrinkage in self-
consolidating concrete. Results for shrinkage cited in research studies compared to codes area as follows:
• AASHO LRFD was in agreement for moist-cured concrete (Mertol, Rizkalla, Zia, & Mirmiran, 2010;
Kartikeyan, Upadhyay,& Bhandari,2008),
• AASHO LRFD was over estimate for heat-cured concrete (Mertol et al, 2010),
• ACI was not accurate (Goudousi, Afsar, Ketabchi, & Rasa, 2009; Canfield, 2005; Yeol Choi 2004, Carlos
Videla, 2004; Slapkus, 2002; Huo, 2001).
Civil and Environmental Research www.iiste.org
ISSN 2222-1719 (Paper) ISSN 2222-2863 (Online) Vol.3, No.2, 2013
37
Mertol et al. (2010) conducted a 2-year investigation but the others are observed for less than a year with research
conditions in which temperature was about 22oC and relative humidity was about 50%. According to Pihlajavaara
(1974), shrinkage can be strong in relative humidity (RH) of 50-80%, and 0-20%, and minor in RH of 20-50%.
Based on this observation, Indonesia and New York are situated in strong shrinkage areas, although Indonesia has
±10% higher shrinkage than New York. The influence of tropical weather, based in by AS 3600-2009 and Eurocode 2,
allow a correction factor of 0.5, and 0.7 respectively, to the drying shrinkage formula, while the correction factor in
ACI 209R is 0.68 to total shrinkage.
The above research studies indicate that there are large variations in shrinkage behavior. Observations conducted for
less than 416 days have not yielded a fully understanding of long-term shrinkage behavior which is truly needed to
design concrete with strong performance levels. Regarding the high-strength concrete that was developed rapidly in
the Asia region during the past two decades, many of it’s concrete properties have not been widely known; for
example, it’s long-term shrinkage properties in humid tropical regions of Indonesia and South-east Asia should be
studied future.
Fly ash as cementitious material in concrete in the world was widely use. Boga and Topçu (2012) studied the
influenced of fly ash in concrete; the amount of 15% fly ash in the mixture showned higher compressive strength and
splitting-tensile strength than 30% or 45% fly ash. With water cured treatment on specimens, 15% fly ash incurred
less corrosion than 30% fly ash as the cement replacement.
The objective of this research was to create an empirical model for describing long-term shrinkage of HPC with and
without fly ash in humid tropical weather. We anticipate that the results will provide a better understanding
regarding HPC shrinkage behavior in humid tropical weather.
2. Materials and Methods
This research was performed experimentally using 6 specimens of 150x150x600 mm3, according to ASTM C78-08
with one vibrating wire embedded strain gauge (VWESG) per specimen. The position of the VWESG can be seen in
Figure 3A, (i.e., 5 cm from the end of the specimen). High performance concrete with target compressive strength of
60 MPa and slump flow diameter of 35±2 cm was used for the specimens (Fig.3B) Specimens were produced with
two variations: addition of fly ash and referred to as triple blend (TB) meaning that cement was added using silica
fume together with fly ash and without the addition of fly ash, and referred to as double blend (DB), meaning that
cement was added using silica fume without fly ash.
2.1 Materials
The mix design was conducted in compliance with ACI 211.4R with a limit of 500 kg/m3 cement content to meet the
shrinkage factor closest to 1 (ACI 209R, 1992). Ordinary Portland Cement (OPC) produced by Indocement Ltd was
used. Condition of the aggregate was saturated surface dry (SSD). Fine aggregate in the form of river sand was
brought from in from Sungai Liat (Bangka, Sumatra, Indonesia); specific gravity (SSD) was 2.6053; and absorption
was 0.4%. The sand had been filtered and cleaned using a mixture of standard graphs obtained from the mid-
gradation, according to ASTM C.33/C.33M-08. Coarse aggregate in the form of volcanic rock fragments was
obtained from Banten, West Java, Indonesia. Composition of the coarse aggregate used was 70% size of 13-19mm;
specific gravity (SSD) was 2.563; absorption was 1.543%; and 30% size of 6-12mm; specific gravity was 2.636; and
absorption was 2.26%). Type F fly ash according to ASTM C618-8a is a waste material from the electrical power
plant in Suralaya, West Java, Indonesia. In this mix design, 15% fly ash was the cement replacement. Added material
used was silicafume of 8% cement weight of DB produced by Sika Indonesia Ltd. To achive the desired high
strength with low water to cementitious material ratio and good workability, polycarboxylic superplasticizer under
the commercial name ViscoCrete ® 10 from Sika Indonesia Ltd was added to the concrete mix as high range water
reducer (HRWR). The dose of HRWR of 1.4% cement weight was according to that generally used in Indonesia.
Local water was supplied by the Structure and Material Laboratory of University of Indonesia. An electrical scale
was used especially for cementitious materials and water to obtain the accurate water to cementitious material ratio.
Materials composition are displayed in Table 1.

Civil and Environmental Research www.iiste.org
ISSN 2222-1719 (Paper) ISSN 2222-2863 (Online) Vol.3, No.2, 2013
38
Table 1. Mix composition
Material (kg/m3) Without fly ash (DB) With fly ash (TB)
OPC 500 454.3
Silica fume 40 40
Fly ash 57.14
Water 142.6 146
Sand 800 800
Coarse aggregate 935 935
HRWR 7.6 7.6
In order to achieve similar shrinkage using aggregate, fine and coarse aggregate for both mixtures were similar.
During the concrete mix design stage, all of the aggregate was assumed to be under saturated surface-dry condition.
A tilting drum mixture of 0.3 m3 capacity was used. The mixing started with all cementitious material in dry
condition, followed by 50% fine aggregate. Subsequently, 50% water was added to the revolving mixture. These
materials were then mixed for approximately 1½ minutes. Next, 50% water was slowly poured in, which mixed with
HRWR homogenously. Thereafter 100% coarse and 50% fine aggregate was added. With all the materials placed
according to its order into the mixer, the concrete was mixed for approximately 3 minutes. The slump flow of the
mixture was measured before pouring by using Abram’s cone with upside down position.
2.2. Methods
Shrinkage was measured as strain change against time by installing VWESG in the specimen. The VWESG has
abilities to detect the strain up to 3000 µε with accuracy of about .025% and concrete temperature between -80oC and
60oC with about .5% accuracy (Fig. 3A).
A B
Embedded vibrating wire strain gauge
Civil and Environmental Research www.iiste.org
ISSN 2222-1719 (Paper) ISSN 2222-2863 (Online) Vol.3, No.2, 2013
39
C D
E F
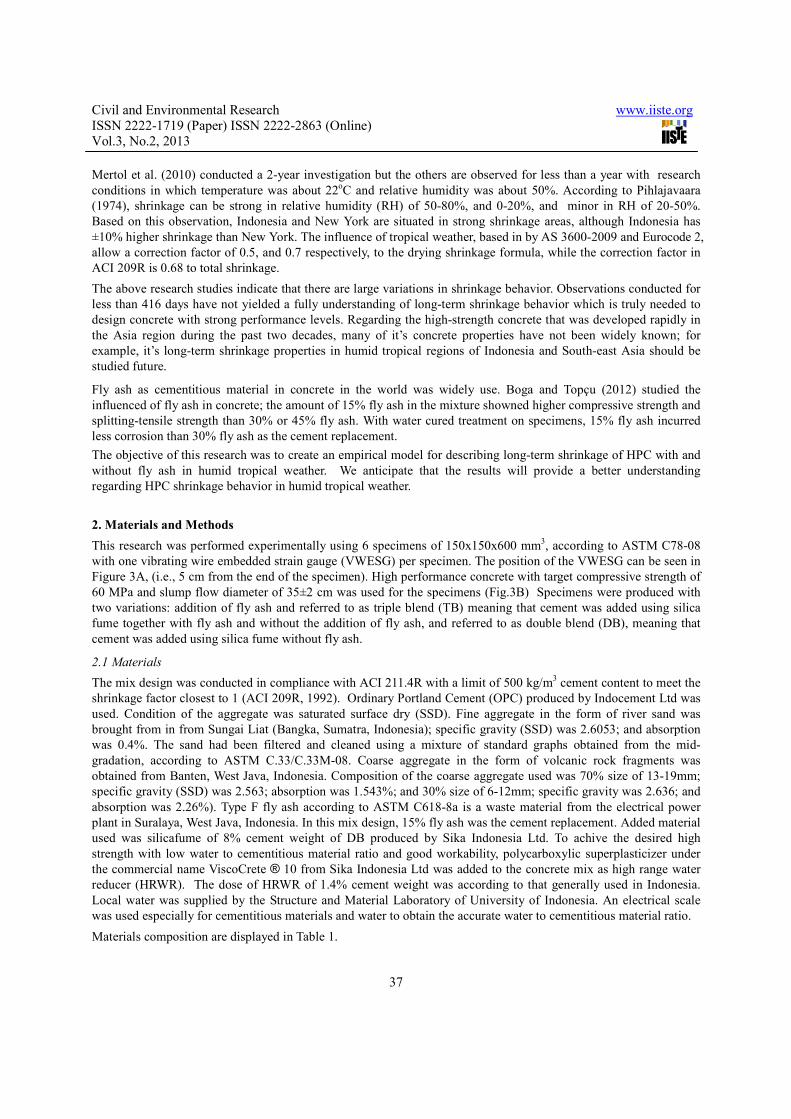
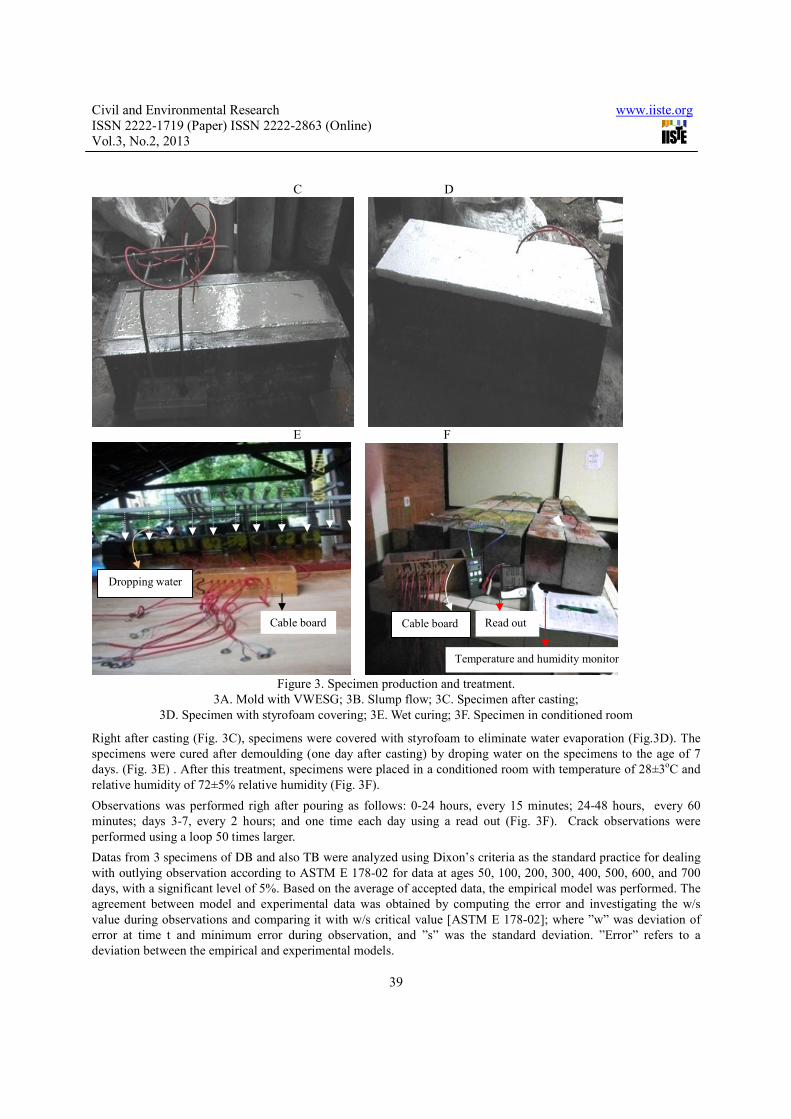
Figure 3. Specimen production and treatment.
3A. Mold with VWESG; 3B. Slump flow; 3C. Specimen after casting;
3D. Specimen with styrofoam covering; 3E. Wet curing; 3F. Specimen in conditioned room
Right after casting (Fig. 3C), specimens were covered with styrofoam to eliminate water evaporation (Fig.3D). The
specimens were cured after demoulding (one day after casting) by droping water on the specimens to the age of 7
days. (Fig. 3E) . After this treatment, specimens were placed in a conditioned room with temperature of 28±3oC and
relative humidity of 72±5% relative humidity (Fig. 3F).
Observations was performed righ after pouring as follows: 0-24 hours, every 15 minutes; 24-48 hours, every 60
minutes; days 3-7, every 2 hours; and one time each day using a read out (Fig. 3F). Crack observations were
performed using a loop 50 times larger.
Datas from 3 specimens of DB and also TB were analyzed using Dixon’s criteria as the standard practice for dealing
with outlying observation according to ASTM E 178-02 for data at ages 50, 100, 200, 300, 400, 500, 600, and 700
days, with a significant level of 5%. Based on the average of accepted data, the empirical model was performed. The
agreement between model and experimental data was obtained by computing the error and investigating the w/s
value during observations and comparing it with w/s critical value [ASTM E 178-02]; where ”w” was deviation of
error at time t and minimum error during observation, and ”s” was the standard deviation. ”Error” refers to a
deviation between the empirical and experimental models.
Read out
Temperature and humidity monitor
Cable board
Dropping water
Cable board

Civil and Environmental Research www.iiste.org
ISSN 2222-1719 (Paper) ISSN 2222-2863 (Online) Vol.3, No.2, 2013
40
3. Results
The results of this research are mainly divided into two parts; compressive strength and long-term shrinkage behavior.
3.1 Compressive Strength
Compressive strength of both mixture are shown in Figure 4.
Figure 4. Compressive strength.
3.2 Long-term Deformation
The results for three specimens of DB and three specimens of TB are as follows:
A B
0,0E+00
1,0E-04
2,0E-04
3,0E-04
4,0E-04
5,0E-04
6,0E-04
7,0E-04
0 100 200 300 400 500 600 700 800
Sh
rin
kag
e, m
/m (i
n/i
n)
Specimen age, days
Experimental HPC with fly ash Empirical model HPC with fly ash
0,0E+00
1,0E-04
2,0E-04
3,0E-04
4,0E-04
5,0E-04
6,0E-04
7,0E-04
0 100 200 300 400 500 600 700 800
Sh
rin
kag
e, m
/m (i
n/i
n)
Specimen age, days
Experimental HPC without fly ash
Empirical model HPC without fly ash
Figure 5. Experimental and empirical model of HPC
5A. Without fly ash (DB); 5B. With fly ash (TB).
The empirical model as shown in Figures 5A and 5B was found to be:
εsh= [[t/(C+tα)]ε(sh)u]
p (1)
where:
εsh : shrinkage strain
ε(sh)u : ultimate shrinkage strain, 587x10-6
for HPC without fly ash and 499x10-6
for HPC with fly ash
Civil and Environmental Research www.iiste.org
ISSN 2222-1719 (Paper) ISSN 2222-2863 (Online) Vol.3, No.2, 2013
41
t : time after curing
C : 50 for HPC without fly ash; 45.2 for HPC with fly ash
α : 0.98 for HPC without fly ash;0.992 for HPC with fly ash
p : 1 for HPC without fly ash; 1.009 for HPC with fly ash
4 Discussion
A cement replacement of 15% fly ash shown similarity of compressive strength between DB and TB
(Fig. 4).
4.1 Analysis of specimen data
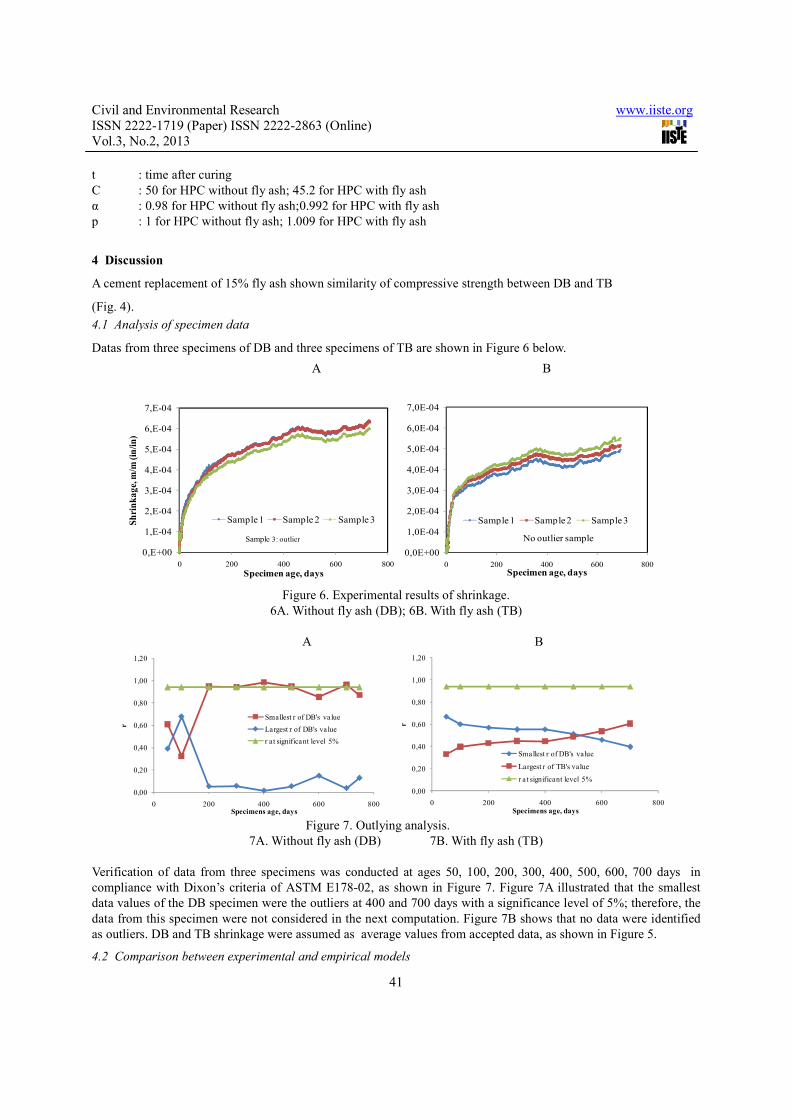
Datas from three specimens of DB and three specimens of TB are shown in Figure 6 below.
A B
0,E+00
1,E-04
2,E-04
3,E-04
4,E-04
5,E-04
6,E-04
7,E-04
0 200 400 600 800
Sh
rin
ka
ge,
m/m
(in
/in
)
Specimen age, days
Sample 1 Sample 2 Sample 3
Sample 3: outlier
0,0E+00
1,0E-04
2,0E-04
3,0E-04
4,0E-04
5,0E-04
6,0E-04
7,0E-04
0 200 400 600 800Specimen age, days
Sample 1 Sample 2 Sample 3
No outlier sample
Figure 6. Experimental results of shrinkage.
6A. Without fly ash (DB); 6B. With fly ash (TB)
A B
0,00
0,20
0,40
0,60
0,80
1,00
1,20
0 200 400 600 800
r
Specimens age, days
Smallest r of DB's va lue
Largest r of DB's va lue
r at significant level 5%
0,00
0,20
0,40
0,60
0,80
1,00
1,20
0 200 400 600 800
r
Specimens age, days
Smallest r of DB's value
Largest r of TB's value
r a t significant level 5%
Figure 7. Outlying analysis.
7A. Without fly ash (DB) 7B. With fly ash (TB)
Verification of data from three specimens was conducted at ages 50, 100, 200, 300, 400, 500, 600, 700 days in
compliance with Dixon’s criteria of ASTM E178-02, as shown in Figure 7. Figure 7A illustrated that the smallest
data values of the DB specimen were the outliers at 400 and 700 days with a significance level of 5%; therefore, the
data from this specimen were not considered in the next computation. Figure 7B shows that no data were identified
as outliers. DB and TB shrinkage were assumed as average values from accepted data, as shown in Figure 5.
4.2 Comparison between experimental and empirical models
Civil and Environmental Research www.iiste.org
ISSN 2222-1719 (Paper) ISSN 2222-2863 (Online) Vol.3, No.2, 2013
42
Comparison between experimental and empirical models can be seen in Figure 5.
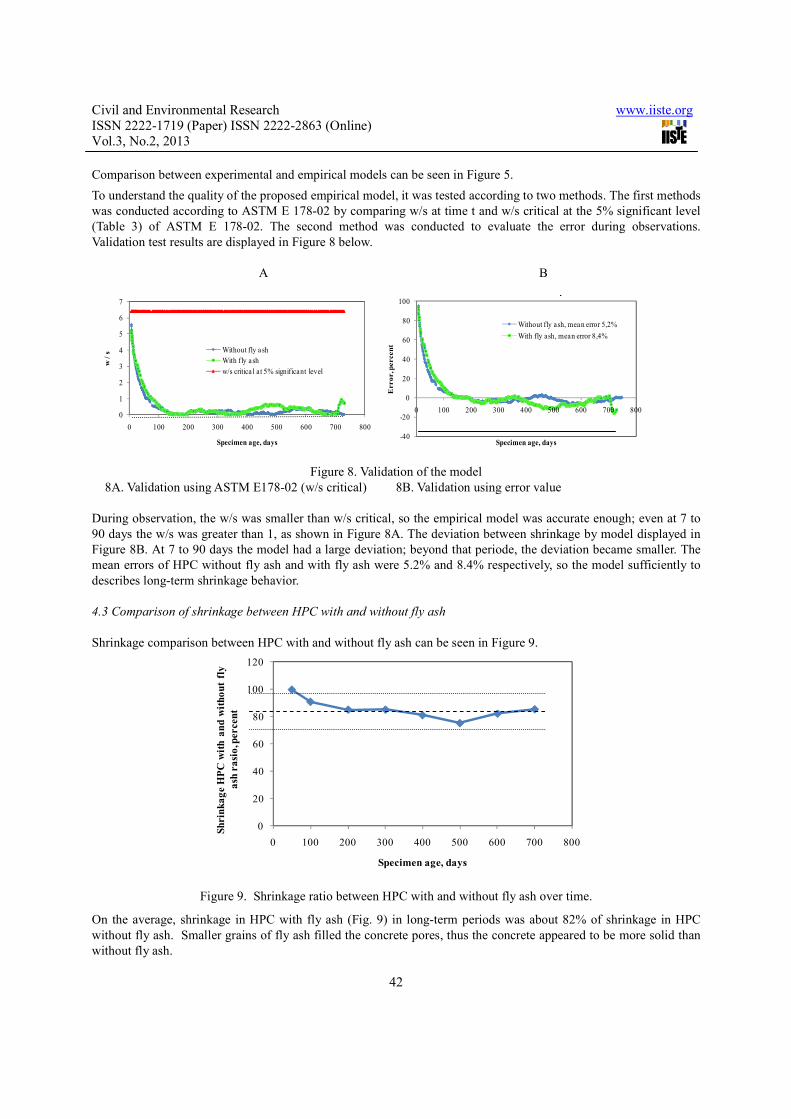
To understand the quality of the proposed empirical model, it was tested according to two methods. The first methods
was conducted according to ASTM E 178-02 by comparing w/s at time t and w/s critical at the 5% significant level
(Table 3) of ASTM E 178-02. The second method was conducted to evaluate the error during observations.
Validation test results are displayed in Figure 8 below.
A B
0
1
2
3
4
5
6
7
0 100 200 300 400 500 600 700 800
w/
s
Specimen age, days
Without fly ash
With fly ash
w/s critica l at 5% significant level
-40
-20
0
20
40
60
80
100
0 100 200 300 400 500 600 700 800
Erro
r, p
ercen
t
Specimen age, days
Deviation between model and experimental
Without fly ash, mean error 5,2%
With fly ash, mean error 8,4%
Figure 8. Validation of the model
8A. Validation using ASTM E178-02 (w/s critical) 8B. Validation using error value
During observation, the w/s was smaller than w/s critical, so the empirical model was accurate enough; even at 7 to
90 days the w/s was greater than 1, as shown in Figure 8A. The deviation between shrinkage by model displayed in
Figure 8B. At 7 to 90 days the model had a large deviation; beyond that periode, the deviation became smaller. The
mean errors of HPC without fly ash and with fly ash were 5.2% and 8.4% respectively, so the model sufficiently to
describes long-term shrinkage behavior.
4.3 Comparison of shrinkage between HPC with and without fly ash
Shrinkage comparison between HPC with and without fly ash can be seen in Figure 9.
0
20
40
60
80
100
120
0 100 200 300 400 500 600 700 800
Sh
rin
ka
ge H
PC
wit
h a
nd
wit
ho
ut
fly
ash
ra
sio
, percen
t
Specimen age, days
Figure 9. Shrinkage ratio between HPC with and without fly ash over time.
On the average, shrinkage in HPC with fly ash (Fig. 9) in long-term periods was about 82% of shrinkage in HPC
without fly ash. Smaller grains of fly ash filled the concrete pores, thus the concrete appeared to be more solid than
without fly ash.

Civil and Environmental Research www.iiste.org
ISSN 2222-1719 (Paper) ISSN 2222-2863 (Online) Vol.3, No.2, 2013
43
4.4 Comparison of the empirical model with ACI 209R, Eurocode 2, and AS 3600
Comparisons between the experimental model, empirical model, ACI 209R, Eurocode 2, and AS 3600 can be seen in
Figure 10.
0,0E+00
1,0E-04
2,0E-04
3,0E-04
4,0E-04
5,0E-04
6,0E-04
7,0E-04
0 100 200 300 400 500 600 700 800
Sh
rin
kag
e, m
/m (i
n/i
n)
Specimen age, days
Experimental HPC without fly ash Experimental HPC with fly ash
ACI 290R Eurocode 2
AS 3600 DB Empirical model
TB Empirical model
Figure 10. Comparison between experimental model, empirical model,
ACI 209R, Eurocode 2, and AS 3600.
Figure 10 shows that Eurocode 2 and ACI 209R were underestimated for HPC with and without fly ash, while AS
3600 was overestimated for TB but underestimated for DB. In long-term periods the two types of HPC showed non-
asymptotic behavior similar to Eurocode 2, while AS 3600 and ACI 209R showed asymptotic properties (Fig. 10).
Non-asymptotic form means the shrinkage still develops, especially drying shrinkage. The main emphasis of this
research was to assess the effect of the humid tropical environment on time-dependent deformation because of
shrinkage in concrete; appropriatly non-asymptotic form is a special behavior which distinguishes long-term
deformation in humid tropical and non-humid environments. The deformation happens continously, even when the
hydration process last longer than 416 days (Morin et al,2002). Based on this phenomenon, it was appropriate for
this analysis to stress drying shrinkage.
Relative humidity to be a single parameter in final unrestrained drying shrinkage values for concrete. If the
parameter multipled by the time and a factor of dimension, by using power on the time so the Formula become
drying shrinkage formula in Eurocode 2. Similar to Eurocode 2, AS 3600 inserted the influence of the environment
as a single factor but in a global condition such as arid, interior, temperate inland, tropical or near coastal
environment (AS 3600, 2009). The slope in Eurocode 2 is similar to the slopes of HPC with and without fly ash (Fig.
10).
At the early age (7-14 days), AS 3600 and Eurocode 2 were in agreement with the experimental results, but the code
did not fit during long-term periods. Eurocode 2 and AS 3600 predicted total shrinkage as a sum of early shrinkage
and drying shrinkage, while ACI 209R presented total shrinkage as a function of time a simpler formula.
To present a simple model oriented toward prediction of deformation during long-periods, we proposed that the long-
term shrinkage behavior is a function of time similar to ACI. The shrinkage formula of ACI 209R is:
εsh = [t/(35+t)]ε(sh)u (2)
where ε(sh) is shrinkage strain, t is time after curing and ε(sh)u is ultimate shrinkage strain.
In general form, the shrinkage formula can be written as follows:
εsh = [t/(C+t)]ε(sh)u (3)

Civil and Environmental Research www.iiste.org
ISSN 2222-1719 (Paper) ISSN 2222-2863 (Online) Vol.3, No.2, 2013
44
where C is a constant.
The shrinkage of concrete is influenced by the process of cement hydration, called aging. This influence is not
confined to young concrete, but through the entire lifetime of structure. The aging is generality described by
considering certain material properties to be function of the age, t, of concrete (Bazant & Prasannan, 1988).
To create the empirical model, an understanding about the mechanism in concrete was required. The mechanism was
assumed by revision of solidification theory. Solidification theory in which the aging is explained and modeled by
the volume growth (into the pores of hardened Portland cement paste) of a nonaging viscoelastic constituent (cement
gel), can not explain long-term aging because the volume growth of the hydration products is too short-lived.
Revision of solidification theory in which the viscosity of the flow term of the compliance function is treated as a
tangensial viscosity of a nonlinear viscous power law governing very large and highly localized microstress in the
hardened cement paste (Bazant & Prasannan, 1988). Shrinkage after hardening of concrete, is decrease with time of
concrete volume [ACI 209R]. The elementary volume, dv(t), which solidifies at t, is assumed to be represented by a
layer deposited on the surface of the material that previously solidified from a solution (Bazant & Prasannan, 1988).
This mechanism endures continously until stabel.
In the humid tropical region, the absorbed water layer is larger than a single molecule. The full thickness of the
absorption layer cannot expand in small pores, and hindered adsorbed water is performed and leads to slippage. Thus,
microstresses in humid tropical weather are higher than in four-season countries. The phenomenon causes the
shrinkage growth continously throughout long-term periode. Because the existensi the slippage, the compressive
stress would not be transferred continuously (disjoining pressure = ρd). Therefore, the transfer was accomplised by
the porous wall and the solid frame work around the micropores (Bazant & Prasannan, 1988). Stress will arouse non-
linear viscous flow which depends on time.
The empirical models were based on the assumption that shrinkage is a performance of continuous flow. Viscous
flow may be assumed to follow a power law:
ét = c Stp (4)
where étis total strain; c is constan; St is total stress; and p is a power.
To accommodate the stresses which cause the non-linear viscous flow when it slowed in our experiment, t in the
lower fraction was given a power named α. Therefore the stres may be assumed as:
S = [t/(C+tα)] (4a)
c = ε(sh)u (4b)
The formula may be assumed as :
εsh = [[t/(C+tα)]ε(sh)u]
p (5)
where t is time after curing.
The power function is dependent on load duration, age at loading, and current age of concrete. The double power law
is in agreement for a very short duration. The triple power law represents a gradual transition from a double power
law to a logarithmic creep law. For long-term duration special for basic creep, very good agreement with the
measurements, significant improvement is obtained in the representation of the final slope (Bažant & Chern, 1985).
In humid tropical weather, capillary forces are larger than those in four- season countries, and they remain almost
stable throughout the year, leading to continuous slip development and displayed as non-asymptotic form or slope
form (Fig. 10).
The power of HPC without fly ash is 1; for HPC with fly ash, it is 1.009. In this study, the shrinkage mechanism in
the mixture with fly ash was more complicated than the shrinkage formula in the mixture without fly ash. The
circumstances can be understood because the most significant morphology of fly ash in concrete is developed during
the first six months (Wesche,1991).
Civil and Environmental Research www.iiste.org
ISSN 2222-1719 (Paper) ISSN 2222-2863 (Online) Vol.3, No.2, 2013
45
5. Conclusion
Conclusion from this research include the following:
1) Based on experimental research of long-term shrinkage of high performance concrete in humid tropical
weather, an empirical model has been proposed.
2) The empirical model of long-term shrinkage of HPC in humid tropical weather can be written as follows:
εsh= [[t/(C+tα)]ε(sh)u]
p
where:
εsh : shrinkage strain
ε(sh)u : ultimate shrinkage strain,
for HPC without fly as : 587x10-6
and
for HPC with fly ash : 499x10-6
t : time after curing
C : for HPC without fly ash : 50 and
for HPC with fly ash : 45.2
α : for HPC without fly ash : 0.98 and
for HPC with fly ash : 0.992
p : for HPC without fly ash : 1 and
for HPC with fly ash : 1.009
3) The shrinkage formula is more simple than AS 3600 and Eurocode 2.
4) Results of experimentation showed that ACI 209R and Eurocode 2 were underestimated for long-term
shrinkage of DB (cement added using silica fume without fly ash) and TB (cement added using silica fume
together with fly ash). AS 3600-2009 underestimated for DB and overestimated for TB.
5) The main difference shrinkage between tropical and four season area is:
Two years old shrinkage in tropical area is still increasing significantly, in other hand based on ACI
209R and AS 3600, the shrinkage already reached fixed value 350 days and 300 days respectively
6) We have suggested that future research can be connected to the variation of cement and water content to
obtain the correction factors for using the above formula with another mixture.
Acknowledgments
We are gratefull to Prof. Dr. Irwan Katili, DEA for helpfull to get financial support. The Author also thank to
University of Indonesia (UI) for financial support. Our special thanks are also extended to Indocement Ltd and Sika
Indonesia Ltd for their fully supports for materials.
References
ACI 209R-92, (1992). Prediction of creep, shrinkage, and temperature effects in concrete structure. American
Concrete Institute, 1-47
ACI 211.4R-93, (1993). Guide for selecting proportions for high –strength concrete with Portland cement and fly ash.
American Concrete Institute, 272-283
Altoubat, S.A., Lange, D. (2000). Creep, shrinkage and cracking of restrained concrete at early age. ACI Materials
Journal. 98(4), 323-331
ASTM C33/C 33M-08, (2009). Standard specification for concrete aggregate. American Society for Testing and
Materials, Vol 04.02, 12-22
ASTM C618-8a, (2009). Section: Construction, concrete and aggregates, Standard specification for coal fly ash and
raw or calcined natural puzzolan for use in concrete. American Society for Testing and Materials, Vol 04.02, 331-333
ASTM E178-02, (2002). Standard practice for dealing with outlying observation. American Society for Testing and
Materials, 1-18
AS 3600-2009, (2009). Concrete Structure. Australian Standards, 37-41
Bažant, Z.P., F. ASCE, & Chern, J-C. (1985). Triple power law for concrete creep. Journal of Engineering
Mechanics, 111(1), Jan, 63-83
Bažant, Z.P., & Prasannan, S. (1988). Solidification theory for aging creep. Journal of cement and concrete research,

Civil and Environmental Research www.iiste.org
ISSN 2222-1719 (Paper) ISSN 2222-2863 (Online) Vol.3, No.2, 2013
46
18, 923-932
Boga, A.R., Topçu, I.B. (2012). Influence of fly ash on corrosion resistance and chloride ion permeability of concrete.
Journal of Construction and Building Materials, 31, 258-264
Canfield, S.R. (2005). ”Full scale testing of prestress, high performance concrete, bridge girders”. Georgia Institute
of Technology”, Thesis, 107-110
Choi, Y., & Kang, M-M. (2004). SCC: Long-term performance of high strength concrete. The Indian Concrete
Journal, June, 425-431
Eurocode 2 (1992). Design of Concrete Structures, Part1: General rules for building. Europen Standard. European
Committee for Standardization, 28-31
Ghodousi, P., Afsar, M.H., Ketabchi, H., & Rasa, E. (2009). A study of early–age creep and shrinkage of concrete
conforming Iranian pozzolas: An experimental comparative study. Journal of Scientia Itanica.16 (2), 126-137
Guo, T., Sause, R., Frangopol, D.M., & Li, A. (2011). Time-dependent reliability of PSC box-girder bridge
considering creep, shrinkage and corrosion, Journal of Bridge Engineering,16 (1), 29-43
Hinkle, S.D. (2006). ”Investigation of time dependent deflection in long span, high strength, prestressed concrete
bridge beam”, Thesis, Virginia Polytechnic Institute and State University, Blackburg Virginia, 8-35.
Huo, X.S., Al-Omaishi, N., & Tadros, M.K. (2001). Creep, shrinkage, and modulus of elasticity of high-performance
concrete. Materials Journal, 440-449
Kanganpanich, K. (2002). ”Early age creep of self – compacting concrete using low heat cement at different stress/strength ratios”, Dissertation, Department of Infrastructure System Engineering Kochi University of
Technology Kochi, Japan, 1-27
Karthikeyan, J., Upadhyay, A., & Bhandari, N.M. (2008). Artificial neural network for predicting creep and
shrinkage of High Performance Concrete. Journal of Advanced Concrete Technology,6(1),135- 142
Mertol, H.C.,Rizkalla,S., Zia, P., & Mirmiran, A. (2010). Creep and shrinkage behavior of high-strength concrete and
minimum reinforcement ratio for bridge columns. PCI Journal, Summer , 138-153
Morin, V., Cohen-Tenoudji, F., Feylessoufi, A., & Richard, P. (2002). Evolution of the capillary network in a reactive
powder concrete during hydration process. Journal of Cement and Concrete Research,32, 1907-1914
Nishiyama, M. (2009). Mechanical properties of concrete and reinforcement-state-of-the-art report on HSC and HSS
in Japan. Journal of Advanced Concrete Technology.7(2), 157-182
Omar, R., Omar, W., Ashikin, N., Khairussaleh, M., Ab Wahab, E.S. (2010). The prediction of creep deformation of
normal strength concrete in tropical climate towards Eurocodes. First Makassar International Conference on Civil
Engineering, March
Omar, W., Makhtar, A.M., Lai, T.P., Omar, R., & Ng M.K. (2008). Creep, shrinkage and elastic modulus of
Malaysian concrete. California Transportation Research Board. Al Manaseer, Akthem
Park, S-G, Noguchi, T., Kim, M-H. (2006). A study on the creep and autogenous shrinkage. International Journal of
Concrete Structures and Materials, 18(2E), 73-77
Pihlajavaara, S.E. (1974). A review of some of the main results of a research on the ageing phenomena of concrete:
Effect of moisture conditions on strength, shrinkage and creep of mature concrete. Journal of Cement and Concrete
Research, 4, 761-771
Pons, G., Munoz, P., & Escadeillas, G. (2003). Determination of concrete total deformations under load as function
of shrinkage value. ACI Materials Journal, Jan-Feb, Vol 100,14-20
Slapkus, A., Kahn, L.F.,(2002). Evaluation of Georgia’s high performance concrete bridge, Georgia Department of
Transportation Project No 9510, Georgia Institute of Technology, Report, 382
Videla, C., Covarrubias, J.P., Masana, C. (2004). Updating concrete–shrinkage prediction models for local materials.
ACI Materials Journal, May-June, 187-198
Wesche, K. (1991). Fly ash in concrete. RILEM Report 7 .London: Chapman & Hall, FAB 2

This academic article was published by The International Institute for Science,
Technology and Education (IISTE). The IISTE is a pioneer in the Open Access
Publishing service based in the U.S. and Europe. The aim of the institute is
Accelerating Global Knowledge Sharing.
More information about the publisher can be found in the IISTE’s homepage:
http://www.iiste.org
CALL FOR PAPERS
The IISTE is currently hosting more than 30 peer-reviewed academic journals and
collaborating with academic institutions around the world. There’s no deadline for
submission. Prospective authors of IISTE journals can find the submission
instruction on the following page: http://www.iiste.org/Journals/
The IISTE editorial team promises to the review and publish all the qualified
submissions in a fast manner. All the journals articles are available online to the
readers all over the world without financial, legal, or technical barriers other than
those inseparable from gaining access to the internet itself. Printed version of the
journals is also available upon request of readers and authors.
IISTE Knowledge Sharing Partners
EBSCO, Index Copernicus, Ulrich's Periodicals Directory, JournalTOCS, PKP Open
Archives Harvester, Bielefeld Academic Search Engine, Elektronische
Zeitschriftenbibliothek EZB, Open J-Gate, OCLC WorldCat, Universe Digtial
Library , NewJour, Google Scholar