long wavelength fluctuations and the glass transition … · · 2016-10-18long wavelength...
TRANSCRIPT
Long Wavelength Fluctuations and the Glass Transition in 2D and 3D
Skanda Vivek,1 Colm P. Kelleher,2 Paul M. Chaikin,2 and Eric R. Weeks1
1Department of Physics, Emory University, Atlanta, Georgia 30322, USA2Department of Physics and Center for Soft Matter Research,
New York University, New York, New York 10003, USA(Dated: October 18, 2016)
Phase transitions significantly differ between two-dimensional and three-dimensional systems, butthe influence of dimensionality on the glass transition is unresolved. We use microscopy to studycolloidal systems as they approach their glass transitions at high concentrations, and find differencesbetween 2D and 3D. We find that in 2D particles can undergo large displacements without changingtheir position relative to their neighbors, in contrast with 3D. This is related to Mermin-Wagner long-wavelength fluctuations that influence phase transitions in 2D. However, when measuring particlemotion only relative to their neighbors, 2D and 3D have similar behavior as the glass transition isapproached, showing that the long wavelength fluctuations do not cause a fundamental distinctionbetween 2D and 3D glass transitions.
Introduction
If a liquid can be cooled rapidly to avoid crystalliza-tion, it can form into a glass: an amorphous solid. Theunderlying cause of the glass transition is far from clear,although there are a variety of theories [1–3]. One re-cent method of understanding the glass transition hasbeen to simulate the glass transition in a variety of di-mensions (including 4 dimensions or higher) [4–8]. In-deed, the glass transition is often thought to be similarin 2D and 3D [9, 10] and in simple simulation cases suchas hard particles, one might expect that dimensionalityplays no role. As a counterargument, two-dimensionaland three-dimensional fluid mechanics are qualitativelyquite different [11]. Likewise, melting is also known tobe qualitatively different in 2D and 3D [12–15].
Recent simulations give evidence that the glass transi-tion is also quite different in 2D and 3D [4, 5]. In par-ticular, Flenner and Szamel [4] simulated several differ-ent glass-forming systems in 2D and 3D, and found thatthe dynamics of these systems were fundamentally differ-ent in 2D and 3D. They examined translational particlemotion (motion relative to a particle’s initial position)and bond-orientational motion (topological changes ofneighboring particles). They found that in 2D these twotypes of motion became decoupled near the glass tran-sition. In these cases, particles could move appreciabledistances but did so with their neighbors, so that theirlocal structure changed slowly. In 3D, this was not thecase; translational and bond-orientational motions werecoupled. They additionally observed that the transientlocalization of particles well known in 3D was absent inthe 2D data. To quote Flenner and Szamel, “these resultsstrongly suggest that the glass transition in two dimen-sions is different than in three dimensions.”
In this work, we use colloidal experiments to test di-mension dependent dynamics approaching the glass tran-sition. Colloidal samples at high concentration have beenestablished as model glass formers [10, 16–19]. We per-form microscopy experiments with two 2D bidisperse sys-
tems, one with with quasi-hard interactions, and theother with long range dipolar interactions. 3D data areobtained from previous experiments by Narumi et al. [20]which studied a bidisperse mixture of hard particles. Ourresults are in qualitative agreement with the simulationsof Flenner and Szamel.
We believe our observations are due to the Peierls in-stability [21, 22], also called Mermin-Wagner fluctuations[23, 24]. As Peierls originally argued, there exist long-range thermal fluctuations in positional ordering in one-dimensional and two-dimensional solids. Klix et al. andIlling et al. recently noted that these arguments shouldapply to disordered systems as well [25, 26]. One canmeasure particle motion relative to the neighbors of thatparticle to remove the influence of these long wavelengthfluctuations [27]. Using this method we observe that thetranslational and structural relaxations are similar be-tween 2D and 3D, demonstrating that the underlyingglass transitions are unaffected by the Mermin-Wagnerfluctuations.
Results
We analyze three different types of colloidal samples,all using bidisperse mixtures to avoid crystallization. Thefirst sample type is a quasi-2D sample with hard par-ticles (short range, purely repulsive interactions) whichwe term ‘2DH.’ The 2DH sample is made by allowingsilica particles to sediment to a monolayer on a coverslip [28]. Our 2DH system is analogous to a 2D systemof hard disks of the sort studied with simulations [9, 29].The control parameter is the area fraction φ, with glassysamples found for φ ≥ 0.79. The second sample typeis also quasi-2D but with softer particles, which we term‘2DS.’ The 2DS system is composed of bidisperse PMMAparticles dispersed in oil, at an oil-aqueous interface [30].The interactions in this system are dipolar in the far-fieldlimit, and the control parameter is the dimensionless in-teraction parameter Γ2DS , related to the area fraction.Γ2DS is defined in the Methods section, with glassy be-
arX
iv:1
604.
0733
8v2
[co
nd-m
at.s
oft]
17
Oct
201
6
2
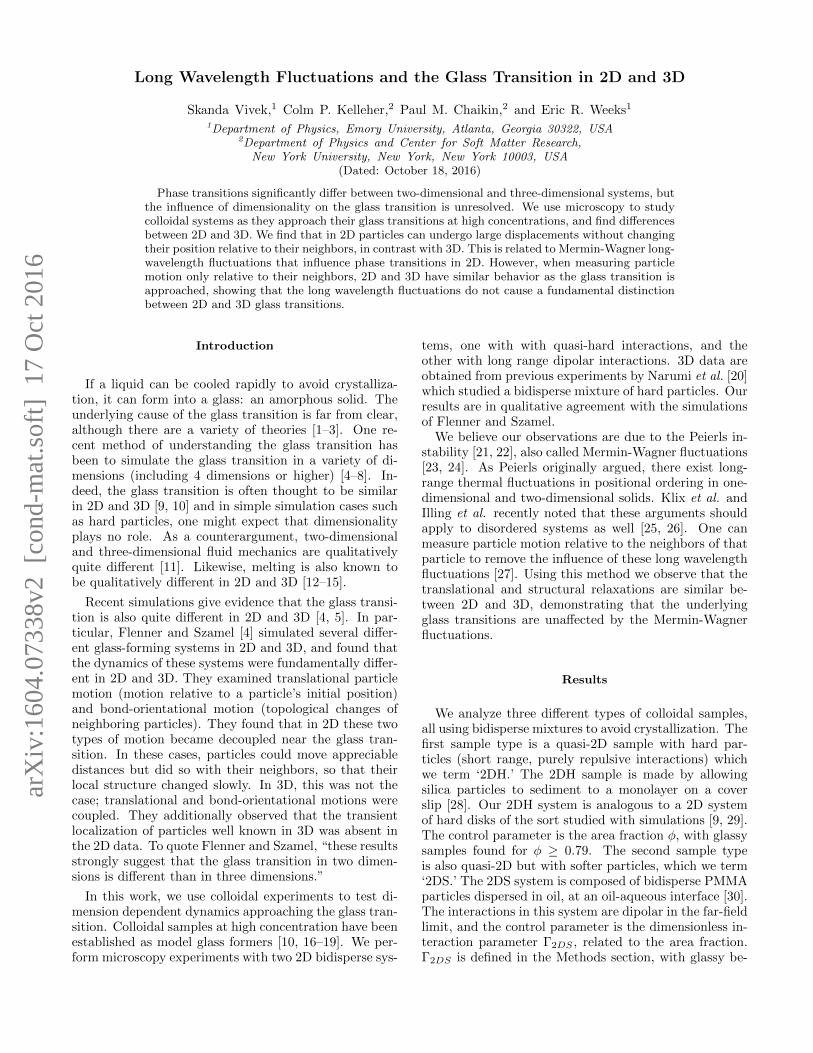
FIG. 1: Structural relaxation in two and three dimen-sions. (A-C) Self-intermediate scattering functions charac-terizing translational motion, using the wave vector k cor-responding to the peak of the structure factor (see Meth-ods and Materials). (D-F ) Bond-orientational correlationfunctions. The columns correspond to 2DH, 2DS, and3D experiments. The parameters for the experiments are:φ2DH = 0.55, 0.65, 0.70, 0.74, 0.75, 0.76, 0.78, and 0.78; 2DS(Γ2DS = 60, 100, 100, 140, 180, 310, 300, and 460); 3D φ3D =0.40, 0.42, 0.52, 0.53, 0.54, 0.54, and 0.57. These parametersincrease from left to right in each panel; or equivalently, frombottom to top.
havior found for Γ ≥ 530. For the third sample type,‘3D,’ we use previously published 3D data on a bidis-perse sample of hard-sphere-like colloids [20]. For thesedata, the control parameter is the volume fraction φ withglasses found for φ ≥ 0.58 [20]. Details of the samplepreparation and data acquisition for these three sampletypes are in the Methods section. For each sample typethe glass transition is defined as the parameter (Γ orφ) above which the sample mean square displacement(MSD) does not equilibrate in experimental time scales,∼ 10 hours for the 2D samples and ∼ 3 hours for the 3Dsamples.
Flenner and Szamel found that in 2D particles movelarge distances without significantly changing local struc-ture [4]. They noted that time scales for translational mo-tion and time scales for changes in local structure werecoupled in 3D, but not in 2D. The standard way to definethese time scales is through autocorrelation functions.Following ref. [4], we compute the self-intermediate scat-tering function FS(k,∆t) to characterize translationalmotion, and a bond-orientational correlation functionC(∆t) to characterize changes in local structural con-figuration (see Methods for details). These are plottedin Fig. 1A − C and 1D − F respectively. At short timescales, particles have barely moved, and so both of thesecorrelation functions are close to 1. At longer time scalesthese functions decay, taking longer time scales to do soat larger concentrations. The traditional relaxation time
scale τα is defined from FS(τα) = 1/e = 0.37. For thebond-orientational correlation functions, we quantify lo-cal arrangements of particles through ψ6 in 2D and Q6 in3D, both of which are sensitive to hexagonal order [31].Decay of the autocorrelation functions for these quanti-ties (Fig. 1D−F ) reflects how particles move relative toone another, thus changing their local structure, whereasdecay of FS reflects motion relative to each particle’s ini-tial position.
Specifically, Flenner and Szamel found that FS(∆t)and C(∆t) had qualitatively different decay forms in 2D,but were similar in 3D [4]. In particular, FS(∆t) decayedsignificantly faster than C(∆t) for 2D simulations. Thismeans that in 2D particles could move significant dis-tances (of order their interparticle spacing) but did so inparallel with their neighbors, so that their positions werechanged but not their local structure.
To compare translational and bond orientational cor-relation functions of our data, we replot some of the datain Fig. 2A − C. The translational correlation functionsfor different parameters are solid curves with differentcolors. The bond-orientational correlation functions aredashed curves, with same color as corresponding trans-lational correlation functions.
The 2D data of Fig. 2A−B exhibit decoupling, whereasthe 3D data of C are coupled. For the latter case, cou-pling means that the two functions decrease together,and their relative positions do not change dramaticallyas the glass transition is approached. Even for the mostconcentrated case, for which we do not observe a finaldecay of either function, it still appears that the twocorrelation functions are related and starting an initialdecay around the same time scale. In contrast, for both2D cases (Fig. 2A,B), FS and Cψ change in relation toone another as the glass transition is approached. For2DH (panel A), at the most liquid-like concentration(black curves), C decays faster than FS (dashed curveas compared to the solid curve). As the glass transi-tion is approached, initially C decays faster, but thenthe decay of FS overtakes C. A similar trend is seen for2DS (panel B). For both 2DH and 2DS, the decouplingis most strongly seen for the most concentrated samples(green curves), for which FS(∆t) decays on experimentaltime scales but where Cψ(∆t) decays little on the sametime scales.
The slower decay of bond-orientational correlations rel-ative to translational correlations for our 2D data is ingood qualitative agreement with Flenner and Szamel’sobservations [4]. Upon approaching the glass transitionin 2D, particles are constrained to move with their neigh-bors such that C decays less than might be expectedon time scales where FS has decayed significantly. In3D, however, on approaching the glass transition parti-cles move in a less correlated fashion. To quantify thecorrelated motion of neighboring particles we compute atwo-particle correlation function [9, 32]. This functioncorrelates the vector displacements of pairs of nearestneighbor particles (see Methods). Fig. 3 shows these cor-
3
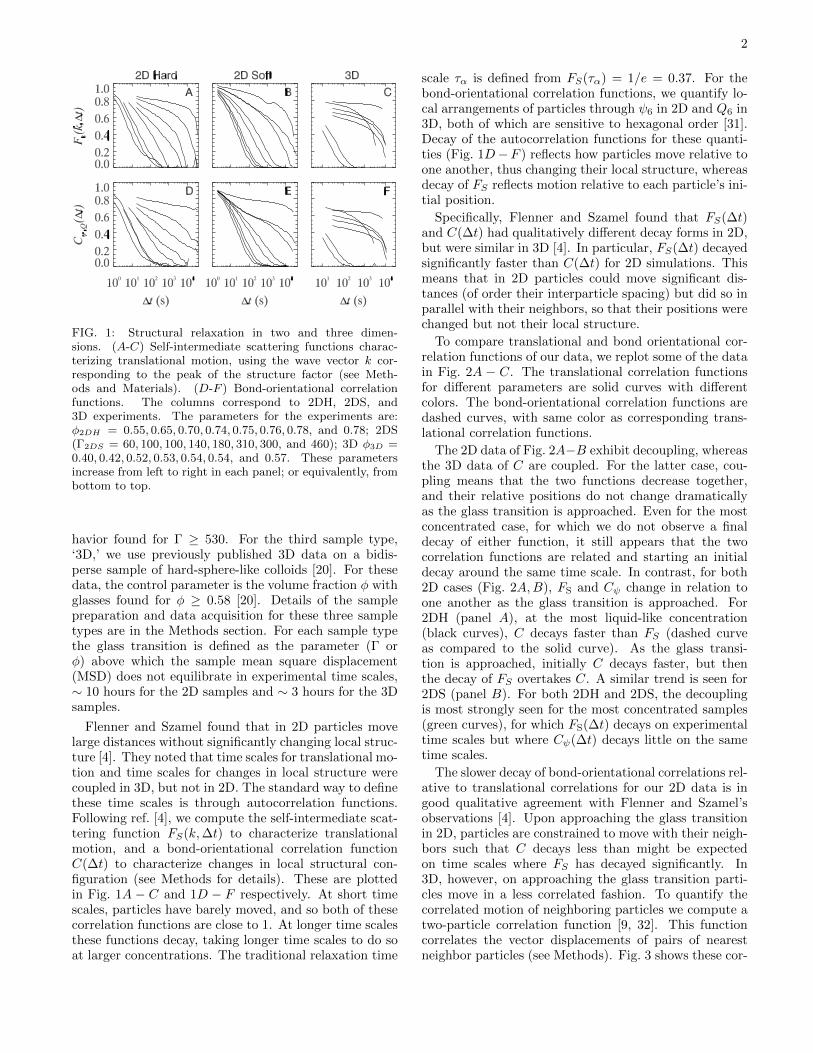
FIG. 2: Translational, bond-orientational, and bond-break correlation functions. (A-C) The solid curves are FS(∆t) (trans-lational correlations) and the dashed curves are C(∆t) (bond-orientational correlations) for the 2DH, 2DS, and 3D sam-ples as labeled. The colors indicate different control parameters. For 2DH the colors black, red, blue, and green denoteφ2DH = 0.55, 0.75, 0.78, and 0.78 respectively. For 2DS the colors black, red, blue, and green denote Γ2DS = 60, 180, 310, and460 respectively. For 3D the colors black, red, blue and green denote φ3D = 0.42, 0.52, 0.54, and 0.58 respectively. (D-F )The solid curves with circles are FS−CR(∆t) (cage-relative translational correlations). The dashed curves are C(∆t) which areidentical to those shown in (A-C). (G-I) The solid curves with circles are FS−CR(∆t) (cage-relative translational correlations)and the dot-dashed curves are B(∆t) (bond-break correlations) for the 2DH, 2DS, and 3D samples.
relations: 1 corresponds to complete correlation, and 0is completely uncorrelated. For both 2D samples (solidsymbols) the correlations increase for larger τα, as indi-cated by the fit lines. This increased correlation reflectsparticles moving in parallel directions with their nearestneighbors. For the 3D data (open squares in Fig. 3) thecorrelations are small and do not grow as the glass tran-sition is approached. Particle motion uncorrelated withneighboring particles decorrelates both positional infor-mation and bond-orientational structure.
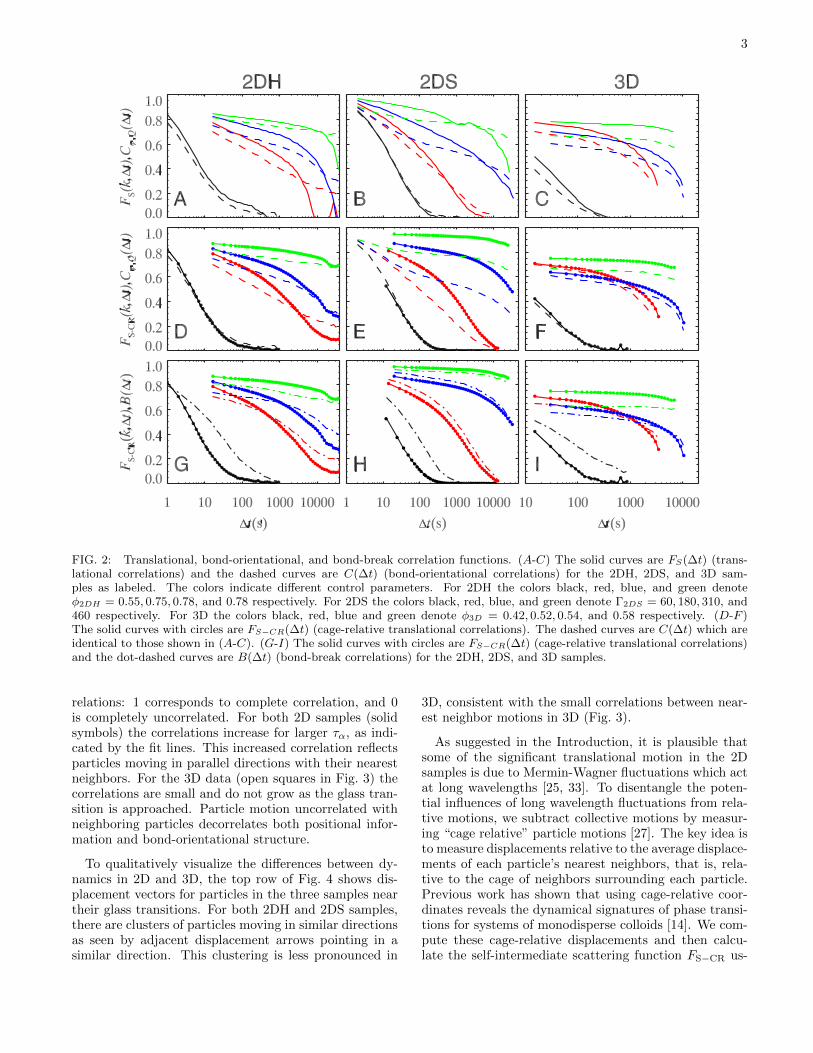
To qualitatively visualize the differences between dy-namics in 2D and 3D, the top row of Fig. 4 shows dis-placement vectors for particles in the three samples neartheir glass transitions. For both 2DH and 2DS samples,there are clusters of particles moving in similar directionsas seen by adjacent displacement arrows pointing in asimilar direction. This clustering is less pronounced in
3D, consistent with the small correlations between near-est neighbor motions in 3D (Fig. 3).
As suggested in the Introduction, it is plausible thatsome of the significant translational motion in the 2Dsamples is due to Mermin-Wagner fluctuations which actat long wavelengths [25, 33]. To disentangle the poten-tial influences of long wavelength fluctuations from rela-tive motions, we subtract collective motions by measur-ing “cage relative” particle motions [27]. The key idea isto measure displacements relative to the average displace-ments of each particle’s nearest neighbors, that is, rela-tive to the cage of neighbors surrounding each particle.Previous work has shown that using cage-relative coor-dinates reveals the dynamical signatures of phase transi-tions for systems of monodisperse colloids [14]. We com-pute these cage-relative displacements and then calcu-late the self-intermediate scattering function FS−CR us-

4
FIG. 3: Vector displacement correlations. The data arefor 2DH (filled circles), 2DS (filled triangles), and 3D (opensquares). The displacements are calculated using a time scale∆t such that FS(∆t) = 0.5. These are measured for all pairsof particles separated by the nearest neighbor spacing d. dis determined from the large-large peak position in the paircorrelation function g(r) at the highest concentrations, andhas values d = 3.38, 6.5, and 3.10 µm for 2DH, 2DS, and 3Drespectively. (The location of the g(r) peak depends slightlyon φ for 2DH and 3D experiments, and more strongly on Γfor the 2DS experiments; for consistency, we keep d fixed tothese specific values.) The lines are least-squares fits to thedata. The data are plotted as a function of τα/τα0 whereτα0 is the relaxation time scale for the large particles in adilute sample. 2DH (closed circles), 2DS (closed triangles),and 3D (open squares) samples have τα0 = 5.4, 20, and 3.8 srespectively.
ing these new displacements. These are plotted as solidlines with circles in Fig. 2D−F , with the dashed lines be-ing the bond-orientational data (which are unchanged asC(∆t) is always calculated relative to neighbors). In both2DH and 2DS, FS−CR(∆t) > FS(∆t) (the solid lines inFig. 2D,E are higher than the corresponding solid linesin Fig. 2A,B). This is expected given the argumentsabove, that particles move with their neighbors, hencesubtracting nearest neighbor motions results in reduc-tion of particle mobility. For the 3D data (Fig. 2F ), theFS−CR(∆t) curves still show coupling to CQ(∆t) similarto the original data shown in Fig. 2C.
To provide a complementary view, we consider an-other measure of structural changes, the cage correlationfunction (or bond-breaking function) B(∆t). B(∆t) isthe fraction of particles that have the same neighbors attimes t and t+ ∆t, averaged over t [34, 35].
These functions are plotted in Fig. 2G − I as dash-dotted lines, and are compared to FS−CR. The blackcurves are the lowest concentrations, which all haveB(∆t) > FS−CR(∆t). This is because at lower con-centrations, particles can translate a significant amountwithout losing neighbors. However at larger concentra-tions, B(∆t) ∼ FS−CR(k,∆t) in all 3 types of samples.For all three experiments, the two correlation functionslook fairly similar at the three highest concentrationsshown in Fig. 2G − I. In particular, the differences be-
tween the 2D and 3D data are much reduced as comparedwith the original analysis shown in panels A− C.
In fact, our strongest qualitative evidence for couplingcomes from comparison of the green curves in Fig. 2,which are the samples closest to the glass transition.In each case, the correlation functions do not fully de-cay within our experimental observation time. Nonethe-less, it is apparent for the 2D data that the normal self-intermediate scattering function is beginning a final de-cay at a time scale for which the bond-orientational func-tion has not yet begun to decay (Fig. 2A,B). This is notthe case for the 3D data (panel C). In contrast, all threedata sets exhibit similar behavior at the largest timescales when comparing the cage-relative FS−CR(k,∆t)and B(∆t) (panels G− I).
We turn now to the question of transient localization,which Flenner and Szamel found to be present in 3D butnot 2D. The trajectories of 3D particles showed localizedmotions separated by abrupt jumps, while trajectoriesof 2D particles did not have these two distinct types ofmotion [4]. In their data, this caused a plateau in the 3DMSD, which was not seen in the 2D MSD. The plateau isdue to particles being transiently trapped in cages formedby their neighbors, with the plateau height set by thecage size [35].
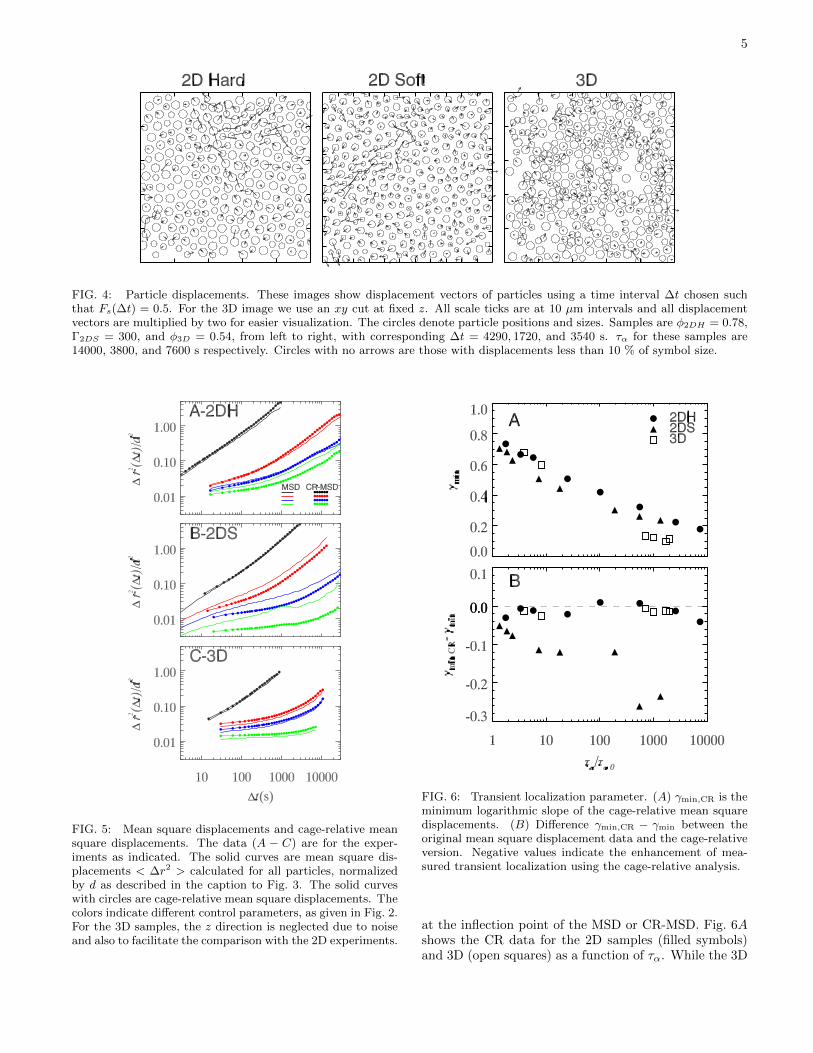
Motivated by the considerations above, we investigatethe cage-relative mean square displacements (CR-MSD)[27]. In analogy with the cage-relative scattering func-tion, we use the cage-relative displacement ∆~rCR to de-fine the CR-MSD. Fig. 5 shows the original MSD data(thin lines) and CR-MSD (lines with circles). For all ex-periments as the concentration increases the MSD drops,reflecting the slowing dynamics on approaching the glasstransition. In some cases, the CR-MSD is larger thanthe MSD (for example, all the curves in Fig. 5C). Inthese situations, the motion of each particle is less cor-related with the motion of its neighbors, so the cage-relative analysis effectively adds a random vector to eachparticle’s displacement, thus increasing the MSD on av-erage. However, for the 2D samples as they approachthe glass transition, the opposite occurs. Especially forthe green curves in Fig. 5A,B, the data closest to theglass transition, it is clear that the cage-relative analysisdramatically decreases the CR-MSD data relative to theoriginal MSD. While we show data close to the glass tran-sition, none of our data are from glasses. There have beena number of experiments on other 2D colloidal systemssuch as soft particles [36] and attractive particles [37]which observed a slowly rising MSD for glasses. Ourresults suggest that the MSD rise seen in these prior ex-periments may also disappear with cage-relative analysis,strengthening the argument that these prior experimentsstudied truly glassy samples.
To quantify transient localization, we measure the in-stantaneous logarithmic MSD slope γ from 〈∆r2〉 ∼∆tγ(∆t). γ = 1 corresponds to normal diffusion. Wequantify the amount of localization by the minimumvalue of this slope, γmin; this is the logarithmic slope
5
FIG. 4: Particle displacements. These images show displacement vectors of particles using a time interval ∆t chosen suchthat Fs(∆t) = 0.5. For the 3D image we use an xy cut at fixed z. All scale ticks are at 10 µm intervals and all displacementvectors are multiplied by two for easier visualization. The circles denote particle positions and sizes. Samples are φ2DH = 0.78,Γ2DS = 300, and φ3D = 0.54, from left to right, with corresponding ∆t = 4290, 1720, and 3540 s. τα for these samples are14000, 3800, and 7600 s respectively. Circles with no arrows are those with displacements less than 10 % of symbol size.
FIG. 5: Mean square displacements and cage-relative meansquare displacements. The data (A − C) are for the exper-iments as indicated. The solid curves are mean square dis-placements < ∆r2 > calculated for all particles, normalizedby d as described in the caption to Fig. 3. The solid curveswith circles are cage-relative mean square displacements. Thecolors indicate different control parameters, as given in Fig. 2.For the 3D samples, the z direction is neglected due to noiseand also to facilitate the comparison with the 2D experiments.
FIG. 6: Transient localization parameter. (A) γmin,CR is theminimum logarithmic slope of the cage-relative mean squaredisplacements. (B) Difference γmin,CR − γmin between theoriginal mean square displacement data and the cage-relativeversion. Negative values indicate the enhancement of mea-sured transient localization using the cage-relative analysis.
at the inflection point of the MSD or CR-MSD. Fig. 6Ashows the CR data for the 2D samples (filled symbols)and 3D (open squares) as a function of τα. While the 3D

6
data reach lower values, the overall trend is similar be-tween 2D and 3D: the closer to the glass transition, themore pronounced transient localization is. Note that inthe work of Flenner and Szamel, they tested both Newto-nian dynamics and Brownian dynamics; the latter is moreappropriate for colloids. With Brownian dynamics in 2D,they found slightly more pronounced MSD plateaus. It ispossible that the presence of Brownian dynamics in ourexperiments also contributes to our observed similaritiesin transient localization between 2D and 3D.
Fig. 6B shows the slight enhancement of transient lo-calization caused by the cage-relative analysis. We plotthe change in γmin upon using the cage-relative analy-sis, and it is generally negative. The largest changes areseen in the 2DS data (solid triangles), which is sensibleas these are the data with the strongest correlations withtheir neighbors.
Discussion
Our experiments show apparent differences in dynam-ics approaching the 2D and 3D colloidal glass transition,in agreement with the simulation results of Flenner andSzamel [4].
In 2D, we observe that particles move in parallel withtheir neighbors, such that their local structure changesless than if the motions were uncorrelated. While it isclear from prior work that in 3D particle motions havesome correlation with their neighbors [32], in our datathe correlations are more significant for the 2D samples.These are likely related to Mermin-Wagner fluctuations/ the Peierls instability in 2D [21–26].
Our 2D samples are, of course, quasi-2D. Both are in-fluenced by nearby large 3D regions of fluid. The 2DHsample also has hydrodynamic interactions between par-ticles and the nearby bottom of the sample chamber.We find that 2DS samples are more affected by long-wavelength fluctuations than 2DH, which could be dueto the difference in interactions [24, 38]. It is certainlyplausible that softer interactions allow for more fluctua-tions in the nearest-neighbor distance, whereas for densesamples with hard interactions, fluctuations are by ne-cessity smaller (as particles cannot move too close to-gether before they repel) [25]. Recent simulation workhas shown differences in correlation lengths for diskswith soft and hard interaction potentials during 2D melt-ing [39]. Nonetheless, the agreement between the two 2Ddata sets is striking, especially given the different particleinteraction potentials. Namely as distinct from the 3Dsamples, both 2D samples show large Mermin-Wagnerfluctuations.
Another important experimental factor is the systemsize: approximately 105 − 106 for both 2D systems and109 for the 3D system. It is likely that for even larger2D systems, the Mermin-Wagner fluctuations would bemore pronounced [4, 33, 40].
Klix, Maret, and Keim [26] recently argued that
Mermin-Wagner fluctuations should be present in glassysystems. Probably the most interesting aspect of ourstudy is the suggestion that indeed 2D Mermin-Wagnerfluctuations are present in our amorphous samples.Mermin-Wagner fluctuations conventionally result fromelasticity associated with the development of an order pa-rameter. The origin of elasticity in glassy systems is lesswell understood. While we have not proven that our ob-served long-wavelength fluctuations are indeed Mermin-Wagner fluctuations, one could vary the system size infuture investigations to examine how the difference be-tween conventional and cage-relative measurements de-pends on system size. In conclusion, with our effortsand other recent work, there is a compelling collection ofevidence that 2D and 3D glass transitions are fundamen-tally the same: there is strong qualitative agreement be-tween our observations studying three colloidal systems,the colloidal experiments and simulations of Illing et al.[25], and the soft particle simulations of Shiba et al. [33].The similarities between the conclusions, despite the dif-ferences in methods and dynamics, suggest the resultsare independent of the details. All of these observationsshow that the 2D glass transition is similar to the 3Dglass transition, but with the added influence of Mermin-Wagner fluctuations in 2D.
Materials and Methods
For 2DH experiments, we confine bidisperse non-functionalized silica particles (diameters σS = 2.53 andσL = 3.38 µm, Bangs Laboratories, SS05N) to a mono-layer by gravity. Prior to taking data, the sample isquenched by shaking and letting particles sediment onthe coverslip. The coverslip is made hydrophobic bytreatment with Alfa Aesar Glassclad 18 to prevent par-ticle adhesion. All particles are observed to move dur-ing the experiment; none adhere to the glass. We donot add salt. The sedimentation lengths for both small(lg/σS = 0.019) and large particles (lg/σL = 0.006) aresmall enough to ensure fast sedimentation and forma-tion of a quasi-2D monolayer; that is, thermal energy isnot enough to overcome the gravitational potential en-ergy of the particles [10]. We verify that in all experi-ments, only one layer of particles is present (ensured bykeeping the overall particle concentration below the levelthat requires a second layer to form). We use bright-field microscopy and a CCD camera to record movies ofparticles diffusing. This system is analogous to 2D harddisks. The only caveat is that the centers of the largeand small particles are not at the same height, so adja-cent large and small particles do not contact each otherat their midplane [41].
For 2DS, the experimental system is composed of bidis-perse poly-methyl-methacrylate (PMMA) colloids of di-ameters 1.1 and 2.6 µm. The particles are at the interfacebetween oil and a glycerol/water mixture. The aqueousphase consists of 10mM NaCl 70 wt. % glycerol solution,
7
while the oil phase consists of a 50-30-20 v/v mixture ofcyclohexyl bromide, hexane and dodecane. Interactionsbetween particles are dipolar in the far-field limit. Adimensionless interaction parameter [18] is used to char-acterize the system:
Γ2DS =(πn)3/2
8πεkBT(ξpB + (1− ξ)pA)2 (1)
where ε = 4.2ε0. The electric dipole moments are pA andpB = 2300 and 590 e ·µm respectively. ξ ≈ 0.57− 0.83 isthe number fraction of small particles, and n is the arealdensity, measured from a Voronoi tessellation.
The 3D sample data were obtained from a previousexperiment by Narumi et al. [20]. In 3D experiments,PMMA colloids were stabilized sterically by a thin layerof poly-12-hydroxy-stearic acid. A binary mixture withdiameters σL = 3.10 µM and σS = 2.36 µm were used.The number ratio of small particles to large particles was1.56.
The imaging regions encompass roughly 400, 1500, and2000 particles for 2DH, 2DS, and 3D samples respectivelyat their highest concentrations. The total system sizesare much larger, approximately 105−106 for both 2D sys-tems and 109 for the 3D system. We post-processed 2DHand 2DS movies using particle tracking algorithms [42] toextract particle positions from individual frames. The 3Ddata were previously tracked using the same algorithm.Our uncertainty in particle position is 0.1 µm for the 2DHexperiment, 0.5 µm for the 2DS experiment, and 0.2 µm(x, y) and 0.3 µm (z) for the 3D experiment [20].
The α relaxation timescales are computed from self-
intermediate scattering functions: FS(k,∆t) = 〈exp(i~k ·∆~r)〉t where ∆~r = ~r(t + ∆t) − ~r(t). The wave vec-tor k corresponds to the peak of the structure factor
S(~k) = 〈N−1|∑Ni=1 exp(i~k · ~ri(t))|2〉, where ~ri(t) denotes
particle positions at time t and the average is over alltimes. Corresponding to 2DH, 2DS, and 3D, k = 2.2, 1.0,and 2.6 µm−1, obtained using the average k across allsamples of a particular type.
Several other functions we compute require identifyingnearest neighbors, which we do using the Voronoi tessel-lation [17].
We define cage-relative translational correlation func-
tion as: FS−CR(k,∆t) = 〈exp(i~k · ∆~rCR)〉t where∆~rCR = ~r(t + ∆t) − ~r(t) − 1
N
∑j [~rj(t + ∆t) − ~rj(t)],
j denotes nearest neighbors of the particle at initial timet, and the sum is over all neighbors. The cage-relativemean square displacement is defined using the same dis-placements ∆~rCR.
To measure bond-orientational correlations in 2D [4],we define Ψn
6 (t) =∑m(Nn
b )−1m ei6θm , where m are the
nearest neighbors of particle n and θm is the anglemade by particle m with defined axis. From this, thebond-orientational correlation function can be found asCΨ(∆t) = 〈
∑n[Ψn
6 (t)]∗Ψn6 (t+ ∆t)〉t/〈
∑n |Ψn
6 (t)|2〉t.In 3D, we define Qilm(t) = (N i
b)−1
∑j qlm[θij(t), φij(t)]
where qlm(θ, φ) are spherical harmonics [4, 31] andthe sum is over neighbors of particle i. Nextwe define the correlation function Ql(t1, t2) =
4π/(2l + 1)∑i
∑lm=−lQ
ilm(t2)[Qilm(t1)]∗. We calculate
CQ(∆t) = 〈Q6(t, t + ∆t)〉t/〈Q6(t, t)〉t corresponding tol = 6, given that l = 6 is sensitive to hexagonal orderknown to be present even in disordered samples.
The two-particle vector correlations are determinedfrom a spatial-temporal correlation function defined as
Svec(R,∆t) = 〈 ~∆ri ~∆rj〉pair/〈( ~∆r2)〉 [9, 32]. The averageis over all particles with initial separation R ≈ d, andover the initial time t. For the initial separation R, we useR = 3.38±0.2, R = 6.5±0.4, and R = 3.1±0.2 µm for the2DH, 2DS, and 3D data. To determine the displacements∆~r we use the time scale ∆t such that FS(∆t) = 0.5.This is chosen to be a shorter time scale than τα, asparticle displacements are typically maximally spatiallyheterogeneous at a shorter time scale [17, 35].
Acknowledgments
We thank E. Flenner, G. Szamel, R. Guerra, P. Keim,H. Shiba, and V. Trappe for useful discussions. The workof S.V. and E.R.W. was supported by a grant from theNational Science Foundation (CMMI-1250235). C.P.K.and P.M.C. were supported by grants from the Na-tional Science Foundation (DMR-1105417), NASA (NNX13AR67G), and the MRSEC program of the National Sci-ence Foundation (DMR-1420073).
[1] Biroli G, Garrahan JP (2013) Perspective: The glasstransition. J. Chem. Phys. 138:12A301.
[2] Ediger MD, Harrowell P (2012) Perspective: Supercooledliquids and glasses. J. Chem. Phys. 137:080901.
[3] Cavagna A (2009) Supercooled liquids for pedestrians.Phys. Rep. 476:51–124.
[4] Flenner E, Szamel G (2015) Fundamental differences be-tween glassy dynamics in two and three dimensions. Na-ture Comm. 6:7392.
[5] Sengupta S, Karmakar S, Dasgupta C, Sastry S (2012)Adam-Gibbs relation for glass-forming liquids in two,
three, and four dimensions. Phys. Rev. Lett. 109:095705.[6] van Meel JA, Frenkel D, Charbonneau P (2009) Geo-
metrical frustration: A study of four-dimensional hardspheres. Phys. Rev. E 79:030201(R).
[7] Charbonneau P, Ikeda A, van Meel JA, MiyazakiK (2010) Numerical and theoretical study of amonodisperse hard-sphere glass former. Phys. Rev. E81:040501(R).
[8] Charbonneau P, Ikeda A, Parisi G, Zamponi F (2011)Glass transition and random close packing above threedimensions. Phys. Rev. Lett. 107:185702.
8
[9] Doliwa B, Heuer A (2000) Cooperativity and spatial cor-relations near the glass transition: Computer simulationresults for hard spheres and disks. Phys. Rev. E 61:6898–6908.
[10] Hunter GL, Weeks ER (2012) The physics of the colloidalglass transition. Rep. Prog. Phys. 75:066501.
[11] Tritton DJ (1988) Physical Fluid Dynamics (Oxford Sci-ence Publications) (Oxford University Press, USA), 2edition.
[12] Bernard EP, Krauth W (2011) Two-Step melting in twodimensions: First-Order Liquid-Hexatic transition. Phys.Rev. Lett. 107:155704.
[13] Strandburg KJ (1988) Two-dimensional melting. Rev.Mod. Phys. 60:161–207.
[14] Zahn K, Maret G (2000) Dynamic criteria for melting intwo dimensions. Phys. Rev. Lett. 85:3656–3659.
[15] Gasser U, Eisenmann C, Maret G, Keim P (2010)Melting of crystals in two dimensions. ChemPhysChem11:963–970.
[16] Kegel WK, van Blaaderen A (2000) Direct observationof dynamical heterogeneities in colloidal hard-sphere sus-pensions. Science 287:290–293.
[17] Weeks ER, Crocker JC, Levitt AC, Schofield A, WeitzDA (2000) Three-dimensional direct imaging of struc-tural relaxation near the colloidal glass transition. Sci-ence 287:627–631.
[18] Ebert F, Dillmann P, Maret G, Keim P (2009) The exper-imental realization of a two-dimensional colloidal modelsystem. Rev. Sci. Inst. 80:083902.
[19] Pusey PN, van Megen W (1986) Phase behaviour ofconcentrated suspensions of nearly hard colloidal spheres.Nature 320:340–342.
[20] Narumi T, Franklin SV, Desmond KW, Tokuyama M,Weeks ER (2011) Spatial and temporal dynamical het-erogeneities approaching the binary colloidal glass tran-sition. Soft Matter 7:1472–1482.
[21] Peierls R (1934) Bemerkungen uber umwandlungstem-peraturen. Helvetica Physica Acta 7:81–83.
[22] Landau LD (1937) Zur theorie der phasenumwandlungenII. Phys. Zurn. Sowjetunion 11.
[23] Mermin ND, Wagner H (1966) Absence of ferromag-netism or antiferromagnetism in one- or two-dimensionalisotropic Heisenberg models. Phys. Rev. Lett. 17:1133–1136.
[24] Mermin ND (1968) Crystalline order in two dimensions.Phys. Rev. 176:250–254.
[25] Illing B, et al. (2016) Mermin-Wagner fluctuations in 2Damorphous solids. arXiv:1510.05804v2.
[26] Klix CL, Maret G, Keim P (2015) Discontinuous shearmodulus determines the glass transition temperature.Phys. Rev. X 5:041033.
[27] Mazoyer S, Ebert F, Maret G, Keim P (2009) Dynamicsof particles and cages in an experimental 2d glass former.Europhys. Lett. 88:66004.
[28] Gray AT, Mould E, Royall CP, Williams I (2015) Struc-tural characterisation of polycrystalline colloidal mono-layers in the presence of aspherical impurities. J. Phys.:Cond. Matter 27:194108.
[29] Donev A, Stillinger FH, Torquato S (2006) Do binaryhard disks exhibit an ideal glass transition? Phys. Rev.Lett. 96:225502.
[30] Kelleher CP, et al. (2015) Charged hydrophobic col-loids at an oil-aqueous phase interface. Phys. Rev. E92:062306.
[31] Steinhardt PJ, Nelson DR, Ronchetti M (1983) Bond-orientational order in liquids and glasses. Phys. Rev. B28:784–805.
[32] Weeks ER, Crocker JC, Weitz DA (2007) Short- andlong-range correlated motion observed in colloidal glassesand liquids. J. Phys.: Cond. Matter 19:205131.
[33] Shiba H, Yamada Y, Kawasaki T, Kim K (2016) Unveil-ing dimensionality dependence of glassy dynamics: 2d in-finite fluctuation eclipses inherent structural relaxation.arXiv:1510.02546v3.
[34] Rabani E, Gezelter JD, Berne BJ (1997) Calculating thehopping rate for self-diffusion on rough potential energysurfaces: Cage correlations. J. Chem. Phys. 107:6867–6876.
[35] Weeks ER, Weitz DA (2002) Properties of cage rear-rangements observed near the colloidal glass transition.Phys. Rev. Lett. 89:095704.
[36] Yunker P, Zhang Z, Aptowicz KB, Yodh AG (2009) Ir-reversible rearrangements, correlated domains, and lo-cal structure in aging glasses. Physical review letters103:115701.
[37] Zhang Z, Yunker PJ, Habdas P, Yodh AG (2011) Co-operative rearrangement regions and dynamical hetero-geneities in colloidal glasses with attractive versus repul-sive interactions. Phys. Rev. Lett. 107:208303.
[38] Frohlich J, Pfister C (1981) On the absence of sponta-neous symmetry breaking and of crystalline ordering intwo-dimensional systems. Comm. Math. Phys. 81:277–298.
[39] Kapfer SC, Krauth W (2015) Two-dimensional melt-ing: From liquid-hexatic coexistence to continuous tran-sitions. Phys. Rev. Lett. 114:035702.
[40] Shiba H, Kawasaki T, Onuki A (2012) Relationship be-tween bond-breakage correlations and four-point corre-lations in heterogeneous glassy dynamics: Configurationchanges and vibration modes. Phys. Rev. E 86:041504.
[41] Thorneywork AL, Roth R, Aarts DGAL, Dullens RPA(2014) Communication: Radial distribution functions ina two-dimensional binary colloidal hard sphere system.J. Chem. Phys. 140.
[42] Crocker JC, Grier DG (1996) Methods of digital videomicroscopy for colloidal studies. J. Colloid Interface Sci.179:298–310.