longevity among hunter-gatherers
TRANSCRIPT
8/8/2019 Longevity Among Hunter-Gatherers
http://slidepdf.com/reader/full/longevity-among-hunter-gatherers 1/46
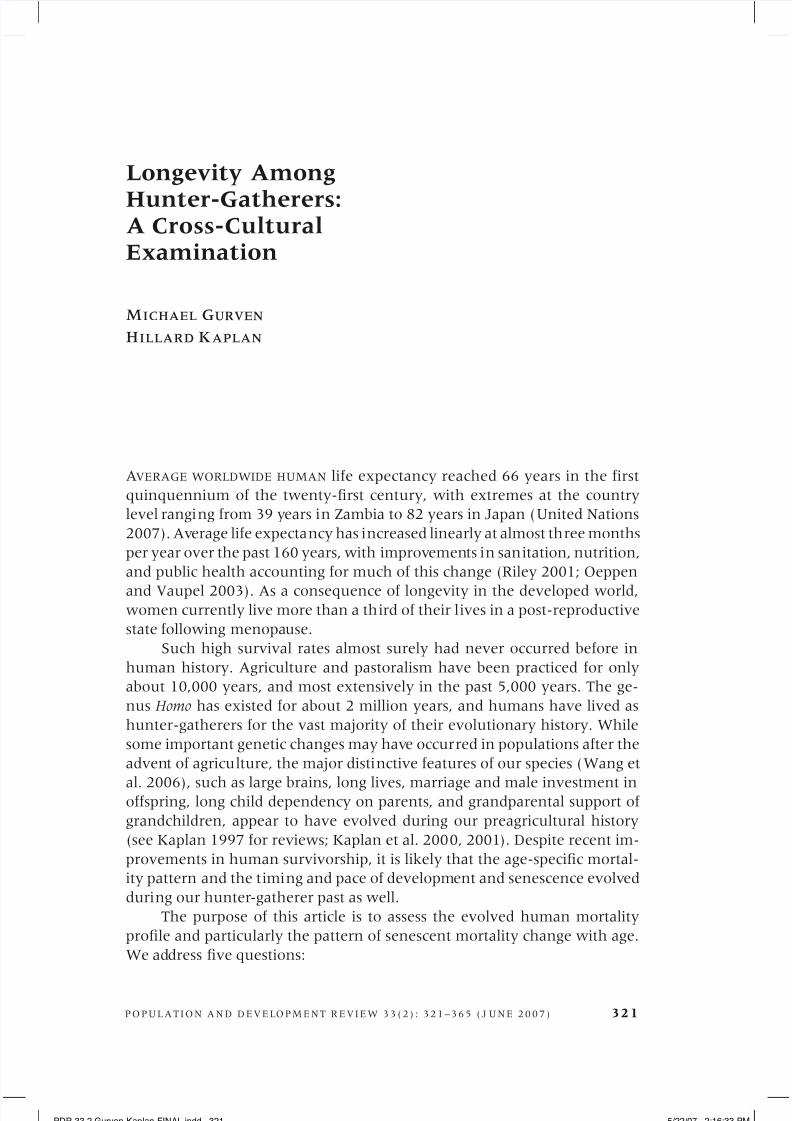
POPU LA TI ON A N D D EVELOPMEN T REVI EW 33(2 ) : 321– 365 ( J U N E 2007) 321
Longevity Among
Hunter-Gatherers:A Cross-CulturalExamination
MICHAEL G URVEN
HILLARD KAPLAN
AVERAGE WORLDWIDE HUMAN life expectancy reached 66 years in the first
quinquennium of the twenty-first century, with extremes at the country
level ranging from 39 years in Zambia to 82 years in Japan (United Nations
2007). Average life expectancy has increased linearly at almost three months
per year over the past 160 years, with improvements in sanitation, nutrition,
and public health accounting for much of this change (Riley 2001; Oeppen
and Vaupel 2003). As a consequence of longevity in the developed world,women currently live more than a third of their lives in a post-reproductive
state following menopause.
Such high survival rates almost surely had never occurred before in
human history. Agriculture and pastoralism have been practiced for only
about 10,000 years, and most extensively in the past 5,000 years. The ge-
nus Homo has existed for about 2 million years, and humans have lived as
hunter-gatherers for the vast majority of their evolutionary history. While
some important genetic changes may have occurred in populations after the
advent of agriculture, the major distinctive features of our species (Wang et
al. 2006), such as large brains, long lives, marriage and male investment inoffspring, long child dependency on parents, and grandparental support of
grandchildren, appear to have evolved during our preagricultural history
(see Kaplan 1997 for reviews; Kaplan et al. 2000, 2001). Despite recent im-
provements in human survivorship, it is likely that the age-specific mortal-
ity pattern and the timing and pace of development and senescence evolved
during our hunter-gatherer past as well.
The purpose of this article is to assess the evolved human mortality
profile and particularly the pattern of senescent mortality change with age.
We address five questions:
PDR 33.2 Gurven-Kaplan-FINAL.indd 321 5/22/07 2:16:33 PM
8/8/2019 Longevity Among Hunter-Gatherers
http://slidepdf.com/reader/full/longevity-among-hunter-gatherers 2/46
322 LONGEV ITY AMONG HUNTER -GATHERERS
1) Is there a characteristic shape to the human mortality profile, as it
decreases first during childhood and then increases with aging?
2) How robust is the occurrence of a post-reproductive life span, andhow likely is it that older adults were alive and available in human popula-
tions?
3) Is there a characteristic modal age at death for adults, and what can
this mode tell us about aging and the evolution of the human life span?
4) How variable is this mortality profile among populations, and what
factors shape any variation?
5) How do the mortality patterns of modern hunter-gatherers compare
with estimates of the mortality profiles of both chimpanzees, our closest
living primate relative, and prehistoric populations derived from funerary
samples, and what implications can be derived from those comparisons?Our approach is to assess and analyze available demographic data on
extant hunter-gatherers and forager-horticulturalists (i.e., peoples who mix
hunting and gathering with swidden agriculture). To understand the pro-
cesses that shaped the evolution of our life course, it would be useful to have
data on mortality and fertility across populations and over evolutionary time.
Because these data do not exist, we critically evaluate data on modern groups
as one lens into our past, however imperfect.
Our conclusion is that there is a characteristic life span for our spe-
cies, in which mortality decreases sharply from infancy through childhood,
followed by a period in which mortality rates remain essentially constant to
about age 40 years, after which mortality rises steadily in Gompertz fash-
ion. The modal age of adult death is about seven decades, before which time
humans remain vigorous producers, and after which senescence rapidly
occurs and people die. We hypothesize that human bodies are designed to
function well for about seven decades in the environment in which our spe-
cies evolved. Mortality rates differ among populations and among periods,
especially in risks of violent death. However, those differences are small in a
comparative cross-species perspective, and the similarity in mortality profiles
of traditional peoples living in varying environments is impressive.
After publishing their life table for Yanomamo Amerindians of Ven-
ezuela 30 years ago, Neel and Weiss (1975) made an “appeal to anthro-pologists…to produce comparable bodies of [demographic] data.” This is
our attempt to synthesize the best information about mortality in relatively
isolated, small-scale foraging-based populations. The sample of groups used
in this analysis is larger than in any other previous study (e.g., Kaplan et al.
2000; Kennedy 2003; Pennington 2001; Gage 1998). This is our best oppor-
tunity to examine the mortality structure of humans living a lifestyle most
similar to the lifestyles of our foraging ancestors. These populations are ac-
culturating at a rapid rate, thus future data are unlikely to be forthcoming.
For example, 33 of 105 isolated indigenous groups in Brazil became extinct
between 1900 and 1957, and only 33 groups remain isolated (Ribeiro 1967:
PDR 33.2 Gurven-Kaplan-FINAL.indd 322 5/22/07 2:16:34 PM

8/8/2019 Longevity Among Hunter-Gatherers
http://slidepdf.com/reader/full/longevity-among-hunter-gatherers 3/46
M I C H A E L GU R V E N / H I L L A R D KA P L A N 323
92). There are few extant groups of human hunter-gatherers, and probably
no large group for which detailed demographic information on people of all
ages is available. The few groups that exist are relatively small, disrupted byinfectious disease and interactions with miners, colonists, or other nationals.
It is therefore unlikely that more than a few new societies will be added to
the sample presented in this article.
Methodology
Our approach is to assess the mortality profiles of all extant hunter-gatherers
for which sufficient high-quality demographic data exist. Table 1 provides the
study years, time period covered, sample sizes of individuals, total person-years
and person-years for individuals aged 50 and older, and sources of the data.The societies in the sample are described in Appendix 1. We include in our
data set small-scale populations that also engage in slash and burn horticul-
ture because these groups share similar characteristics with modern foraging
populations. Whereas forager-horticulturalists have engaged in horticulture for
many generations, groups in our acculturated hunter-gatherer category have
either recently started horticulture and/or have been exposed to medicines,
markets, and other modern amenities. All groups in our ethnographic sample
of hunter-gatherers have had minimal or no exposure to modern medicine, and
minimal or no inclusion of products of horticulture or market-derived foods
in their diet. Other traits commonly associated with a foraging lifestyle varyamong hunter-gatherer groups, such as mobility, an egalitarian ethic, wide-
spread sharing, minimal storage, and other social traits (Kelly 1995). The des-
ignation of high-quality data means that age estimation is reasonably accurate
and there is no systematic bias in the underreporting of deaths. Most impor-
tantly, survivorship and mortality profiles for these populations are based on
actual deaths from prospective or retrospective studies, and not on model life
tables fitted to scanty data or census data. These profiles therefore make no
assumptions about stable or stationary populations, which can bias estimates
of adult mortality. Stable population theory requires that mortality and fertility
schedules remain constant over long periods of time, while stationary distribu-
tions additionally require zero population growth. If a population is actually
growing, and stationarity is instead assumed, the death rate is usually overes-
timated (see Pennington 1996). Additional criteria, borrowed from Early and
Peters (2000: 71), require that demographic data collection was an objective
of research and that data were subject to rigorous error-checking.
Although this sample is the most complete set of preindustrial popula-
tions available, data limitations make it necessary to rely upon subsets of the
populations for specific analyses. For example, the Agta and Warao demog-
raphies lack sufficient age resolution at later ages for us to trust mortality
profiles after the age of 45 or 50 years. Age estimates for older adults among
the Gainj are unreliable, with no age categories beyond age 60. Data on older
PDR 33.2 Gurven-Kaplan-FINAL.indd 323 5/22/07 2:16:34 PM

8/8/2019 Longevity Among Hunter-Gatherers
http://slidepdf.com/reader/full/longevity-among-hunter-gatherers 4/46
T
A B L E 1
S a m p l e o f s t u d y p o p
u l a t i o n s
Y e a r s
Y e a r s
N o . o f i n -
P e r s o n -
N o . o f
P e r s o n - y e a
r s A g e
D a t a
D a t a
G
r o u p
T y p e
s t u
d i e d
c o v e r e d
d i v i d u a l s
y e a r s
d e a t h s
o v e r a g e 5 0
i n t e r v a l s
c o l l e c t i o n
s o u r c e
H
u n t e r - g a t h e r e r s
! K
u n g
H G
1 9 6
3 – 7
4
1 9 6 3 – 7
4
5 0 0
1 , 7
6 7
9 6
< 1 7
5 , 1
0
r e t r o
H o w e l l 1 9 7 9 : T a b l e 4 . 1
A
c h e
H G
1 9 8
0 – 9
4
< 1 9 7 1
9 7 1
1 6 , 1
0 5
3 5 3
1 , 1
4 7
1
r e t r o
H i l l a n d
H u r t a d o 1 9 9 6
A
g t a
H G
1 9 6
2 – 8
6
1 9 5 0 – 6
4
1 7 6
2 , 6
3 5
1 1 7
1 8 4
5 , 1
0
p r o s p /
E a r l y a n
d H e a d l a n d
r e t r o
1 9 9 8 : T
a b l e 8 . 1
H
a d z a
H G
1 9 8
5 – 9
5
1 9 8 5 – 9
5
7 0 6
6 , 8
9 3
1 2 5
1 , 2
2 4
1
p r o s p
B l u r t o n
J o n e s
c e n s u s
e t a l . 2 0 0 2
H
i w i
H G
1 9 8
8 – 9
0
< 1 9 6 0
3 7 5
3 , 5
6 5
1 0 7
3 4 1
1
r e t r o
H i l l e t a l . 2 0 0 7
F o r a g e r - h o r t i c u l t u r a l i s t s
Y a n o m a m o X i l i x a n a
F H
1 9 5
9 – 9
5
1 9 3 0 – 5
6
1 2 0
2 , 8
4 3
6 4
1 8 0
5 , 1
0
r e t r o
E a r l y a n
d P e t e r s 2 0 0 0
Y a n o m a m o X i l i x a n a
F H
1 9 5
9 – 8
6
1 9 8 2 – 9
5
3 2 8
4 , 4
2 0
1 2 4
2 7 9
5 , 1
0
p r o s p /
E a r l y a n
d P e t e r s 2 0 0 0
“ B r a z i l i a n ”
r e t r o
Y a n o m a m o
F H
1 9 6 0 s
1 9 6 0 s
2 , 5
1 3
N / A
N / A
N / A
5
c e n s m o d e l N e e l a n d W e i s s 1 9 7 5
fi t
T s i m a n e
F H
2 0 0
2 – 0
3
1 9 5 0 – 8
9
1 , 7
0 2
5 5 , 9
9 0
9 1 6
2 , 7
8 5
1
r e t r o
G u r v e n
e t a l . 2 0 0 7
M
a c h i g u e n g a
F H
1 9 8
8 – 8
9
< 1 9 8 8
2 8 7
5 , 5
2 0
1 5 0
2 7 8
5
r e t r o
K a p l a n ,
u n p u b l i s h e d
G
a i n j
H
1 9 7
0 – 7
8
1 9 7 0 – 7
8
1 , 5
0 0
9 , 1
0 2
2 8 7
N / A
5
v i t a l r e g i s t
W o o d 1
9 8 0 ,
1 9 8 7
A
c c u l t u r a t e d f o r a g e r s a n d o t h e r s
! K
u n g
A - H
G
1 9 6
3 – 7
4
1 9 6 3 – 7
4
4 1 8
4 , 5
1 1
7 5
8 1 8
5
p r o s p
H o w e l l 1 9 7 9 : T a b l e 4 . 6
! K
u n g
A - H
G
1 9 6
3 – 7
4
1 9 6 3 – 7
4
9 4
3 , 5
2 7
9 4
7 9 2
5
p r o s p
H o w e l l 1 9 7 9 : T a b l e 4 . 4
A
g t a
T R A N S
1 9 6
2 – 8
6
1 9 6 5 – 7
9
2 0 0
2 , 9
9 5
1 0 0
2 1 0
5 , 1
0
p r o s p
E a r l y a n
d H e a d l a n d
H G
1 9 9 8 : T
a b l e 8 . 1
A
g t a
A - H
G
1 9 6
2 – 9
4
1 9 8 0 – 9
4
2 1 2
3 , 1
8 5
1 4 7
2 2 3
5 , 1
0
p r o s p
E a r l y a n
d H e a d l a n d
1 9 9 8 : T
a b l e 8 . 1
W
a r a o
A - H
G
1 9 5
4 , 6
6 ,
1 9 5 4 , 6
6 ,
1 , 6
2 9
1 8 , 1
7 0
2 6 9
1 , 1
3 6
5 , 1
0
c e n s /
L a y r i s s e
e t a l . 1 9 8 0 :
1 9 7
2 – 7
3
1 9 7 2 – 7
3
r e t r o
T a b l e 4
. 8
N
o r t h e r n T e r r i t o r y
A - H
G
1 9 5
8 – 6
0
1 9 5 8 – 6
0
1 7 , 4
6 9
5 2 , 4
0 7
2 8 5
7 , 9
6 8
5
p r o s p v i t a l
L a n c a s t e r J o n e s 1 9 6 1 ;
A b o r i g i n e s
r e g i s t
C r o t t y a n d W e b b 1 9 6 0
T i w i
A - H
G
1 9 5
2 – 6
1
1 9 5 2 – 6
1
N / A
7 , 2
4 3
1 5 0
N / A
5 , 1
0 , 1
5
p r o s p v i t a l
L a n c a s t e r J o n e s 1 9 6 3
r e g i s t
H
i w i
A - H
G
1 9 8
8 – 9
0
1 9 6 1 – 8
9
5 3 7
4 , 3
7 0
1 3 1
6 1 4
1
r e t r o
H i l l e t a l . 2 0 0 7
A
c h e ( s e t t l e d )
A - H
G
1 9 8
0 – 9
4
1 9 7 8 – 9
3
1 , 1
1 2
1 2 , 4
1 2
1 1 3
7 8 0
1
p r o s p
H i l l a n d
H u r t a d o
1 9 9 6
S w e d e n 1 7 5 1 – 5
9
H I S T
1 9 0 6
1 7 5 1 – 5
9
1 , 8
3 9 , 2
5 6
1 6 , 9
4 4 , 5
3 4
4 5 7 , 5
8 9
2 , 8
5 7 , 0
5 7
1
p a r i s h
H u m a n
M o r t a l i t y
r e c o r d
D a t a b a
s e :
w w w . m
o r t a l i t y . o r g
A
= A c c u l t u r a t e d ; H G = h u n t e r - g a t h e r e
r ; F H = f o r a g e r - h o r t i c u l t u r a l i s t ; H = h o r t i c u l t u r a l i s t ; T R A N S = t r a n s i t i o n a l ; H
I S T = h i s t o r i c a l .
PDR 33.2 Gurven-Kaplan-FINAL.indd 324 5/22/07 2:16:34 PM

8/8/2019 Longevity Among Hunter-Gatherers
http://slidepdf.com/reader/full/longevity-among-hunter-gatherers 5/46
M I C H A E L GU R V E N / H I L L A R D KA P L A N 325
adults are sparse among Machiguenga. The Aborigine data may suffer from
underreporting of infant deaths. The highest-quality data across the entire life
span exist for Hadza, Ache, !Kung, Hiwi, Tsimane, and Yanomamo Xilixana.These populations are used in focused analyses of mortality at older ages.
To illustrate patterns of mortality, we present age-specific survivor-
ship curves, l ( x ), and log mortality hazard rates, lnh x . We model each group’s
mortality using a Siler competing hazard model, chosen for its simplicity,
robustness, and the interpretability of its parameters (Siler 1979; Gage 1989,
1991; but see Wood et al. 2002). The Siler model includes three components
of mortality: declining mortality from birth through childhood, a constant
mortality hazard across the life span, and an increasing component in older
ages. Infant and child mortality are thus modeled with a negative Gompertz
function. The final component is the familiar Gompertz exponential, and theconstant term is the Makeham (1860) addition of age-independent mortality.
Our use of the Gompertz function is based on convenience and tradition.
Gompertz is not derived from first biological principles, although different
explanations have been proposed to produce Gompertz-like mortality (Ol-
shansky and Carnes 1997; Gavrilov and Gavrilova 2001). Other survival
models that show monotonically increasing mortality rates over time, such as
Weibull and Gamma, often explain data as accurately as Gompertz (Ricklefs
and Scheuerlein 2002; Wood et al. 1994).
The Siler hazard has the following functional form:
h x a b x a a b x ( ) exp( ) exp( )= − + +1 1 2 3 3 (1)
This is a five-parameter model. The parameter a1
describes the initial infant
mortality rate, and b1
describes the rate of mortality decline. The proportion
of deaths due to juvenile mortality is captured by the first component as
exp(–a1/b
1). The parameter a
2describes age-independent mortality, which is
usually interpreted as exogenous mortality due to environmental conditions.
The parameter a3is the initial adult mortality rate, and b
3 describes the rate of
mortality increase. Because the survivorship, l ( x ), is equal to the product of
the three survivorship components, the formula for survivorship at age x is:
l x a
bb x a x ( ) exp ( exp( )) exp( ) e= − −
⋅ − ⋅1
1
1 21 xxp ( exp( ))
a
bb x 3
3
31−
(2)
We estimate Siler parameters based on fits of (1) to the h( x ) values. In view of
the discrete nature of the age intervals, we assign the ages for the Siler model
to the midpoint between two successive age intervals. All estimation is done
using weighted nonlinear regression (PROC NONLIN) with SAS version 9.1,
where weights are assigned according to the number of age-specific risk years
for each population. Regression of log mortality hazards on age by population
is done using the generalized linear model (GLM) procedure in SAS.
PDR 33.2 Gurven-Kaplan-FINAL.indd 325 5/22/07 2:16:36 PM
8/8/2019 Longevity Among Hunter-Gatherers
http://slidepdf.com/reader/full/longevity-among-hunter-gatherers 6/46
326 LONGEV ITY AMONG HUNTER -GATHERERS
Results
Survivorship, mortality hazards, and post-reproductive life
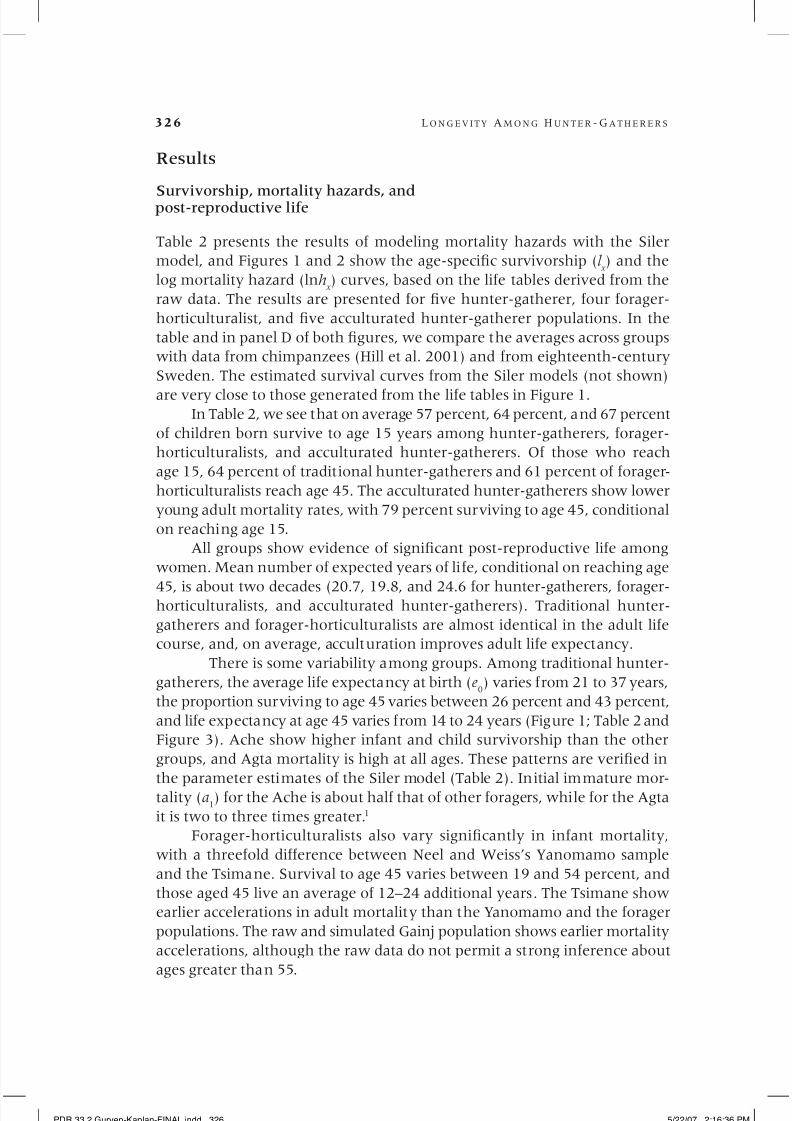
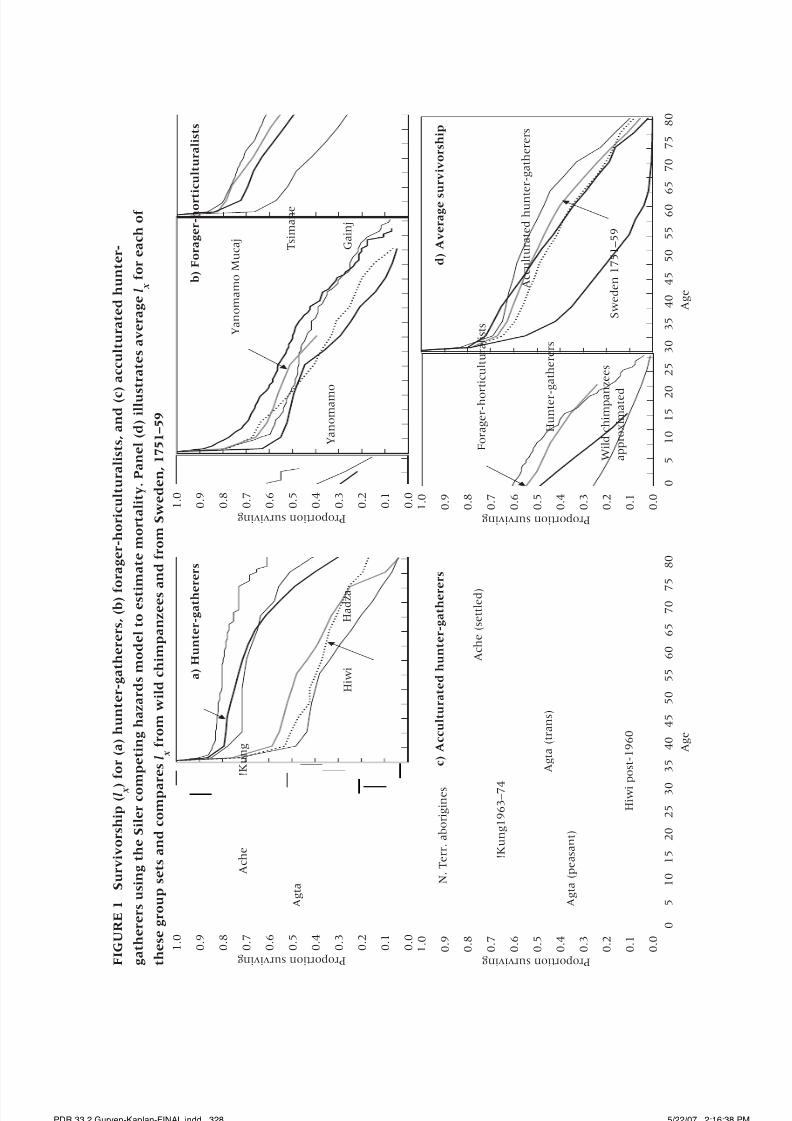
Table 2 presents the results of modeling mortality hazards with the Siler
model, and Figures 1 and 2 show the age-specific survivorship (l x ) and the
log mortality hazard (lnh x ) curves, based on the life tables derived from the
raw data. The results are presented for five hunter-gatherer, four forager-
horticulturalist, and five acculturated hunter-gatherer populations. In the
table and in panel D of both figures, we compare the averages across groups
with data from chimpanzees (Hill et al. 2001) and from eighteenth-century
Sweden. The estimated survival curves from the Siler models (not shown)
are very close to those generated from the life tables in Figure 1.In Table 2, we see that on average 57 percent, 64 percent, and 67 percent
of children born survive to age 15 years among hunter-gatherers, forager-
horticulturalists, and acculturated hunter-gatherers. Of those who reach
age 15, 64 percent of traditional hunter-gatherers and 61 percent of forager-
horticulturalists reach age 45. The acculturated hunter-gatherers show lower
young adult mortality rates, with 79 percent surviving to age 45, conditional
on reaching age 15.
All groups show evidence of significant post-reproductive life among
women. Mean number of expected years of life, conditional on reaching age
45, is about two decades (20.7, 19.8, and 24.6 for hunter-gatherers, forager-horticulturalists, and acculturated hunter-gatherers). Traditional hunter-
gatherers and forager-horticulturalists are almost identical in the adult life
course, and, on average, acculturation improves adult life expectancy.
There is some variability among groups. Among traditional hunter-
gatherers, the average life expectancy at birth (e0) varies from 21 to 37 years,
the proportion surviving to age 45 varies between 26 percent and 43 percent,
and life expectancy at age 45 varies from 14 to 24 years (Figure 1; Table 2 and
Figure 3). Ache show higher infant and child survivorship than the other
groups, and Agta mortality is high at all ages. These patterns are verified in
the parameter estimates of the Siler model (Table 2). Initial immature mor-tality (a1) for the Ache is about half that of other foragers, while for the Agta
it is two to three times greater.1
Forager-horticulturalists also vary significantly in infant mortality,
with a threefold difference between Neel and Weiss’s Yanomamo sample
and the Tsimane. Survival to age 45 varies between 19 and 54 percent, and
those aged 45 live an average of 12–24 additional years. The Tsimane show
earlier accelerations in adult mortality than the Yanomamo and the forager
populations. The raw and simulated Gainj population shows earlier mortality
accelerations, although the raw data do not permit a strong inference about
ages greater than 55.
PDR 33.2 Gurven-Kaplan-FINAL.indd 326 5/22/07 2:16:36 PM

8/8/2019 Longevity Among Hunter-Gatherers
http://slidepdf.com/reader/full/longevity-among-hunter-gatherers 7/46
8/8/2019 Longevity Among Hunter-Gatherers
http://slidepdf.com/reader/full/longevity-among-hunter-gatherers 8/46
0 . 0
0 . 1
0 . 2
0 . 3
0 . 4
0 . 5
0 . 6
0 . 7
0 . 8
0 . 9
1 . 0
P r o p o r t i o n s u r v i v i n g F I G U R E 1
S u r v i v o r s h i p ( l
x )
f o r ( a ) h u n t e r - g a t h e r e r s , ( b ) f o r a g e r - h o r i c u l t u r a l i s t s , a n d ( c ) a c c u l t u r a t e d h u n t e r -
g a t h e r e r s u s i n g t h e S i l e r c o m
p e t i n g h a z a r d s m o d e l t o e s t i m a t e m o r t a l i t y . P a n e l ( d ) i l l u s
t r a t e s a v e r a g e l
x
f o r e a c h o f
t h e s e g r o u p s e t s a n d c o m p a r e s l
x
f r o m w i l d c h i m p a n z e e s a n d f r o m S w e d e n , 1 7 5 1 – 5 9
H a d z a
H i w i
A c h e
A g t a
! K u n g
a ) H u n t e r - g a t h e
r e r s
0 . 0
0 . 1
0 . 2
0 . 3
0 . 4
0 . 5
0 . 6
0 . 7
0 . 8
0 . 9
1 . 0
P r o p o r t i o n s u r v i v i n g
Y a n o m a m o M u c a j
G a i n j
T s i m a n e
Y a n o m a m o
b ) F o r a g e r - h o r t i c u l t u r a l i s t s
0
5
1 0
1 5
2 0
2 5 3 0
3 5
4 0
4 5
5 0
5 5
6 0
6 5
7 0 7
5
8 0
0 . 0
0 . 1
0 . 2
0 . 3
0 . 4
0 . 5
0 . 6
0 . 7
0 . 8
0 . 9
1 . 0
P r o p o r t i o n s u r v i v i n g
A g e
N .
T e r r . a b o r i g i n e s
H i w i p o s t - 1 9 6 0
A c h e ( s e t t l e d )
A g t a ( p e a s a n t )
! K u n g 1 9 6 3 – 7 4
c ) A c c u l t u r a t e d h u n t e r - g a t h e r e r s
0
5
1 0
1 5 2 0
2 5
3 0
3 5
4 0
4 5
5 0
5 5
6 0
6 5
7 0
7 5
8 0
0 . 0
0 . 1
0 . 2
0 . 3
0 . 4
0 . 5
0 . 6
0 . 7
0 . 8
0 . 9
1 . 0
P r o p o r t i o n s u r v i v i n g
A g e
S w e d e n 1 7 5 1 – 5
9
d ) A v e r a g e s u r v i v o r s h i p
A g t a ( t r a n s )
H u n t e r - g a t h e r e r s
F o r a g e r - h o r t i c u l t u r a l i s t s
A c c u l t u r a t e d h u n t
e r - g a t h e r e r s
W i l d c h i m p a n
z e e s
a p p r o x i m a t e d
PDR 33.2 Gurven-Kaplan-FINAL.indd 328 5/22/07 2:16:38 PM
8/8/2019 Longevity Among Hunter-Gatherers
http://slidepdf.com/reader/full/longevity-among-hunter-gatherers 9/46
– 6 . 0
– 5 . 0
– 4 . 0
– 3 . 0
– 2 . 0
– 1 . 0
0 . 0
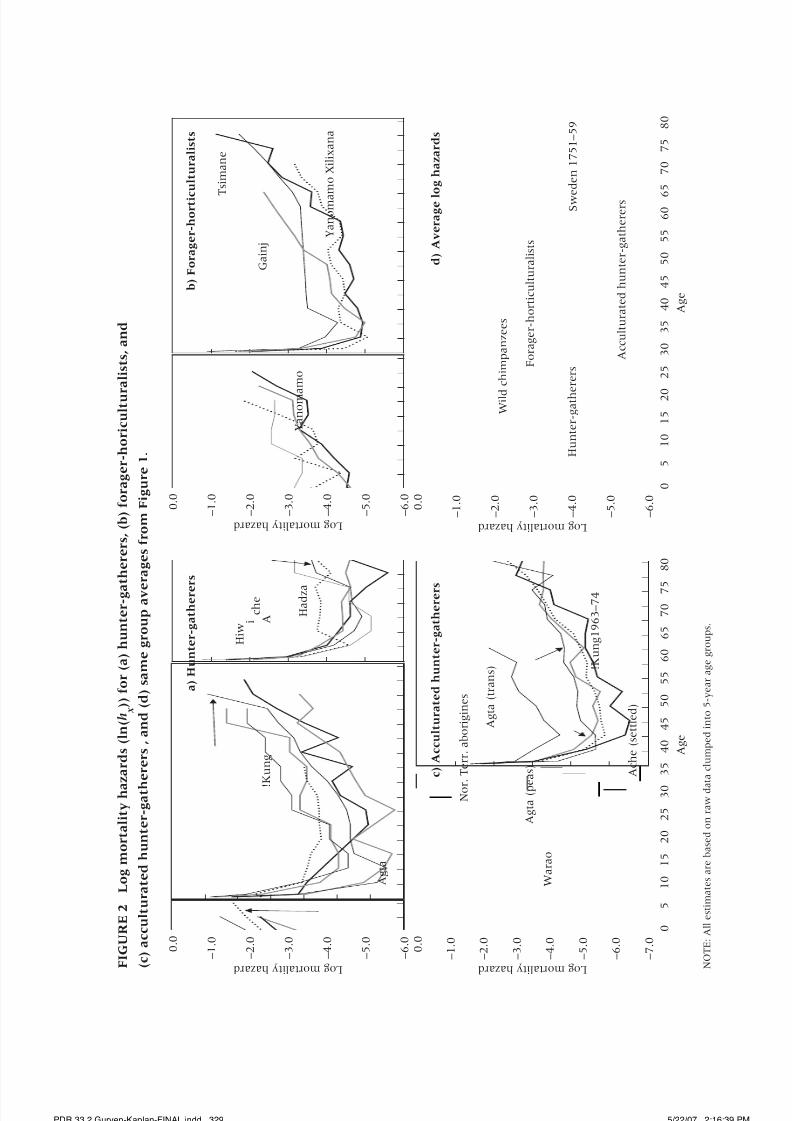
L o g m o r t a l i t y h a z a r d F I G U R E 2
L o g m o r t a l i t y h a z a r d s ( l n ( h
x ) ) f o r ( a ) h u n t e r - g a
t h e r e r s ,
( b ) f o r a g e r - h o r i c u l t u r
a l i s t s , a n d
( c ) a c c u l t u r a t e d h u n t e r - g a t h
e r e r s , a n d ( d ) s a m e g r o u p a v e
r a g e s f r o m F
i g u r e 1 .
H a d z a
H i w i A
c h e
A g t a
! K u n g
a ) H u n t e r - g a t h e r e
r s
– 6 . 0
– 5 . 0
– 4 . 0
– 3 . 0
– 2 . 0
– 1 . 0
0 . 0
L o g m o r t a l i t y h a z a r d
Y a n o m a m o
X i l i x a n a
G a i n
j
T s i m a n e
Y a n o m a
m o
b ) F o r a g e r - h o r t i c
u l t u r a l i s t s
0
5
1 0
1 5
2 0
2 5
3 0
3 5
4 0
4 5
5 0
5 5
6 0
6 5
7 0 7 5
8 0
– 7 . 0
– 6 . 0
– 5 . 0
– 4 . 0
– 3 . 0
– 2 . 0
– 1 . 0
0 . 0
L o g m o r t a l i t y h a z a r d
A g e
N o r .
T e r r . a b o r i g i n e s
W a r a o
A c h e
( s e t t l e d )
A g t a
( p e
a s )
! K u n g 1
9 6 3
– 7 4
c ) A c c u l t u r a t e d h u n t e r - g a t h e r e r s
0
5
1 0
1 5 2 0
2 5
3 0
3 5
4 0
4 5
5 0
5 5
6 0 6
5
7 0
7 5
8 0
– 6 . 0
– 5 . 0
– 4 . 0
– 3 . 0
– 2 . 0
– 1 . 0
0 . 0
L o g m o r t a l i t y h a z a r d
A g e
S w e d e n
1 7 5 1
– 5 9
d ) A v e r a g e l o g h a z a r d s
A g t a
( t r a n s )
N O T E :
A l l e s t i m a t e s a r e
b a s e d o n r a w
d a t a c l u m p e d
i n t o 5
- y e a r a g e g r o u p s .
H u n
t e r - g a t h e r e r s F
o r a g e r -
h o r t i c u
l t u r a l i s t s
A c c u
l t u r a t e d
h u n
t e r - g a t h e r e r s
W i l d
c h i m p a n z e e s
PDR 33.2 Gurven-Kaplan-FINAL.indd 329 5/22/07 2:16:39 PM
8/8/2019 Longevity Among Hunter-Gatherers
http://slidepdf.com/reader/full/longevity-among-hunter-gatherers 10/46
330 LONGEV ITY AMONG HUNTER -GATHERERS
Acculturated foragers vary most in their likelihood of reaching age 45
(ranging from 26 percent among the peasant Agta population to about 67
percent among sedentary !Kung, Aborigines, and Ache), but show a rangeof 13–27 additional years of life upon reaching age 45, similar to the range
for less acculturated foragers and forager-horticulturalists. Adult mortality
is also highly variable. For example, life expectancy at age 15 is 48 years for
Aborigines, 52 and 51 for settled Ache and !Kung, yet 31 and 36 for peas-
ant and transitional Agta. Hiwi show similarly low life expectancy. The ac-
culturated category shows a range of mortality experiences associated with
acculturation.
The rate at which mortality rates double is a measure of the senescence
rate. Finch et al. (1990) report mortality rate doubling times (MRDTs) of 7–8
years for a variety of recent human populations with a wide range in overallmortality.2 Despite the overall high mortality of hunter-gatherer populations,
we find that the adult mortality rate also doubles in 7 years among Ache and
9 years among !Kung (Table 2). Hadza MRDT of 6 years is just outside the
reported range of other human populations. The Hiwi MRDT shows rapid
senescence (2.8 years). Among the Agta, where high adult mortality is placed
in the a3
rather than a2, senescence appears very slow for the forager and
peasant samples (MRDT=18, 12).
Several forager-horticulturalists and acculturated foragers show a simi-
lar MRDT of 8 years, including two Yanomamo samples and settled Ache. The
sample of forager-horticulturalists shows MRDTs within the range of 6–12
years. The acculturated foragers show a MRDT range of 7–11 years. Only the
two acculturated Agta samples deviate from this range. The highest-quality
data mostly show a MRDT range of 6–10 years for our study groups (Table 2,
groups not in italics). Combining all groups within each of the three subcat-
egories in the same Siler model, we find a more restricted range for MRDT
of 8–9 years (Table 2).
Among groups, differences in early juvenile mortality largely explain
the differences in overall mortality. Infant and child mortality varies widely
among small-scale traditional populations. Indeed, a linear regression of e1
on the infant mortality rate using the full sample of populations shows that
56 percent of the variation in e1 is explained by differences in IMR. IMRalso predicts 52 percent of the variation in age-independent mortality, a
2.
The largest departure from mortality hazards at later ages appears among
the Agta, whose mortality data we earlier described as being circumspect
at later ages.
In spite of this variation, a clear premodern human pattern emerges.
Age profiles of mortality risk over the life span are remarkably similar. The
mortality hazard has slowed to 0.01 by age 10, doubled to about 0.02 by age
40, doubled yet again before age 60, and again by age 70. Low mortality there-
fore persists until about age 40, when mortality acceleration becomes evident.
PDR 33.2 Gurven-Kaplan-FINAL.indd 330 5/22/07 2:16:39 PM

8/8/2019 Longevity Among Hunter-Gatherers
http://slidepdf.com/reader/full/longevity-among-hunter-gatherers 11/46
M I C H A E L GU R V E N / H I L L A R D KA P L A N 331
The adult mortality rate doubles every 7–10 years. The results obtained from
these groups are similar to those from Sweden in 1751 (see panel d in Figures
1 and 2), where mean life expectancy was 34 years and e45 was an additional20 years (Berkeley Mortality Database). For groups living without access to
modern health care, public sanitation, immunizations, or adequate and pre-
dictable food supply, it seems that still at least one-fourth of the population
is likely to live as grandparents for 15–20 years.
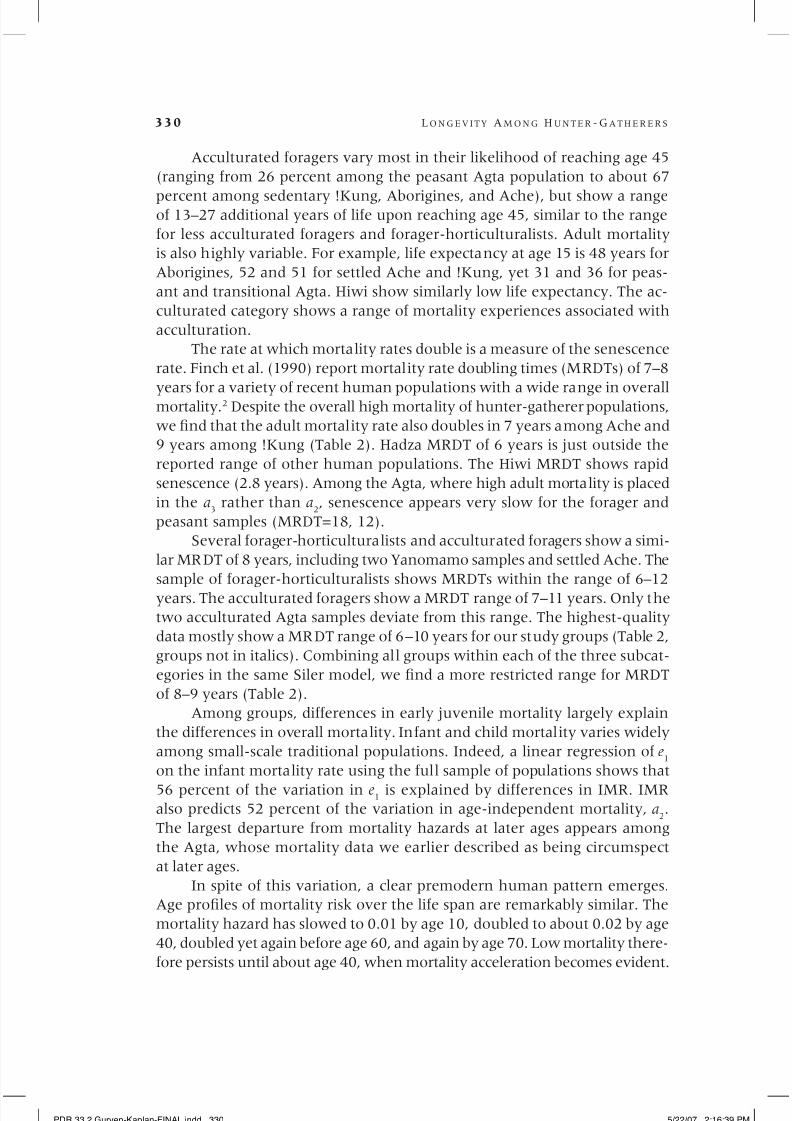
Figure 3 shows expected future years of life remaining (e x ), conditional
on living to each age, for the human groups with the most reliable data and
for wild and captive chimpanzees. While there is significant variation across
human groups in life expectancy at early ages, there is significant conver-
gence after about age 30. With the exception of the Hiwi, who have over 10
fewer years remaining during early ages and over 5 fewer years remainingduring adulthood, and of the Hadza, whose life expectancy at each age is
about 2 years longer than the rest at most adult ages, all other groups, in-
cluding eighteenth-century Sweden, are hardly distinguishable from one
another. Figure 3 also shows that at age 40, the expected age at death is
about 63–66 (i.e., 23–26 additional expected years of life), whereas by age
65, expected age at death is only about 70–76 years of age. By age 65, death
rates become very high.
Chimpanzees show a very different life course, with higher mortality
and lower age-specific survival, especially during adulthood. While chimpan-
zee MRDT values are similar to those of human foragers, the onset of mortal-
ity rate doubling occurs at least ten years earlier among chimpanzees.
It is of interest to note how the protected environment of captivity af-
fects chimpanzee mortality profiles (Dyke et al. 1995). Captivity raises infant
and juvenile survival greatly, from 37 percent surviving to age 15 in the wild
to 64 percent in captivity, with the latter being similar to the human aver-
ages. However, while the proportion surviving to age 45 increases sevenfold,
from 3 percent in the wild to 20 percent with captivity, it is still just half as
high as for humans living in premodern conditions. The difference between
chimpanzees and humans after age 45 is even greater, with an expected ad-
ditional life span for chimpanzees in captivity of only 7 years, about a third
of the human expectation. It appears that chimpanzees age much faster thanhumans and die earlier, even in protected environments.
Nonlinearity in rates of senescence
Senescence is usually defined as an increase in the endogenous rate of mortal-
ity (Finch, Pike, and Whitten 1990; Rose 1991). In many populations mortal-
ity reaches its minimum at reproductive maturity and increases thereafter at
a constant proportional (Gompertz) rate, although noticeable decreases in
vital functions do not occur until at least age 30 (Shock 1981; Weale 2004).
PDR 33.2 Gurven-Kaplan-FINAL.indd 331 5/22/07 2:16:39 PM
8/8/2019 Longevity Among Hunter-Gatherers
http://slidepdf.com/reader/full/longevity-among-hunter-gatherers 12/46
332 LONGEV ITY AMONG HUNTER -GATHERERS
The demographic literature often varies on the starting point for expected
mortality increases in the Gompertz relationship (for examples see Olshansky
and Carnes 1997). Here we examine whether traditional human populations
reveal a constant proportional increase in mortality rates. Our goal is to de-
termine whether an extended period of non-senescence during adulthoodplays a role in the exceptional longevity of our species.
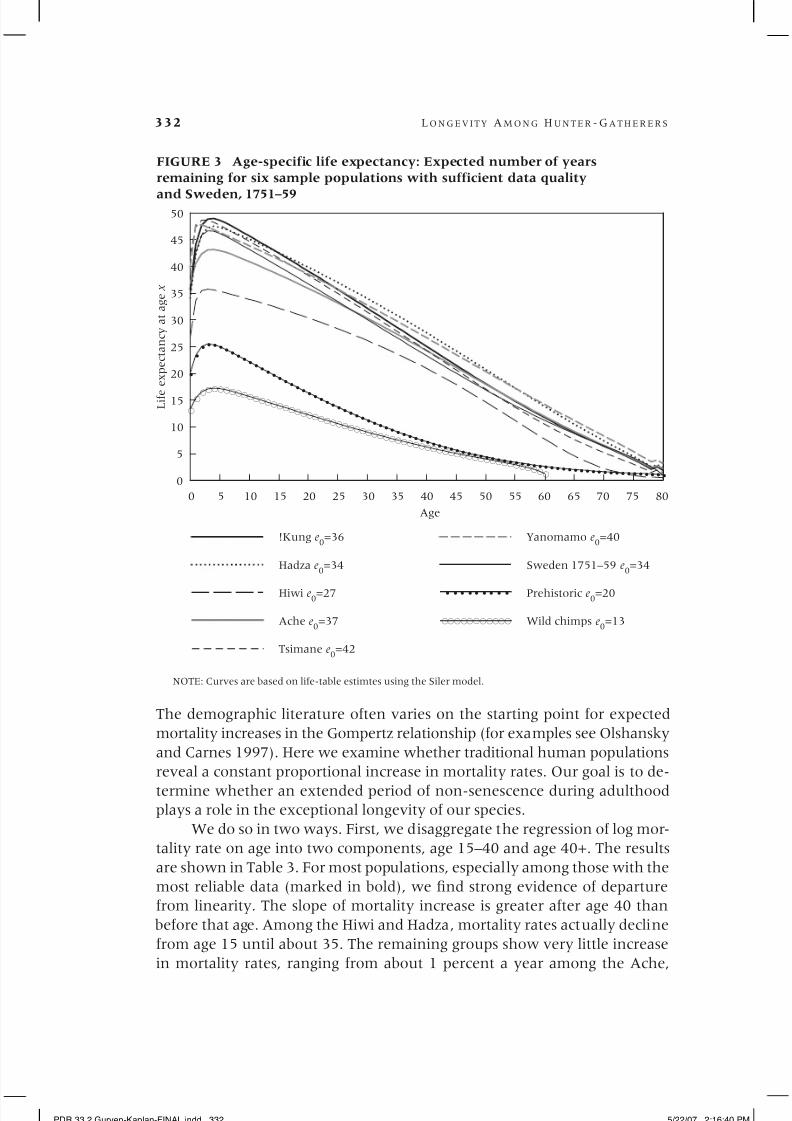
We do so in two ways. First, we disaggregate the regression of log mor-
tality rate on age into two components, age 15–40 and age 40+. The results
are shown in Table 3. For most populations, especially among those with the
most reliable data (marked in bold), we find strong evidence of departure
from linearity. The slope of mortality increase is greater after age 40 than
before that age. Among the Hiwi and Hadza, mortality rates actually decline
from age 15 until about 35. The remaining groups show very little increase
in mortality rates, ranging from about 1 percent a year among the Ache,
!Kung e0=36
Hadza e0=34
Hiwi e0=27
Ache e0=37
Tsimane e0=42
Yanomamo e0=40
Sweden 1751–59 e0=34
X Prehistoric e0=20
É Wild chimps e0=13
FIGURE 3 Age-specific life expectancy: Expected number of years
remaining for six sample populations with sufficient data quality
and Sweden, 1751–59
NOTE: Curves are based on life-table estimtes using the Siler model.
ÉÉÉÉ ÉÉÉ ÉÉ É
XXXXXXX X
X
X
XXXXXXX
XX
XX
XX
XXX
X
XXXXXXXXXXXXXXXXXXXXXXXXXXXXXXXXXXXXXXXXXXXXXXXXXXXXXXXXXXXXXX
É
ÉÉ
ÉÉÉÉÉÉÉÉÉÉÉÉÉÉÉÉÉÉÉÉÉÉÉÉÉÉÉÉÉÉÉÉÉÉÉÉÉÉÉÉÉÉÉÉÉÉÉÉÉÉÉÉÉÉÉÉÉÉ
0 5 10 15 20 25 30 35 40 45 50 55 60 65 70 75 80
0
5
10
15
20
25
30
35
40
45
50
L i f e
e x p e c t a n c y
a t a g e
x
Age
PDR 33.2 Gurven-Kaplan-FINAL.indd 332 5/22/07 2:16:40 PM
8/8/2019 Longevity Among Hunter-Gatherers
http://slidepdf.com/reader/full/longevity-among-hunter-gatherers 13/46
M I C H A E L GU R V E N / H I L L A R D KA P L A N 333
Yanomamo, and Tsimane to about 4 percent a year among the !Kung. Only
the Agta, whose data contain less reliable age control, show greater increases
over the 15–40 age range. This may be artifactual, or real and due to high
adult mortality. Under normal circumstances, however, traditional humans
experience about two decades of prime adulthood in which mortality rates
hardly change, then experience a sharply increasing mortality hazard in
middle and old age.3 A distinctive feature of human mortality profiles is a
lengthy period of prime adulthood, delayed senescent decline, and extendedlife span.
Modal ages of adult death
The effective end of the human life course under traditional conditions seems
to be just after age 70 years. Following the lead of Kannisto (2001) and Lexis
(1878), we evaluate the modal ages of “normal” adult death and the vari-
ance around these modes to examine the extent of stability in adult life spans
among and within our study populations (see Figure 4 and Table 4). Figure
TABLE 3 Model of log mortality hazard lnh( x ) by age
Age 15–40 Age 40+
Group ´ α p exp(β) R 2
MRDT ´ α p exp(β) R 2
MRDTAche 0.0006 0.0113 0.00 1,216.0 0.0564 ** 0.0150 0.91 12.3
Hiwi –0.0157 0.0238 0.30 0.0812 * 0.0137 0.72 8.5
Hadza –0.0010 0.0081 0.00 0.0621 ** 0.0105 0.89 11.2
!Kung 0.0423 * 0.0076 0.85 16.4 0.0696 ** 0.0106 0.68 10.0
Agta‡ 0.0834 * 0.0064 0.80 5.4 0.0330 # 0.0376 0.61 21.0
Average hunter-gatherer 0.0219 0.0115 31.7 0.0604 0.0175 11.5
Yanomamo-Mucaj 0.0065 0.0125 0.12 106.0 0.0535 *** 0.0112 0.96 13.0
Tsimane 0.0136 0.0088 0.50 51.1 0.0856 *** 0.0097 0.92 8.1
Yanomamo‡ 0.0052 0.0301 0.99 134.1 0.0487 *** 0.0263 0.92 14.2
Gainj‡ 0.0499 ** 0.0111 0.91 13.9 0.0535 *** 0.0422 0.99 13.0
Average forager-horticulturalist 0.0188 0.0156 36.9 0.0603 0.0224 11.5
!Kung 1963–74 0.0805 + 0.0011 0.91 8.6 0.0882 ** 0.0044 0.80 7.9
Ache reservation 0.0212 0.0018 0.13 32.7 0.0672 *** 0.0098 0.99 10.3
Northern TerritoryAborigines 0.0301 * 0.0037 0.86 23.1 0.0610 ** 0.0038 0.87 11.4
Agta transition 0.0490 * 0.0065 0.75 14.1 0.1110 * 0.0112 0.82 6.2
Agta peasant‡ 0.0844 * 0.0050 0.86 8.2 0.0463 ** 0.0340 0.91 15.0
Warao 0.0055 0.0119 0.09 126.3 N/A
Average
acculturated HG 0.0451 0.0050 15.4 0.0747 0.0126 9.3
Overall average 0.0304 0.0100 22.8 0.0655 0.0172 10.6
***p<0.0001; **p<0.001; *p<0.01;+p<0.05, #p<0.10MRDT is mortality rate doubling time, defined here as ln2/ ´ αIn the Gompertz model, ln[h( x )]= β + ´ α* x ‡Parameter estimates for 40+ regression are based on small samples or are affected by age estimation problems (see text).
PDR 33.2 Gurven-Kaplan-FINAL.indd 333 5/22/07 2:16:41 PM
8/8/2019 Longevity Among Hunter-Gatherers
http://slidepdf.com/reader/full/longevity-among-hunter-gatherers 14/46
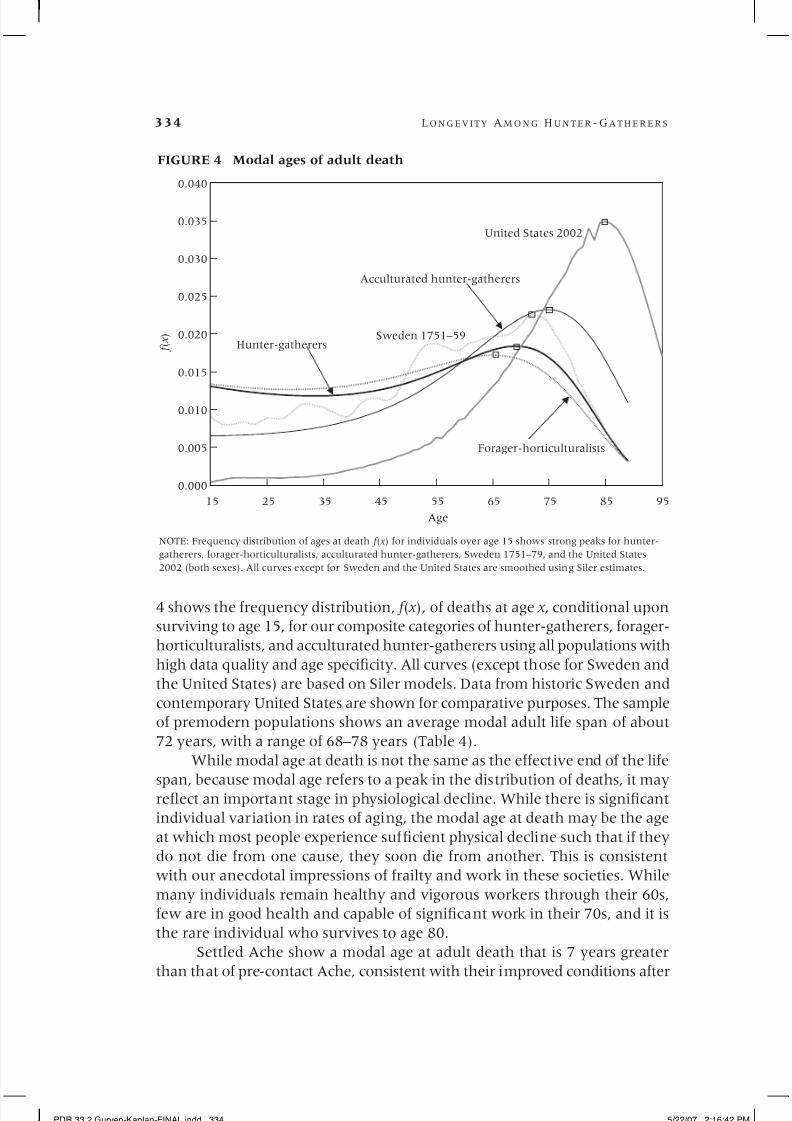
334 LONGEV ITY AMONG HUNTER -GATHERERS
4 shows the frequency distribution, f ( x ), of deaths at age x , conditional upon
surviving to age 15, for our composite categories of hunter-gatherers, forager-
horticulturalists, and acculturated hunter-gatherers using all populations with
high data quality and age specificity. All curves (except those for Sweden and
the United States) are based on Siler models. Data from historic Sweden and
contemporary United States are shown for comparative purposes. The sample
of premodern populations shows an average modal adult life span of about
72 years, with a range of 68–78 years (Table 4).
While modal age at death is not the same as the effective end of the life
span, because modal age refers to a peak in the distribution of deaths, it mayreflect an important stage in physiological decline. While there is significant
individual variation in rates of aging, the modal age at death may be the age
at which most people experience sufficient physical decline such that if they
do not die from one cause, they soon die from another. This is consistent
with our anecdotal impressions of frailty and work in these societies. While
many individuals remain healthy and vigorous workers through their 60s,
few are in good health and capable of significant work in their 70s, and it is
the rare individual who survives to age 80.
Settled Ache show a modal age at adult death that is 7 years greater
than that of pre-contact Ache, consistent with their improved conditions after
United States 2002
FIGURE 4 Modal ages of adult death
NOTE: Frequency distribution of ages at death f ( x ) for individuals over age 15 shows strong peaks for hunter-
gatherers, forager-horticulturalists, acculturated hunter-gatherers, Sweden 1751–79, and the United States
2002 (both sexes). All curves except for Sweden and the United States are smoothed using Siler estimates.
15 25 35 45 55 65 75 85 95
0.000
0.005
0.010
0.015
0.020
0.025
0.030
0.035
0.040
Age
Hunter-gatherers
Acculturated hunter-gatherers
Forager-horticulturalists
Sweden 1751–59 f ( x )
PDR 33.2 Gurven-Kaplan-FINAL.indd 334 5/22/07 2:16:42 PM

8/8/2019 Longevity Among Hunter-Gatherers
http://slidepdf.com/reader/full/longevity-among-hunter-gatherers 15/46
M I C H A E L GU R V E N / H I L L A R D KA P L A N 335
settlement. There is much greater variability in the ages of adult death within
each of these populations than typically found in modern industrial popula-
tions (Cheung et al. 2005), in part because of the higher age-independent
mortality (a2) among the Ache. Lexis (1878) considered such mortality to
be different from the “normal” course of aging. For example, re-estimating
Hadza mortality without an age-independent mortality component (a2=0)
increases the mode from 76 to 78, and decreases the standard deviation
around the mode from 6.0 to 5.1. The modes derived from the Siler model
are therefore less peaked, accounting for less than 3 percent of adult deaths
within the year marking the mode. Of the three study population groups,
acculturated hunter-gatherers show the greatest proportion of deaths after
age 55, possibly indicating that as some causes of death (such as violence) are
reduced, age-related causes of death become more substantial, leading to a
greater share of deaths around the mode (Figure 4).
Variation in mortality rates and the effects of changingconditions
The relationship between juvenile and adult mortality rates across populations. Some
historical cohort evidence indicates that high infant and child mortality have
substantial impact on survivorship later in the life span (Costa 2000; Wilmoth,
Vallin, and Caselli 1990). Finch and Crimmins (2004) show that the level
of child mortality explains 85 percent of the variance in old-age mortality
in cohorts in Sweden and the United States, and that early mortality has a
threefold greater predictive effect on old-age mortality for those cohorts than
TABLE 4 Modal ages at death
Percent of Percent of
Modal age Standard adult deaths adult deaths atPopulation at death deviation at mode year and above mode
Hadza 76 6.0 2.5 24.1
Hiwi 68 3.3 3.3 17.9
Ache 71 7.7 2.1 24.5
Yanomamo Xilixana 75 7.3 1.9 22.8
Tsimane 78 5.9 3.0 30.5
!Kung 1963–74 74 7.8 2.7 35.4
Ache reservation 78 5.9 3.0 30.5
Aborigines 74 7.8 2.7 35.4
Wild chimpanzees 15 16.8 4.6 100.0
Captive chimpanzees 42 7.5 2.6 38.5
Sweden 1751–59 72 7.4 2.3 24.3
United States 2002 85 1.7 3.5 35.3
NOTE: The extent of variation around the mode is usually defined as four standard deviation units around themode (Cheung et al. 2005).
PDR 33.2 Gurven-Kaplan-FINAL.indd 335 5/22/07 2:16:42 PM
8/8/2019 Longevity Among Hunter-Gatherers
http://slidepdf.com/reader/full/longevity-among-hunter-gatherers 16/46
336 LONGEV ITY AMONG HUNTER -GATHERERS
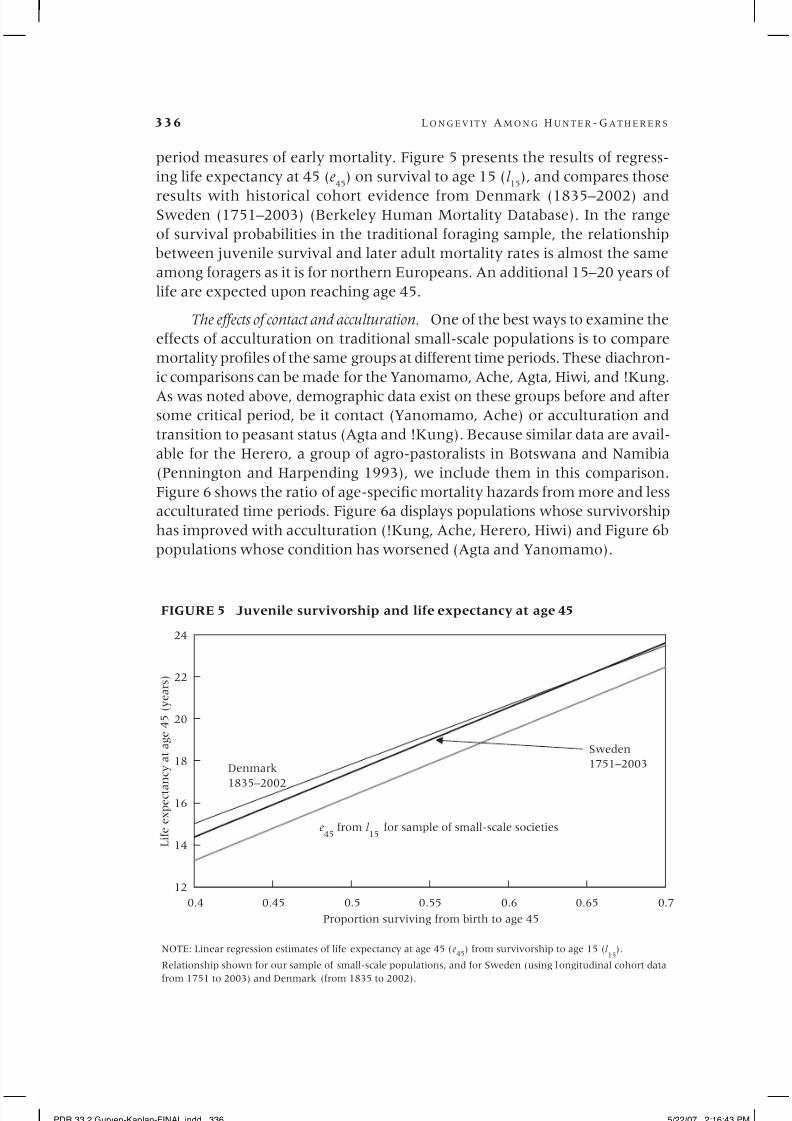
period measures of early mortality. Figure 5 presents the results of regress-
ing life expectancy at 45 (e45
) on survival to age 15 (l 15
), and compares those
results with historical cohort evidence from Denmark (1835–2002) andSweden (1751–2003) (Berkeley Human Mortality Database). In the range
of survival probabilities in the traditional foraging sample, the relationship
between juvenile survival and later adult mortality rates is almost the same
among foragers as it is for northern Europeans. An additional 15–20 years of
life are expected upon reaching age 45.
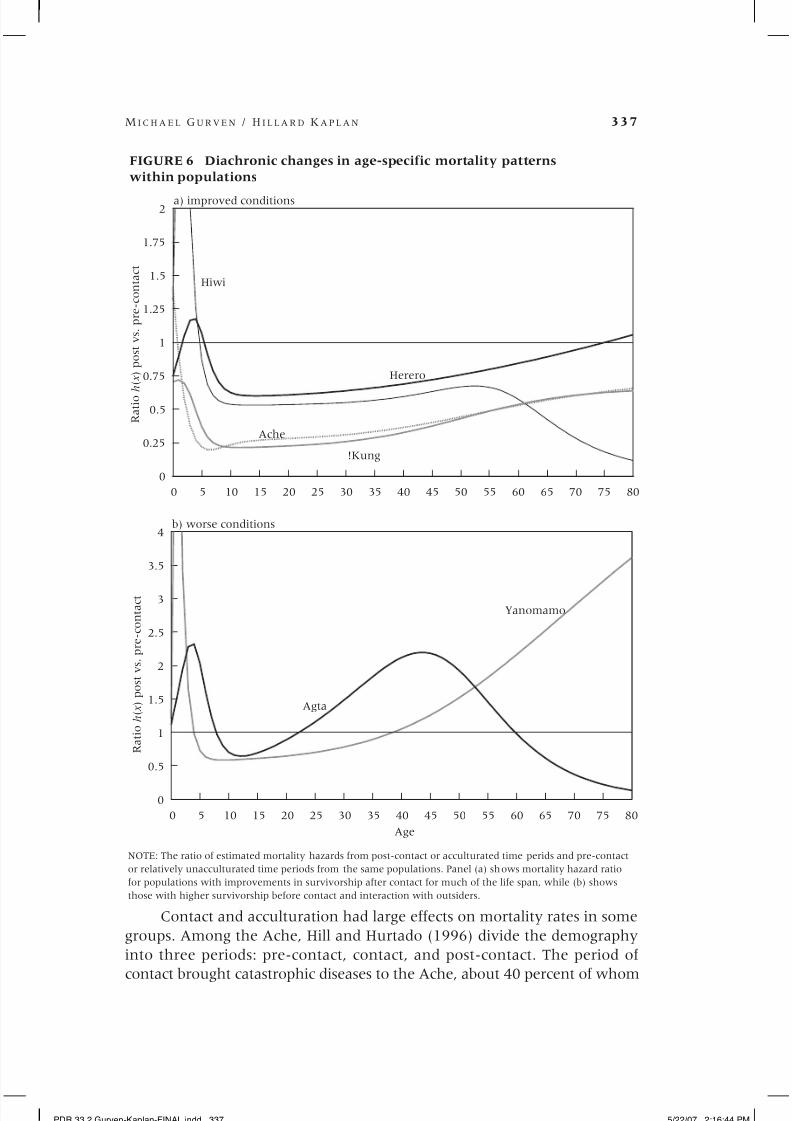
The effects of contact and acculturation. One of the best ways to examine the
effects of acculturation on traditional small-scale populations is to compare
mortality profiles of the same groups at different time periods. These diachron-
ic comparisons can be made for the Yanomamo, Ache, Agta, Hiwi, and !Kung.
As was noted above, demographic data exist on these groups before and aftersome critical period, be it contact (Yanomamo, Ache) or acculturation and
transition to peasant status (Agta and !Kung). Because similar data are avail-
able for the Herero, a group of agro-pastoralists in Botswana and Namibia
(Pennington and Harpending 1993), we include them in this comparison.
Figure 6 shows the ratio of age-specific mortality hazards from more and less
acculturated time periods. Figure 6a displays populations whose survivorship
has improved with acculturation (!Kung, Ache, Herero, Hiwi) and Figure 6b
populations whose condition has worsened (Agta and Yanomamo).
0.4 0.45 0.5 0.55 0.6 0.65 0.7
12
14
16
18
20
22
24
L i f e e x p e c t a n c y a t a g e 4 5 ( y e a r s )
Proportion surviving from birth to age 45
FIGURE 5 Juvenile survivorship and life expectancy at age 45
NOTE: Linear regression estimates of life expectancy at age 45 (e45
) from survivorship to age 15 (l 15
).
Relationship shown for our sample of small-scale populations, and for Sweden (using longitudinal cohort data
from 1751 to 2003) and Denmark (from 1835 to 2002).
Denmark
1835–2002
Sweden
1751–2003
e45
from l 15
for sample of small-scale societies
PDR 33.2 Gurven-Kaplan-FINAL.indd 336 5/22/07 2:16:43 PM
8/8/2019 Longevity Among Hunter-Gatherers
http://slidepdf.com/reader/full/longevity-among-hunter-gatherers 17/46
M I C H A E L GU R V E N / H I L L A R D KA P L A N 337
Contact and acculturation had large effects on mortality rates in some
groups. Among the Ache, Hill and Hurtado (1996) divide the demography
into three periods: pre-contact, contact, and post-contact. The period of
contact brought catastrophic diseases to the Ache, about 40 percent of whom
0 5 10 15 20 25 30 35 40 45 50 55 60 65 70 75 80
0
0.25
0.5
0.75
1
1.25
1.5
1.75
2
Ache
!Kung
Herero
Hiwi
FIGURE 6 Diachronic changes in age-specific mortality patterns
within populations
a) improved conditions
0 5 10 15 20 25 30 35 40 45 50 55 60 65 70 75 80
0
0.5
1
1.5
2
2.5
3
3.5
4
Age
Agta
Yanomamo
b) worse conditions
NOTE: The ratio of estimated mortality hazards from post-contact or acculturated time perids and pre-contact
or relatively unacculturated time periods from the same populations. Panel (a) shows mortality hazard ratio
for populations with improvements in survivorship after contact for much of the life span, while (b) shows
those with higher survivorship before contact and interaction with outsiders.
R a t i o
h ( x ) p o s t v s . p r e - c o n t a c t
R a t i o
h ( x ) p o s t v s . p r e - c o n t a c t
PDR 33.2 Gurven-Kaplan-FINAL.indd 337 5/22/07 2:16:44 PM

8/8/2019 Longevity Among Hunter-Gatherers
http://slidepdf.com/reader/full/longevity-among-hunter-gatherers 18/46
338 LONGEV ITY AMONG HUNTER -GATHERERS
died less than a decade after contact. Here we compare the post-contact with
the pre-contact period. After a period of contact, mortality increased dur-
ing infancy but diminished to about one-fourth to one-third of pre-contactlevels for late childhood and adulthood. The effects of improved conditions
are greater at younger ages and gradually decline with age. Reduced mortal-
ity among settled Ache is largely due to reductions in homicide and forest-
related accidents attendant on missionary influence and state intervention
(Hill and Hurtado 1996). Medical attention has also helped lower mortality
among Ache.
A similar pattern is found for the !Kung, with the exception that
survival improves at all ages. Although settled !Kung frequently complain
about meat scarcity and changing norms of resource distribution, they also
benefit from increased access to milk, protein-rich weaning foods, and amore predictable diet through greater association with cattleposts and receipt
of government rations (Harpending and Wandsnider 1982). It is possible,
however, that we have overestimated the effects of acculturation on !Kung
survivorship because of gaps in the prospective life table created by Howell
(1979: Table 4.6).4
Among the Hiwi, contact has greatly increased infant mortality, but
decreased mortality after infancy by about a half; data on the very old are
insufficient to ascertain what happens after age 60. Among the Herero, there
is a small increase in childhood mortality, but an improvement at older ages.
The initially higher level of survival among the Herero probably accounts for
the smaller effect of acculturation on mortality rates.
Two groups appear to show deleterious effects of contact. Early child
and adult mortality are much higher among “acculturated peasant” Agta and
Xilixana Yanomamo. Infant mortality may be buffered by protective effects
of breastfeeding, and so post-weaning mortality seems to worsen more in
acculturated settings among both Agta and Yanomamo. Peasant Agta are
landless agriculturalists living in more populated and degraded environ-
ments with few foraging options, and they no longer maintain close trading
relationships with nearby horticulturalists (Early and Headland 1998). Early
and Headland suggest that cumulative effects of malnutrition and infectious
diseases such as measles have increased child mortality during the peasantphase, and they verify this through comparison of postneonatal and neona-
tal mortality rates. Additionally, malaria, tuberculosis, and other infectious
diseases were believed to be largely absent in the forager phase among both
Agta and Yanomamo but have reached epidemic proportions in the past
30 years. Lower adult mortality among Yanomamo may be due to reduced
warfare and homicide in recent years (Early and Peters 2000). It is unclear
why the negative impact of infectious disease appears to affect adults over
age 40 among Yanomamo whereas it affects reproductive-age adults among
Agta. One possibility is that susceptibility attributable to differential prior
exposure may vary by age groups.
PDR 33.2 Gurven-Kaplan-FINAL.indd 338 5/22/07 2:16:44 PM
8/8/2019 Longevity Among Hunter-Gatherers
http://slidepdf.com/reader/full/longevity-among-hunter-gatherers 19/46
M I C H A E L GU R V E N / H I L L A R D KA P L A N 339
Studies that have focused on the effects of sedentism on mortality show
a general decrease in child mortality, consistent with our description of the
experience of !Kung, Herero, and Ache. These include the Ghanzi !Kung(Harpending and Wandsnider 1982), Kutchin Athapaskans (Roth 1981),
Turkana pastoralists (Brainard 1986), and Nunamiut (Binford and Chasko
1976). On the other hand, a slight increase in child mortality was observed
among the Adavasi Juang agriculturalists of India (Roth and Ray 1985). Fer-
tility increases among members of all of these populations, and often does so
before a noticeable decline in mortality.
Acculturation in the past several decades is likely to be very different
from the transitions to sedentary agricultural or peasant life in the more re-
mote past. Even when foragers become the new underclass of national society
and foraging behavior becomes rarer, recent post-contact recovery periodsare often accompanied by immunization campaigns and public health and
sanitation measures that can substantially improve survivorship. It is likely
that a worsening of physical health, or at best a lack of improvement, occurs
when these benefits are absent or unavailable.
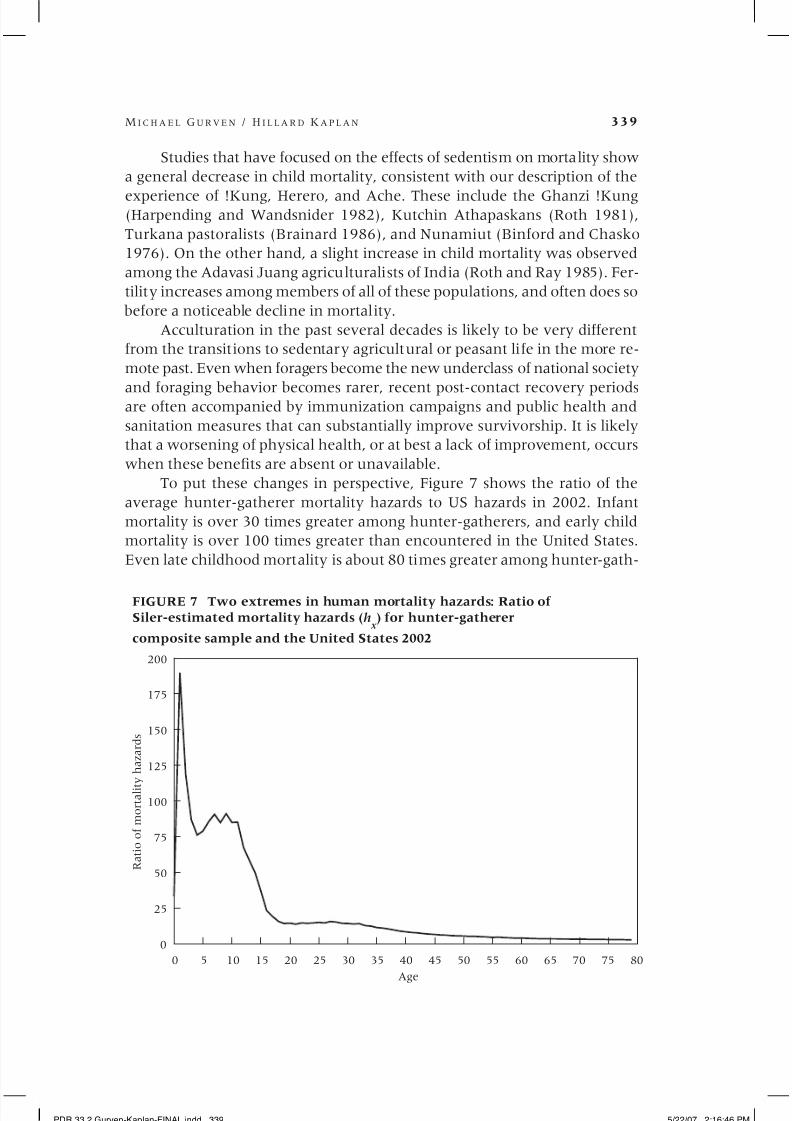
To put these changes in perspective, Figure 7 shows the ratio of the
average hunter-gatherer mortality hazards to US hazards in 2002. Infant
mortality is over 30 times greater among hunter-gatherers, and early child
mortality is over 100 times greater than encountered in the United States.
Even late childhood mortality is about 80 times greater among hunter-gath-
0 5 10 15 20 25 30 35 40 45 50 55 60 65 70 75 80
0
25
50
75
100
125
150
175
200
R a t i o o f m o r t a l i t y h a z a r d s
Age
FIGURE 7 Two extremes in human mortality hazards: Ratio of
Siler-estimated mortality hazards (h x ) for hunter-gatherer
composite sample and the United States 2002
PDR 33.2 Gurven-Kaplan-FINAL.indd 339 5/22/07 2:16:46 PM
8/8/2019 Longevity Among Hunter-Gatherers
http://slidepdf.com/reader/full/longevity-among-hunter-gatherers 20/46
340 LONGEV ITY AMONG HUNTER -GATHERERS
erers. Not until the late teens does the relationship flatten, with over a tenfold
difference in mortality. This difference is only fivefold by age 50, fourfold by
age 60, and threefold by age 70.
Causes of mortality. It is important to investigate causes of death among
groups and at different ages to ascertain whether mortality patterns are the
result of unique circumstances and history, ecological conditions, or genetic
predispositions. We have seen that several of the study groups showed erratic
mortality profiles that highlight the need for further examination, even after
taking into account discrepancies in methodology. Many causes of death are
difficult to assess in traditional populations without physicians or autopsies,
and especially when causes of death are elicited during retrospective inter-
views. Even in modern hospitals, determining cause of death is sometimes
elusive or ambiguous because of multiple levels of causation. Malnutrition,infections, and disease are common in our study populations, making designa-
tion of the primary cause of death problematic, if not inevitably incomplete.
Accidents and homicides are usually easier to identify, and estimates of these
causes should be less subject to error. Table 5 presents causes of death among
the populations for which such data exist. It also includes published causes
of death for Aka Pygmies of the Congo (Hewlett, van de Koppel, and van de
Koppel 1986) and Bakairi of Brazil (Picchi 1994). The table shows the overall
percentage of deaths attributed to illness, degenerative disease, and accidents
or violence. Our sample includes 3,328 deaths. Where age-specific data exist,
cause of death is listed for juveniles (<15), adults (15–59), and older adults(60+). Illness accounts for over half of the deaths in all groups except among
pre-contact Ache. Among juveniles and adults, illness accounts for the major-
ity of all deaths, again except among Ache, where rates of female-biased in-
fanticide and adult homicide are fairly high. Among older adults, degenerative
disease and accidents compete with illness as major contributors of death.
We subdivide illness into respiratory, gastrointestinal, fever, and other
illnesses (sensu Hill and Hurtado 1996; Howell 1979). Gastrointestinal ill-
nesses account for 5–18 percent of deaths. Such deaths are higher among
Tsimane than Ache, Yanomamo, and Bakairi, even though the latter three
groups show high rates of parasitism in tropical environments. This higherrate is likely explained by the younger age structure of the Tsimane. Diar-
rhea coupled with malnutrition remains one of the most significant causes of
infant and early child deaths among foragers and peasant populations. People
living in tropical forests are especially vulnerable to helminthic parasites
(Dunn 1968), which, although not usually lethal, can compromise growth
and immune function.
Twenty percent or more of illness-related deaths among these groups
are due to such respiratory-related illnesses as bronchitis, tuberculosis, pneu-
monias, and other viral infections. Among many South American Amazo-
PDR 33.2 Gurven-Kaplan-FINAL.indd 340 5/22/07 2:16:46 PM

8/8/2019 Longevity Among Hunter-Gatherers
http://slidepdf.com/reader/full/longevity-among-hunter-gatherers 21/46
T A
B L E 5
C a u s e s o f d e a t h a m o n g s t u d y p o p u l a t i o n s ( i n p e r c e n
t )
N o r t h e r n
Y a n o -
A
c h e
A c h e
T s i -
M a c h i -
T e r r i t o r y
T o t
a l
H a d z a
m a m o
f o r e s t
s e t t l e d
! K u n g
m a n e
A k a
A g t a
H i w i
g u e n g a
A b o r i g i n e s
B a k a i r i
G a i n j
N u m b e r P e r c e n t
a ) < 1 5 y r s o l d
( 2 3 0 )
( 8 4 )
( 1 6 4 )
( 4 2 3 )
( 1 1 2 )
( 9 4 )
( 8 2 )
( 7 4 )
a l l
i l l n e s s
2 2 . 2
6 5 . 5
8 7 . 8
7 9 . 9
9 5 . 5
4 4 . 8
6 3 . 8
6 7 . 6
8 2 5
6 5 . 3
d e g e n e r a t i v e
8 . 3
2 0 . 2
3 . 7
1 0 . 4
1 0 . 4
9 . 6
2 4 . 3
1 2 0
9 . 5
a c c
i d e n t s
6 . 1
3 . 6
9 . 7
1 . 8
1 5 . 6
1 1 . 7
6 . 8
1 0 2
8 . 1
v i o
l e n c e
6 3 . 5
1 0 . 7
8 . 5
7 . 4
2 . 7
2 7 . 1
2 . 1
1 . 4
2 1 6
1 7 . 1
b )
1 5 – 5 9 y r s o l d
( 1 2 5 )
( 2 2 )
( 1 2 7 )
( 1 9 2 )
( 7 7 )
( 3 1 )
( 1 9 )
( 6 8 )
a l l
i l l n e s s
2 8 . 0
8 6 . 4
7 9 . 5
7 4 . 7
6 9 . 5
3 5 . 3
3 3 . 3
6 1 . 8
4 0 0
6 0 . 5
d e g e n e r a t i v e
3 . 2
3 . 1
1 6 . 5
4 . 9
2 . 9
1 4 . 3
2 5 . 0
6 1
9 . 2
a c c
i d e n t s
2 3 . 2
1 3 . 6
8 . 8
4 . 9
8 . 8
4 2 . 9
0 . 0
8 5
1 2 . 9
v i o
l e n c e
4 5 . 6
1 7 . 3
1 2 . 9
1 4 . 6
4 4 . 1
0 . 0
1 3 . 2
1 1 5
1 7 . 4
c ) 6 0 + y r s o l d
( 2 7 )
( 5 2 )
( 6 0 )
( 2 )
( 3 3 )
a l l
i l l n e s s
1 8 . 5
5 1 . 9
6 6 . 1
7 2 . 7
9 5
5 4 . 6
d e g e n e r a t i v e
2 2 . 2
4 0 . 4
2 5 . 4
2 1 . 2
4 9
2 8 . 2
a c c
i d e n t s
2 5 . 9
8 . 5
6 . 1
1 8
1 0 . 3
v i o
l e n c e
3 3 . 3
7 . 7
1 . 7
1 0 0 . 0
0 . 0
1 2
6 . 9
d )
A l l a g e s
( 1 2 5 )
( 1 1 1 )
( 3 8 2 )
( 1 0 4 )
( 3 4 3 )
( 6 9 0 )
( 6 6 9 )
( 3 6 4 )
( 1 3 9 )
( 1 1 7 )
( 1 7 5 )
( 6 5 )
( 4 4 )
r e s
p i r a t o r y
2 1 . 6
0 . 8
3 1 . 1
1 9 . 9
6 . 8
2 8 . 6
5 6 . 9
2 9 2
2 3 . 7
a
g a s t r o i n t e s t i n a l
5 . 4
5 . 5
1 3 . 2
1 8 . 2
3 4 . 2
1 7 . 1
3 . 1
2 3 9
1 3 . 8
a
f e v
e r
6 . 3
8 . 1
2 1 . 7
5 . 7
1 . 7
0 . 0
7 . 7
1 0 7
7 . 3
a
o t h
e r
4 0 . 5
9 . 4
1 . 9
2 5 . 9
1 4 . 5
2 0 . 6
3 . 1
3 1 7
1 6 . 6
a
A l l i l l n e s s
6 6 . 7
7 3 . 9
2 3 . 8
6 7 . 9
7 9 . 3
6 9 . 6
9 2 . 2
8 6 . 7
4 1 . 0
5 7 . 3
6 6 . 3
7 0 . 8
7 9 . 0
2 , 3 3 3
7 0 . 1
D e
g e n e r a t i v e
1 2 . 0
6 . 3
7 . 6
1 6 . 0
9 . 0
1 2 . 2
2 . 5
7 . 6
7 . 9
1 0 . 3
2 4 . 0
1 6 . 9
7 . 0
3 0 6
9 . 2
A c
c i d e n t a l
0 . 8
7 . 2
1 3 . 1
2 . 8
8 . 4
2 . 7
1 2 . 9
1 7 . 1
4 . 0
1 2 . 3
1 6 6
8 . 1
a
H o
m i c i d e
3 . 2
4 . 5
2 2 . 0
4 . 2
7 . 5
3 . 4
5 . 7
0 . 0
1 6 4
6 . 3
a
W a r f a r e
0 . 0
8 . 1
3 3 . 5
0 . 0
0 . 0
0 . 0
0 . 0
0 . 0
1 3 7
5 . 2
a
A l l v i o l e n c e
3 . 2
1 2 . 6
5 5 . 5
4 . 2
7 . 5
3 . 0
3 0 . 2
3 . 4
5 . 7
0 . 0
3 5 4
1 2 . 5
a
A l l v i o l e n c e /
a c c i d e n t a l
4 . 0
1 9 . 8
6 8 . 6
7 . 1
1 1 . 7
1 5 . 9
5 . 4
5 . 8
4 3 . 2
2 0 . 5
9 . 7
1 2 . 3
1 4 . 0
6 2 6
1 8 . 8
O t h e r c a u s e s
1 7 . 3
0 . 0
0 . 0
0 . 0
0 . 0
2 . 2
0 . 0
0 . 0
7 . 9
1 2 . 0
0 . 0
0 . 0
0 . 0
6 2
1 . 9
N O
T E : N u m b e r s i n p a r e n t h e s e s a r e n u m b e r o f
p e r s o n s i n r e l e v a n t a g e g r o u p .
a C a
t e g o r y a v e r a g e i n c l u d e s o n l y g r o u p s f o r w h
i c h g o o d q u a l i t y d a t a a r e a v a i l a b l e ; u n k n o w
n d e a t h s f o r H a d z a , A g t a , a n d A k a a r e d i s t r i b u t e d a m o n g i l l n e s s c a t e g o r i e s . U n k n o w n
d e a t h s f o r
B a k a i r i a n d T s i m a n e a r e o m i t t e d f r o m t h e a n a l y s e s .
S O U R C E S : S e e T a b l e 1 .
PDR 33.2 Gurven-Kaplan-FINAL.indd 341 5/22/07 2:16:46 PM
8/8/2019 Longevity Among Hunter-Gatherers
http://slidepdf.com/reader/full/longevity-among-hunter-gatherers 22/46
342 LONGEV ITY AMONG HUNTER -GATHERERS
nian groups, Black (1975) reports that most infectious diseases are absent in
newly contacted groups, because small, mobile populations cannot support
these contagious vectors. Post-contact prevalence of infectious disease amongAche is similar to rates among Yanomamo (Hill and Hurtado 1996). Tsimane
show a similar importance of respiratory disease at 20 percent of illness-re-
lated deaths. Bakairi have suffered repeated epidemics of respiratory illness,
especially tuberculosis and whooping cough (Picchi 1994). Pneumonia and
tuberculosis are claimed to be the top killers of adults and older children
among !Kung (Howell 1979: 63). Gainj mortality and more recent mortality
among Agta also show high rates of infectious disease.
Degenerative deaths are relatively few, confined largely to problems
early in infancy and late-age cerebrovascular problems, as well as attributions
of “old age” in the absence of obvious symptoms or pathology. Heart attacksand strokes appear rare and do not account for these old-age deaths (see
Eaton, Konner, and Shostak 1988), which tend to occur when sleeping. It
has often been remarked that few risk factors for cardiovascular disease exist
among active members of small-scale societies (Eaton et al. 1994), although
compromised lung or kidney functioning can interact with cardiac fibrosis or
moderate arterial stenosis to cause cardiac arrest. Obesity is rare, hyperten-
sion is low, cholesterol and triglyceride levels are low, and maximal oxygen
uptake is high. Overall, degenerative disease accounts for 6–24 percent (av-
erage 9 percent) of deaths, with the highest representation among Northern
Territory Aborigines. Neoplasms and heart disease each accounted for 9 of
the 42 deaths due to degenerative illness. It should be pointed out, however,
that chronic illnesses as causes of death are the most difficult to identify,
since more proximate causes are likely to be mentioned. To our knowledge
there have been no focused studies or mention of Alzheimer’s, Parkinson’s,
or other forms of dementia.
Violence and warfare are variable across groups. Agta, Ache, Yano-
mamo, and Hiwi suffer from high levels of homicide, affecting adult males
disproportionately. Homicide is low among Hadza, Tsimane, and Northern
Territory Aborigines. Ache display a very high level of homicide, although
much of this is infanticide, child homicide, and a result of skirmishes with
rural Paraguayans. Infanticide is fairly high among Ache and Yanomamo,occasional among !Kung and Tsimane, and rare among Hadza. Infants most
susceptible to infanticide include those born with obvious defects, those
perceived as weak, twins, and those of questionable paternity. It seems likely
that violent deaths decrease with increased state-level intervention and mis-
sionary influence in many small-scale groups around the world (e.g., Agta,
Ache, Aborigines, !Kung, Yanomamo). The composition of accidental deaths
varies across groups, including falls, river drownings, animal predation, ac-
cidental poisonings, burns, and getting lost in the environment. Only one
Hadza death (1 percent) was accidental, with remaining groups showing
PDR 33.2 Gurven-Kaplan-FINAL.indd 342 5/22/07 2:16:47 PM
8/8/2019 Longevity Among Hunter-Gatherers
http://slidepdf.com/reader/full/longevity-among-hunter-gatherers 23/46
M I C H A E L GU R V E N / H I L L A R D KA P L A N 343
4–13 percent of deaths as unintentional or accidental. Together, acciden-
tal and violent deaths account for 4–69 percent (average 19 percent) of all
deaths. The high proportion of Ache deaths due to violence is a consequenceof few illness-related deaths in the pre-contact sample. The post-contact Ache
sample shows only 14 percent violent and accidental deaths, with 68 percent
of deaths due to illness.
The sample of deaths for Agta, pre-contact Xilixana Yanomamo, and
Gainj is small. Early and Headland (1998) and Early and Peters (2000)
surmise that a large percentage of unknown deaths among Agta is due to
infectious disease. Among Gainj, most adult deaths are due to infectious dis-
ease. The very high adult mortality among Agta results from a combination
of maternal mortality, homicide, and infectious disease. The rates of Agta
death for maternal mortality and homicide are the highest reported for anypopulation in the world.
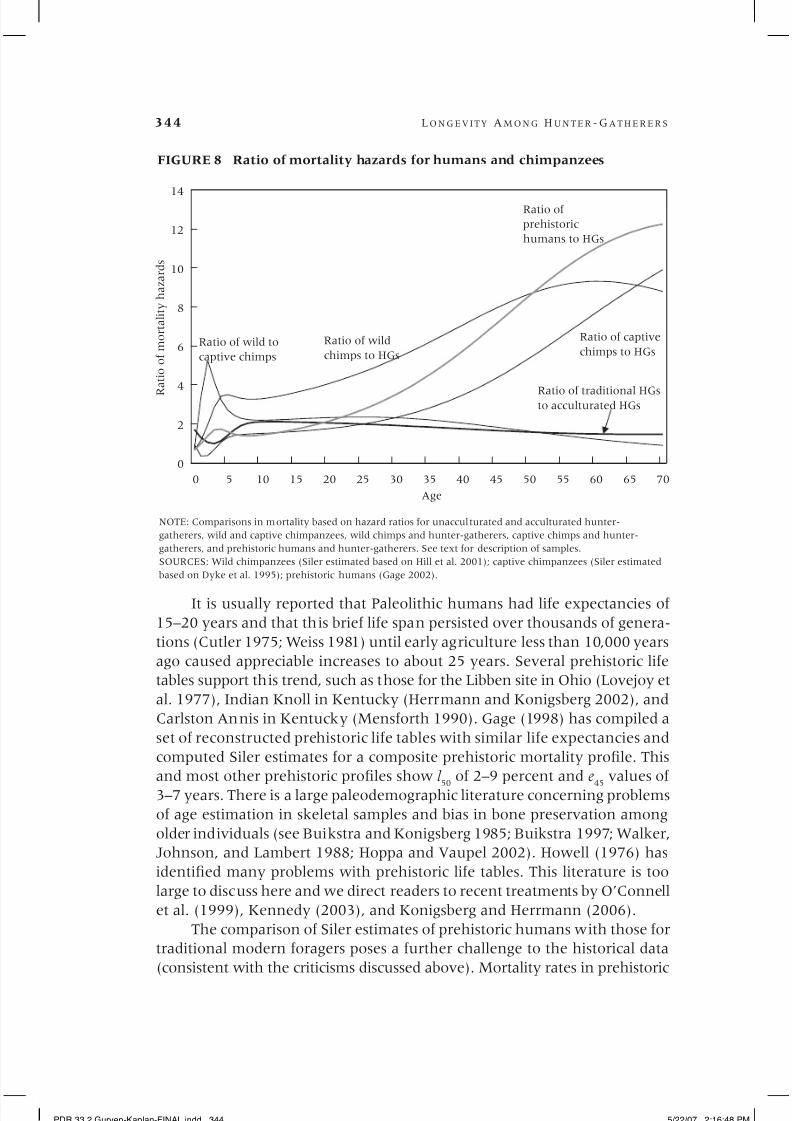
Traditional humans, chimpanzees, and paleodemography
Figure 8 examines five mortality ratios as a function of age: 1) traditional to
acculturated hunter-gatherers, 2) wild to captive chimpanzees, 3) wild chim-
panzees to traditional foragers, 4) captive chimpanzees to traditional forag-
ers, and 5) estimates for prehistoric populations to traditional foragers. The
first two comparisons reflect the effects of changed conditions. The next two
comparisons allow for the assessment of the interaction of changed conditions
and species differences. The last combines the effects of errors in estimation
and changes in mortality rates over time.
The effects of improved conditions have similar within-species effects
on humans and chimpanzees. Captivity among chimpanzees, which provides
medical attention, abundant feeding, and protection from predation, exerts
a very large effect on infant and juvenile survival rates. The effects of captiv-
ity diminish with age. Among traditional humans, the effects of improved
conditions seem to be greatest during childhood and middle adulthood,
tapering off with age.
The age-specific differences between humans and chimpanzees arerevealing. The difference between foragers and wild chimpanzees increases
dramatically with age. The ratio of mortality hazards is over three times as
high among chimpanzees during childhood, and then increases to about
eight times as high at age 45. Improved conditions for captive chimpanzees
actually generate lower mortality during infancy and early childhood than
among some foragers. However, the species differences then overcome the
effects of conditions, with captive chimpanzee mortality rates being over
three times as high as that of foragers by age 40.
PDR 33.2 Gurven-Kaplan-FINAL.indd 343 5/22/07 2:16:47 PM
8/8/2019 Longevity Among Hunter-Gatherers
http://slidepdf.com/reader/full/longevity-among-hunter-gatherers 24/46
344 LONGEV ITY AMONG HUNTER -GATHERERS
It is usually reported that Paleolithic humans had life expectancies of
15–20 years and that this brief life span persisted over thousands of genera-
tions (Cutler 1975; Weiss 1981) until early agriculture less than 10,000 years
ago caused appreciable increases to about 25 years. Several prehistoric life
tables support this trend, such as those for the Libben site in Ohio (Lovejoy et
al. 1977), Indian Knoll in Kentucky (Herrmann and Konigsberg 2002), and
Carlston Annis in Kentucky (Mensforth 1990). Gage (1998) has compiled a
set of reconstructed prehistoric life tables with similar life expectancies and
computed Siler estimates for a composite prehistoric mortality profile. This
and most other prehistoric profiles show l 50
of 2–9 percent and e45
values of
3–7 years. There is a large paleodemographic literature concerning problems
of age estimation in skeletal samples and bias in bone preservation among
older individuals (see Buikstra and Konigsberg 1985; Buikstra 1997; Walker,
Johnson, and Lambert 1988; Hoppa and Vaupel 2002). Howell (1976) has
identified many problems with prehistoric life tables. This literature is too
large to discuss here and we direct readers to recent treatments by O’Connell
et al. (1999), Kennedy (2003), and Konigsberg and Herrmann (2006).
The comparison of Siler estimates of prehistoric humans with those for
traditional modern foragers poses a further challenge to the historical data
(consistent with the criticisms discussed above). Mortality rates in prehistoric
0 5 10 15 20 25 30 35 40 45 50 55 60 65 70
0
2
4
6
8
10
12
14
R
a t i o o f m o r t a l i t y h a z a r d s
Age
FIGURE 8 Ratio of mortality hazards for humans and chimpanzees
Ratio of traditional HGsto acculturated HGs
Ratio of wild
chimps to HGs
Ratio of
prehistoric
humans to HGs
Ratio of captive
chimps to HGsRatio of wild to
captive chimps
NOTE: Comparisons in mortality based on hazard ratios for unacculturated and acculturated hunter-
gatherers, wild and captive chimpanzees, wild chimps and hunter-gatherers, captive chimps and hunter-
gatherers, and prehistoric humans and hunter-gatherers. See text for description of samples.
SOURCES: Wild chimpanzees (Siler estimated based on Hill et al. 2001); captive chimpanzees (Siler estimated
based on Dyke et al. 1995); prehistoric humans (Gage 2002).
PDR 33.2 Gurven-Kaplan-FINAL.indd 344 5/22/07 2:16:48 PM
8/8/2019 Longevity Among Hunter-Gatherers
http://slidepdf.com/reader/full/longevity-among-hunter-gatherers 25/46
M I C H A E L GU R V E N / H I L L A R D KA P L A N 345
populations are estimated to be lower than those for traditional foragers until
about age 2 years. Estimated mortality rates then increase dramatically for
prehistoric populations, so that by age 45 they are over seven times greaterthan those for traditional foragers, even worse than the ratio of captive chim-
panzees to foragers. Because these prehistoric populations cannot be very dif-
ferent genetically from the populations surveyed here, there must be system-
atic biases in the samples and/or in the estimation procedures at older ages
where presumably endogenous senescence should dominate as primary cause
of death. While excessive warfare could explain the shape of one or more of
these typical prehistoric forager mortality profiles, it is improbable that these
profiles represent the long-term prehistoric forager mortality profile. Such
rapid mortality increase late in life would have severe consequences for our
human life history evolution, particularly for senescence in humans.It may be possible to use the data from modern foragers to adjust those
estimates for prehistoric foragers. Longitudinal analyses and cross-cultural
comparisons have shown that in the Gompertz–Makeham model, the overall
rate of mortality is negatively associated with the rate of mortality increase
with age. Strehler and Mildvan (1960) referred to this relationship as the
compensation law of mortality, where high initial adult mortality is offset by
lower values of the mortality slope. Their argument assumes a decline in
“vitality” with age and an inverse relationship between the frequency of en-
vironmental stresses and the intensity of those stresses on the body. Mortality
compensation implies that differences in mortality rates among populations
should decrease with age and converge on a common species-typical pattern
of senescence (Gavrilov and Gavrilova 1991; Yashin et al. 2001). While the
theory underlying mortality compensation is controversial, the robust in-
verse relationship between the two Gompertz parameters is not. In the Siler
formulation, the intercept and slope parameters are a3
and b3,
respectively.
In the forager dataset, the best-fit equation for the relationship between lna3
and b3 is:
ln . .a b3 3
64 983 2 9888= − − (3)
This relationship is highly significant (r =0.994, p<0.001). Inserting (3) intothe nonimmature components of (1) yields
h x a e
b x ( ) .
( . )= + ⋅ −2
64 9830 050 3 (4)
Equation (3) describes the set of mortality curves that intersect by
about age 65 and explains 89 percent of the variation in these parameters
( p<0.0001). Thus in our sample, mortality is estimated to converge at around
65 years of age, some 20 years earlier than in modern industrialized popula-
tions (e.g., Riggs 1990; Riggs and Millecchia 1992; Riggs, Hobbs, and Gerald
1998).
PDR 33.2 Gurven-Kaplan-FINAL.indd 345 5/22/07 2:16:49 PM

8/8/2019 Longevity Among Hunter-Gatherers
http://slidepdf.com/reader/full/longevity-among-hunter-gatherers 26/46
346 LONGEV ITY AMONG HUNTER -GATHERERS
The Siler estimates of a3
and b3
for the prehistoric composite life table
provided by Gage (1998) are extreme outliers from the regression equation
(3). The average mortality profile for our forager populations is similar to thatfor Sweden in 1751, and early European populations and foraging popula-
tions show similar negative relationships between a3
and b3. If we fix a
3and
solve for the appropriate b3
based on equation (3), we find that b3
should
be 0.038, or one-half of the estimate by Gage. Calculation of the life table
with this revised value of b3
changes l 50
from 4 percent to 24 percent and e45
from 6 years to 19 years. Overall life expectancy only changes from 20 to
28 years. Alternatively, if we fix b3
and instead recalculate a3, we find that
an a3consistent with the linear relationship of equation (4) is 1/12 of Gage’s
estimate. A life table with this revised a3
estimate shifts l 50
to 36 percent, e45
to 18 years, and mean life expectancy to 33 years.Critics may argue that the uniformitarian mortality assumption does
not apply to those prehistoric populations that tend to show relatively low
infant and child mortality but excessively high adult mortality. If not based
on erroneous assumptions about population growth and model life tables,
such adult mortality would presumably be due to violence and warfare
and not to widespread infectious disease or intrinsic senescence. Infectious
disease is unlikely to reach epidemic proportions in small, isolated popula-
tions (Black 1975). In our sample, widespread lethal infectious disease was
most common in groups that had been interacting with large populations
of outsiders. Intrinsic senescence is also unlikely to have been much higher
in the past because evidence also suggests that early and late-age mortality
are closely linked among cohorts as a result of the cascading effects of early
infections and undernutrition (Kuh and Ben-Shlomo 1997; Costa 2000;
Finch and Crimmins 2004).
Making inferences about population growthin the past by reference to modern foragers
One of the criticisms of making inferences about ancestral populations from
the study of ethnographic foragers is that the high population growth rates
of some modern groups could not possibly be representative of ancestral for-agers for long periods of time. Figure 9 displays “iso-growth” curves, which
are lines of equal population growth as a function of different levels of the
total fertility rate (TFR) and survivorship to age 15 (l 15
).5 Defining curves in
terms of these two variables is useful because TFR and l 15
exist for many more
groups than our sample of societies used here. Other foraging groups included
here are the Chenchu, Mbuti, Aka, Batak, and Greenland Inuit. Additional
horticulturalists include the Bari, Dusun, Kapauku, Ngbaka, Semai, Talensi,
Tamang, and 23 South American Amazonian groups. Additional pastoralists
include the Datoga, Kipsigis, and Sebei. These groups were largely compiled
from Hewlett (1991) and Salzano and Callegari-Jacques (1988). Although
PDR 33.2 Gurven-Kaplan-FINAL.indd 346 5/22/07 2:16:50 PM
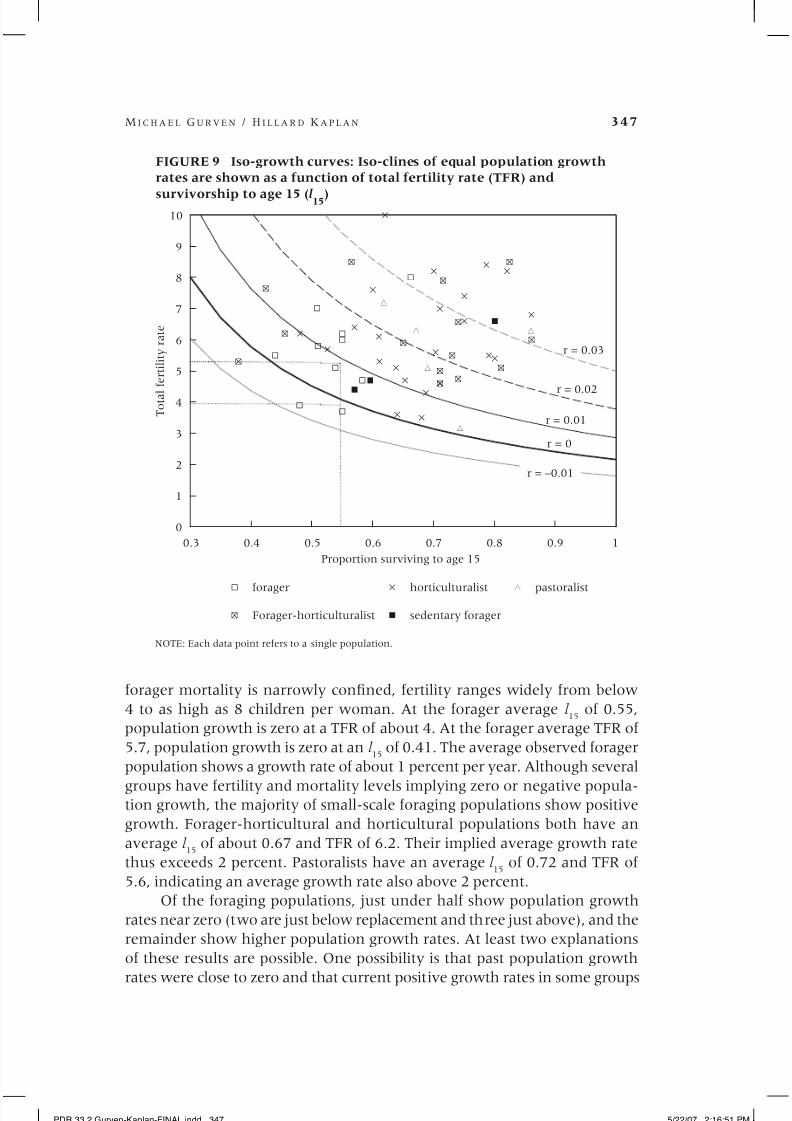
8/8/2019 Longevity Among Hunter-Gatherers
http://slidepdf.com/reader/full/longevity-among-hunter-gatherers 27/46
M I C H A E L GU R V E N / H I L L A R D KA P L A N 347
forager mortality is narrowly confined, fertility ranges widely from below
4 to as high as 8 children per woman. At the forager average l 15
of 0.55,
population growth is zero at a TFR of about 4. At the forager average TFR of
5.7, population growth is zero at an l 15
of 0.41. The average observed forager
population shows a growth rate of about 1 percent per year. Although several
groups have fertility and mortality levels implying zero or negative popula-tion growth, the majority of small-scale foraging populations show positive
growth. Forager-horticultural and horticultural populations both have an
average l 15
of about 0.67 and TFR of 6.2. Their implied average growth rate
thus exceeds 2 percent. Pastoralists have an average l 15
of 0.72 and TFR of
5.6, indicating an average growth rate also above 2 percent.
Of the foraging populations, just under half show population growth
rates near zero (two are just below replacement and three just above), and the
remainder show higher population growth rates. At least two explanations
of these results are possible. One possibility is that past population growth
rates were close to zero and that current positive growth rates in some groups
0.3 0.4 0.5 0.6 0.7 0.8 0.9 1
0
1
2
3
4
5
6
7
8
9
10
T o t a l
f e r t i l i t y r a t e
Proportion surviving to age 15
FIGURE 9 Iso-growth curves: Iso-clines of equal population growth
rates are shown as a function of total fertility rate (TFR) and
survivorship to age 15 (l15)
G
G
G
G
G
G
G
G
G
G
N
N
N
N
N
N
NN
N
NN
NN
N
I
I
I
I
II
I
I
II
I
I
I
I
I
I
I
I
I
I
I
I
I
B
B
B
Ç
Ç
Ç
Ç
Ç
G forager
N Forager-horticulturalist
I horticulturalist
B sedentary forager
Ç pastoralist
r = 0.03
r = 0.02
r = 0.01
r = 0
r = –0.01
NOTE: Each data point refers to a single population.
PDR 33.2 Gurven-Kaplan-FINAL.indd 347 5/22/07 2:16:51 PM
8/8/2019 Longevity Among Hunter-Gatherers
http://slidepdf.com/reader/full/longevity-among-hunter-gatherers 28/46
348 LONGEV ITY AMONG HUNTER -GATHERERS
are unrepresentative of past populations. Levels of homicide and intergroup
warfare may have been greater in the past. Also, some groups may have had
greater access to food during the sample period than in the past. For example,the northern Ache experienced high growth rates throughout the twentieth
century, and the depopulation of Guarani horticultural groups in their area,
caused by slave trading and warfare, may have been a factor. The southern
Ache, in contrast, were on the verge of extinction because of increasing en-
croachment on their traditional range by outsiders. As illustrated in Figure
9, zero population growth requires either a significant decrease in fertility
below that observed in almost all foraging groups, or a decrease in survivor-
ship below that ever observed among modern or prehistoric foraging popula-
tions. Even with the inclusion of an additional nine values of l 15
from other
foraging populations, mean survivorship drops only to 0.53 (s.d.=0.07).6
Thisprobably means that the fertility of sample populations would have to have
been closer to 4.5 in order for population growth to remain at zero.
A second possibility is that although long-term population growth must
have been nearly zero over long periods of time, population dynamics over
shorter time periods resembled a “saw-tooth” pattern (Hill and Hurtado
1996), characterized by rapid population increases and subsequent crashes.
Most time is therefore spent in a growing state, consistent with the high
growth rates seen in many ethnographic reports on hunter-gatherers. Binford
(personal communication) recounts the case of an Nunamiut Eskimo group
that perished in its entirety, having been snowed in without sufficient food
supplies to survive through the winter.
It is difficult to evaluate these two hypotheses in light of current knowl-
edge about past conditions. While evidence suggests that climate varied
widely throughout the Pleistocene and into the Holocene epoch (see Richer-
son, Bettinger, and Boyd 2005), the extent to which past foragers typically
experienced increasing, declining, or zero growth in past environments is
unknown. Perhaps some combination of the two hypotheses is the correct
answer. Mortality experiences of infants and children and adult mortality due
to violence and trauma probably varied significantly over time and place.
Summary of results
We summarize our main findings to this point:
Post-reproductive longevity is a robust feature of hunter-gatherers and
of the life cycle of Homo sapiens. Survivorship to grandparental age is achieved
by over two-thirds of people who reach sexual maturity and can last an aver-
age of 20 years.
Adult mortality appears to be characterized by two stages. Mortality
rates remain stable and fairly low at around 1 percent per year from the age
of maturity until around age 40. After age 40, the rate of mortality increase
is exponential (Gompertz) with a mortality rate doubling time of about 6–9
PDR 33.2 Gurven-Kaplan-FINAL.indd 348 5/22/07 2:16:51 PM
8/8/2019 Longevity Among Hunter-Gatherers
http://slidepdf.com/reader/full/longevity-among-hunter-gatherers 29/46
M I C H A E L GU R V E N / H I L L A R D KA P L A N 349
years. The two decades without detectable senescence in early and mid-adult-
hood appear to be an important component of human life span extension.
The average modal age of adult death for hunter-gatherers is 72 with arange of 68–78 years. This range appears to be the closest functional equiva-
lent of an “adaptive” human life span.
Departures from this general pattern in published estimates of life ex-
pectancy in past populations (e.g., low child and high adult mortality) are
most likely due to a combination of high levels of contact-related infectious
disease, excessive violence or homicide, and methodological problems that
lead to poor age estimates of older individuals and inappropriate use of model
life tables for deriving demographic estimates.
Illnesses account for 70 percent, violence and accidents for 20 percent,
and degenerative diseases for 9 percent of all deaths in our sample. Illnesseslargely include infectious and gastrointestinal disease, although less than half
of all deaths in our sample are from contact-related disease.
Comparisons among hunter-gatherers, acculturated hunter-gatherers,
wild chimpanzees, and captive chimpanzees illustrate the interaction of
improved conditions and species differences. Within species, improved condi-
tions tend to decrease mortality rates at all ages, with a diminishing effect at
older ages. Human and chimpanzee mortality diverge dramatically at older
ages, revealing selection for a longer adult period in humans.
Discussion and conclusions: The evolvedhuman life span
A fundamental conclusion we draw from this analysis is that extensive lon-
gevity appears to be a novel feature of Homo sapiens. Our results contradict
Vallois’s (1961: 222) claim that among early humans, “few individuals passed
forty years, and it is only quite exceptionally that any passed fifty,” and the
more traditional Hobbesian view of a nasty, brutish, and short human life (see
also King and Jukes 1969; Weiss 1981). The data show that modal adult life
span is 68–78 years, and that it was not uncommon for individuals to reach
these ages, suggesting that inferences based on paleodemographic reconstruc-
tion are unreliable. One recent study that avoids several common problems
of skeletal aging used dental-wear seriation and relative macro-age categories
(ratio of old to young) to demonstrate an increase in the relative presence
of older adults from australopithecines to early Homo and, more strikingly,
among Upper Paleolithic humans (Caspari and Lee 2004; but see Hawkes and
O’Connell 2005). More compellingly, a recent re-estimation of several com-
mon paleo-mortality curves based on hazard analysis and maximum likeli-
hood methods shows a life course pattern similar to that of our ethnographic
sample (Konigsberg and Herrmann 2006).
We conclude the article with a brief discussion of life span evolution
of the hunter-gatherers in our sample. Two issues are addressed. The first
PDR 33.2 Gurven-Kaplan-FINAL.indd 349 5/22/07 2:16:52 PM
8/8/2019 Longevity Among Hunter-Gatherers
http://slidepdf.com/reader/full/longevity-among-hunter-gatherers 30/46
350 LONGEV ITY AMONG HUNTER -GATHERERS
is why modal life spans are about seven decades, not shorter or longer. The
second issue is how best to conceive of life span evolution, especially in rela-
tion to the gene–environment interactions that determine age distributionsof death at the population level.
Why seven decades?
The classic theory of senescence in evolutionary biology argues that individu-
als contribute less to reproductive fitness as they age because less of their
expected lifetime fertility remains (Haldane 1942; Medawar 1952; Williams
1957; Hamilton 1966). Consequently, natural selection acts more weakly to
counteract deleterious mutations affecting mortality at older ages. The exis-
tence of substantial post-reproductive life among humans therefore suggeststhat older individuals maintain “reproductive value” by increasing their fit-
ness through non-reproductive means, a critical component of all evolution-
ary models of human longevity.
George Williams (1957) was first to propose that beginning at ages
45–50 years, mothers may benefit more from investing their energy and re-
sources in existing descendants than from producing new ones. This idea later
became known as the “grandmother hypothesis” (Hill and Hurtado 1991).
A specific version of the grandmother hypothesis proposed by Hawkes et al.
(1998) focuses on intergenerational transfers among women and proposes
that older women can increase their inclusive fitness by raising offspring fer-
tility and grandoffspring survivorship through provisioning. The resources
acquired by women foragers are strength-intensive, disadvantaging young
children while increasing the value of older women’s contributions. Accord-
ing to this view, extensions in the human life span are driven by selection on
women and the value of resource transfers from grandmothers to grandchil-
dren. Peccei (2001) proposes an amendment to this view. She points out that
long-term juvenile dependence among humans implies that adults who cease
reproducing in their 40s will not finish parenting until they are 60 or older
(see also Lancaster and King 1985). The notion that most of the benefits to
longevity derive from helping offspring rather than grandoffspring has been
called the “mother hypothesis” (see Packer et al. 1998 for a similar argument based on baboons).
The embodied capital model (Kaplan et al. 2000; Kaplan and Robson
2002; Gurven and Kaplan 2006) extends these ideas to both sexes in a formal
life-history model, relating intergenerational transfers to the ecology of the
hunting and gathering lifestyle. It proposes that timing of life events is best
understood as an “embodied capital” investment process. Embodied capital is
organized somatic tissue, which functionally increases lifetime adult income
and includes strength, skill, knowledge, and other abilities. Humans are spe-
cialists in brain-based capital. High levels of knowledge and skill are required
PDR 33.2 Gurven-Kaplan-FINAL.indd 350 5/22/07 2:16:52 PM
8/8/2019 Longevity Among Hunter-Gatherers
http://slidepdf.com/reader/full/longevity-among-hunter-gatherers 31/46
M I C H A E L GU R V E N / H I L L A R D KA P L A N 351
to exploit the suite of high-quality, difficult-to-acquire resources humans
consume. Those abilities require a large brain and a long time-commitment
to development. This extended learning phase, during which productivityis low, is compensated for by higher productivity during adulthood. Since
productivity increases with age, the time investment in skill acquisition and
knowledge leads to selection for lowered mortality rates and greater longev-
ity, because the returns on the investments in development occur at older
ages. According to this model, the long human life span co-evolved with the
lengthening of the juvenile period, increased brain capacities for information
processing and storage, and intergenerational resource flows. It is a two-sex
model, as it proposes that both men and women engage in learning-intensive
food production tasks; these activities result in delayed productivity until
older ages, selecting for life span extension in both sexes.Each of these models relates the benefits of longevity to fitness effects
achieved through transfers to dependent descendants (see Lee 2003). In-
deed, an increasing number of studies focusing on the contributions of older
individuals have found significant fitness effects via increased child and
grandchild survivorship and fertility (e.g., Beise and Voland 2002; Jamison
et al. 2002; Sear, Mace, and McGregor 2000; Sear et al. 2002; Hawkes et al.
1998; Lahdenpera et al. 2004). The demographic data derived from foragers
and forager-horticulturalists allow us to assess how those contributions can
change with age. The two panels of Figure 10, derived from data on Tsimane
forager-horticulturalists, compare age-specific numbers of dependent descen-
dants with mortality rates. The top panel shows the weighted sum of children
and one-half the number of grandchildren by age (since grandchildren share,
on average, a quarter of their genes with grandparents, whereas parents share
half with their own children). The lower panel shows age-specific mortality
rates. Even though a woman still has descendants who could benefit from
her assistance, the number of offspring and grandoffspring, especially de-
pendents less than 15 years old, drops considerably after about age 65. This
is also the point when mortality begins to rise steeply. The late age at which
decline in contributions to dependents begins is similar to the modal age at
death from Figure 4. We have tabulated actual flows of food and observed
that men and women invest in children and grandchildren after reproduc-tion has ceased, with a shifting emphasis from mostly children to mostly
grandchildren as they age. Those results provide the greatest support for the
embodied capital hypothesis.
As the number of closely related dependent kin eligible to receive in-
vestment decreases after age 65, the fitness benefits of longer life decrease
and there is less evolutionary incentive to pay increasing maintenance and
repair costs to remain alive and functional beyond this period. Data on males
would show a similar pattern, except that the male peak in dependency is 3
to 5 years later, due to their later age at marriage. This decline in the poten-
PDR 33.2 Gurven-Kaplan-FINAL.indd 351 5/22/07 2:16:52 PM

8/8/2019 Longevity Among Hunter-Gatherers
http://slidepdf.com/reader/full/longevity-among-hunter-gatherers 32/46
352 LONGEV ITY AMONG HUNTER -GATHERERS
tial pool of genetic beneficiaries may explain why few people lived beyond
the seventh decade of life.
Gene–environment interactionsand life span evolution
How can we reconcile the idea of an evolved life span with the evidence that
mortality distributions are influenced by environmental conditions? Our
answer may shed light on the recent debate over modern changes in hu-
0 5 10 15 20 25 30 35 40 45 50 55 60 65 70 75 80
0
2
4
6
8
10
12
14
N u m b e r o f c h i l d r e n + 0 . 5 g r a n d c h i l d r e n
Age of female
0 5 10 15 20 25 30 35 40 45 50 55 60 65 70 75 80
0
0.05
0.1
0.15
0.2
0.25
0.3
0.35
FIGURE 10 Age-specific dependency and adult mortality
NOTE: Number of children and 1/2 number of grandchildren by age of a Tsimane woman (top panel)
compared with age-specific mortality rate for Tsimane (bottom panel).
Kids and
grandkids
< 15 years
< 10 years
< 5 years
< 1 year
h ( x )
PDR 33.2 Gurven-Kaplan-FINAL.indd 352 5/22/07 2:16:53 PM
8/8/2019 Longevity Among Hunter-Gatherers
http://slidepdf.com/reader/full/longevity-among-hunter-gatherers 33/46
M I C H A E L GU R V E N / H I L L A R D KA P L A N 353
man life span. While average life expectancy has changed significantly over
recent history, it is an open question whether gains will continue linearly
and whether the maximum life span itself will continue to increase (Vaupel1997; Wilmoth 1998).
One view is that there is a fixed upper limit to the human life span at
about 85±6 years (Wood et al. 1994), where the distribution of deaths be-
comes compressed or “rectangularized” over time as improved medical care
and public health increasingly reduce early-age death (Fries 1989; Weiss
1989). An alternative view posits that there is no set limit to the human
life span and that improvements in medical care, treatments, and living
conditions will continue to produce increases in longevity (Wilmoth 1998).
Wood et al. (1994) characterize these two views as gerontological versus
epidemiological. The gerontological view treats the various outcomes of ag-ing as resulting from a single unitary process, leading to programmed death;
the epidemiological view treats aging and its implications for mortality as
resulting from a competing set of risks due to a set of independent or quasi-
independent processes (see also Gage 1989). For example, Wood et al. argue
against the notion of a unifying species-typical mortality rate doubling time
(cf. Finch, Pike, and Whitten 1990), citing MRDT estimates varying from 3
to 33 years for different causes of senescent death, such as atherosclerosis,
emphysema, and cirrhosis.
We suggest that neither view is fully correct and that a hybrid of the
two approaches is more productive. It is necessary to consider not only the
benefits of life span extension, but also the costs. Aging can be thought of
as resulting from the combined effects of environmental assaults and the
deleterious byproducts of metabolism. Natural selection favors optimal effort
at repairing the damage produced by both processes. In each physiological
subsystem, repair and damage prevention should evolve in response to their
marginal and partially separable effects on age-specific fitness. If we imagine
the environments in which our ancestors evolved, environmental assaults
and access to energy to combat those assaults are likely to have varied across
time and locale. Such variation is likely to select for some phenotypic plastic-
ity in allocations to defense and repair. At the same time, the hunting and
gathering adaptation practiced by evolving humans was built upon a complexof long-term child dependence, during which learning outweighed productiv-
ity, and compensating high productivity of adults, especially in middle age.
Together, the costs of slowing senescence and preventing mortality, and the
benefits of extended investment in descendants, produced selection for a char-
acteristic human life span, with some variance around the central tendency.
The comparison of data from eighteenth-century Sweden to the hunting and
gathering populations in our study suggests that similar age distributions of
adult deaths occur under a broad range of environmental conditions.
Reductions in infectious diseases and improvements in food supply
sharply lower the assault rate on people’s bodies as modernization occurs.
PDR 33.2 Gurven-Kaplan-FINAL.indd 353 5/22/07 2:16:54 PM
8/8/2019 Longevity Among Hunter-Gatherers
http://slidepdf.com/reader/full/longevity-among-hunter-gatherers 34/46
354 LONGEV ITY AMONG HUNTER -GATHERERS
Aging individuals are increasingly insulated from assaults as well. The de-
fenses that evolved to be phenotypically plastic in relation to ancestral en-
vironmental variation produce a very different distribution of deaths undermodern conditions. In that sense, the evolved human life span is perhaps best
conceived as a population-level distribution of deaths that corresponds to the
characteristic range of environments in which our ancestors lived.
We do not fully understand the mechanisms underlying the effects of
modernization. Do members of industrialized countries age more slowly,
in a physiological sense, than people exposed to greater environmental as-
saults? Alternatively, are most of the mortality improvements attributable to
reductions in cause-specific mortality at specific ages through prevention of
assaults or medical treatment of illnesses? Is a 50-year-old Hadza as robust
and functional as a 50-year-old American? It has been argued that agingand the onset of chronic disease are accelerated in response to poor nutri-
tion, infectious disease, and chronic inflammatory processes in general (Elo
and Preston 1992; Blackwell, Hayward, and Crimmins 2001; Bengtsson and
Lindström 2000). For example, there is increasing evidence that chronic
diseases, such as diabetes, occurred at earlier ages in the nineteenth century
in the United States than they do today (Fogel and Costa 1997). In contrast,
the Tsimane show higher levels of C-reactive protein (CRP) across all ages.
CRP is an acute-phase protein that acts as a marker and instigator of inflam-
mation, and among Tsimane it is associated with disease load and presence of
parasites. Increasing evidence indicates that malnutrition and health insults
during fetal and perinatal development produce cascading effects leading to a
greater risk of coronary heart disease later in life (Barker and Osmond 1986;
Cameron and Demerath 2002). Together these results suggest that aging and
old-age mortality are modulated through energy allocation decisions made
early in life in a particular disease ecology. Definitive answers on this score
await further research.
The comparison between humans and chimpanzees suggests, however,
that species differences overwhelm differences in environmental conditions
in determining mortality hazards as individuals age. This finding suggests
that some differences in our respective genomes have resulted in basic dif-
ferences in rates of repair and tissue maintenance that manifest themselvesin physiological deterioration at older ages. When those differences are un-
derstood and then subjected to manipulation, the result may be changes in
human mortality distributions at old ages that greatly exceed those attribut-
able to disease treatment and assault prevention.
Appendix: The sample of societies
The Appendix describes each group in our sample, including the environmental
and historical conditions during the time period to which the data correspond, the
PDR 33.2 Gurven-Kaplan-FINAL.indd 354 5/22/07 2:16:54 PM
8/8/2019 Longevity Among Hunter-Gatherers
http://slidepdf.com/reader/full/longevity-among-hunter-gatherers 35/46
M I C H A E L GU R V E N / H I L L A R D KA P L A N 355
methodology used to collect the data, and the methodological strengths and weak-
nesses of each data set. Contemporary hunter-gatherers have been affected by global
socioeconomic forces and are not living replicas of our Stone Age ancestors. Eachgroup has been exposed to a particular set of historical, ecological, and political condi-
tions, and extant groups occupy only a small subset of the environments that foragers
occupied in the past. Thus, even without the variable impact of infectious diseases
and modernization, no single group can accurately represent all modern foragers or
pristine foragers typical of our ancestral past (see Solway and Lee 1990).
Isolation from outsiders, small-scale social structure, and absence of amenities
also characterize many incipient horticulturalist populations, many of whom also
engage in foraging. Remote populations of forager-horticulturalists therefore merit
attention. It is debatable whether transitions to agriculture always result in better
nutrition and uniform increases in survivorship among all age classes (Armelagos,
Goodman, and Jacobs 1991; Cockburn 1971; Cohen and Armelagos 1984). Incipientagriculturalists without modern amenities are an additional source of preindustrial
societies to supplement our foraging sample. Horticulture-based populations are
typically larger than foraging populations, which provides greater confidence in
mortality estimates at late ages.
Hunter-gatherers
The ethnographic record of hunter-gatherers includes hundreds of cultures, but only
about 50 groups have been studied. The sample of foraging societies presented here
does not adequately cover all geographical areas. Only five foraging societies have
been explicitly studied using demographic techniques—Hadza of Tanzania (BlurtonJones, Hawkes, and O’Connell 2002; Blurton Jones et al. 1992), Dobe !Kung (Howell
1979), Ache of Paraguay (Hill and Hurtado 1996), Agta of Philippines (Early and
Headland 1998), and Hiwi of Venezuela (Hill et al. 2007).
Nancy Howell’s Dobe !Kung study in the Kalahari desert of Botswana and Na-
mibia is one of the first and most impressive demographic accounts of a foraging
society. The majority of !Kung have been settled during the last 50 years and have
been rapidly acculturating in close association with nearby Herero and Tswana herd-
ers. At the time of her study in the 1960s, many of the adults had spent most of their
lives foraging, despite ethnohistorical evidence showing interactions with mercantile
interests in the nineteenth century and archaeological evidence suggesting trade with
pastoral and agricultural populations (see Solway and Lee 1990). An early !Kungsample refers to the period before the 1950s when the Bantu influence in the Dobe
area was minimal. Later !Kung samples refer to the prospective time of study when
the lifestyles of the !Kung were rapidly changing. In the 1970s, 454 people were liv-
ing in the study site. Two life tables are used from this period. One is based on the
94 deaths during the 11-year study period (Howell 1979: Table 4.4), and the other
uses the referent study population with a smaller number of deaths during the same
time period (ibid.: Table 4.6). Because the early !Kung sample clumps all adults aged
45 years and older into one category, we construct a composite early !Kung sample
by using mortality estimates for ages 40 and higher from Howell’s Table 4.4 and
combine this with mortality estimates for ages less than 30 from the “early” sample.
PDR 33.2 Gurven-Kaplan-FINAL.indd 355 5/22/07 2:16:54 PM
8/8/2019 Longevity Among Hunter-Gatherers
http://slidepdf.com/reader/full/longevity-among-hunter-gatherers 36/46
356 LONGEV ITY AMONG HUNTER -GATHERERS
Ages 30–39 years are modeled as an average of the mortality rates from both early
and prospective samples. Howell’s Table 4.6 is placed in the acculturated hunter-
gatherer category. Ages were determined through a combination of relative age lists,known ages of children and young adults, and application of stable age distribution
from a “West” Coale and Demeny (1966) model, an approach similar to that initi-
ated by Rose (1960).7
The Ache were full-time, mobile tropical forest hunter-gatherers until the
1970s. Kim Hill and Magdalena Hurtado (1996) separate Ache history into three
periods—a pre-contact “forest” period of pure foraging with no permanent peaceful
interactions with neighboring groups (before 1970), a “contact” period (1971–77) in
which epidemics had a profound influence on the population, and a recent “reserva-
tion” period in which Ache live as forager-horticulturalists in relatively permanent
settlements (1978–93). During this last period, the Ache have had some exposure
to modern health care. The pre-contact period shows marked population increase,resulting in part from the open niche that was a direct result of high adult mortality
among Paraguayan nationals during the Chaco War with Bolivia in the 1930s. No
life table is published for the high-mortality contact period, during which many old
and young died. Hill and Hurtado improve on Howell’s methods of age estimation
by using averaged informant-ranking of age, informant estimates of absolute age
differences between people, and polynomial regression of estimated year of birth on
age rank. Apart from living individuals, reproductive histories of a large sample of
adults produced the samples used for mortality analysis. At the time of study, there
were roughly 570 northern Ache.
The Hadza in the eastern rift valley of Tanzania were studied in the mid-1980s
by Nicholas Blurton Jones and colleagues. Trading with herders and horticultural-
ists has been sporadic among Hadza over the past century, and the overall quantity
of food coming from horticulturalists varies from 5 to 10 percent (Blurton Jones,
Hawkes, and O’Connell 2002). The Hadza have been exposed to settlement schemes
over the past 50 years, but none of these has proven very successful. The 1990s saw
a novel type of outsider intervention in the form of further habitat degradation and
“ethno-tourism” (ibid.). Although some Hadza have spent considerable time living
in a settlement with access to maize and other agricultural foods, most continue to
forage and rely on wild foods. Age estimation of the population was achieved using
relative age lists, a group of individuals of known ages, and polynomial regression.
Two censuses done about 15 years apart, with an accounting of all deaths during the
interim, allowed Blurton Jones to construct a life table and to show that sporadic
access to horticultural foods and other amenities cannot account for the mortality
profile. There were roughly 750 Hadza in the study population.
The Hiwi are neotropical savanna foragers of Venezuela studied by Hill and
Hurtado in the late 1980s (Hurtado and Hill 1987, 1990). They were contacted in
1959 when cattle ranchers began encroaching on their territory. Although living
in semi-permanent settlements, Hiwi continue to engage in violent conflict with
other Hiwi groups. At the time of study, almost their entire diet was wild foods, with
68 percent of calories coming from meat and 27 percent from roots, fruits, and an
arboreal legume. The study population contains 781 individuals. Nearby Guahibo-
speaking peoples practiced agriculture, but the Hiwi inhabited an area poorly suited
PDR 33.2 Gurven-Kaplan-FINAL.indd 356 5/22/07 2:16:54 PM
8/8/2019 Longevity Among Hunter-Gatherers
http://slidepdf.com/reader/full/longevity-among-hunter-gatherers 37/46
M I C H A E L GU R V E N / H I L L A R D KA P L A N 357
for agriculture. As among the Hadza, repeated attempts at agriculture by missionaries
or government schemes have failed among this group. Mortality information comes
from Hill et al. (2007).The Casiguran Agta of the Philippines are Negrito foragers studied by Tom Head-
land during 1962–86. They live on a peninsula close to mountainous river areas and
the ocean. There are 9,000 Agta in eastern Luzon territory, and demographic study
was focused on the San Ildefonso group of about 200 people (Early and Headland
1998). Although Luzon itself is isolated, Agta have maintained trading relationships
with lowlander horticulturalists for at least several centuries (Headland 1997). The
twentieth century introduced schooling and brief skirmishes during American and
Japanese occupation. Age estimation was achieved through reference to known
ages of living people and calendars of dated events. As in the Ache study, the Agta
demography is divided into a “forager” period (1950–65), a transitional period of
population decline (1966–80), and a “peasant” phase (1981–93). These last twophases are marked by guerilla warfare, and subjugation by loggers, miners, and
colonists. Abridged life tables are available for all three time periods. The age groups
given are broad (10 years for adult ages), and the last age category is 60+.
Forager-horticulturalists
The above five populations comprise the foraging sample because the typology
“hunter-gatherer” defines their mode of subsistence and its lack of reliance on do-
mesticated foods. To the forager sample described above, we add the Yanomamo of
Venezuela and Brazil, Tsimane of Bolivia, and Gainj of Papua New Guinea.
Yanomamo, Tsimane, and Machiguenga are forager-horticulturalist populationsin Amazonian South America. Several Yanomamo studies have been carried out
over the past 30 years. Although often construed as hunter-gatherers, Yanomamo
have practiced slash and burn horticulture of plantains for many generations (Cha-
gnon 1968). They live mostly in small villages of less than 50 people. The effects
on Yanomamo of the rubber boom and slave trade before the eighteenth century
were minimal (Ferguson 1995). They remained mostly isolated until missionary
contact in the late 1950s. The most complete demography comes from Early and
Peters (2000) based on prospective studies of eight villages in the Parima Highlands
of Brazil. Births and deaths were recorded by missionaries and FUNAI personnel
since 1959. The pre-contact period (1930–56) predates missionary and other outside
influence. The contact period (1957–60), “linkage” period (1961–81), and Brazilianperiod (1982–96) saw increased interaction with miners and Brazilian nationals and
increased incidence of infectious disease. Ages for Xilixana (Mucaj) during this period
were estimated using a chain of average interbirth intervals for people with at least
one sibling of known age, and relative age lists in combination with estimated inter-
birth intervals. Because it set a historical precedent, we include the Neel and Weiss
(1975) life table for Yanomamo based on 29 villages in Venezuela even though it
does not meet our inclusion criteria. It applies a best-fit model life table using census
data, a growth rate based on repeated censuses, and age-specific fertility. These cen-
suses were taken during the 1960s, and ages were obtained by averaging different
researchers’ independent estimates.
PDR 33.2 Gurven-Kaplan-FINAL.indd 357 5/22/07 2:16:55 PM
8/8/2019 Longevity Among Hunter-Gatherers
http://slidepdf.com/reader/full/longevity-among-hunter-gatherers 38/46
358 LONGEV ITY AMONG HUNTER -GATHERERS
The Tsimane inhabit tropical forest areas of the Bolivian lowlands, congregating
in small villages near large rivers and tributaries. Roughly 8,000 Tsimane live in
dispersed settlements in the Beni region. Tsimane have had sporadic contact withJesuit missionaries since before the eighteenth century, although they were never
successfully converted or settled. Evangelical and Catholic missionaries set up mis-
sions in the early 1950s and later trained some Tsimane to become teachers in the
more accessible villages. However, the daily influence of missionaries is minimal.
Market integration is increasing, as are interactions with loggers, merchants, and
colonists. Most Tsimane continue to fish, practice horticulture, and hunt and gather
for the bulk of their subsistence. The demographic sample used here is based on
reproductive histories collected by Gurven of 348 adults in 12 remote communities
during 2002–03. Changes in mortality are evident in the 1990s, hence mortality data
used here are restricted to the years 1950–89. Age estimation of older individuals
was done by a combination of written records of missionaries, relative age rankings,and photo and verbal comparison with individuals of known ages.
The Gainj are swidden horticulturalists of sweet potato, yams, and taro in the
central highland forests of northern Papua New Guinea. Meat is fairly rare (Johnson
1981). At the time of study by Patricia Johnson and James Wood in 1978–79 and
1982–83, 1,318 Gainj were living in 20 communities. Contact was fairly recent, in
1953, with formal pacification in 1963, and there is genetic and linguistic evidence
of their relative isolation (Wood et al. 1982). Prior to contact, population growth
had been zero for at least four generations (Wood and Smouse 1982). An A2 Hong
Kong influenza epidemic reduced the population by some 7 percent in 1969–70 and
probably accounts for the dearth of older people in this population. Data were ob-
tained from government censuses from 1970 to 1977; they include non-Gainj Kalam
speakers, and it is likely that age estimates are fraught with error for older adults (see
Wood and Smouse 1982). Additionally, published mortality estimates were already
fitted with a Brass two-parameter logit model.
Acculturated hunter-gatherers
In addition to the Ache reservation sample, Agta transitional and peasant samples,
and recent !Kung and Yanomamo samples, we include the Warao of Venezuela and
Northern Territory Aborigines into the acculturated hunter-gatherer category.
The Warao were traditional swamp foragers living in the Orinoco Delta in eastern
Venezuela. They remained isolated in the bogland of the Orinoco until the last cen-tury. Apart from the fauna common to most of tropical South America, the Warao
diet included products of the carbohydrate-rich sago palm. The Warao are included
here even though they were once foragers because at the time of study they were
practicing intensive agriculture. Oil exploration, colonist intrusion, and missionary
influence all affected Warao from the 1920s on and pushed them to live near more
accessible riverbanks. Increased sedentism and some access to modern health care
have probably improved infant and child mortality. Preliminary demographic data
were collected in 1954 by Johannes Wilbert (Wilbert and Layrisse 1980), but most
information was collected by H. Dieter Heinen from 1966 to 1976 (Layrisse, Heinen,
and Salas 1977). The sample covered 1,360 individuals. Age groups for adult ages
are ten years, and the last category is 50+.
PDR 33.2 Gurven-Kaplan-FINAL.indd 358 5/22/07 2:16:55 PM

8/8/2019 Longevity Among Hunter-Gatherers
http://slidepdf.com/reader/full/longevity-among-hunter-gatherers 39/46
M I C H A E L GU R V E N / H I L L A R D KA P L A N 359
The Northern Territory Australian Aborigine mortality data come from analysis of
vital registration from 1958 to 1960 by Frank Lancaster Jones (1963, 1965). At that
time, few Aborigines in the region remained full-time foragers. There was substantialage-clumping at five-year intervals, so a smoothing procedure was performed on the
population age distribution. It is likely that infant deaths and more remote-living in-
dividuals were underenumerated, and Lancaster Jones made adjustments to impute
missing deaths. We view these data with caution but include them because no other
reliable data exist for Australia, apart from the Tiwi sample, which was culled from
the same author and is also included here although it suffers from the same limita-
tions. We also include data by Crotty and Webb (1960) on causes of death based on
autopsy for 175 Northern Territory Aborigines during the same time period.
Notes
This article benefited from helpful comments
and conversations with Ed Bedrick, Tim
Gage, Kim Hill, Nancy Howell, Jamie Hol-
land Jones, and Robert Walker. Research was
supported by the National Science Founda-
tion (BCS-0422690) and the National Insti-
tutes of Health/National Institute on Aging
(#1R01AG024119-01).
1 Age-independent mortality (a2) is
not statistically significant for the Agta, but
initial adult mortality (a3) is about 150 times
greater than in other foragers. Part of thishigh effect is compensation due to the lack
of age-independent mortality among Agta
(Gage and Dyke 1986). Correspondingly, the
senescence rate (b3) is less than one-half that
of other foragers.
2 These analyses, however, did not
control for age-independent mortality (a2), a
factor which could bias Gompertz estimates
(Gavrilov and Gavrilova 2001).
3 A second approach to examining de-
partures from linear increases in mortality
hazards is to introduce a second-order age
term in the Gompertz model: lnh( x ) = a3+ b
3 x
+ b4 x 2. Of the most reliable cases, positive sta-
tistically significant values for b4are found for
Hadza, Ache, Hiwi, !Kung, Yanomamo, and
Tsimane, indicating that the hazard increases
at an increasing rate with age. Only the
settled Ache and recent !Kung did not show a
significant positive second-order term.
4 Indeed, Howell (1979) shows that the
estimated life expectancy of acculturated
!Kung based on this life table is about 50
years, which is ten years higher than the na-
tional estimate of Botswana during the same
time period.
5 In a stable age distribution, R0=exp(rT ),
where R0
is the net reproductive rate, r is
population growth rate, and T is the average
generation length, set here as 28 years. We
define R0≈R*l
25=TFR/2.06*l
25, where TFR is
the total fertility rate. Based on a regression of
l 25
on l 15
, we estimate l 25
as 0.9973*l 15
– 0.0422
(R
2
=0.98, p<0.0001). These equations allowthe construction of approximate iso-growth
curves as a function of TFR and l 15
.
6 These include the Ngamiland Ju’/ho-
ansi (l 15
=0.66) (Harpending and Wandsnider
1982), Greenland Inuit (0.55), Chenchu
(0.51) (cited in Hewlett 1991), Aka Pygmies
(0.55) (Bahuchet 1979), Bofi Pygmies (0.59)
(Fouts, Hewlett, and Lamb 2005), Mbuti
Pygmies (0.44) (Harako 1981), Batak (0.48)
(Eder 1987), Australian Aborigines (0.55),
and Seri (0.39) (cited in Weiss 1973). 7 There is not a very large difference be-
tween our composite “early” !Kung sample
and the early sample employed by Howell
that includes model life table estimates for
mortality rates for ages over 40. For example,
l 45
=0.37 (vs. 0.40 for the composite), e45
=23.2
(vs. 21.2), l 65
=0.21 (vs 0.21), e65
=13.2 (vs.
9.1).
PDR 33.2 Gurven-Kaplan-FINAL.indd 359 5/22/07 2:16:55 PM
8/8/2019 Longevity Among Hunter-Gatherers
http://slidepdf.com/reader/full/longevity-among-hunter-gatherers 40/46
360 LONGEV ITY AMONG HUNTER -GATHERERS
References
Armelagos, G. J., A. H. Goodman, and K. Jacobs. 1991. “The origins of agriculture: Populationgrowth during a period of declining health,” Population and Environment 13: 9–22.
Bahuchet, S. (ed.). 1979. Pygmées de Centrafrique: études ethnologiques, historiques et linguistiques sur
les Pygmées “BaMbenga” du Nord-Ouest du bassin congolais. Paris: SELAF.
Barker, D. J. P. and C. Osmond. 1986. “Infant mortality, childhood nutrition, and ischaemic
heart disease in England and Wales 1986,” Lancet i: 1077–1081.
Beise, J. and E. Voland. 2002. “A multilevel event history analysis of the effects of grandmoth-
ers on child mortality in a historical German population: Krummhörn, Ostfriesland,
1720–1874,” Demographic Research 7: 469–498.
Bengtsson, T. and M. Lindström. 2000. “Childhood misery and disease in later life: The effects
on mortality in old age of hazards experienced in early life, southern Sweden, 1760–1894,”
Population Studies 54: 263–277.
Berkeley Mortality Database. Berkeley: University of California. «http://www.mortality.org».
Binford, L. R. and W. J. J. Chasko. 1976. “Nunamiut demographic history: A provocative case,”in Demographic Anthropology: Quantitative Approaches. Albuquerque: University of New
Mexico, pp. 63–143.
Black, F. L. 1975. “Infectious disease in primitive societies,” Science 187: 515–518.
Blackwell, D. L., M. D. Hayward, and E. M. Crimmins. 2001. “Does childhood health affect
chronic morbidity in later life?,” Social Science & Medicine 52: 1269–1284.
Blurton Jones, N. G., K. Hawkes, and J. O’Connell. 2002. “The antiquity of postreproductive
life: Are there modern impacts on hunter-gatherer postreproductive lifespans?,” Human
Biology 14: 184–205.
Blurton Jones, N. G., J. F. O’Connell, K. Hawkes, C. L. Kamuzora, and L. C. Smith. 1992. “De-
mography of the Hadza, an increasing and high density population of savanna foragers,”
American Journal of Physical Anthropology 89: 159–181.
Brainard, J. 1986. “Differential mortality in Turkana agriculturalists and pastoralists,” American
Journal of Physical Anthropology 70: 525–536.Buikstra, J. E. 1997. “Paleodemography: Context and promise,” in R. R. Paine (ed.), Integrating
Archaeological Demography: Multidisciplinary Approaches to Prehistoric Population. Carbondale,
IL: Center for Archaeological Investigations, pp. 367–380.
Buikstra, J. E. and L. W. Konigsberg. 1985. “Paleodemography: Critiques and controversies,”
American Anthropologist 87: 316–333.
Cameron, N. and E. W. Demerath. 2002. “Critical periods in human growth and their relation-
ship to diseases of aging,” American Journal of Physical Anthropology 35(Suppl.): 159–184.
Caspari, R. and S.-H. Lee. 2004. “Older age becomes common late in human evolution,” Proceed-
ings of the National Academy of Sciences of the United States of America 101: 10895–10900.
Chagnon, N. 1968. Yanomamo: The Fierce People. New York: Holt, Rinehart and Winston.
Cheung, S. L. K., J.-M. Robine, E. Jow-Ching, and G. Caselli. 2005. “Three dimensions of the
survival curve: Horizontalization, verticalization, and longevity extension,” Demography
42: 243–258.
Coale, A. J. and P. Demeny. 1966. Regional Model Life Tables and Stable Populations. Princeton:
Princeton University Press.
Cockburn, T. A. 1971. “Infectious diseases in ancient populations,” Current Anthropology 12:
45–62.
Cohen, M. N. and G. J. Armelagos. 1984. “Paleopathology at the origins of agriculture: Editor’s
summation. [Conference on Paleopathology and Socioeconomic Change at the Origins
of Agriculture],” in M. N. Cohen and G. J. Armelagos (eds.), Paleopathology at the Origins
of Agriculture. Orlando: Academic Press, pp. 585–601.
Costa, D. L. 2000. “Understanding the twentieth-century decline in chronic conditions among
older men,” Demography 37: 53–72.
Crotty, J. M. and R. C. Webb. 1960. “Mortality in Northern Territory aborigines,” Medical Journal
of Australia 47: 489–492.
PDR 33.2 Gurven-Kaplan-FINAL.indd 360 5/22/07 2:16:56 PM
8/8/2019 Longevity Among Hunter-Gatherers
http://slidepdf.com/reader/full/longevity-among-hunter-gatherers 41/46
M I C H A E L GU R V E N / H I L L A R D KA P L A N 361
Cutler, R. 1975. “Evolution of human longevity and the genetic complexity governing ag-
ing rate,” Proceedings of the National Academy of Science of the United States of America 72:
664–668.
Dunn, F. L. 1968. “Epidemiological factors: Health and disease in hunter-gatherers,” in R. B.
Lee and I. DeVore (eds.), Man the Hunter . Chicago: Aldine.
Dyke, B., T. B. Gage, P. L. Alford, B. Senson, and S. Williams-Blangero. 1995. “A model life
table for captive chimpanzees,” American Journal of Primatology 37: 25–37.
Early, J. D. and T. N. Headland. 1998. Population Dynamics of a Philippine Rain Forest People: The
San Ildefonso Agta. Gainesville: University Press of Florida.
Early, J. D. and J. F. Peters. 2000. The Xilixana Yanomami of the Amazon: History, Social Structure,
and Population Dynamics. Gainsville: University Press of Florida.
Eaton, S. B. et al. 1994. “Women’s reproductive cancers in evolutionary context,” Quarterly
Review of Biology 69: 353–367.
Eaton, S. B., M. J. Konner, and M. Shostak. 1988. “Stone agers in the fast lane: Chronic degen-
erative diseases in evolutionary perspective,” American Journal of Medicine 84: 739–749.
Eder, J. F. 1987. On the Road to Tribal Extinction: Depopulation, Deculturation, and Adaptive Well-Beingamong the Batak of the Philippines. Berkeley: University of California Press.
Elo, I. T. and S. H. Preston. 1992. “Effects of early-life conditions on adult mortality: A review,”
Population Index 58: 186–212.
Ferguson, R. B. 1995. Yanomami Warfare: A Political History. Santa Fe: School for American
Research Press.
Finch, C. E. and E. M. Crimmins. 2004. “Inflammatory exposure and historical changes in hu-
man life-spans,” Science 305: 1736–1739.
Finch, C. E., M. C. Pike, and M. Whitten. 1990. “Slow mortality rate accelerations during aging
in animals approximate that of humans,” Science 249: 902–905.
Fogel, R. W. and D. L. Costa. 1997. “A theory of technophysio evolution, with some implications
for forecasting population, health care costs, and pension costs,” Demography 34: 49–66.
Fouts, H. N., B. S. Hewlett, and M. E. Lamb. 2005. “Parent-offspring weaning conflicts among
the Bofi farmers and foragers of Central Africa,” Current Anthropology 46: 29–50.Fries, J. F. 1989. “The compression of morbidity: Near or far?,” Milbank Quarterly 67: 208–
232.
Gage, T. B. 1989. “Bio-mathematical approaches to the study of human variation in mortality,”
Yearbook of Physical Anthropology 32: 185–214.
———. 1991. “Causes of death and the components of mortality: Testing the biological interpre-
tations of a competing hazards model,” American Journal of Human Biology 3: 289–300.
———. 1998. “The comparative demography of primates: With some comments on the evolu-
tion of life histories,” Annual Review of Anthropology 27: 197–221.
Gage, T. B. and B. Dyke. 1986. “Parameterizing abridged mortality tables: The Siler three-com-
ponent hazard model,” Human Biology 58: 275–291.
Gavrilov, L. A. and N. S. Gavrilova. 1991. The Biology of the Lifespan: A Quantitative Approach. New
York: Harwood Academic.
———. 2001. “The reliability theory of aging and longevity,” Journal of Theoretical Biology 213:
527–545.
Gurven, M. D. and H. S. Kaplan. 2006. “Determinants of time allocation to production across
the lifespan among the Machiguenga and Piro Indians of Peru,” Human Nature 17:
1–49. Gurven, M., H. Kaplan, and A. Zelada. 2007 “Mortality experience of Tsimane Amerindians of
Bolivia: Regional and temporal trends,” American Journal of Human Biology 19: 376–398.
Haldane, J. B. S. 1942. New Paths in Genetics. London: Harper and Brothers.
Hamilton, W. D. 1966. “The molding of senescence by natural selection,” Journal of Theoretical
Biology 12: 12–45.
Harako, R. 1981. “The cultural ecology of hunting behavior among the Mbuti Pygmies in the
Ituri Forest, Zaïre,” in R. S. O. Harding and G. Teleki (eds.), Omnivorous Primates: Gathering
and Hunting in Human Evolution. New York: Columbia University Press, pp. 499–555.
PDR 33.2 Gurven-Kaplan-FINAL.indd 361 5/22/07 2:16:56 PM

8/8/2019 Longevity Among Hunter-Gatherers
http://slidepdf.com/reader/full/longevity-among-hunter-gatherers 42/46
362 LONGEV ITY AMONG HUNTER -GATHERERS
Harpending, H. C. and L. Wandsnider. 1982. “Population structures of Ghanzi and Ngamiland
!Kung,” Current Developments in Anthropological Genetics 2: 29–50.
Hawkes, K. and J. O’Connell. 2005. “How old is human longevity?,” Journal of Human Evolution
49: 650–653.
Hawkes, K., J. F. O’Connell, N. G. Blurton Jones, H. Alvarez, and E. L. Charnov. 1998. “Grand-
mothering, menopause, and the evolution of human life histories,” Proceedings of the
National Academy of Sciences of the United States of America 95(3): 1336–1339. Headland, T. N. 1997. “Revisionism in ecological anthropology,” Current Anthropology 38:
605–630.
Herrmann, N. P. and L. W. Konigsberg. 2002. “A re-examination of the age-at-death distribution
of Indian Knoll,” in R. D. Hoppa and J. W. Vaupel (eds.), Paleodemography: Age Distributions
from Skeletal Samples . Cambridge: Cambridge University Press, pp. 243–257.
Hewlett, B. S. 1991. “Demography and childcare in preindustrial societies,” Journal of Anthro-
pological Research 47: 1–37.
Hewlett, B. S., J. M. H. van de Koppel, and M. van de Koppel. 1986. “Causes of death among
Aka pygmies of the Central African Republic,” in L. L. Cavalli Sforza (ed.), African Pygmies.New York: Academic Press.
Hill, K. et al. 2001. “Mortality rates among wild chimpanzees,” Journal of Human Evolution 40:
437–450.
Hill, K. and A. M. Hurtado. 1991. “The evolution of reproductive senescence and menopause
in human females,” Human Nature 2: 315–350.
———. 1996. Ache Life History: The Ecology and Demography of a Foraging People. New York: Aldine
de Gruyter.
Hill, K., A. M. Hurtado, and R. Walker. 2007. “High adult mortality among Hiwi hunter-gather-
ers: Implications for human evolution,” Journal of Human Evolution 52: 443–454. Hoppa, R. D. and J. W. Vaupel (eds.). 2002. Paleodemography: Age Distributions from Skeletal
Samples. Cambridge: Cambridge University Press.
Howell, N. 1976. “Toward a uniformitarian theory of human paleodemography,” in R. H.
Ward and K. M. Weiss (eds.), The Demographic Evolution of Human Populations. New York:Academic Press, pp. 25–40.
———. 1979. Demography of the Dobe !Kung. New York: Academic Press.
Human Mortality Database. University of California, Berkeley (USA), and Max Planck Institute
for Demographic Research (Germany). Available at «www.mortality.org». Downloaded
8 May 2005.
Hurtado, A. M. and K. R. Hill. 1987. “Early dry season subsistence ecology of the Cuiva foragers
of Venezuela,” Human Ecology 15: 163–187.
———. 1990. “Seasonality in a foraging society: Variation in diet, work effort, fertility, and the
sexual division of labor among the Hiwi of Venezuela,” Journal of Anthropological Research
46: 293–345.
Jamison, C., L. Cornell, P. Jamison, and H. Nakazato. 2002. “Are all grandmothers equal? A re-
view and a preliminary test of the grandmother hypothesis in Tokugawa Japan,” American
Journal of Physical Anthropology 119: 67–76.
Johnson, P. L. 1981. “When dying is better than living: Female suicide among the Gainj of Papua
New Guinea,” Ethnology 20: 325–334.
Kannisto, V. 2001. “Mode and dispersion of the length of life,” Population: An English Selection
13: 159–171.
Kaplan, H. S. 1997. “The evolution of the human life course,” in K. Wachter and C. Finch (eds.),
Between Zeus and Salmon: The Biodemography of Aging. Washington, DC: National Academy
of Sciences, pp. 175–211.
Kaplan, H. S., K. Hill, A. M. Hurtado, J. Lancaster, and A. J. Robson. 2001. Embodied Capital and
the Evolutionary Economics of the Human Lifespan. Albuquerque: University of New Mexico.
Kaplan, H. S., K. Hill, J. B. Lancaster, and A. M. Hurtado. 2000. “A theory of human life history
evolution: Diet, intelligence, and longevity,” Evolutionary Anthropology 9: 156–185.
PDR 33.2 Gurven-Kaplan-FINAL.indd 362 5/22/07 2:16:56 PM
8/8/2019 Longevity Among Hunter-Gatherers
http://slidepdf.com/reader/full/longevity-among-hunter-gatherers 43/46
M I C H A E L GU R V E N / H I L L A R D KA P L A N 363
Kaplan, H. S. and A. J. Robson. 2002. “The emergence of humans: The coevolution of intel-
ligence and longevity with intergenerational transfers,” Proceedings of the National Academy
of Sciences of the United States of America 99: 10221–10226.
Kelly, R. L. 1995. The Foraging Spectrum: Diversity in Hunter-Gatherer Lifeways. Washington, DC:
Smithsonian Institution Press.
Kennedy, G. E. 2003. “Palaeolithic grandmothers? Life history theory and early Homo,” Journal
of the Royal Anthropological Institute 9: 549–572.
King, J. L. and T. H. Jukes. 1969. “Non-Darwinian evolution,” Science 164: 788–798.
Konigsberg, L. W. and N. P. Herrmann. 2006. “The osteological evidence for human longevity
in the recent past,” in K. Hawkes and R. R. Paine (eds.), The Evolution of Human Life History.
Santa Fe: School of American Research Press, pp. 267–306.
Kuh, D. and Y. Ben-Shlomo. 1997. A Life Course Approach to Chronic Disease Epidemiology. Oxford:
Oxford University Press.
Lahdenpera, M., V. Lummaa, S. Helle, T. Marc, and R. A. F. 2004. “Fitness benefits of prolonged
post-reproductive lifespan in women,” Nature 428: 178–181. Lancaster, J. B. and B. J. King. 1985. “An evolutionary perspective on menopause,” in V. Kernsand J. K. Brown (eds.), In Her Prime: A New View of Middle-Aged Women. S. Hadley, MA:
Bergin and Garvey, pp. 13–20.
Lancaster Jones, F. 1963. A Demographic Survey of the Aboriginal Population of the Northern Territory,
with Special Reference to Bathurst Island Mission. Canberra: Australian Institute of Aboriginal
Studies.
———. 1965. “The demography of the Australian Aborigines,” International Social Science Journal
17: 232–245.
Layrisse, M., H. D. Heinen, and G. Salas. 1977. “Demografía de los indígenas Warao,” Antrop-
ológica 46: 45–69.
Layrisse, M., G. Salas, and H. D. Heinen. 1980. “Vital statistics of five Warao subtribes,” in Jo-
hannes Wilbert and Miguel Layrisse (eds.), Demographic and Biological Studies of the Warao
Indians. Los Angeles: UCLA Latin American Center, pp. 60–69.
Lee, R. D. 2003. “Rethinking the evolutionary theory of aging: Transfers, not births, shape se-nescence in social species,” Proceedings of the National Academy of Sciences of the United States
of America 100: 9637–9642.
Lexis, W. 1878. “Sur la durée normale de la vie humaine et sur la théorie de la stabilité des
rapports statistiques,” Annales de démographie internationale 2: 447–462.
Lovejoy, C. O. et al. 1977. “Paleodemography of the Libben site, Ottawa County, Ohio,” Science
198: 291–293.
Makeham, W. M. 1860. “On the law of mortality and the construction of annuity tables,” Journal
of the Institute of Actuaries 8: 301–310.
Medawar, P. B. 1952. An Unsolved Problem in Biology . London: Lewis.
Mensforth, R. 1990. “Paleodemography of the Carlston-Annis [Bt-5] late archaic skeletal popu-
lation,” American Journal of Physical Anthropology 82: 81–99.
Neel, J. V. and K. M. Weiss. 1975. “The genetic structure of a tribal population, the Yanomama
Indian,” American Journal of Physical Anthropology 42: 25–52.
O’Connell, J. F., K. Hawkes, and N. G. Blurton Jones. 1999. “Grandmothering and the evolution
of Homo erectus,” Journal of Human Evolution 36: 461–485.
Oeppen, J. and J. W. Vaupel. 2003. “Broken limits to life expectancy,” Science 296: 1029–
1031.
Olshansky, S. J. and B. A. Carnes. 1997. “Ever since Gompertz,” Demography 34: 1–15.
Packer, C. M. Tatar, and A. Collins. 1998. “Reproductive cessation in female mammals,” Nature
392: 807–811.
Peccei, J. S. 2001. “Menopause: Adaptation or epiphenomenon?,” Evolutionary Anthropology
10: 43–57.
Pennington, R. L. 1996. “Causes of early human population growth,” American Journal of Physi-
cal Anthropology 99: 259–274.
PDR 33.2 Gurven-Kaplan-FINAL.indd 363 5/22/07 2:16:57 PM
8/8/2019 Longevity Among Hunter-Gatherers
http://slidepdf.com/reader/full/longevity-among-hunter-gatherers 44/46
364 LONGEV ITY AMONG HUNTER -GATHERERS
———. 2001. “Hunter-gatherer demography,” in C. Panter-Brick, R. Layton, and P. Rowley-
Conwy (eds.), Hunter-Gatherers: An Interdisciplinary Perspective. Cambridge: Cambridge
University Press, pp. 170–204.
Pennington, R. L. and H. Harpending. 1993. The Structure of an African Pastoralist Community:
Demography, History, and Ecology of the Ngamiland Herero. Oxford: Clarendon Press.
Picchi, D. 1994. “Observations about a central Brazilian indigenous population: The Bakairi,”
South American Indian Studies 4: 37–46.
Ribeiro, D. 1967. “Indigenous cultures and languages of Brazil,” in J. H. Hopper (ed.), Indians
of Brazil in the Twentieth Century. Washington, DC: Institute for Cross-Cultural Research,
pp. 77–166.
Richerson, P. J., R. L. Bettinger, and R. Boyd. 2005. “Evolution on a restless planet: Were envi-
ronmental variability and environmental change major drivers of human evolution?,” in
F. M. Wuketits and F. J. Ayala (eds.), Handbook of Evolution, Vol. 2: The Evolution of Living
Systems. Weinheim, Germany: Wiley-VCH.
Ricklefs, R. and A. Scheuerlein. 2002. “Biological implications of the Weibull and Gompertz
models of aging,” Journal of Gerontology Biological Sciences 57A: B69–B76.Riggs, J. E. 1990. Longitudinal Gompertzian analysis of adult mortality in the US, 1900–1986,”
Mechanisms of Ageing and Development 54: 235–247.
Riggs, J. E., G. R. Hobbs, and R. Gerald. 1998. “Nonrandom sequence of slope-intercept esti-
mates in longitudinal Gompertzian analysis suggests biological relevance,” Mechanisms of
Ageing and Development 100: 269–275.
Riggs, J. E. and R. J. Millecchia. 1992. “Using the Gompertz-Strehler model of aging and mor-
tality to explain mortality trends in industrialized countries,” Mechanisms of Ageing and
Development 65: 217–228.
Riley, J. 2001. Rising Life Expectancy: A Global History. Cambridge: Cambridge University Press.
Rose, F. G. G. 1960. Classification of Kin, Age Structure and Marriage Amongst the Groote Eylandt
Aborigines. Oxford: Pergamon Press.
Rose, M. R. 1991. Evolutionary Biology of Aging. New York: Oxford University Press.
Roth, E. A. 1981. “Sedentism and changing fertility patterns in a northern Athapascan isolate,”Journal of Human Evolution 10: 413–425.
Roth, E. A. and A. K. Ray. 1985. “Demographic patterns of sedentary and nomadic Juang of
Orissa,” Human Biology 57: 319–325.
Salzano, F. M. and S. M. Callegari-Jacques. 1988. South American Indians: A Case Study in Evolu-
tion. Oxford: Clarendon Press.
Sear, R., R. Mace, and I. A. McGregor. 2000. “Maternal grandmothers improve the nutritional
status and survival of children in rural Gambia,” Proceedings of the Royal Society of London,
Series B 267: 1641–1647.
Sear, R., F. Steele, I. A. McGregor, and R. Mace. 2002. “The effects of kin on child mortality in
rural Gambia,” Demography 39: 43–63.
Shock, N. W. 1981. “Indices of functional age,” in D. Danon, N. W. Shock, and M. Marois (eds.),
Aging: A Challenge to Science and Society. Oxford: Oxford University Press, pp. 302–319.
Siler, W. 1979. “A competing-risk model for animal mortality,” Ecology 60: 750–757.
Solway, J. S. and R. B. Lee. 1990. “Foragers, genuine or spurious?: Situating the Kalahari San
in history,” Current Anthropology 31: 109–146.
Strehler, B. L. and A. S. Mildvan. 1960. “General theory of mortality and aging,” Science 132:
14–21.United Nations. 2007. World Population Prospects: The 2006 Revision. Population database «http://
esa.un.org/unpp/».
Vallois, H. V. 1961. “The social life of early man: The evidence of skeletons,” in S. L. Washburn
(ed.), Social Life of Early Man. Chicago: Aldine de Gruyter, pp. 214–235.
Vaupel, J. W. 1997. “The remarkable improvements in survival at older ages,” Philosophical
Transactions of the Royal Society of London, B 352: 1799–1804.
Walker, P. L., J. R. Johnson, and P. M. Lambert. 1988. “Age and sex biases in the preservation
of human skeletal remains,” American Journal of Physical Anthropology 76: 183–188.
PDR 33.2 Gurven-Kaplan-FINAL.indd 364 5/22/07 2:16:57 PM
8/8/2019 Longevity Among Hunter-Gatherers
http://slidepdf.com/reader/full/longevity-among-hunter-gatherers 45/46
M I C H A E L GU R V E N / H I L L A R D KA P L A N 365
Wang, E. T., G. Kodama, P. Baldi, and R. K. Moyzis. 2006. “Global landscape of recent inferred
Darwinian selection for Homo sapiens,” Proceedings of the National Academy of Sciences of the
United States of America 103: 135–140.
Weale, R. A. 2004. “Biorepair mechanisms and longevity,” Journal of Gerontology 59A: 449–
454.
Weiss, K. M. 1973. Demographic Models for Anthropology: Memoirs of the Society for American Archae-
ology, 27. American Antiquity , 38.
———. 1981. “Evolutionary perspectives on human aging,” in P. Amoss and S. Harrell (eds.),
Other Ways of Growing Old . Stanford: Stanford University Press, pp. 25–28.
———. 1989. “Are the known chronic diseases related to the human lifespan and its evolu-
tion?,” American Journal of Human Biology 1: 307–319.
Wilbert, J. and M. Layrisse (eds.). 1980. Demographic and Biological Studies of the Warao Indians.
Los Angeles: UCLA Latin American Center Publications.
Williams, G. C. 1957. “Pleitropy, natural selection and the evolution of senescence,” Evolution
11: 398–411.
Wilmoth, J. R. 1998. “The future of human longevity: A demographer’s perspective,” Science 280: 281–295.
Wilmoth, J. R., J. Vallin, and G. Caselli. 1990. “When does a cohort’s mortality differ from what
we might expect?,” Population: An English Selection 2: 93–126.
Wood, J. W. 1980. “Mechanisms of demographic equilibrium in a small human population, the
Gainj of Papua New Guinea,” Ph.D. dissertation, University of Michigan.
———. 1987. “The genetic demography of the Gainj of Papua New Guinea. 2. Determinants of
effective population size,” American Naturalist 129(2): 165–187.
Wood, J. W. et al. 1982. “The genetic demography of the Gainj of Papua New Guinea. I. Local
differentiation of blood group, red cell enzyme, and serum protein allele frequencies,”
American Journal of Physical Anthropology 57: 15–25.
Wood, J. W., D. J. Holman, K. A. O’Connor, and R. J. Ferrell. 2002. “Mortality models for pa-
leodemography,” in R. D. Hoppa and J. W. Vaupel (eds.), Paleodemography: Age Distributions
from Skeletal Samples . Cambridge: Cambridge University Press, pp. 129–168.Wood, J. W. and P. E. Smouse. 1982. “A method of analyzing density-dependent vital rates
with an application to the Gainj of Papua New Guinea,” American Journal of Physical An-
thropology 58: 403–411.
Wood, J. W., S. C. Weeks, G. R. Bentley, and K. M. Weiss. 1994. “Human population biology
and the evolution of aging,” in D. E. Crews and R. M. Garruto (eds.), Biological Anthropology
and Aging: Perspectives on Human Variation over the Life Span. New York: Oxford University
Press, pp. 19–75.
Yashin, A. I., A. S. Begun, S. I. Boiko, S. V. Ukraintseva, and J. Oeppen. 2001. “The new trends
in survival improvement require a revision of traditional gerontological concepts,” Experi-
mental Gerontology 37: 157-167.
PDR 33.2 Gurven-Kaplan-FINAL.indd 365 5/22/07 2:16:57 PM

8/8/2019 Longevity Among Hunter-Gatherers
http://slidepdf.com/reader/full/longevity-among-hunter-gatherers 46/46