longitudinal models for quantifying disease and...
TRANSCRIPT
ACTAUNIVERSITATIS
UPSALIENSISUPPSALA
2017
Digital Comprehensive Summaries of Uppsala Dissertationsfrom the Faculty of Pharmacy 225
Longitudinal Models forQuantifying Disease andTherapeutic Response in MultipleSclerosis
ANA M. NOVAKOVIC
ISSN 1651-6192ISBN 978-91-554-9836-8urn:nbn:se:uu:diva-316562
Dissertation presented at Uppsala University to be publicly examined in B42, BiomedicinsktCentrum, Husargatan 3, Uppsala, Friday, 21 April 2017 at 09:15 for the degree of Doctor ofPhilosophy (Faculty of Pharmacy). The examination will be conducted in English. Facultyexaminer: PhD Etienne Pigeolet (Novartis).
AbstractNovakovic, A. M. 2017. Longitudinal Models for Quantifying Disease and TherapeuticResponse in Multiple Sclerosis. Digital Comprehensive Summaries of Uppsala Dissertationsfrom the Faculty of Pharmacy 225. 71 pp. Uppsala: Acta Universitatis Upsaliensis.ISBN 978-91-554-9836-8.
Treatment of patients with multiple sclerosis (MS) and development of new therapies have beenchallenging due to the disease complexity and slow progression, and the limited sensitivity ofavailable clinical outcomes. Modeling and simulation has become an increasingly importantcomponent in drug development and in post-marketing optimization of use of medication.This thesis focuses on development of pharmacometric models for characterization andquantification of the relationships between drug exposure, biomarkers and clinical endpoints inrelapse-remitting MS (RRMS) following cladribine treatment.
A population pharmacokinetic model of cladribine and its main metabolite, 2-chloroadenine,was developed using plasma and urine data. The renal clearance of cladribine was close to halfof total elimination, and was found to be a linear function of creatinine clearance (CRCL).
Exposure-response models could quantify a clear effect of cladribine tablets on absolutelymphocyte count (ALC), burden of disease (BoD), expanded disability status scale (EDSS) andrelapse rate (RR) endpoints. Moreover, they gave insight into disease progression of RRMS.
This thesis further demonstrates how integrated modeling framework allows an understandingof the interplay between ALC and clinical efficacy endpoints. ALC was found to be a promisingpredictor of RR. Moreover, ALC and BoD were identified as predictors of EDSS time-course.This enables the understanding of the behavior of the key outcomes necessary for the successfuldevelopment of long-awaited MS therapies, as well as how these outcomes correlate with eachother.
The item response theory (IRT) methodology, an alternative approach for analysingcomposite scores, enabled to quantify the information content of the individual EDSScomponents, which could help improve this scale. In addition, IRT also proved capable ofincreasing the detection power of potential drug effects in clinical trials, which may enhancedrug development efficiency.
The developed nonlinear mixed-effects models offer a platform for the quantitativeunderstanding of the biomarker(s)/clinical endpoint relationship, disease progression andtherapeutic response in RRMS by integrating a significant amount of knowledge and data.
Keywords: nonlinear mixed-effects models, pharmacometrics, NONMEM, multiple sclerosis,cladribine, EDSS, item response theory, relapse rate, absolute lymphocyte count, total volumeT2 lesions, burden of disease, power, sample size
Ana M. Novakovic, Department of Pharmaceutical Biosciences, Box 591, Uppsala University,SE-75124 Uppsala, Sweden.
© Ana M. Novakovic 2017
ISSN 1651-6192ISBN 978-91-554-9836-8urn:nbn:se:uu:diva-316562 (http://urn.kb.se/resolve?urn=urn:nbn:se:uu:diva-316562)

Različitost je osnova bez koje nema evolucije. [Diversity is the foundation of evolution.] Prof Dr Nikola Tucić, geneticist
To my family

List of Papers
This thesis is based on the following papers, which are referred to in the text by their Roman numerals.
I Savic R, Novakovic AM, Ekblom M, Munafo A, Karlsson MO.
Population pharmacokinetics of cladribine in patients with mul-tiple sclerosis. Clinical Pharmacokinetics, E-pub ahead of print.
II Novakovic AM, Thorsted A, Schindler E, Jönsson S, Munafo A, Karlsson MO. Pharmacometric analysis of the relationship be-tween absolute lymphocyte count, and expanded disability status scale and relapse rate, efficacy endpoints in multiple sclerosis tri-als. In manuscript.
III Novakovic AM, Krekels EHJ, Munafo A, Ueckert S, Karlsson
MO. Application of item response theory to modeling of ex-panded disability status scale in multiple sclerosis. AAPS J (2017) 19:172-179.
IV Novakovic AM, Plan E, Munafo A, Karlsson MO. Clinical trial features affecting power to detect drug effect: application of Item Response Theory model to longitudinal expanded disability sta-tus scale data in multiple sclerosis. Submitted.
V Novakovic AM, Ueckert S, Munafo A, Karlsson MO. A longitu-dinal model linking absolute lymphocyte count and volume of T2 lesions to expanded disability status scale in relapse-remitting multiple sclerosis patients. In manuscript.
Reprints were made with permission from the respective publishers.

Contents
Introduction ................................................................................................... 11 Pharmacometrics ...................................................................................... 11
Non-linear mixed effects models ......................................................... 11 Maximum likelihood estimation .......................................................... 12 Item response theory ............................................................................ 13 Hypothesis testing and statistical power .............................................. 14
Multiple sclerosis ..................................................................................... 16 Epidemiology and etiology .................................................................. 16 Pathophysiology .................................................................................. 16 Treatment ............................................................................................. 16 Biomarkers and clinical endpoints ....................................................... 18 Drug development ............................................................................... 20
Modeling and Simulation in multiple sclerosis ........................................ 21
Aims .............................................................................................................. 23
Methods ........................................................................................................ 25 Study designs and data ............................................................................. 25
Pharmacokinetics of cladribine ............................................................ 25 Pharmacodynamics of cladribine ......................................................... 26
Software ................................................................................................... 28 PKPD model development and estimation ............................................... 28 Item information ....................................................................................... 31 Power estimation ...................................................................................... 31
Results and Discussion ................................................................................. 33 Population PK of cladribine (Paper I) ...................................................... 33 Population PD of cladribine (Paper II-III) ............................................... 36
ALC ..................................................................................................... 37 Relapse rate .......................................................................................... 38 BoD ...................................................................................................... 41 EDSS ................................................................................................... 42
Biomarker driven endpoint models (Paper II,V) ...................................... 47 ALC-RR ............................................................................................... 47 ALC-BoD ............................................................................................ 49 ALC-EDSS .......................................................................................... 50 Model predictions ................................................................................ 52

ALC-BoD-EDSS ................................................................................. 53 Demonstration IRT benefits (Paper III-IV) .............................................. 56
Item information content ..................................................................... 56 Power assessment ................................................................................ 57
Conclusions and future perspectives ............................................................. 60
Acknowledgements ....................................................................................... 63
References ..................................................................................................... 65
Abbreviations
5’-NTase ALC ARR BoD CAde CAMBS CdA CL CLR CLNR CLCR
CLA CLA EXT CNS DCK DNA EDSS EMA EXNB FO(I) FOCE(I) FREM Gd H0 H1
HRQOL ICC IIV IPP IPPSE IRT i.v. LRT MBDD MC MCMP
5’-Nucleotidase Absolute Lymphocyte Count Annualized Relapse Rate Burden of Disease 2-chloroadenine Cambridge Multiple Sclerosis Basic Score Cladribine Clearance Renal clearance Non-renal clearance Creatinine clearance CLARITY CLARITY EXTENSION Central Nervous System Deoxycytidine Kinase Deoxyribonucleic Acid Expanded Disability Status Scale European Medicines Agency Number of relapses in the preceding year First-Order (with Interaction) First-Order Conditional Estimation (with Interaction) Full Random Effect Models Gadolinium Null Hypothesis Alternative Hypothesis Health-Related Quality of Life Item Characteristic Curves Inter-individual Variability Individual Pharmacokinetic Parameters IPP and their Standard Errors Item Response Theory Intra-venous Likelihood Ratio Test Model Based Drug Development Monte Carlo Monte Carlo Mapped Power

MID3 ML MSD MRI MS MSFC NLME OFV PD PK PsN RR RRMS RSE RTTE S1PR SD SIR SSE TIW TTE VPC
Model Informed Drug Discovery and Development Maximal Likelihood Multiple Sclerosis Disease duration Magnetic Resonance Imaging Multiple Sclerosis Multiple Sclerosis Functional Composite Score Non-Linear Mixed Effects Objective Function Value Pharmacodynamics Pharmacokinetics Perl-speaks-NONMEM Relapse Rate Relapse-Remitting Multiple Sclerosis Relative Standard Error Repeated Time-to-Event Sphingosine 1-Phosphate Receptor Study Day Sampling Importance Resampling Stochastic Simulation and Estimation Three times per Week Time-to-Event Visual Predictive Check
11
Introduction
Today’s revolution in biomedical science has raised new hope for the preven-tion, treatment, and cure of serious illnesses. However, there is growing con-cern that many of new basic science discoveries made in recent years may not quickly yield more effective, more affordable, and safe medical products for patients. During the last several years, the number of new drug and biologic applications submitted to FDA has declined significantly… In contrast, the costs of product development have soared over the last decade… If the costs and difficulties of medical product development continue to grow, innovation will continue to stagnate or decline and the biomedical revolution many not deliver on its promise on better health. Extract from Critical Path Initiative report by FDA, 20041.
Pharmacometrics Phamacometrics is an emerging science that has been defined as “the science of developing and applying mathematical and statistical methods to character-ize, understand, and predict a drug’s pharmacokinetic, pharmacodynamics, and biomarker-outcomes behavior”2. The regulators have recognized the value of integrating pharmacokinetic and pharmacodynamic (PK/PD) infor-mation in drug development and its potential impact on decision-making back in 20041. The role of pharmacometrics in drug development is becoming in-creasingly important. In 2009, FDA issued its Guidance for Industry End of Phase 2A Meetings that incites use of “trial simulation and quantitative mod-eling of prior knowledge to design trials for better dose response estimation and selection”3. This concept is referred to as model-informed drug discovery and development (MID3) (or until recently as model based drug development (MBDD))4. Numerous real-life examples have positioned pharmacometrics as a substantial tool to improve drug development and decision-making5-9.
Non-linear mixed effects models Majority of pharmacometrics research is established on non-linear mixed ef-fects (NLME) models allowing recognition of multi-level random variations. This approach involves simultaneous characterization of the typical individual (fixed effects) and variability components (random effects) of the data in the

12
studied population. Three types of variability can be further identified: inter-individual variability, inter-occasion variability (the difference between occa-sions within an individual) and residual unexplained variability (the difference between observations and individual predictions) For continuous data, the general structure of NLME model is commonly spec-ified by Equation 1. = , ( , , , ) + ℎ , ( , , , ), Eq.1
Where yij is the dependent variable (e.g. jth observation in individual i to be described by the model), f(·) is the function of the structural model and h(·) is the function of the residual error model. tij is the independent variable (e.g. time of the observation) and g(·) is a vector function defining individual pa-rameters based on the vector of population parameters θ, the vector of indi-vidual random effects ηi, the discrete design components xi (such as dose) and the vector of covariates zi. The residual error model also includes the vector εij which describes the deviation between the observation and the model predic-tion. The random effects εij and ηi are generally assumed to be normally dis-tributed around zero, with a variance defined by their respective covariance matrix Ω and Σ.
Categorical data NLME models describe the probability of a response x using the probability density function l(·), as: = = ( , ( , , , )) Eq.2
A model for another type of data, (repeated) time-to-event (RTTE), character-izes the time to a certain event by defining the instantaneous hazard hi(t) of that event, expressed as: ℎ ( ) = , ( , , , ) Eq.3
The probability for individual i of not having had an event by time t (i.e. the survival, Si (t)) can be formalized as: ( ) = ( ) Eq.4
Then, the probability for individual i of having an event at time ( ), be-comes: ( ) = ( ) ∙ ℎ ( ) Eq.5
Maximum likelihood estimation Maximum likelihood (ML) estimation is often used to find the model param-eters which best describe a set of observations. Given a certain model, ML
13
estimation identifies the set of parameters that maximize the probability of observing the sample data. The likelihood of the observed data for individual i, can be defined as in Equation 610. ( , Ω, Σ| ) = ( |( , Ω, Σ) = ( | , , Σ) · ( | , Ω) Eq.6
The total likelihood for all individuals is given by the sum of the individual likelihoods. The calculation of individual likelihoods often does not have an analytical solution. Consequently, numerical approximations are to be used. To minimize the logarithm of the likelihood is equivalent to maximize the likelihood and often numerically simpler in practice. Gradient-based algo-rithms make use of the derivative of the approximation of log-likelihood to guide parameter search. The approximation varies between methods but is generally based on Taylor series expansions: first-order approximation for FO(I) and FOCE(I) methods and second-order for LAPLACE method. An-other type of approximations make use of expectation-maximization (EM) al-gorithms. These methods are incorporated in several software, among which NONMEM11 is the most widely used one.
Item response theory Item response theory (IRT) models, a class of NLME models, were applied for the analysis of Expanded Disability Status Scale (EDSS), a composite score. Traditionally, IRT models have been used in educational testing to measure ability or proficiency and in psychological assessments to measure personality traits12. Also, health outcome researchers have been employing IRT to ques-tionnaire development, evaluation and refinement13. In numerous diseases, la-tent “unobservable” trait of interest cannot be measured directly and is there-fore assessed indirectly by scoring various items constructed to measure that underlying domain. Traditional scoring consists of summarizing all the infor-mation in one composite score, which might lead to loss of information cap-tured in the individual item. Instead of analysing the composite score itself, IRT is a statistical theory consisting of mathematical models expressing the probability of the particular response to a scale item j as a function of an un-derlying trait, here disability of a person Di and of a set of test specific param-eters, here 14: = = ( , ) Eq.7
The recent application of IRT to Alzheimer’s disease in a pharmacometric framework has demonstrated that increased precision in cognitive assessment can be achieved through a better understanding of how those items function and the amount of information they contain for the studied population15,16.
14
Hypothesis testing and statistical power Clinical drug development is typically conducted as a series of clinical trials. The objective of each of these trials will depend on the phase of clinical de-velopment, but they all share one aspect: they aim at addressing one or several predefined questions with a reasonable level of certainty. When planning a clinical trial, special attention is conveyed to the trial design to ensure it is appropriately powered, in other words that it is likely to provide sufficient information on a specific relation. This is achieved by means of hypothesis testing: a decision rule applying statistical models and observed data to decide which of typically two mutually exclusive hypotheses is true for a population, based on the observed sample. The null hypothesis can be defined, in a clinical trial setting, as the drug exhibiting no effect (H0), and the alternative hypoth-esis (H1) as existence of significant drug effect, according to the model. : ( ) = 0 : ( ) ≠ 0
Eq.8
where ( ) is the difference between the two treatments expressed as a func-tion of model parameters . H0 is generally set as the hypothesis one wants to reject.
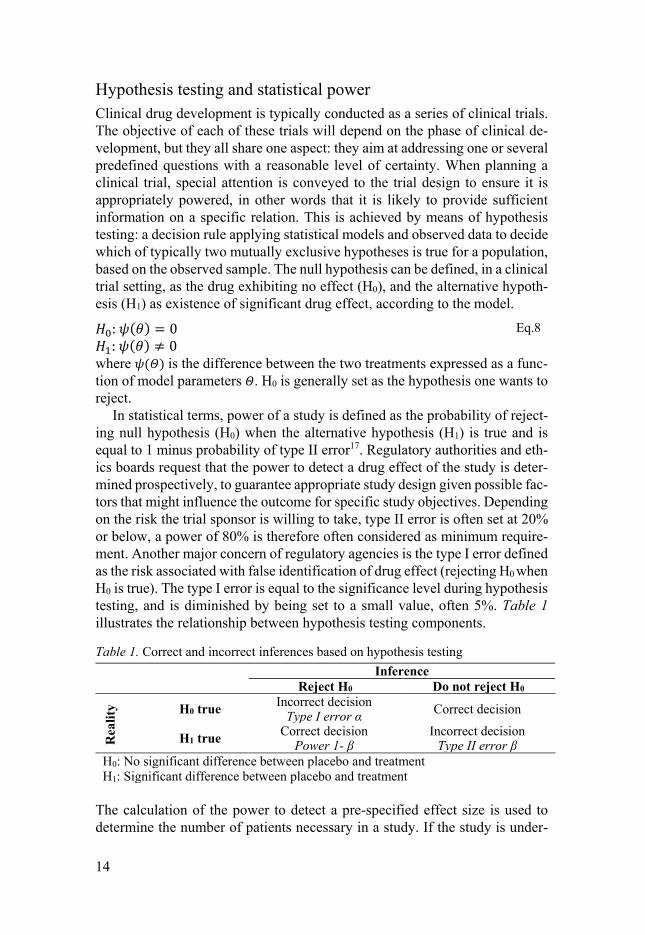
In statistical terms, power of a study is defined as the probability of reject-ing null hypothesis (H0) when the alternative hypothesis (H1) is true and is equal to 1 minus probability of type II error17. Regulatory authorities and eth-ics boards request that the power to detect a drug effect of the study is deter-mined prospectively, to guarantee appropriate study design given possible fac-tors that might influence the outcome for specific study objectives. Depending on the risk the trial sponsor is willing to take, type II error is often set at 20% or below, a power of 80% is therefore often considered as minimum require-ment. Another major concern of regulatory agencies is the type I error defined as the risk associated with false identification of drug effect (rejecting H0 when H0 is true). The type I error is equal to the significance level during hypothesis testing, and is diminished by being set to a small value, often 5%. Table 1 illustrates the relationship between hypothesis testing components.
Table 1. Correct and incorrect inferences based on hypothesis testing
InferenceReject H0 Do not reject H0
Rea
lity H0 true Incorrect decision
Type I error α Correct decision
H1 true Correct decision Power 1- β
Incorrect decision Type II error β
H0: No significant difference between placebo and treatmentH1: Significant difference between placebo and treatment
The calculation of the power to detect a pre-specified effect size is used to determine the number of patients necessary in a study. If the study is under-

15
powered, the risk that the study fails to detect an existing effect is higher, and patients that are included in the study may have been needlessly exposed to an experimental drug. Similarly, an over-powered study may unnecessarily expose an excessive number of patients to an experimental drug. In both cases, ethical concerns may be raised, and unnecessary resources spent18. Other than sample size, numerous potentially influential factors can be controlled to a certain extent during the design phase of a clinical trial19. For some time now, the use of simulations has been recognized as a way to improve the drug de-velopment process by allowing the design of more informative clinical tri-als20,21. Simulations can be used as a flexible tool to reveal the impact of dif-ferent design aspects on the results of the study22.
The use of pharmacometrics methods present advantages with respect to power, in comparison with traditional methods, such as t-test, ANOVA9,23,24. This can be mainly attributed to the use of longitudinal data and the assump-tion of continuous relationships between dose/exposure and the response (al-lowing for inference between treatment arms and placebo).
The likelihood ratio test (LRT) is the most common pharmacometrics-based hypothesis testing tool. In the NONMEM-setting, the LRT is based on the difference in objective function value (OFV) (defined as an approximata-tion of the -2 log of the likelihood), between two nested models that are de-fined according to a hypothesis test. Consequently, the reduced model corre-sponds to the model without the relationship of interest e.g. a drug effect (H0) and the full model with the relationship tested (H1). The statistical power is then calculated as the fraction of rejected H0 given the difference in the OFV (ΔOFV) that has been submitted to the hypothesis chi-squared ( ) test, ac-cording to the following equation: Power = ∑ (∆OFV ≥ χ . (df))N Eq.9
where df is degrees of freedom, i.e., the difference in number of estimated parameters between the full and reduced models and N is the total number of simulated trials.
Power calculations for the LRT have typically been carried out by multiple simulations and re-estimations of the full and the reduced models19,25.
16
Multiple sclerosis Epidemiology and etiology Multiple sclerosis (MS) is a chronic degenerative disease that primarily affects the central nervous system26. It is estimated that over 2.5 million people are globally affected by this disease27. The incidence is two to three times higher in women than in men. MS is one of the leading causes of disability in young adults; it typically begins between ages of 20 and 40. One of the main charac-teristics of this disease is the variability of the clinical course. While some people with MS might experience little incapacity during their lifetime, up to 60% are no longer fully ambulatory 20 years after the onset of disease.
The etiology of MS is not fully elucidated, but likely results from complex interactions between environmental and genetic factors28. Some research sug-gests that viral infections are involved in the triggering of the disease but no virus has so far been convincingly linked to MS29. At the other hand, it has been shown that viral infections are closely associated with clinical disease exacerbation30.
Pathophysiology There is increasing evidence that T and B lymphocytes play an important path-ophysiological role31. The neuropathology of MS is marked initially by accu-mulation of leukocytes in the central nervous system (CNS), oligodendrocyte loss, demyelination, axonal atrophy, and subsequent neuronal loss. Four sub-types of MS have been identified: relapse-remitting, primary progressive, sec-ondary progressive and progressive-relapsing MS. This thesis will focus on relapse-remitting MS (RRMS) which is characterized by relapses (acute epi-sodes of neurological dysfunction) followed by periods of stability. The de-gree of recovery from those relapses is highly variable32. Disease activity is predominately inflammatory but disease progression is likely to be result of neurodegeneration.
As the disease progresses with time, following phenomena are habitually observed in patients: accumulation of disability caused by relapses, increased brain lesion burden, increased brain atrophy, reduced repair capacity, in-creased neurodegenerative processes33.
Treatment Although MS was first recognized as a distinct disease in 1868 by Charcot34, treatment options remained very limited until recently. Treatment was exclu-sively symptomatic until the begging of 21st century, when a number of dis-ease-modifying therapies started emerging the market. Contrary to purely

17
symptomatic treatment, disease-modifying therapies aim to alter the patho-physiological chain of inflammation, demyelination and axonal loss.
The ultimate aim of therapies being the prevention of accumulation of irre-versible disability, the ideal treatment would be the one that eliminates clinical and radiological evidence of disease activity while having a good safety pro-file35. No perfect treatment has been discovered yet, but patients and treating physicians do have an increasing number of options, nowadays. Current treat-ment recommendations are to start with one of the following first-line treat-ments and in case of breakthrough of disease activity to switch to one of sec-ond-line treatment options36.
First-line treatment The current first-line MS therapy includes interferon beta, glatiramer acetate, teriflunomide and dimethyl fumarate. Interferon beta (e.g. interferon beta-1a Rebif®) are recombinant agents that are administered intramuscularly (weekly) or subcutaneously (every other day or three times a week). Although the precise mechanism of action is unknown, it is believed to include the in-hibition of T-lymphocyte proliferation, inhibition of leukocyte migration across the blood-brain barrier and cytokine modulation37. Glatiramer acetate (Copaxone®) is a synthetic compound composed of four amino acids that is injected subcutaneously daily. It is an immunomodulatory drug most likely shifting the population of T cells from pro-inflammatory T helper 1 (Th1) cells to regulatory Th2 cells suppressing the inflammatory response38. Terifluno-mide (Aubagio®) is inhibition biosynthesis of pyrimidine and proliferation of activated lymphocytes, in addition to having multiple anti-inflammatory and immunomodulating effects39. It is administered orally once daily. Dimethyl fumarate (Tecfidera®) is an immunomodulatory agent with anti-inflammatory properties, with a mechanism of action that has not been fully understood to date40. It is administered as tablets twice daily.
Second-line treatment The current second-line treatment includes fingolimod, natalizumab and alemtuzumab. Fingolimod (Gilenya®) is an oral sphingosine 1-phosphate re-ceptor (S1PR) modulator, inhibiting the ability of autoreactive lymphocytes to egress from the lymph nodes41. Fingolimod is administered once daily. Na-talizumab (Tysabri®) is a monoclonal antibody against α4 intergin, inhibiting the migration of inflammatory cells into the CNS42. It is administred monthly by an intravenous infusion. Alemtuzumab (Lemtrada®) a humanized mono-clonal antibody directed against the CD52 antigen on mature lymphocytes that results in depletion and repopulation of lymphocytes43. It is administrated by intravenous infusion for two treatment courses.

18
Cladribine Cladribine (2‑chloro-2′‑deoxyadenosine) is an adenosine deaminase-resistant purine nucleoside analogue in development of the treatment of RRMS, which preferentially reduces lymphocyte subpopulations44. Cladribine is believed to be phosphorylated by deoxycytidine kinase (DCK) to the nucleotide cladribine triphosphate (2-chloro-2′-deoxyadenosine 5′-triphosphate), which accumulates and is incorporated into deoxyribonucleic acid (DNA) in cells such as lymphocytes because of their high intracellular ratio of DCK to 5’-nucleotidase (5’-NTase) resulting in DNA strand breakage and inhibition of DNA synthesis and repair.
CD4+ T cells appears to be more susceptible to the effects of cladribine than the CD8+ T cell population45. It is believed that the effect of cladribine on both resting and actively dividing lymphocytes, including quiescent pro-genitor cells, is responsible for its long lasting effect46. Cladribine activation and intracellular metabolism are depicted in Figure 1.
Figure 1. Cladribine activation and intracellular metabolism, adapted from Comi et al. 44
Cladribine was originally developed for the treatment of lymphoid malignan-cies, in its injectable form. After demonstrating its effect in treatment of MS when parentally administered, an oral formulation of cladribine was devel-oped. During the clinical development program of cladribine tablets for treat-ment of MS, several studies have been performed to better understand PK and PD of cladribine47,48. Its sustained effects support the use of an annual short-course dosing-regiment. Cladribine has been found to significantly improve all clinical outcomes in a randomized, placebo-controlled Phase III study (CLARITY)49. Lymphocytopenia has been reported as the main side effect of cladribine and at the same time what is believed to be its mechanism of action. The clinical development program for cladribine tablets in MS is ongoing.
Biomarkers and clinical endpoints EDSS The Kurtzke EDSS, is the most widely used measure of disease progression in MS as efficacy outcome. Its assessment is based on seven functional sys-tems (FS) including vision, brainstem, pyramidal, cerebellar, sensory, bowel and bladder, mental (cerebral), and ambulation (500-m walk) and reliance on

19
aid (Figure 2). The EDSS is a summarized measure which ranges from 0 (nor-mal neurological exam) to 10 (death due to MS) in incremental steps of 0.550. Its overall score is greatly weighted toward ambulation, especially in higher scores51 and is rather insensitive to upper limb function and cognitive impair-ment. Regardless of its well documented disadvantages, such as limited inter-rater reproducibility, bimodal distribution of the scale and potentially uneven steps52,53, EDSS remains and it is highly likely to remain in the future a gold standard for assessing MS induced disability.
As alternative to EDSS, many scales for rating disability caused by MS have been proposed, such as Multiple Sclerosis Impairment Scale, Multiple Sclerosis Functional Composite (MSFC), or the Cambridge Multiple Sclerosis Basic Score (CAMBS), but none has been entirely satisfactory54. In addition, the need for measures of health-related quality of life (HRQOL) is increas-ingly recognized, lately55.
Figure 2. EDSS assessment based on 7 functional systems and walking ability, adapted from Neurostatus.net
Relapse Rate A qualifying relapse was defined as a new or worsening neurological symp-tom, in the absence of fever, lasting for more than 24 hours, accompanied by an objective change in the relevant (i.e. symptomatic) FS, and preceded by at least 30 days of clinical stability or improvement26. The objective change in FS was either a two-grade increase in one or more FS, or a one-grade increase in two or more FS (excluding changes in bowel/bladder or cognition catego-ries).
RR has been the foundation of MS clinical trials as a perceptible measure of inflammatory disease activity. Nevertheless, there are some concerns and limitations in depending on relapse frequency as a clinical outcome measure. The association between occurrence of relapses and long-term disability re-mains ambiguous53,56.
20
MRI lesions Pathophysiology of MS is characterized by formation of “multiple scars” in the brain and on the spinal cord, thought to be responsible for various clinical symptoms. There is increasing interest in magnetic resonance imaging (MRI) measurements as they allow objective, sensitive and quantitative changes measured. MRI scans have the advantage of detecting abnormalities before clinical symptoms appear. MRI related measurements are widely used to di-agnose MS and to monitor treatment efficacy on inflammatory activity. How-ever, their use is render complex by the fact that up to 80% of new lesions as seen on brain MRI are clinically silent i.e damage to the CNS pathways is not reflected in the clinical symptoms or signs, phenomenon known as ”clinic-radiological paradox”57. Many studies have attempted to unravel the relation between MRI measures, relapses and disability progression, the effect that these endpoints have on one another remains unclear56,58-61.
Several lesion-based readouts have proven to be an important tool to mon-itor the disease course: variants of lesion counts (T1-weighted hypointense, T1 gadolinium (Gd) enhanced lesions and T2-weighted lesions) as well as T2-weighted total lesion volume, a measure of burden of disease (BoD). In the recent years, there has been a growing interest in the measurement of CNS atrophy and spinal cord lesions62.
Drug development MS is characterized as a slowly progressing and highly variable disease, which have implications on the drug development of MS drugs. The most important therapeutic aim of any disease-modifying MS treatment is to prevent or post-pone accumulation of irreversible long-term disability. Nevertheless, its as-sessing poses a challenge given the short time course of clinical trials, in com-parison to the time frame of the disease. In MS trials various surrogate measures have been used as predictors for this disability, but there is limited evidence that those changes reflect true irreversible accumulation of disability at long-term scale63.
A typical Phase III trial for a disease-modifying (DM) agent is a placebo-controlled trial including a large number of patients (i.e. often more than 1000) followed over long time periods (typically 2 years minimum)41,49,64-66. For all investigated agents in the last decade, the primary outcome measure was re-duction in annualized relapse rate (ARR)67. ARR is defined as the number of confirmed relapses in a year. Studies typically have several secondary out-come measures based on MRI readouts and on EDSS (or other disability out-comes). MRI related measurements are serving as an important secondary out-come measure in most phase III clinical trials and often being used as a pri-mary outcome in “proof-of-concept” phase II studies68-73. However, it is im-portant to note that EDSS itself is not used as an efficacy endpoint; it is rather
21
the time to 3- or 6-months confirmed progression or proportion of individuals that experience progression at a pre-specified time that is recognized by regu-latory authorities as validated endpoint73. Using time to first confirmed disa-bility progression as an endpoint in MS clinical development results in loss of considerable amount of information, rendering impossible description of dis-ease progression, as disability progression does not stop after the first event.
Another complexity is the changing face of MS trials: revisions of MS di-agnostic McDonald criteria74 and increasing availability of therapies allowed for more patients to be treated earlier in the course of their disease. Direct consequence are trials filled with more patients less likely to have events, i.e fewer relapses and patients remaining at the same EDSS score for a prolonged period of time. This results in a need for performing longer trials of bigger size in order to detect a potential drug effect of new agents. In addition, com-parison of therapies is only possible through head-to-head comparison trials. Cross-trial comparisons of new products against established products is not appropriate due to baseline changes (downward trend in ARR) over the years in the select patient populations.
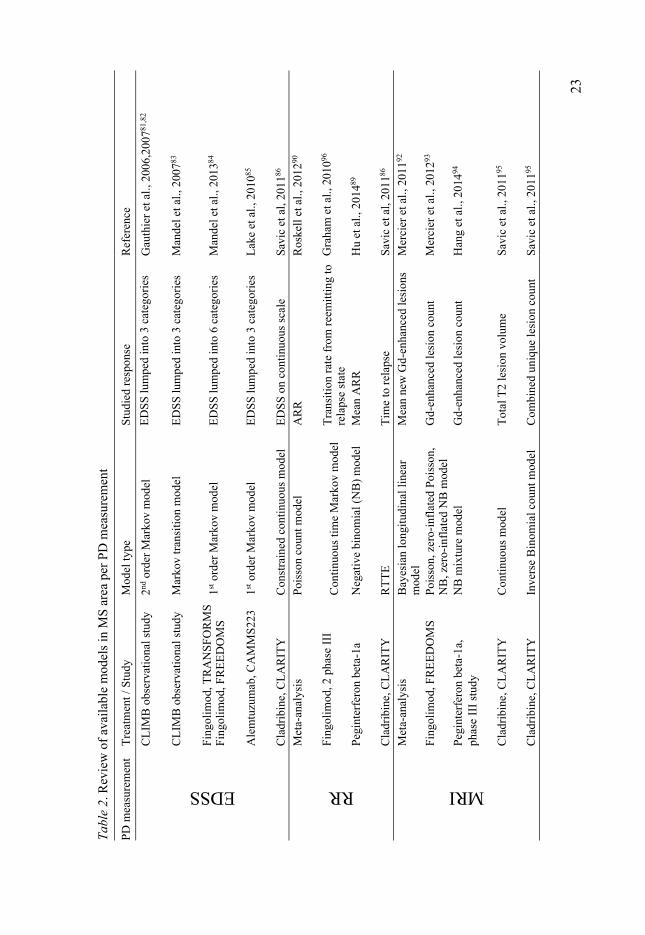
Modeling and Simulation in multiple sclerosis Accurate quantification of disease status and description and prediction of dis-ease progression is essential for drug development. For chronic diseases with slow progression such as MS, this is especially pertinent, due to the high costs of long-term clinical trials required to establish treatment efficacy. The effec-tiveness of therapeutic interventions can be determined, only if accurate quan-tification of disease severity is possible. PKPD modeling has demonstrated its benefits for several decades and its role is continuously increasing75. However, availability of NLME models in the area of MS has remained limited, espe-cially in comparison to the fields of oncology76,77 and anti-infectious dis-eases78,79. This is expected to change in the coming years as more long-term data become available from clinical studies and use of pharmacometrics in neurodegenerative diseases is increasing80. Available MS models have been summarized in Table 2.
When it comes to modeling of EDSS, being an ordered categorical variable, one would ideally like the developed model to be able to both estimate and simulate the data by respecting their true discrete nature. This would require all categories to be present in the population, which is rarely the case. Thus, modeling options to treat ordinal data involving 20 categories are limited. One option is to develop Markov transition models estimating the transition matrix defining the probability of switching from one EDSS level to another. The scale is then typically lumped in 3 (or maximum 6) categories which repre-sents an oversimplification81-85. Highest EDSS scores (≥3 or ≥6) are lumped into a single category which could be misleading in situation of simulations
22
and hampering the assessment of disease progression and quantification of potential drug effect. Another option is to treat order categorical data as con-tinuous, which is common practice in non-linear mixed effects modelling when the scale contains many categories, if number of categories ≥1186. It usually involves transformations to respect boundaries, thus few data should be at the extreme scores. According to several sources from statistical litera-ture, when building a model for a categorical ordered score it is frequent and appropriate to switch from categorical model to continuous model when the number of ordered categories is larger than 687,88.
Regarding relapse rate modeling, summarized information about relapses i.e ARR is most commonly used, resulting in a loss of information regarding time of occurrence of relapse89,90. Developing a count model for relapses im-plies that the time-course of the events during the time-interval is disregarded and an underlying constant hazard is assumed. In contrast, the RTTE method-ology used by Savic et al. accounts for all events with their exact time of oc-currence, as it does not require any data simplification91. In addition, use of ARR might lead to loss of statistical power as the treatment effect may be seen not only as decreasing number of relapses per year, but also as delaying time to each relapse.
Modeling of MRI readouts is typically achieved by means of different count data models92-94, except for BoD where appropriate methodology for continuous data is applied95.
23
Tab
le 2
. Rev
iew
of
avai
labl
e m
odel
s in
MS
are
a pe
r P
D m
easu
rem
ent
PD
mea
sure
men
t T
reat
men
t / S
tudy
M
odel
type
S
tudi
ed r
espo
nse
Ref
eren
ce
EDSS C
LIM
B o
bser
vati
onal
stu
dy
2ndor
der
Mar
kov
mod
elE
DS
S lu
mpe
d in
to 3
cat
egor
ies
Gau
thie
r et
al.,
2006
,200
781,8
2
CL
IMB
obs
erva
tion
al s
tudy
M
arko
v tr
ansi
tion
mod
elE
DS
S lu
mpe
d in
to 3
cat
egor
ies
Man
del e
t al.,
200
783
Fin
goli
mod
, TR
AN
SF
OR
MS
F
ingo
lim
od, F
RE
ED
OM
S
1st o
rder
Mar
kov
mod
el
ED
SS
lum
ped
into
6 c
ateg
orie
s M
ande
l et a
l., 2
01384
Ale
mtu
zum
ab, C
AM
MS
223
1st
ord
er M
arko
v m
odel
E
DS
S lu
mpe
d in
to 3
cat
egor
ies
Lak
e et
al.,
201
085
Cla
drib
ine,
CL
AR
ITY
C
onst
rain
ed c
onti
nuou
s m
odel
E
DS
S o
n co
ntin
uous
sca
le
Sav
ic e
t al,
2011
86
RR
Met
a-an
alys
is
Poi
sson
cou
nt m
odel
A
RR
R
oske
ll e
t al.,
201
290
Fin
goli
mod
, 2 p
hase
III
Con
tinu
ous
tim
e M
arko
v m
odel
T
rans
itio
n ra
te f
rom
ree
mit
ting
to
rela
pse
stat
e G
raha
m e
t al.,
201
096
Peg
inte
rfer
on b
eta-
1a
Neg
ativ
e bi
nom
ial (
NB
) m
odel
M
ean
AR
R
Hu
et a
l., 2
01489
Cla
drib
ine,
CL
AR
ITY
R
TT
E
Tim
e to
rel
apse
S
avic
et a
l, 20
1186
MRI
Met
a-an
alys
is
Bay
esia
n lo
ngit
udin
al li
near
m
odel
Mea
n ne
w G
d-en
hanc
ed le
sion
s M
erci
er e
t al.,
201
192
Fin
goli
mod
, FR
EE
DO
MS
P
oiss
on, z
ero-
infl
ated
Poi
sson
, N
B, z
ero-
infl
ated
NB
mod
el
Gd-
enha
nced
lesi
on c
ount
M
erci
er e
t al.,
201
293
Peg
inte
rfer
on b
eta-
1a,
phas
e II
I st
udy
NB
mix
ture
mod
el
Gd-
enha
nced
lesi
on c
ount
H
ang
et a
l., 2
01494
Cla
drib
ine,
CL
AR
ITY
C
onti
nuou
s m
odel
T
otal
T2
lesi
on v
olum
e S
avic
et a
l., 2
01195
Cla
drib
ine,
CL
AR
ITY
In
vers
e B
inom
ial c
ount
mod
el
Com
bine
d un
ique
lesi
on c
ount
S
avic
et a
l., 2
01195
24
Aims
The overall aim of this PhD thesis was to develop pharmacometric models for characterization and quantification of the relationships between drug expo-sure, biomarkers and clinical endpoints in MS therapy. The specific aims were:
• To characterize dose-exposure-response relationship of cladribine in RRMS patients
• To develop integrated longitudinal models for biomarkers and clini-cal outcome measures in MS patients to better understand the time-course of the disease and the predictive value of different predictors
• To demonstrate the potential benefits of applying pharmacometric methods with regards to statistical power to detect the drug effect in MS clinical trials

25
Methods
Study designs and data In this thesis, clinical trial data from cladribine development program were used for the development of pharmacometric models. All studies were con-ducted in accordance with the ethical principles of the Declaration of Helsinki and the International Conference on Harmonization Tripartite Guidelines for Good Clinical Practice. All patients have provided their written informed con-sent. Pharmacokinetics of cladribine For the PK analysis (Paper I), data from four studies (three Phase I and one Phase III) were used. Study 25803 is a Phase I open-label, randomized, 2-period, 2-sequence cross-over study to investigate the PK of cladribine and its metabolite following the administration of a single oral dose and a single i.v. dose in 16 subjects with MS. Patients received 3 mg cladribine per i.v as a single one-hour infusion or 10 mg cladribine orally as a tablet. Blood samples were collected pre-dose, at 0.25, 0.5, 1, 2, 3, 4, 6, 8, 12, 16, 24, 36, 48, 72, 96 and 120 hours after dosing. Urine was collected pre-dose and at 0-4, 4-8, 8-12, 12-24, 24-48 and 48-72 hours post-dose.
Study 26127 was a Phase I randomized, 2-way cross-over study to investi-gate the effects of food on the PK of cladribine administered orally to 16 sub-jects with RRMS. One 10 mg cladribine tablet was administered to the sub-jects as a single oral dose on two occasions (fasted and fed). Blood samples were collected pre-dose, and at 0.5, 1, 1.5, 2, 3, 4, 6, 8, 12, 16, 24, 36, 48 and 72 hours post-dose.
Study 26486 was an open label, multiple dose design to assess the effects of oral cladribine on the PK of IFN-β-1a (Rebif®, Merck KGaA) and vice versa and the safety of the combination treatment in 16 MS patients. Patients received one or two 10mg cladribine tablets (based on their weight) for five consecutive days. After at least 2 days, patients received IFN-β-1as follows: 8.8µg twice times per week (TIW) (Day 7 to Day 18; 6 doses) then 22µg TIW (Day 21 to Day 32; 6 doses), followed by 44µg TIW (Day 35 to Day 60; 12 doses). During the last week of IFN-β-1a treatment, cladribine was co-admin-istered orally for 5 consecutive days (Day 56 to Day 60). Blood samples for PK analysis were taken pre-dose and at 0.5, 1, 1.5, 2, 3, 4, 6, 8, 12, 16, 24, 36 and 48 hours post-dose at the following times: at the end of the initial
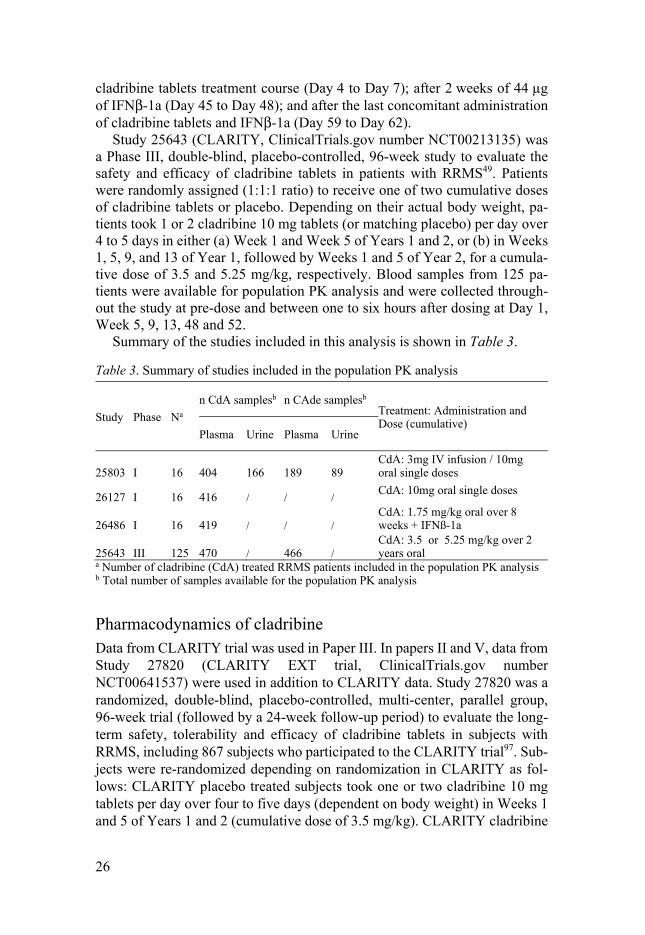
26
cladribine tablets treatment course (Day 4 to Day 7); after 2 weeks of 44 µg of IFNβ-1a (Day 45 to Day 48); and after the last concomitant administration of cladribine tablets and IFNβ-1a (Day 59 to Day 62).
Study 25643 (CLARITY, ClinicalTrials.gov number NCT00213135) was a Phase III, double-blind, placebo-controlled, 96-week study to evaluate the safety and efficacy of cladribine tablets in patients with RRMS49. Patients were randomly assigned (1:1:1 ratio) to receive one of two cumulative doses of cladribine tablets or placebo. Depending on their actual body weight, pa-tients took 1 or 2 cladribine 10 mg tablets (or matching placebo) per day over 4 to 5 days in either (a) Week 1 and Week 5 of Years 1 and 2, or (b) in Weeks 1, 5, 9, and 13 of Year 1, followed by Weeks 1 and 5 of Year 2, for a cumula-tive dose of 3.5 and 5.25 mg/kg, respectively. Blood samples from 125 pa-tients were available for population PK analysis and were collected through-out the study at pre-dose and between one to six hours after dosing at Day 1, Week 5, 9, 13, 48 and 52.
Summary of the studies included in this analysis is shown in Table 3.
Table 3. Summary of studies included in the population PK analysis
Study Phase Na
n CdA samplesb n CAde samplesb Treatment: Administration and Dose (cumulative)
Plasma Urine Plasma Urine
25803 I 16 404 166 189 89CdA: 3mg IV infusion / 10mg oral single doses
26127 I 16 416 / / / CdA: 10mg oral single doses
26486 I 16 419 / / / CdA: 1.75 mg/kg oral over 8 weeks + IFNß-1a
25643 III 125 470 / 466 / CdA: 3.5 or 5.25 mg/kg over 2 years oral
a Number of cladribine (CdA) treated RRMS patients included in the population PK analysis b Total number of samples available for the population PK analysis
Pharmacodynamics of cladribine Data from CLARITY trial was used in Paper III. In papers II and V, data from Study 27820 (CLARITY EXT trial, ClinicalTrials.gov number NCT00641537) were used in addition to CLARITY data. Study 27820 was a randomized, double-blind, placebo-controlled, multi-center, parallel group, 96-week trial (followed by a 24-week follow-up period) to evaluate the long-term safety, tolerability and efficacy of cladribine tablets in subjects with RRMS, including 867 subjects who participated to the CLARITY trial97. Sub-jects were re-randomized depending on randomization in CLARITY as fol-lows: CLARITY placebo treated subjects took one or two cladribine 10 mg tablets per day over four to five days (dependent on body weight) in Weeks 1 and 5 of Years 1 and 2 (cumulative dose of 3.5 mg/kg). CLARITY cladribine

27
subjects were re-randomized 2:1 to either (a) one or two cladribine 10 mg tablets per day over four to five days (dependent on body weight) in Weeks 1 and 5 of Years 1 and 2 (cumulative dose of 3.5 mg/kg), or (b) matching pla-cebo (Figure 3).
Figure 3. Overview of trial design of CLARITY and CLARITY EXT. Abbrevia-tions: C: cladribine; P: placebo
The across study treatment arms are referred to by two letters corresponding to either active or placebo in each trial (CC: cladribine in CLARITY and cladribine in CLARITY EXT for a total cumulative dose of either 7 mg/kg or 8.75 mg/kg cladribine dependent on dose of cladribine in core study; CP: cladribine in CLARITY and placebo in CLARITY EXT for a total cumulative dose of either 3.5 mg/kg or 5.25 mg/kg cladribine dependent on dose of cladribine in core study; PC: placebo in CLARITY and cladribine in CLAR-ITY EXT for a total cumulative dose of 3.5 mg/kg cladribine). The subjects participating in the CLARITY trial who were not eligible for treatment in CLARITY EXT and only followed for safety are referred to as “P+fol”, “C 3.5mg/kg+fol” and “C 5.25 mg/kg+fol”, designating the placebo and the 3.5 mg/kg and 5.25 mg/kg cumulative cladribine dose treatment arms, respec-tively. Subjects who participated in the CLARITY trial but were not included in CLARITY EXT are referred to as “P-no ext”, “C 3.5mg/kg -no ext” and “C 5.25 mg/kg -no ext”, designating the placebo and the 3.5 mg/kg and 5.25 mg/kg cumulative cladribine dose treatment arms, respectively. Blood sam-ples used for ALC measurements were collected at screening, study day 1 (SD1) and at weeks 5, 9, 13, 24, 44, 48, 52, 72 and 96 during CLARITY study and at screening, SD1 and at weeks 2, 5, 9, 13, 16, 24, 36, 44, 48, 52, 55, 60, 66, 72, 78, 84 and 96 during CLARITY EXT study. Blood samples were also collected during 24-week follow-up period at day 1 and weeks 13 and 24. Ex-amination of neurological function (EDSS) was performed at screening and

28
SD1, and at weeks 13, 24, 36, 48, 60, 72, 84 and 96 of the blinded trial period in both CLARITY and CLARITY EXT trial, and at SD1 and week 24 of the supplemental follow-up period. MRI assessment was performed at SD1 and at weeks 24, 48, 72 and 96 in both CLARITY and CLARITY EXT trial, and at SD1 and week 24 of the supplemental follow-up period.
In total 36850 observations of ALC, 21173 observations of EDSS (169384 item level EDSS data) and 9844 observations of volume of T2 lesions (also referred as Burden of disease BoD) were available for analysis.
Software All pharmacometric analyses (modeling and simulations) were performed in the software package NONMEM, versions 7.2 and 7.311. Parallelization of NONMEM utilizing the software MPICH2 (freely available standardized message-passing interface) was employed when appropriate. Estimation methods used were the first-order conditional estimation with interaction (FO-CEI) for continuous type data and the Laplacian estimation method for order categorical and time-to-event data.
The statistical software R (The R foundation for Statistical Computing, ver-sion 3.1.1) was used for data management, data check-out, graphical analysis, model diagnostics and statistical summaries98. The R-based version of Xpose (Xpose 4.5.3, http://xpose.sourceforge.net/) was used to produce standard goodness-of-fit plots and Perl-speaks-NONMEM (PsN) (version 4.4.0, http://psn.sourceforge.net/) was used as a tool to facilitate modelling with NONMEM and for model evaluation99.
PKPD model development and estimation The general procedure that was to be followed for the development of the PKPD models is outlined below:
• Exploratory Graphical Analysis • Structural Model Development • Statistical model development • Covariate analysis • Final Model Refinement
Model selection was based on scientific plausibility of the model, goodness of fit plots, simulation properties of the model and likelihood ratio test (LRT). LRT is typically employed for comparison of full versus reduced models, based on the difference in OFV between hierarchical models. The statistical significance was tested at 1% level, corresponding to 6.63 needed drop in OFV for one degree of freedom, for the extended model to be significant.

29
Dose-exposure of cladribine Compartmental PK models were developed and non-linearities in absorption and elimination processes for both cladribine and its main metabolite (2-chlo-rodenine, CAde) were explored. The development of the population PK model is summarized in Table 4. Starting from single dose iv data (from iv arm of study 25803), models were extended by adding subsequently the data from other studies. Plasma and urine concentrations of cladribine and CAde were modeled simultaneously.
Table 4. Overview of key modeling steps
Model N subjects n samples Studies
Model I 16 397 25803 (IV data)
Model II 16 848 25803 (i.e. + oral data)Model III 32 1264 25803, 26127 (i.e. +food effect)Model IV 48 1683 25803, 26127, 26486 (i.e. +IFNβ-1a)Model V 173 2619 25803, 26127, 26486, 25643 (i.e. +Phase III)
Exposure-response of cladribine The relationship between cladribine exposure and the following endpoints was modeled: ALC, RR, BoD and EDSS. RR and BoD models were built on pre-viously developed models on CLARITY data by Savic et al.86,95. In the case of EDSS, two types of models were developed: a continuous composite score and an IRT model. In the PD analysis model development was typically con-ducted in three sequential steps: development of disease progression model based on placebo data, development of the exposure–response model based on data from patients on cladribine treatment, and development of the covari-ate model. Covariate modeling development was performed using a stepwise procedure99 with the exception of the IRT model where full random effect models (FREM) approach was employed100.
Considering the short systemic exposure of cladribine and its long lasting effect seen on PD endpoints, cladribine’s exposure could not be used directly as the driver of the effect, expect for modeling of ALC. Instead, a surrogate exposure, driven by cumulative dose of cladribine adjusted for individual CLCR, with an estimated exponential decay was used to drive the exposure-response relationship in BoD, RR and EDSS models.
The model building of the EDSS IRT model was somewhat different from the one for other PD models. According to neurostatus definition (www.neu-rostatus.net), it is the combination of ambulation and reliance on aid that is affecting the determination of EDSS, thus a polychotomous variable with 11 categories, called ambaid was constructed. In the first stage a model for base-line data was developed where the relationship between patients’ response to an item and their level of disability was modeled as ordered categorical data.

30
Item Characteristic Curves (ICC) were used to quantify and visualize that re-lationship101. Observed scores for each EDSS item were modeled describing the probability of a given score as a function of patients’ disability variable using a logistic model: ( ≥ ) = ( , )1 + ( , ) Eq.10
With bj and aj representing a discriminarion parameter and the slope of the ICC at that point respectively, and Di representing unobserved IRT disability of patient i. Parameters aj and bj characterizing item specific parameters were modeled as fixed effects, while the IRT disability D was modeled as subject-specific random effect, assuming normal distribution with a mean of zero and fixed variance of 1. The assumed scale of D is an arbitrary scale that can take any value from –∞ to +∞. In the case when scores of an item were not repre-sented in the analysis dataset, merging of scores with a closest observed score was performed.
Biomarker driven endpoint models Once the models for individual components were developed (exposure driven models for ALC, RR, BoD and EDSS), their interplay was investigated. ALC was proposed as predictor of RR, BoD and EDSS dynamics. Also, it was in-vestigated if BoD alone or together with ALC is a potential predictor of change in EDSS.
A sequential modeling of biomarker and respective clinical endpoints called Individual PK Parameters (IPP)102,103 and IPP with standard errors (IPPSE)104 that relies on a modal Bayesian estimates of the individual param-eters prior derived from the biomarker model, and their uncertainties for IPPSE approach, were applied in these analyses.
Simulations based diagnostics were used to evaluate the predictive perfor-mance of intermediate and final models. Standard visual predictive checks (VPC) were used for models for continuous data105 and Kaplan-Meier VPC for time-to-event and dropout data. For the item level data in the IRT model (ordered categorical data), an adapted version of VPC was used106. Typically, 95% confidence interval were computed from 200 Monte Carlo simulation replicates of the original dataset. The agreement between observations and simulations was graphically assessed.
Model precision was assessed using relative standard errors (RSE). RSEs were obtained using either the sandwich estimator of the covariance matrix as implemented in NONMEM, the non-parametric bootstrap or the sampling im-portance resampling (SIR) implemented in PsN107.
31
Item information Based on the IRT model (Eq.3), the Fisher information for IRT disability was calculated for each item constituting EDSS as minus the expectation of the second derivative of the log-likelihood. The information content for each item was then computed for the studied population and items were ranked accord-ing to the amount of information they contained.
Power estimation In order to assess the influence of different study design features, a trial sim-ulation approach was applied for power calculations of a hypothetical Phase III MS study. Parallel group study including a placebo and two active arms was simulated. The study design was matching to the design of the CLARITY trial. EDSS profiles were simulated using estimates from the developed IRT model108.
Two model-based power calculation methods were used: Stochastic Simu-lations and Estimations (SSE) and Monte Carlo mapped power (MCMP) (as implemented in PsN version 3.499).
The SSE method is based on multiple simulations and re-estimations of the full and a reduced model. For each replicate, an estimate of the power of the study for a given design is computed. This process is carried out iteratively for each study design of interest.
MCMP was proposed by Vong et al.109 and is based on the hypothesis test-ing principle of the LRT with as main advantage the requirement of only a single simulation and estimation step. A large data set is simulated and gener-ated data are subsequently estimated with a full and a reduced model, provid-ing a large pool of values of individual OFV (iOFV) for both models. The difference between two (ΔiOFV) is sampled and summed (∑ΔiOFVs) for each study at each sample size of interest, and the percentage of ∑ΔiOFVs greater than the significance criterion is taken as the power.
Two NLME models for EDSS were compared: the IRT model108 and a pre-viously developed NLME model treating EDSS as a bounded continuous var-iable86. The IRT model was used to generate simulated EDSS item scores, and EDSS composite scores were then derived. The estimations were based on either (a) only the IRT model or (b) both the IRT and the continuous composite models. In addition, the influence of different trial aspects (e.g., number of items in composite assessment, drug effect magnitude and nature, study pop-ulation, trial duration, or assessment frequency) on the power was assessed by varying them in the simulations from the IRT model (Table 5).
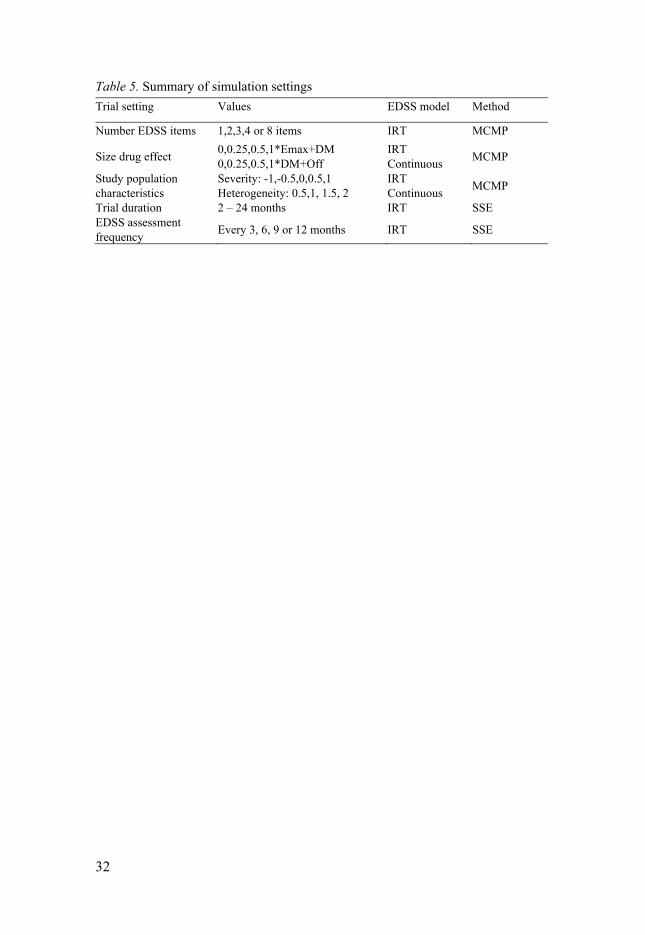
32
Table 5. Summary of simulation settings
Trial setting Values EDSS model Method
Number EDSS items 1,2,3,4 or 8 items IRT MCMP
Size drug effect 0,0.25,0.5,1*Emax+DM 0,0.25,0.5,1*DM+Off
IRT Continuous
MCMP
Study population characteristics
Severity: -1,-0.5,0,0.5,1 Heterogeneity: 0.5,1, 1.5, 2
IRT Continuous
MCMP
Trial duration 2 – 24 months IRT SSEEDSS assessment frequency
Every 3, 6, 9 or 12 months IRT SSE
33
Results and Discussion
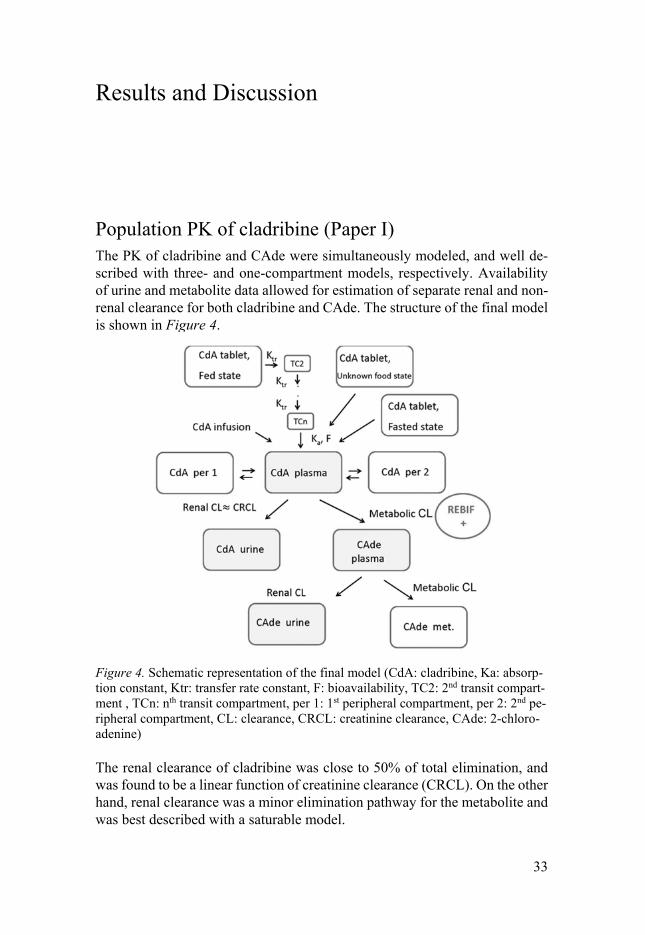
Population PK of cladribine (Paper I) The PK of cladribine and CAde were simultaneously modeled, and well de-scribed with three- and one-compartment models, respectively. Availability of urine and metabolite data allowed for estimation of separate renal and non-renal clearance for both cladribine and CAde. The structure of the final model is shown in Figure 4.
Figure 4. Schematic representation of the final model (CdA: cladribine, Ka: absorp-tion constant, Ktr: transfer rate constant, F: bioavailability, TC2: 2nd transit compart-ment , TCn: nth transit compartment, per 1: 1st peripheral compartment, per 2: 2nd pe-ripheral compartment, CL: clearance, CRCL: creatinine clearance, CAde: 2-chloro-adenine)
The renal clearance of cladribine was close to 50% of total elimination, and was found to be a linear function of creatinine clearance (CRCL). On the other hand, renal clearance was a minor elimination pathway for the metabolite and was best described with a saturable model.
34
A first order absorption model was sufficient to describe the absorption of cladribine in absence of food. Bioavailability after oral administration was es-timated to be 45.6%. Once data from the fed state were added, a transit com-partment model improved the fit significantly, suggesting that co-administra-tion with food resulted in a delayed absorption and an overall reduction of bioavailability to 40.5%.
The influence of co-administration of IFNβ-1a , the current gold standard for symptomatic treatment of MS, was assessed. Co-administration of IFNβ-1a increased the CLNR by 22%. This didn’t have a significant impact on cladribine exposure due to the even split of the elimination between renal and non-renal pathways.
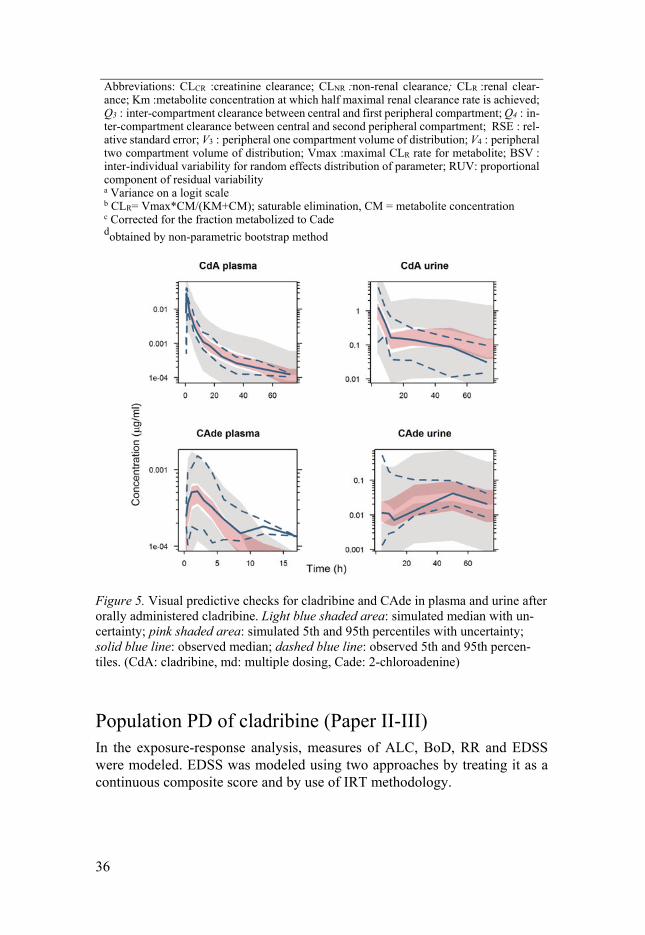
Final model parameter estimates, together with corresponding uncertainties are listed in Table 6. Thanks to the rich data and informative designs of Phase I studies, both parent and metabolite plasma profiles were well described, as indicated by relatively low residual variabilities. Residual variability of uri-nary data was rather high, which can be attributed to more erratic nature of the urinary data. Variability in cladribine pharmacokinetics parameters appeared to be relatively small, owing to the complex model structure which describes well the interplay between cladribine and CAde in plasma and urine. The fit of the model to the data following single oral administration of cladribine is demonstrated by the VPC in Figure 5.
According to the model, the renal component of CL in subjects with renal impairment can be assessed. The resulting (predicted) drop in the total clear-ance is 19%, 30% and 40% for subjects with mild (CLCR = 65 ml/min), mod-erate (CLCR = 40 ml/min) and severe (CLCR = 20ml/min) renal impairment, respectively.
The developed model is the first population PK model to describe cladribine and its main metabolite CAde simultaneously in RRMS patients, after both IV and oral administration of cladribine. These results are in line with previous findings from a previous population analysis of cladribine’s PK in cancer patients110. Overall the total clearance appeared to be somewhat higher than previously reported value (45.6 L/h vs. 39.3 L/h); however once the results are adjusted for differences in the mean creatinine clearance be-tween study populations, those differences become minor (40.5 L/h vs. 39.3 L/h).

35
Table 6. Parameter estimates with uncertainty of the final model
Parameter Final model RSEd, %
Cladribine
CLR coefficientb
(typical patient with CLCR=6.31L/h) [L/h] 3.52 (22.2 )
9
CLNR [L/h] 23.4 10
Central Volume [L] 44.0 23
Intercompartmental Q3 [L/h] 14.3 8
Intercompartmental Q4 [L/h] 53.7 19
Peripheral volume V3 [L] 347 6
Peripheral volume V4 [L] 89.5 8
Absorption rate constant [h-1] 1.08 21
Absorption rate constant (unknown/fed state) [h-1] 1.03 12
Bioavailability 0.456 7
Bioavailability (unknown/fed state) 0.4 5
Lag time for Phase III [h] 0.319 12
Mean transit time (fed state) [h] 0.910 11
Number of transit compartments 2.24 27
Fold increase in CLNR in presence of IFNß-1a 1.21 8
IIVCLNR 0.00574 64
IIV V 0.209 72
IIV Q3,Q4,V3,V4 0.0365 28
IIV Ka 0.102 62
IIV Fa 0.223 19
IIV Residual variability 0.159 17
RUV plasma intravenous [%] 20.0 11
RUV plasma oral [%] 34.7 16
RUVplasma oral (Study 26127, 26486) [%] 22.8 6
RUV plasma oral (Study 25643) [%] 35.3 7
RUV urine [%] 87.1 11
2-chloroadenine (CAde)
CLRb – Vmax [μg/h] 0.00280 25
CLRb –Km [ng/L] 0.0114 58
Apparent hepatic CL [L/h]c 653 11
Apparent central volume V [L]c 365 13
RUV plasma [%] 34.3 20
RUV plasma (Study 25643) [%] 31.8 76
RUV urine [%] 104 14
36
Abbreviations: CLCR :creatinine clearance; CLNR :non-renal clearance; CLR :renal clear-ance; Km :metabolite concentration at which half maximal renal clearance rate is achieved; Q3 : inter-compartment clearance between central and first peripheral compartment; Q4 : in-ter-compartment clearance between central and second peripheral compartment; RSE : rel-ative standard error; V3 : peripheral one compartment volume of distribution; V4 : peripheral two compartment volume of distribution; Vmax :maximal CLR rate for metabolite; BSV : inter-individual variability for random effects distribution of parameter; RUV: proportional component of residual variability a Variance on a logit scale b CLR= Vmax*CM/(KM+CM); saturable elimination, CM = metabolite concentration c Corrected for the fraction metabolized to Cade dobtained by non-parametric bootstrap method
Figure 5. Visual predictive checks for cladribine and CAde in plasma and urine after orally administered cladribine. Light blue shaded area: simulated median with un-certainty; pink shaded area: simulated 5th and 95th percentiles with uncertainty; solid blue line: observed median; dashed blue line: observed 5th and 95th percen-tiles. (CdA: cladribine, md: multiple dosing, Cade: 2-chloroadenine)
Population PD of cladribine (Paper II-III) In the exposure-response analysis, measures of ALC, BoD, RR and EDSS were modeled. EDSS was modeled using two approaches by treating it as a continuous composite score and by use of IRT methodology.
37
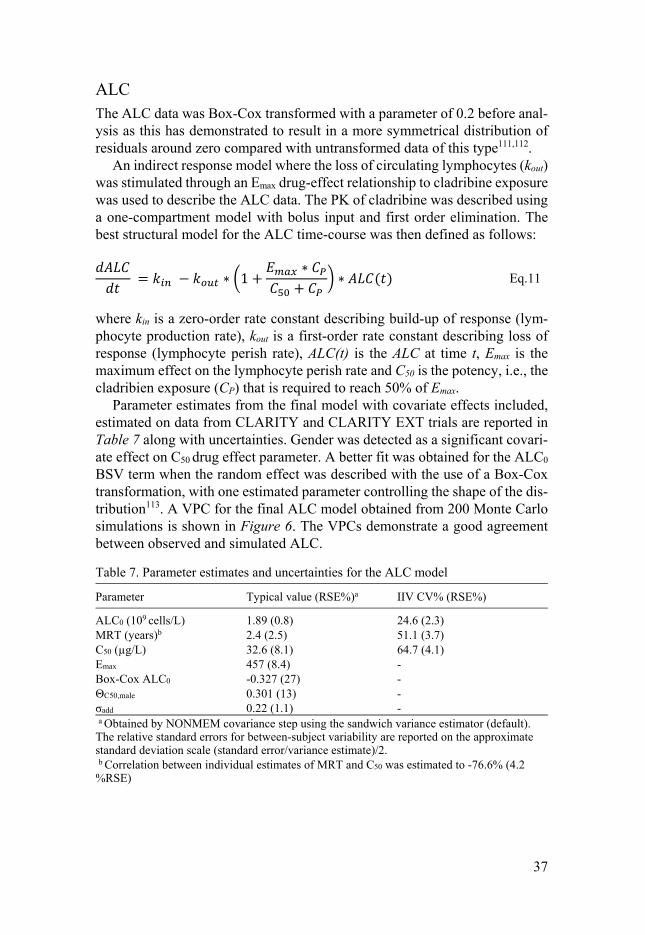
ALC The ALC data was Box-Cox transformed with a parameter of 0.2 before anal-ysis as this has demonstrated to result in a more symmetrical distribution of residuals around zero compared with untransformed data of this type111,112.
An indirect response model where the loss of circulating lymphocytes (kout) was stimulated through an Emax drug-effect relationship to cladribine exposure was used to describe the ALC data. The PK of cladribine was described using a one-compartment model with bolus input and first order elimination. The best structural model for the ALC time-course was then defined as follows: = − ∗ 1 + ∗+ ∗ ( ) Eq.11
where kin is a zero-order rate constant describing build-up of response (lym-phocyte production rate), kout is a first-order rate constant describing loss of response (lymphocyte perish rate), ALC(t) is the ALC at time t, Emax is the maximum effect on the lymphocyte perish rate and C50 is the potency, i.e., the cladribien exposure (CP) that is required to reach 50% of Emax.
Parameter estimates from the final model with covariate effects included, estimated on data from CLARITY and CLARITY EXT trials are reported in Table 7 along with uncertainties. Gender was detected as a significant covari-ate effect on C50 drug effect parameter. A better fit was obtained for the ALC0 BSV term when the random effect was described with the use of a Box-Cox transformation, with one estimated parameter controlling the shape of the dis-tribution113. A VPC for the final ALC model obtained from 200 Monte Carlo simulations is shown in Figure 6. The VPCs demonstrate a good agreement between observed and simulated ALC.
Table 7. Parameter estimates and uncertainties for the ALC model
Parameter Typical value (RSE%)a IIV CV% (RSE%)
ALC0 (109 cells/L) 1.89 (0.8) 24.6 (2.3)MRT (years)b 2.4 (2.5) 51.1 (3.7)C50 (µg/L) 32.6 (8.1) 64.7 (4.1)Emax 457 (8.4) -Box-Cox ALC0 -0.327 (27) -ΘC50,male 0.301 (13) -σadd 0.22 (1.1) - a Obtained by NONMEM covariance step using the sandwich variance estimator (default). The relative standard errors for between-subject variability are reported on the approximate standard deviation scale (standard error/variance estimate)/2. b Correlation between individual estimates of MRT and C50 was estimated to -76.6% (4.2 %RSE)

38
Figure 6. VPC for the ALC model stratified by treatment arm. The graph shows the observed median (solid blue line) and 2.5th and 97.5th percentiles (lower and upper dashed blue lines, respectively). The observed data is compared with the 95 % confi-dence interval for the median (orange shaded area) and the 2.5th and 97.5th percen-tiles (lower and upper light-grey shaded area, respectively) of the simulated data. The blue dashed line denotes the upper limit for lymphopenia of Grade 1 (1.0*109 cells/L). The red dashed lines denote upper limits for lymphopenia of Grades 2, 3 and 4 (0.8, 0.5 and 0.2*109 cells/L, respectively). Abbreviations: C cladribine; P: placebo.
The long-lasting effect in this model is carried by a long life-span for the av-erage lymphocyte of 2.4 years. This is in good agreement with a reported MRT of 2.88 years114, but it should be recognized that the lymphocyte pool is het-erogeneous and its dynamics are complex.
A comparable ALC model was previously developed for S1P-receptor modulators (e.g. fingolimod, ponesimod, siponimod), with the difference that the drug inhibited the ALC production kin (instead of stimulating the kout in our model) which is in line with the mechanism of action of S1P-receptor modulators, in which lymphocytes are retained within lymph nodes115-117.
The developed model provides a valid representation of the ALC dynamics observed following treatment with cladribine tablets according to different schedules in subjects with RRMS.
Relapse rate The PK of cladribine was implemented in the same way for all PD endpoints. As PK data was not available in the dataset, knowledge from a population PK analysis of cladribine in MS subjects and from previous implementation in

39
population pharmacodynamic analysis of cladribine in MS subjects86 was ap-plied. The population PK analysis found that the total clearance of cladribine is the sum of non-renal and renal clearance, with CLCR,i,t found to be a statis-tically significant covariate for renal clearance118.
For this reason, a previously reported analysis based on data from the CLARITY trial utilized the recorded CLCR,i,t to adjust the cumulative amount of cladribine (in total mg) received up until the time of observation, t, to a measure for cladribine exposure in the individual subject, described according to: , = , ,, , ∗ , Eq.12
where Expsi,t is the individual measure for cladribine exposure at time t, cal-culated as the individual cumulative amount of cladribine received at time t (DOSEcumulative,i,t), adjusted for the individual calculated CLCR,i,t at time t, cen-tered on the CLCR population median (CLCR,med). This measure for cladribine exposure is proportional to the systemic (cumulative) exposure with units given in amount (mg), not in concentration.
As the time during which there is significant systemic exposure of cladribine is relatively short, the implementation described above utilized the cumulative amount of cladribine as the driver for the observed long-lasting effect. This implementation is not expected to be appropriate upon extension of the observation period (inclusion of CLARITY EXT data), with variable time gap between trials, or with cross-over designs. Therefore, an exponential decay in the effect driver (cumulative amount of cladribine administered ad-justed for individual creatinine clearance) estimated based on the data was implemented (which means that the progressive and slow disappearance of effect is assigned to decay in the effect driver). The effect driver would thus be conceived as an extended exposure of cladribine, acting as an intermediate between the short systemic exposure and the long-lasting effect. The imple-mentation utilized a separate expression for each of the weekly treatments, as in: , , = , , , ∗ , ∗ ∗( ) Eq.13
where Expsi,t,week n is the individual measure of cladribine extended exposure at time t for weekly treatment n, calculated as the individual total amount of cladribine received during weekly treatment n (DOSEi,week n), adjusted by the individual calculated CLCR,i,t at time t, centered on the CLCR population median (CLCR,med). For the exponential expression, κ is an estimated parameter (a first-order rate constant) describing the decay in cladribine extended exposure, t is the time since first dose and Tdose is the time of the first day of weekly treat-ment n. The summation of the Expsi,t,week n expressions relative to each weekly treatment was then used to drive the drug-effect relationship, according to:
40
, = , , Eq.14
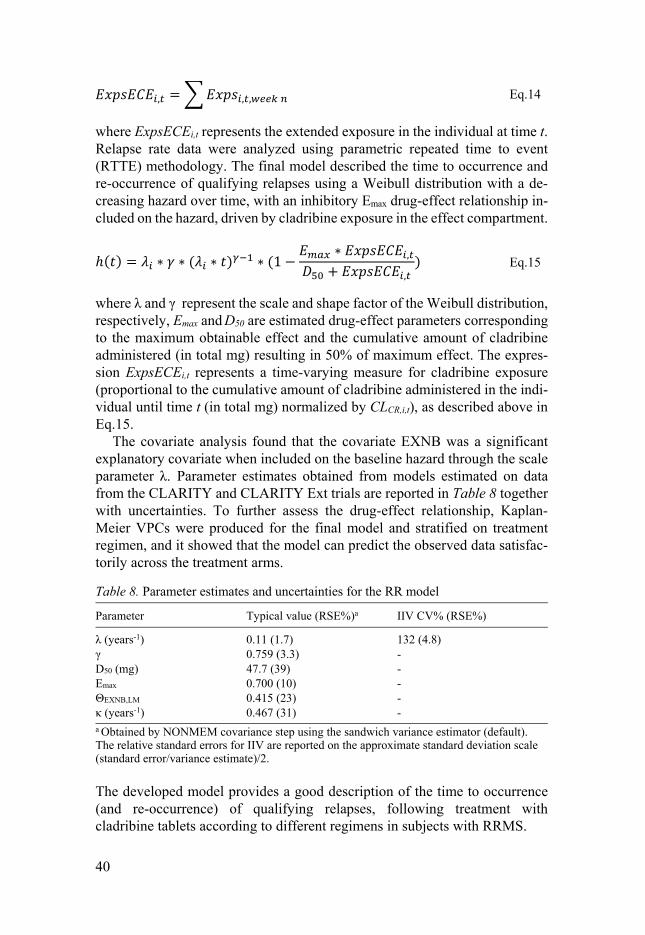
where ExpsECEi,t represents the extended exposure in the individual at time t. Relapse rate data were analyzed using parametric repeated time to event (RTTE) methodology. The final model described the time to occurrence and re-occurrence of qualifying relapses using a Weibull distribution with a de-creasing hazard over time, with an inhibitory Emax drug-effect relationship in-cluded on the hazard, driven by cladribine exposure in the effect compartment. ℎ( ) = ∗ ∗ ( ∗ ) ∗ (1 − ∗ ,+ , ) Eq.15
where λ and γ represent the scale and shape factor of the Weibull distribution, respectively, Emax and D50 are estimated drug-effect parameters corresponding to the maximum obtainable effect and the cumulative amount of cladribine administered (in total mg) resulting in 50% of maximum effect. The expres-sion ExpsECEi,t represents a time-varying measure for cladribine exposure (proportional to the cumulative amount of cladribine administered in the indi-vidual until time t (in total mg) normalized by CLCR,i,t), as described above in Eq.15.
The covariate analysis found that the covariate EXNB was a significant explanatory covariate when included on the baseline hazard through the scale parameter λ. Parameter estimates obtained from models estimated on data from the CLARITY and CLARITY Ext trials are reported in Table 8 together with uncertainties. To further assess the drug-effect relationship, Kaplan-Meier VPCs were produced for the final model and stratified on treatment regimen, and it showed that the model can predict the observed data satisfac-torily across the treatment arms.
Table 8. Parameter estimates and uncertainties for the RR model
Parameter Typical value (RSE%)a IIV CV% (RSE%)
λ (years-1) 0.11 (1.7) 132 (4.8)γ 0.759 (3.3) -D50 (mg) 47.7 (39) -Emax 0.700 (10) -ΘEXNB,LM 0.415 (23) -κ (years-1) 0.467 (31) - a Obtained by NONMEM covariance step using the sandwich variance estimator (default). The relative standard errors for IIV are reported on the approximate standard deviation scale (standard error/variance estimate)/2.
The developed model provides a good description of the time to occurrence (and re-occurrence) of qualifying relapses, following treatment with cladribine tablets according to different regimens in subjects with RRMS.

41
BoD The model was based on the previously developed model by Savic et al.95 and described MRI BoD observations as a continuous variable arising from an in-direct response model, as in: = − ∗ Eq.16
where kin represents the zero-order production rate, and kout represents the first-order disappearance rate of MRI BoD. Disappearance rate (parameterized as a half-life) and S0,i (MRI BoD baseline) were estimated, with kin defined ac-cording to: = ∗ , Eq.17
Time component was added in a linear fashion to investigate possible trends over time in burden of disease. However, available data did not show signifi-cant trends over time, and did not support the inclusion of disease progression. The distribution of S0,i was found to be right skewed, and a Box-Cox transfor-mation was implemented to handle this113. The cladribine effect was best de-scribed with an Emax function inhibiting the production of BoDs (kin), as in: = ∗ 1 − ∗ ,+ , − ∗ Eq.18
where Emax and D50 are estimated drug-effect parameters corresponding to the maximum obtainable effect and the drug potency describing the cumulative amount of cladribine administered (in total mg) needed to reach half of the maximum effect.
Cladribine treatment resulted in demonstrable benefit in reducing lesion load relative to placebo with an estimated maximal effect of 66%. The cladribine dose found to produce half maximal effect, 15mg, was rather low. However, this effect was not seen immediately as the half-life (HL) of disap-pearance of BoD was estimated to be 1076 days.
During exploration of the raw data it was noted that there were some in-consistencies in BoD data between CLA and CLA EXT trials in certain pro-portion of individuals, likely linked to a change in the methodology of meas-uring T2 volume. To accommodate this phenomenon, a mixture model was used, which resulted in significant improvement of the fit119. Here the model is defined so that two subpopulations are allowed: subpopulation with scaling constant equal to 1 and a subpopulation for which the scaling constant is esti-mated together with the likelihood that can be ascribed to each subpopulation. The proportion of patients belonging to a subpopulation having a scaling con-stant (SCONmix2) of 1.57 was estimated to be 0.566 (1-Pmix1), meaning that those patients will typically have 57% higher predictions during CLA EXT.

42
The covariate analysis found that years since MS diagnosis (MSD) and age were statistically significant explanatory variables when included as continu-ous relationships on MRI BoD baseline (S0,i), and that subject age was a sta-tistically significant explanatory variable when included as a continuous rela-tionship on the maximum drug-effect (Emax).
The final parameter estimates are reported in Table 9. Model evaluation by VPC showed that the model well captured the BoD dynamics both in placebo and cladribine tablets treated patients.
Table 9. Parameter estimates and uncertainties for the BoD model
Parameter Typical value (RSE%)a IIVb (RSE%)
S0 9801 (3) 0.994 (2)HL (days-1) 1076 (13) -Box-Cox S0 -0.167 (15) -ΘMSD,S0 (years-1) 0.0435 (13) -ΘAGE,S0 (years-1) -0.0109 (22) -ΘAGE,ALEMAX (years-1) -0.0083 (30) -EC50 14.7 (55) -Emax 0.66 (9) -SCONmix2 1.57 (3) -Pmix1 0.434 (9) -σ 26.9 (4) -σext,mix2 11.1 (8) -
a Obtained by NONMEM covariance step using the sandwich variance estimator (default). The relative standard errors for IIV are reported on the approximate standard deviation scale (standard error/variance estimate)/2. b Reported on standard deviation scale
EDSS Continuous approach A continuous model with a linear disease progression (DP) was developed. The model was constrained to have predictions between 0 and 10 using a logit-transform, as follows: = 10 ∗ 1(1 + ( )) Eq.19
where is the individual model prediction on the normal, observed, scale and logitEDSS is the unconstrained model prediction of the EDSS.
By model definition, the disease progression was linked to the disease ac-tivity, resulting in higher rate of progression with higher EDSS. For descrip-tion of cladribine treatment, a disease modifying effect was incorporated using an Emax drug-effect relationship with extended first-order exposure on the pro-gression of logitEDSS, as in:

43
= − ∗ ,+ , Eq.20
where logitEDSSt=0 is equal to baseline EDSS(S0). The final parameter esti-mates are reported in Table 10. Box-Cox transformation of all three random effects with estimated Box-Cox parameter provided an improvement of the fit. The additive BSV term associated with DP allowed both worsening and bettering of EDSS. This made the model very flexible in the description of disease progression and was expected to result in a better estimate of the true drug-effect, compared to forcing the disease progression to always be positive.
To model residual unexplained variability (RUV), an additive error model was used on the unconstrained EDSS model prediction. To improve further the model stability an additional additive RUV term was included with a fixed variance.
In the covariate search, it was found that patients with higher age and MSD had a higher S0. The negative estimates of the covariate effects are the result of EDSS being modeled in the unconstrained space.
Table 10. Parameter estimates and uncertainties for the EDSS model
Parameter Typical value (RSE%)a IIVb (RSE%)
S0 -0.972 (2.3) 0.667DP (years-1) 0.0283 (20) 0.101D50 (mg) 24.5 (37) -Emax 0.0176 (37) 3.178Box-Cox S0 -0.317 (17) -Box-Cox NDP 8.29 (32) -Box-Cox Emax -0.179 (6.6) -ΘMSD,S0 (years-1) -0.0198 (13) -ΘAGE,S0 (years-1) -0.0129 (16) -κ (years-1) 1.28 (13) -σadd 0.150 (4.1) -σadd 0.316 (FIXED) -
a Obtained by NONMEM covariance step using the sandwich variance estimator (default). The relative standard errors for IIV are reported on the approximate standard deviation scale (standard error/variance estimate)/2. b Reported on standard deviation scale

44
IRT approach Using the data from CLARITY, IRT methodology has been successfully im-plemented for the first time to model EDSS in patients with RRMS. The final baseline model contained 8 ordered categorical submodels (7 models corre-sponding to 7 FS and 1 describing the ambaid item constructed out of ambu-lation and reliance on aid) in which a total of 42 item specific parameters were estimated. The obtained ICCs are shown in Figure 7, illustrating that a person with higher IRT disability has a higher probability of increased scores for each item. Noteworthy are the low slope parameter of 0.49 for visual, meaning that a large increase in IRT disability only yields a small increase in the probability for an increased score on this item, and the high slope parameter value of 3.5 for ambaid resulting in a high discrimination power in IRT disability around the bi value of each score in this item.
Figure 7. Item characteristic curves per item: probability of occurrence of each score as a function of IRT disability at baseline (with positive values of disability indicat-ing a higher disability than the disability of the typical patient)
Figure 7 also highlights that the score of 0 is the most frequently observed, for most of the items. Also, the probability for a score of 0 drops quickly as the IRT disability increases, except for ambaid item where probability of hav-ing score of 0 remains 100% with increasing IRT disability until a certain level of IRT disability is reached. This is in line with common clinical knowledge that only patients with advanced stage of the disease will start experiencing impaired ambulation (EDSS higher than score of 4).

45
Probability curves for different scores of some items (e.g. mental) overlap over a range of IRT disability levels, indicating that a specific item doesn’t differentiate well between those scores for a given range of IRT disability.
The disease progression was best described with a power model with a signif-icant positive correlation of 0.59 (p<0.001) observed between baseline IRT disability and the disease progression rate, indicating that patients with higher IRT disability at baseline are likely to progress faster. The effect of cladribine on IRT disability was best described using both exposure-dependent and ex-posure-independent drug effects, according to the following equation: D (t) = D , + α ∗ t ∗ (1 − EffD) − Emax ∗ ExpsExps + Exps Eq.21
with IRT disability at baseline (D0), disease progression rate (α), power con-stant (pwr), maximal exposure-dependent drug effect (Emax), exposure needed for half maximal effect (Exps50) and constant exposure-independent drug effect (EffD).
The final model suggested that cladribine treatment significantly (p<0.001) slowed the disease-progression rate, with a 20% decrease in disease progres-sion rate compared to placebo, irrespective of exposure. The model also de-scribed an exposure dependent decrease in IRT disability in patients treated with cladribine tablets with a cumulative dose of 407 mg being needed for half maximal (exposure-dependent) effect in a typical patient. Final parameter es-timates for this model are shown in Table 11. The item-level VPC, with the example of brainstem item, in Figure 8 shows that for the duration of the trial there is a good agreement between observed and predicted scores. The ade-quate performance of the model was confirmed on total EDSS level.
Table 11. Parameter estimates and uncertainties for the IRT model
Parameter Typical value (RSE%)a IIVb (RSE%)
α (years-1)c 0.087 (6.5) 0.199 (6.9)pwr 0.707 (3.6) -Emax 0.171 (5.3) 2.20 (9.2)Exp50 (mg) 406.8 (4.8) -EffD 0.228 (18.6) -
a Obtained by bootstrap method (n=100) in NONMEM b Reported on standard deviation scale c Correlation between individual estimates of baseline disability and slope was estimated to 0.113 (18.6 %RSE) Coefficients for covariate-parameter relationships were obtained from the ra-tio of covariance between parameter and covariate variability to the covariate variance. Covariate analysis revealed that baseline IRT disability was corre-lated with age, duration of disease, and EXNB with coefficients of 0.027,

46
0.037 and 0.075 respectively. This means for instance, that a typical patient of 58 years, who is 20 years older than the population’s mean of 38 years, will have a baseline IRT disability that is 0.54 (i.e. 20*0.027) units higher on the disability scale, than the IRT disability of a typical patient with the mean age in this population. Similarly, there is a 7.5% increase in baseline IRT disability per number of relapses (>1) in the year previous to the study. Coefficients for covariates effects on the slope of disease progression were 0.0053, 0.0054 and 0.05 for age, duration of disease and EXNB respectively. Figure 9 illustrates how much of variability in baseline disability and in disease progression slope, respectively, can be explained by the investigated covariates: age, MSD and EXNB.
Figure 8. Visual predictive checks (VPCs) describing the time-courses of each score for the brainstem item. Median (blue solid line) of the observed data is compared to the 95% prediction interval (gray shaded area) for the simulated data
Figure 9. Impact of covariates on the variability of baseline IRT disability (left panel) and disease progression slope (right panel)
47
The IRT methodology has been applied here to ordered categorical data, but it has been shown by Ueckert et al. that it is equally suitable for other types of non-continuous data, such as binary or count data16.
Biomarker driven endpoint models (Paper II,V) The key pharmacodynamic effect of cladribine is an exposure-dependent re-duction in the ALC, which is believed to be linked to clinical benefits of cladribine administration. This served as a rationale for exploring the sequen-tial linkage between cladribine exposure, biomarker(s) and clinical end-point(s). A series of biomarker driven endpoint models was developed to this end.
The effect of ALC was included as an independent variable in RR, BoD and EDSS models. ALC derived measure DALC was used as a driver of the ALC effect. DALC was defined as the relative change of the individual model-predicted ALC at time t (ALCi,t) from the individual model-predicited baseline (ALC0,i), as follows:
, = 1 − ,, Eq.22
The statistically significant parameter-covariate relationship from previously developed models were kept without re-testing.
ALC-RR The relapse rate was described by a Weibull hazard function with estimated scale (λ) and shape factor (γ). Exponential IIV was included on λ and on the maximal effect of the ALC effect (ALEmax).
= ∗ 1 − , ∗ ,+ , ∗ ∗ ( ∗ ) Eq.23
The parameters of the final model with precision estimated from the SIR method are listed in Table 12. The maximal effect of ALC was estimated to be 0.973. DALC50 was estimated to be 0.334 and fell within the observed range of cladribine-induced reduction of ALC. Therefore, a 33% decrease in ALC is needed for a 49% decrease in hazard of occurrence of relapse.
Kaplan-Meier VPCs of the fit of the RTTE model to the RR data is dis-played in Figure 10, and showed good agreement between observed and model simulated data.
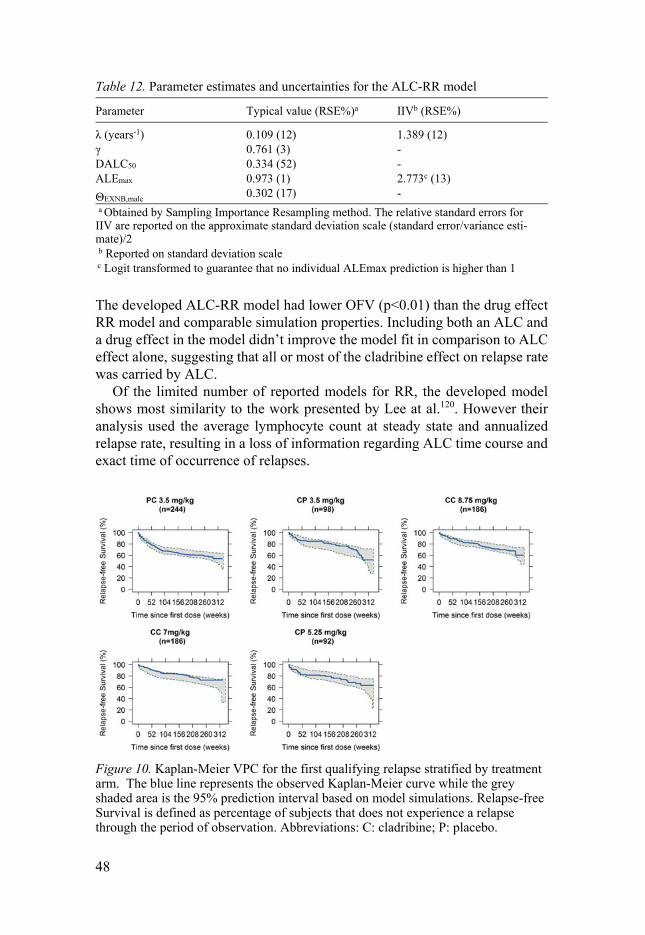
48
Table 12. Parameter estimates and uncertainties for the ALC-RR model
Parameter Typical value (RSE%)a IIVb (RSE%)
λ (years-1) 0.109 (12) 1.389 (12)γ 0.761 (3) -DALC50 0.334 (52) -ALEmax 0.973 (1) 2.773c (13)
ΘEXNB,male 0.302 (17) -
a Obtained by Sampling Importance Resampling method. The relative standard errors for IIV are reported on the approximate standard deviation scale (standard error/variance esti-mate)/2 b Reported on standard deviation scale c Logit transformed to guarantee that no individual ALEmax prediction is higher than 1
The developed ALC-RR model had lower OFV (p<0.01) than the drug effect RR model and comparable simulation properties. Including both an ALC and a drug effect in the model didn’t improve the model fit in comparison to ALC effect alone, suggesting that all or most of the cladribine effect on relapse rate was carried by ALC.
Of the limited number of reported models for RR, the developed model shows most similarity to the work presented by Lee at al.120. However their analysis used the average lymphocyte count at steady state and annualized relapse rate, resulting in a loss of information regarding ALC time course and exact time of occurrence of relapses.
Figure 10. Kaplan-Meier VPC for the first qualifying relapse stratified by treatment arm. The blue line represents the observed Kaplan-Meier curve while the grey shaded area is the 95% prediction interval based on model simulations. Relapse-free Survival is defined as percentage of subjects that does not experience a relapse through the period of observation. Abbreviations: C: cladribine; P: placebo.
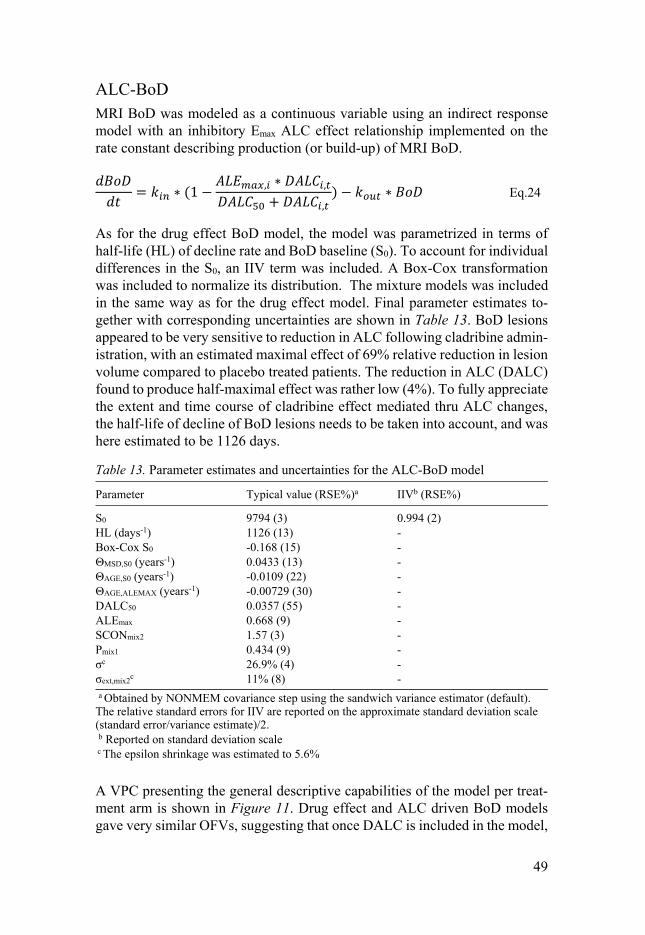
49
ALC-BoD MRI BoD was modeled as a continuous variable using an indirect response model with an inhibitory Emax ALC effect relationship implemented on the rate constant describing production (or build-up) of MRI BoD. = ∗ (1 − , ∗ ,+ , ) − ∗ Eq.24
As for the drug effect BoD model, the model was parametrized in terms of half-life (HL) of decline rate and BoD baseline (S0). To account for individual differences in the S0, an IIV term was included. A Box-Cox transformation was included to normalize its distribution. The mixture models was included in the same way as for the drug effect model. Final parameter estimates to-gether with corresponding uncertainties are shown in Table 13. BoD lesions appeared to be very sensitive to reduction in ALC following cladribine admin-istration, with an estimated maximal effect of 69% relative reduction in lesion volume compared to placebo treated patients. The reduction in ALC (DALC) found to produce half-maximal effect was rather low (4%). To fully appreciate the extent and time course of cladribine effect mediated thru ALC changes, the half-life of decline of BoD lesions needs to be taken into account, and was here estimated to be 1126 days.
Table 13. Parameter estimates and uncertainties for the ALC-BoD model
Parameter Typical value (RSE%)a IIVb (RSE%)
S0 9794 (3) 0.994 (2)HL (days-1) 1126 (13) -Box-Cox S0 -0.168 (15) -ΘMSD,S0 (years-1) 0.0433 (13) -ΘAGE,S0 (years-1) -0.0109 (22) -ΘAGE,ALEMAX (years-1) -0.00729 (30) -DALC50 0.0357 (55) -ALEmax 0.668 (9) -SCONmix2 1.57 (3) -Pmix1 0.434 (9) -σc 26.9% (4) -σext,mix2
c 11% (8) -
a Obtained by NONMEM covariance step using the sandwich variance estimator (default). The relative standard errors for IIV are reported on the approximate standard deviation scale (standard error/variance estimate)/2. b Reported on standard deviation scale c The epsilon shrinkage was estimated to 5.6%
A VPC presenting the general descriptive capabilities of the model per treat-ment arm is shown in Figure 11. Drug effect and ALC driven BoD models gave very similar OFVs, suggesting that once DALC is included in the model,
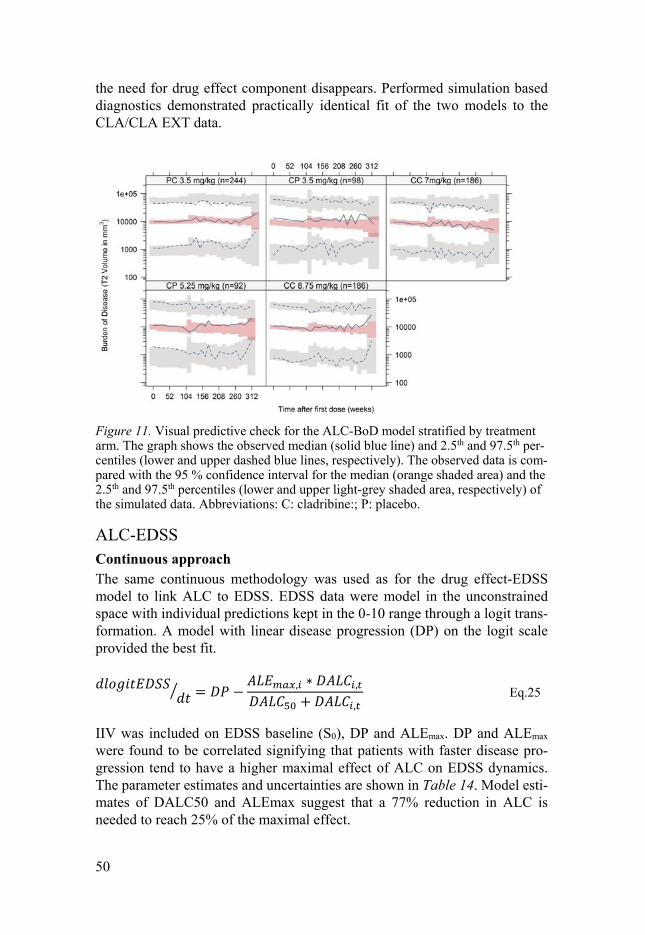
50
the need for drug effect component disappears. Performed simulation based diagnostics demonstrated practically identical fit of the two models to the CLA/CLA EXT data.
Figure 11. Visual predictive check for the ALC-BoD model stratified by treatment arm. The graph shows the observed median (solid blue line) and 2.5th and 97.5th per-centiles (lower and upper dashed blue lines, respectively). The observed data is com-pared with the 95 % confidence interval for the median (orange shaded area) and the 2.5th and 97.5th percentiles (lower and upper light-grey shaded area, respectively) of the simulated data. Abbreviations: C: cladribine:; P: placebo.
ALC-EDSS Continuous approach The same continuous methodology was used as for the drug effect-EDSS model to link ALC to EDSS. EDSS data were model in the unconstrained space with individual predictions kept in the 0-10 range through a logit trans-formation. A model with linear disease progression (DP) on the logit scale provided the best fit. = − , ∗ ,+ , Eq.25
IIV was included on EDSS baseline (S0), DP and ALEmax. DP and ALEmax were found to be correlated signifying that patients with faster disease pro-gression tend to have a higher maximal effect of ALC on EDSS dynamics. The parameter estimates and uncertainties are shown in Table 14. Model esti-mates of DALC50 and ALEmax suggest that a 77% reduction in ALC is needed to reach 25% of the maximal effect.

51
Table 14. Parameter estimates and uncertainties for the ALC-EDSS model
Parameter Typical value (RSE%)a IIVb (RSE%)
S0 -0.982 (2) 0.669(2)
DP (years-1) 0.0426 (12) 0.121 (4)Box-Cox S0 -0.316 (15) -Box-Cox NDP 7.08 (9) -Box-Cox ALEMAX -0.135 (20) -ΘMSD,S0 (years-1) -0.019 (13) -ΘAGE,S0 (years-1) -0.012 (16) -ALEmax 0.189 (14) 0.14 (4)DALC50 2.305 (12) -σadd 0.149 (4) -σadd 0.316 (FIXED) -
a Obtained by NONMEM covariance step using the sandwich variance estimator (default). The relative standard errors for IIV are reported on the approximate standard deviation scale (standard error/variance estimate)/2 b Reported on standard deviation scale c Correlation between individual estimates of DP and ALEmax estimated to 53% (6% RSE)
The model was evaluated using VPCs stratified by treatment arm (Figure 12) based on the actual design. In the simulations, the simulated EDSS was rounded to take on values in agreement with the clinical scale (i.e. 0, 1, 1.5, 2, etc.). Dropout was taken into account in these simulations.
Figure 12. VPC for the ALC-EDSS model stratified by treatment arm. The graph shows the observed median (solid blue line) and 2.5th and 97.5th percentiles (lower and upper dashed blue lines, respectively). The observed data is compared with the 95 % confidence interval for the median (orange shaded area) and the 2.5th and 97.5th percentiles (lower and upper light-grey shaded area, respectively) of the simu-lated data.
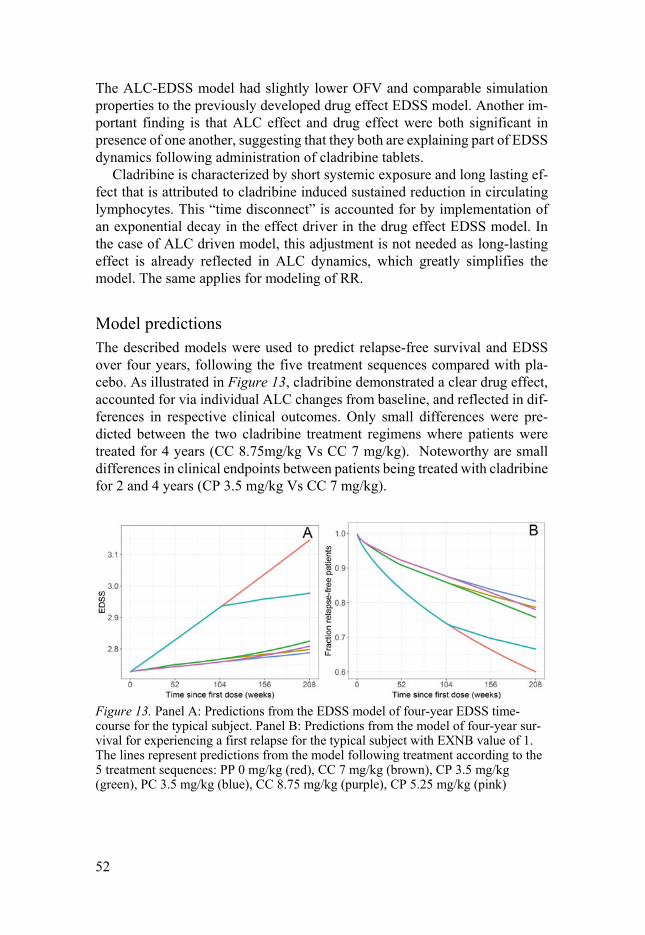
52
The ALC-EDSS model had slightly lower OFV and comparable simulation properties to the previously developed drug effect EDSS model. Another im-portant finding is that ALC effect and drug effect were both significant in presence of one another, suggesting that they both are explaining part of EDSS dynamics following administration of cladribine tablets.
Cladribine is characterized by short systemic exposure and long lasting ef-fect that is attributed to cladribine induced sustained reduction in circulating lymphocytes. This “time disconnect” is accounted for by implementation of an exponential decay in the effect driver in the drug effect EDSS model. In the case of ALC driven model, this adjustment is not needed as long-lasting effect is already reflected in ALC dynamics, which greatly simplifies the model. The same applies for modeling of RR.
Model predictions The described models were used to predict relapse-free survival and EDSS over four years, following the five treatment sequences compared with pla-cebo. As illustrated in Figure 13, cladribine demonstrated a clear drug effect, accounted for via individual ALC changes from baseline, and reflected in dif-ferences in respective clinical outcomes. Only small differences were pre-dicted between the two cladribine treatment regimens where patients were treated for 4 years (CC 8.75mg/kg Vs CC 7 mg/kg). Noteworthy are small differences in clinical endpoints between patients being treated with cladribine for 2 and 4 years (CP 3.5 mg/kg Vs CC 7 mg/kg).
Figure 13. Panel A: Predictions from the EDSS model of four-year EDSS time-course for the typical subject. Panel B: Predictions from the model of four-year sur-vival for experiencing a first relapse for the typical subject with EXNB value of 1. The lines represent predictions from the model following treatment according to the 5 treatment sequences: PP 0 mg/kg (red), CC 7 mg/kg (brown), CP 3.5 mg/kg (green), PC 3.5 mg/kg (blue), CC 8.75 mg/kg (purple), CP 5.25 mg/kg (pink)

53
ALC-BoD-EDSS IRT approach was used in the development of this model. Model-predicted ALC and BoD were tested as predictors of EDSS dynamics separately or sim-ultaneously.
RBoD, the model predicted rate of change of BoD, in addition to DALC was found to be the best predictor of EDSS time course, as outlined in the equation bellow: = ( + | | ∗ ∗ ) ∗ ∗ − , ∗ ,+ , Eq.26
Where D represents IRT disability, α disease progression rate, β the size of the BoD effect, pwr power constant.
The parameter estimates from the final ALC & BoD-EDSS model are shown in Table 15.
Table 15. Parameter estimates and uncertainties for the ALC-BoD-EDSS model
Parameter Typical value (RSE%)a IIVb (RSE%)
DP slope (years-1) 0.146 (22) 0.08 (28)DP power 0.763 (9) -ALEmax 0.0258 (27) 2.34 (28)DALC50 0.187 (53) -RBoD 0.034 (46) 0.46 (18)
a Obtained by Sampling Importance Resampling method. The relative standard errors for IIV are reported on the approximate standard deviation scale (standard error/variance esti-mate)/2 b Reported on standard deviation scale c Correlation between individual estimates of DP and ALEmax was estimated to 0.127 (81 %RSE)
A disease progression of 0.15 scores on disability scale per year was esti-mated, as well as significant positive correlation between baseline IRT disa-bility and the disease progression rate, suggesting that patients with higher baseline IRT disability will have a higher rate of disability progression. ALE-max of DALC relationship was estimated to 0.0258 and DALC50 was estimated to 0.187. Figure 14 shows the schematic representation of the modeling framework.

54
Figure 14. Schematic representation of the modeling framework.
The use of IRT approach allowed appreciation of the data description quality for the model both on individual item level and composite score level from Figures 15 and 16, respectively. Figure 15 displays an example for brainstem item, but all other EDSS items were well described by the model. In the Figure 16, simulated item responses were through the developed algorithm linked back to compute the total score in order to assess the adequacy of our model to describe the data of total score level.
Figure 15. Visual predictive checks (VPCs) describing the time-courses of each score for the brainstem item. Median (blue solid line) of the observed data is com-pared to the 95% prediction interval (gray shaded area) for the simulated data
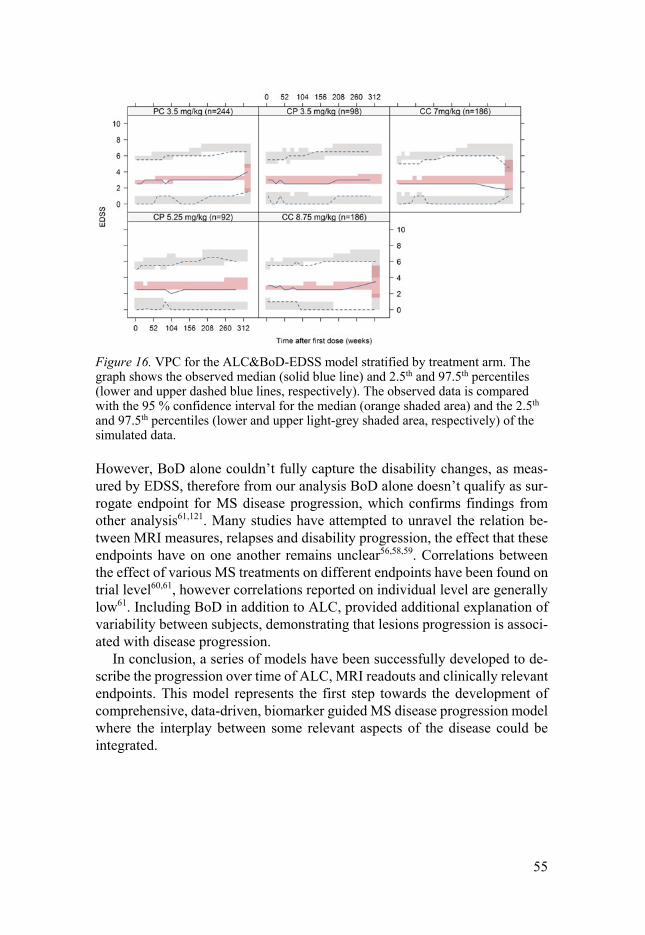
55
Figure 16. VPC for the ALC&BoD-EDSS model stratified by treatment arm. The graph shows the observed median (solid blue line) and 2.5th and 97.5th percentiles (lower and upper dashed blue lines, respectively). The observed data is compared with the 95 % confidence interval for the median (orange shaded area) and the 2.5th and 97.5th percentiles (lower and upper light-grey shaded area, respectively) of the simulated data.
However, BoD alone couldn’t fully capture the disability changes, as meas-ured by EDSS, therefore from our analysis BoD alone doesn’t qualify as sur-rogate endpoint for MS disease progression, which confirms findings from other analysis61,121. Many studies have attempted to unravel the relation be-tween MRI measures, relapses and disability progression, the effect that these endpoints have on one another remains unclear56,58,59. Correlations between the effect of various MS treatments on different endpoints have been found on trial level60,61, however correlations reported on individual level are generally low61. Including BoD in addition to ALC, provided additional explanation of variability between subjects, demonstrating that lesions progression is associ-ated with disease progression.
In conclusion, a series of models have been successfully developed to de-scribe the progression over time of ALC, MRI readouts and clinically relevant endpoints. This model represents the first step towards the development of comprehensive, data-driven, biomarker guided MS disease progression model where the interplay between some relevant aspects of the disease could be integrated.
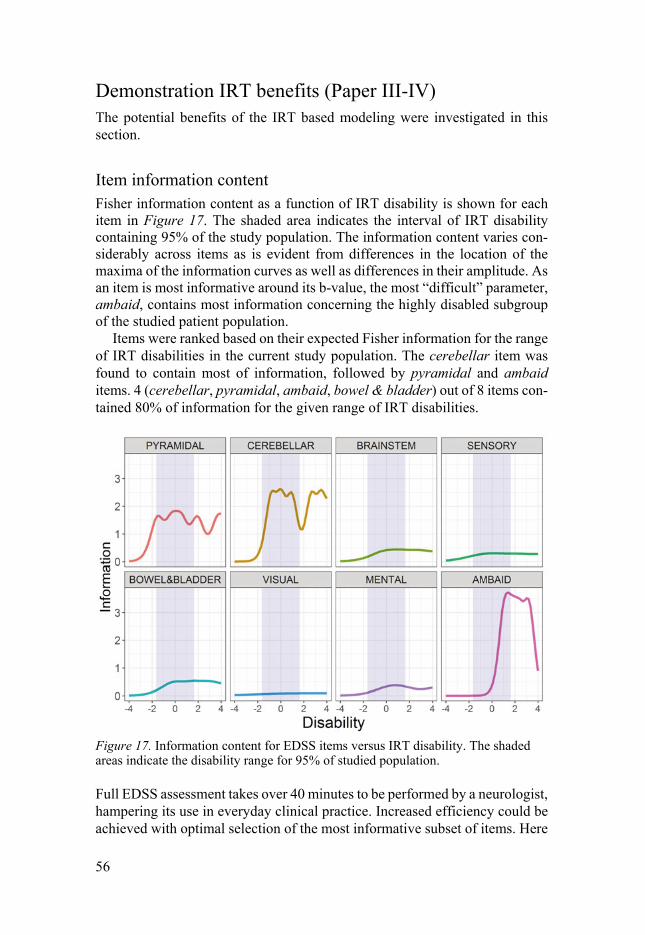
56
Demonstration IRT benefits (Paper III-IV) The potential benefits of the IRT based modeling were investigated in this section.
Item information content Fisher information content as a function of IRT disability is shown for each item in Figure 17. The shaded area indicates the interval of IRT disability containing 95% of the study population. The information content varies con-siderably across items as is evident from differences in the location of the maxima of the information curves as well as differences in their amplitude. As an item is most informative around its b-value, the most “difficult” parameter, ambaid, contains most information concerning the highly disabled subgroup of the studied patient population.
Items were ranked based on their expected Fisher information for the range of IRT disabilities in the current study population. The cerebellar item was found to contain most of information, followed by pyramidal and ambaid items. 4 (cerebellar, pyramidal, ambaid, bowel & bladder) out of 8 items con-tained 80% of information for the given range of IRT disabilities.
Figure 17. Information content for EDSS items versus IRT disability. The shaded areas indicate the disability range for 95% of studied population.
Full EDSS assessment takes over 40 minutes to be performed by a neurologist, hampering its use in everyday clinical practice. Increased efficiency could be achieved with optimal selection of the most informative subset of items. Here
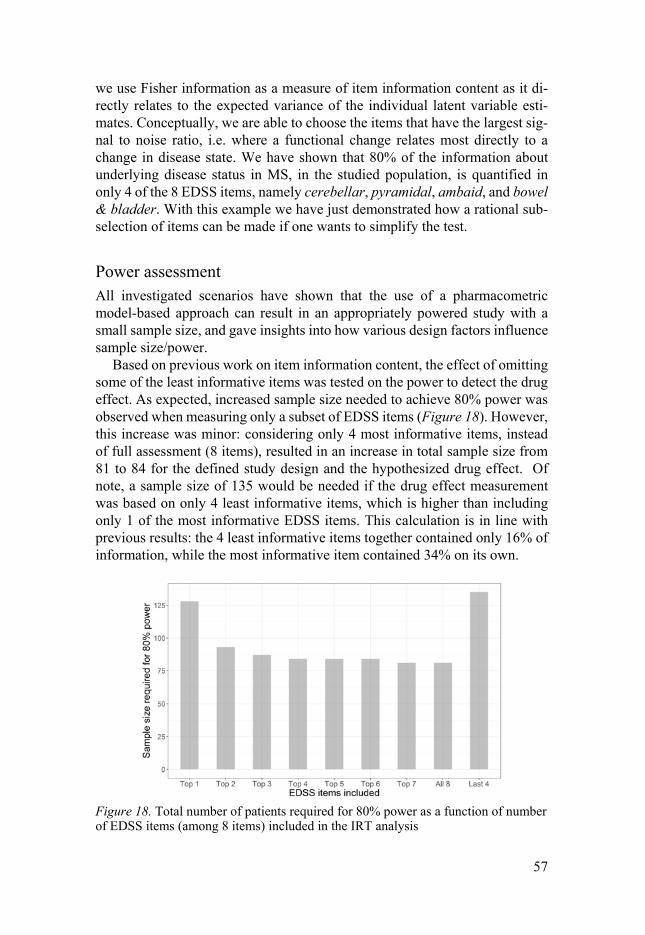
57
we use Fisher information as a measure of item information content as it di-rectly relates to the expected variance of the individual latent variable esti-mates. Conceptually, we are able to choose the items that have the largest sig-nal to noise ratio, i.e. where a functional change relates most directly to a change in disease state. We have shown that 80% of the information about underlying disease status in MS, in the studied population, is quantified in only 4 of the 8 EDSS items, namely cerebellar, pyramidal, ambaid, and bowel & bladder. With this example we have just demonstrated how a rational sub-selection of items can be made if one wants to simplify the test.
Power assessment All investigated scenarios have shown that the use of a pharmacometric model-based approach can result in an appropriately powered study with a small sample size, and gave insights into how various design factors influence sample size/power.
Based on previous work on item information content, the effect of omitting some of the least informative items was tested on the power to detect the drug effect. As expected, increased sample size needed to achieve 80% power was observed when measuring only a subset of EDSS items (Figure 18). However, this increase was minor: considering only 4 most informative items, instead of full assessment (8 items), resulted in an increase in total sample size from 81 to 84 for the defined study design and the hypothesized drug effect. Of note, a sample size of 135 would be needed if the drug effect measurement was based on only 4 least informative items, which is higher than including only 1 of the most informative EDSS items. This calculation is in line with previous results: the 4 least informative items together contained only 16% of information, while the most informative item contained 34% on its own.
Figure 18. Total number of patients required for 80% power as a function of number of EDSS items (among 8 items) included in the IRT analysis
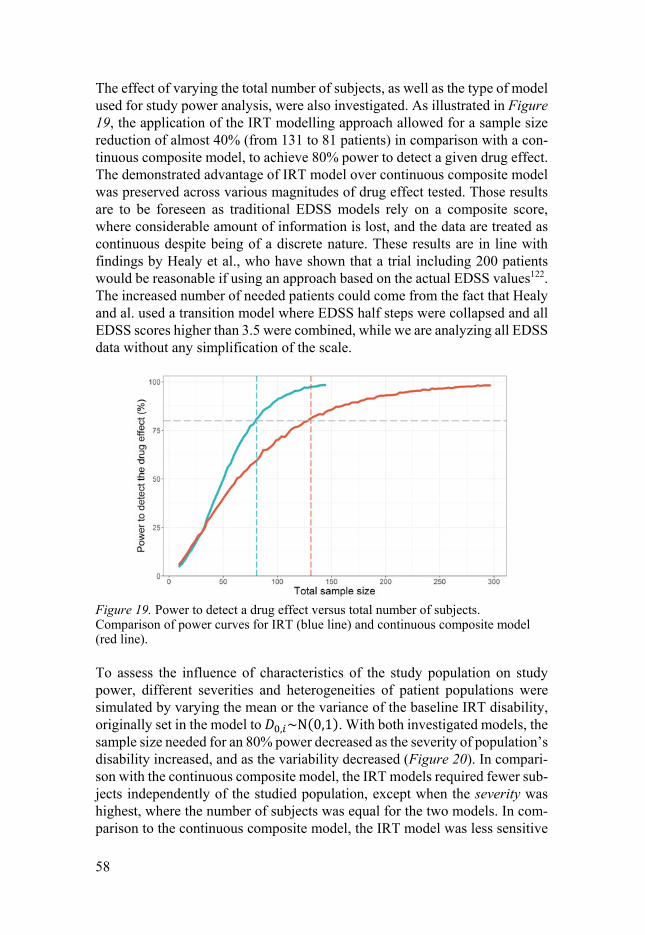
58
The effect of varying the total number of subjects, as well as the type of model used for study power analysis, were also investigated. As illustrated in Figure 19, the application of the IRT modelling approach allowed for a sample size reduction of almost 40% (from 131 to 81 patients) in comparison with a con-tinuous composite model, to achieve 80% power to detect a given drug effect. The demonstrated advantage of IRT model over continuous composite model was preserved across various magnitudes of drug effect tested. Those results are to be foreseen as traditional EDSS models rely on a composite score, where considerable amount of information is lost, and the data are treated as continuous despite being of a discrete nature. These results are in line with findings by Healy et al., who have shown that a trial including 200 patients would be reasonable if using an approach based on the actual EDSS values122. The increased number of needed patients could come from the fact that Healy and al. used a transition model where EDSS half steps were collapsed and all EDSS scores higher than 3.5 were combined, while we are analyzing all EDSS data without any simplification of the scale.
Figure 19. Power to detect a drug effect versus total number of subjects. Comparison of power curves for IRT (blue line) and continuous composite model (red line).
To assess the influence of characteristics of the study population on study power, different severities and heterogeneities of patient populations were simulated by varying the mean or the variance of the baseline IRT disability, originally set in the model to , ~Ν(0,1). With both investigated models, the sample size needed for an 80% power decreased as the severity of population’s disability increased, and as the variability decreased (Figure 20). In compari-son with the continuous composite model, the IRT models required fewer sub-jects independently of the studied population, except when the severity was highest, where the number of subjects was equal for the two models. In com-parison to the continuous composite model, the IRT model was less sensitive

59
in terms of statistical power to population attributes (sample size ranging from 69 to 99 patients). It is common that measurement scales, and even more so composite ones, perform poorer in patients in early disease stages123, and that a heterogeneous patient population implies a higher percentage of early stage patients.
Figure 20. Sample size required to obtain 80% power in different study populations, whose disease severity is defined as , ~Ν( , ) when analyzing the data with an IRT or a continuous composite model. A: variation of severity of the simulated population by varying the mean of baseline IRT disability. B: variation of heterogeneity of simulated population by varying the variance of baseline IRT disability
This work further demonstrates the potential benefits of an IRT model versus a continuous model. While complex, its novel methodology has demonstrated some advantages by using item-level data in a meaningful manner instead of aggregating the information by deriving a composite score. It is, however, im-portant to consider that the application of model-based power calculations, in general, relies on the assumption that the true underlying model is known. Consequently, obtained power results and corresponding sample sizes should be interpreted with caution. This is the case with this study, since the analysis was based on simulated data, furthermore assuming no dropout and full com-pliance. The simulation of these variables, while theoretically possible, was beyond the scope of this work. Moreover, another important limitation of our study was the use of the same model to generate and to subsequently analyze the data, which favors the model in question, here the IRT model. Neverthe-less, this was inevitable given that generating the data with the continuous model would allow for simulation of total EDSS score only and therefore wouldn’t allow for the application of the IRT approach.
60
Conclusions and future perspectives
The pharmacometric models developed in this thesis work provide a better understanding of the pharmacokinetics and pharmacodynamics of cladribine in RRMS patients. They also enable the characterization of the natural pro-gression of multiple sclerosis. Figure 21 shows a schematic illustration of models developed in this thesis. This thesis demonstrates how exposure-bi-omaker-clinical/efficacy endpoint relationships might be assessed in an inte-grated manner using the complete time-course of variables. This enables the understanding of the behavior of the key outcomes necessary for the success-ful drug development of long awaited MS therapies, as well as how these out-comes correlate with each other. The value of the developed pharmacometric models was demonstrated by an increased power to detect a potential drug effect in the setting of MS clinical trials, allowing for the recruitment of fewer patients. In addition, the models can be used to refine endpoints such as clini-cal scales. By identifying the most important and discriminative components of such scales, they can optimize their use and potentially lead to adaptations that seek to decrease patients and caregiver’s burden.
In particular:
• The exposure of cladribine and its main metabolite, CAde, was characterized in RRMS patients using a population PK model describing plasma and urine time-courses.
• The ALC, BoD, EDSS and RR endpoints were successfully described by exposure-response models. The models were able to quantify the clear drug effect of cladribine tablets and to give insight into disease progression of RRMS.
• The integrated modeling framework allowed an understand-ing of the interplay between ALC and clinical efficacy end-points. ALC was found to be a promising predictor of RR. Also, ALC and BoD were identified as predictors of change in EDSS.
• By considering the true underlying nature of item-level data, the IRT methodology, an alternative approach to modeling of composite scores, enabled to quantify the information content of the individual components of EDSS, which could
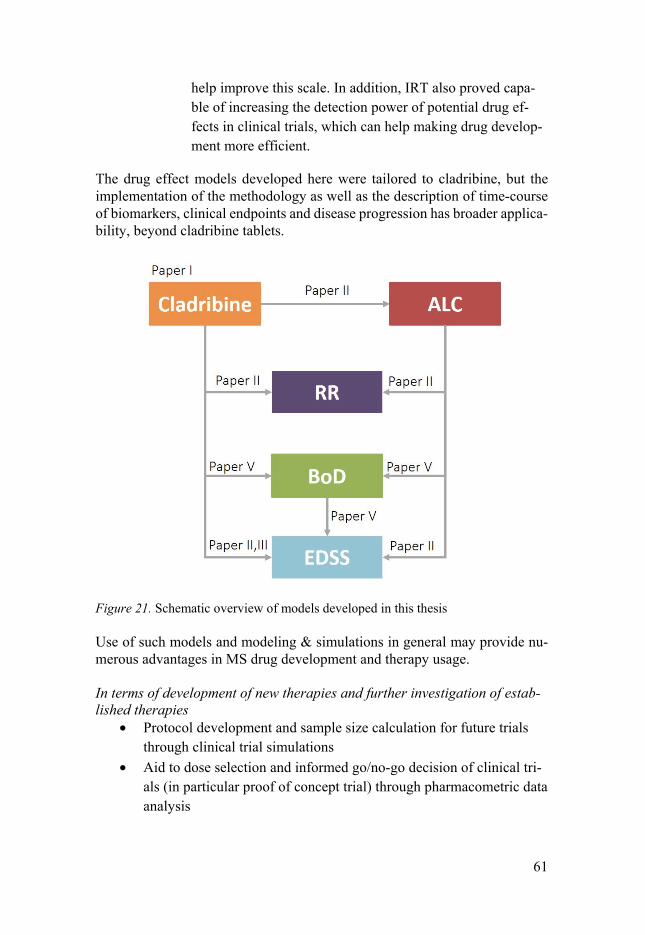
61
help improve this scale. In addition, IRT also proved capa-ble of increasing the detection power of potential drug ef-fects in clinical trials, which can help making drug develop-ment more efficient.
The drug effect models developed here were tailored to cladribine, but the implementation of the methodology as well as the description of time-course of biomarkers, clinical endpoints and disease progression has broader applica-bility, beyond cladribine tablets.
Figure 21. Schematic overview of models developed in this thesis
Use of such models and modeling & simulations in general may provide nu-merous advantages in MS drug development and therapy usage. In terms of development of new therapies and further investigation of estab-lished therapies
• Protocol development and sample size calculation for future trials through clinical trial simulations
• Aid to dose selection and informed go/no-go decision of clinical tri-als (in particular proof of concept trial) through pharmacometric data analysis
62
• Study population selection through the identification of important covariates
• Unbiased assessment of disease progression critical to accurate quantification of drug effect
• Assessment of drug effect on different components of disease pro-gression e.g. different EDSS items through IRT methodology
• Benchmark efficacy and safety of novel compounds against existing ones through model-based meta-analysis
In terms of individual patient • Identification of patient subgroups at high risk of disease progres-
sion through powerful detection of prognostic covariates
• Identification/prediction of therapy failure/success through identifi-cation of predictive covariates
• Dose individualization through accurate prediction of individual ex-posure
The continuation of this work would include evaluation of how general the developed models are i.e. if the identified relationships persist and to what extent with treatment with other disease modifying agents than cladribine, and extending the models with other biomarkers.

63
Acknowledgements
The research presented in this thesis was conducted at the Department of Phar-maceutical Bioscience at Uppsala University. I am grateful to DDMoRe initi-ative that funded major parts of this work. I am very thankful to Anna-Maria Lundin’s Fund at Smålands Nation and Apotekarsociteten for providing travel funds making it possible for me to attend interesting courses and present re-sults at several worthwhile international conferences.
I would like to express my sincere gratitude to all who have contributed, di-rectly or indirectly, to this thesis and especially to:
My supervisor Prof Mats Karlsson for letting me be part of your group, for sharing your never-ending enthusiasm for science and making everything seem so easy (at least, while I was in your office, it would rapidly change as soon as I would step into mine). And a very special thank you for always being supportive for my (logistically challenging) private life.
My co-supervisor Assoc Prof Radojka Savic for being supportive and for all great advice. I have really appreciated my time in San Francisco; I wish we could have spent more time together.
My “permanent” co-author Alain Munafo from Merck KGaA for always being supportive, for providing us with data, and for keeping close interest in our work.
My “temporary” co-authors Elke, Elodie, Sebastian, Anders T., Emilie and Siv, for all your efforts and bringing new ideas into my projects.
Cladribine clinical team for sharing their knowledge and much appreciated input, and especially Kammy for being always helpful and available.
Prof Margareta Hammarlund-Udenaes for making this department such a great place.
Prof Lena Friberg and Prof Ulrica Simonsson for great working environment.

64
Prof Anne-Marie Landtblom, Assoc Prof Andrew Hooker and Klas Petersson for taking on the task of being my half-time opponents and valuable feedback.
Siv for welcoming me on my first day in the department and your kindness and care.
Magnus, Jerker and Tobias for IT support.
Kajsa and Rikard for doing such an amazing work with PsN.
Marina, Ulrica and Karin for all the administrative help.
Agneta for the layout of the manuscripts.
Last but not least, all others that made/make (and hopefully will continue to make) this department a truly unique place.
65
References
1 FDA. Innovation or stagnation? Challenge and opportunity on the critical path to new medical products,
https://www.fda.gov/downloads/ScienceResearch/SpecialTopics/Criti-calPathInitiative/CriticalPathOpportunitiesReports/ucm113411.pdf (2004).
2 Ette, E. & Williams, P. E. Pharmacometrics: The Science of Quantitative Phar-macology., (2007).
3 FDA. End-of-Phase 2A Meetings, <https://www.fda.gov/downloads/ Drugs/.../Guidances/ucm079690.pdf> (2009).
4 Workgroup, E. M. et al. Good Practices in Model-Informed Drug Discovery and Development: Practice, Application, and Documentation. CPT Pharmacometrics Syst Pharmacol 5, 93-122, doi:10.1002/psp4.12049 (2016).
5 Miller, R. et al. How modeling and simulation have enhanced decision making in new drug development. J Pharmacokinet Pharmacodyn 32, 185-197, doi:10.1007/s10928-005-0074-7 (2005).
6 Lee, J. Y. et al. Impact of pharmacometric analyses on new drug approval and labelling decisions: a review of 198 submissions between 2000 and 2008. Clin Pharmacokinet 50, 627-635, doi:10.2165/11593210-000000000-00000 (2011).
7 Zhang, L. et al. Model-based drug development: the road to quantitative phar-macology. J Pharmacokinet Pharmacodyn 33, 369-393, doi:10.1007/s10928-006-9010-8 (2006).
8 Lalonde, R. L. et al. Model-based drug development. Clin Pharmacol Ther 82, 21-32, doi:10.1038/sj.clpt.6100235 (2007).
9 Jonsson, E. N. & Sheiner, L. B. More efficient clinical trials through use of sci-entific model-based statistical tests. Clin Pharmacol Ther 72, 603-614, doi:10.1067/mcp.2002.129307 (2002).
10 Bauer, R. J., Guzy, S. & Ng, C. A survey of population analysis methods and software for complex pharmacokinetic and pharmacodynamic models with ex-amples. Aaps J 9, E60-83, doi:10.1208/aapsj0901007 (2007).
11 Beal, S. L., Sheiner, L. B., Boeckmann, A. & Bauer, R. J. NONMEM user's guides (1989-2009). Ellicott City: Icon Development Solutions (2009).
12 Chang, C. H. & Reeve, B. B. Item response theory and its applications to patient-reported outcomes measurement. Eval Health Prof 28, 264-282, doi:10.1177/0163278705278275 (2005).
13 van Hout, B. et al. Interim scoring for the EQ-5D-5L: mapping the EQ-5D-5L to EQ-5D-3L value sets. Value in health : the journal of the International Society for Pharmacoeconomics and Outcomes Research 15, 708-715, doi:10.1016/j.jval.2012.02.008 (2012).
14 Baker, F. B. The Basics of Item Response Theory. (2001). 15 Balsis, S., Unger, A. A., Benge, J. F., Geraci, L. & Doody, R. S. Gaining preci-
sion on the Alzheimer's Disease Assessment Scale-cognitive: a comparison of item response theory-based scores and total scores. Alzheimers Dement 8, 288-294, doi:10.1016/j.jalz.2011.05.2409 (2012).
66
16 Ueckert, S. et al. Improved Utilization of ADAS-Cog Assessment Data Through Item Response Theory Based Pharmacometric Modeling. Pharm Res, doi:10.1007/s11095-014-1315-5 (2014).
17 Woodward, M. Formulas for Sample-Size, Power and Minimum Detectable Rel-ative Risk in Medical Studies. Statistician 41, 185-196, doi:Doi 10.2307/2348252 (1992).
18 Suresh, K. & Chandrashekara, S. Sample size estimation and power analysis for clinical research studies. Journal of human reproductive sciences 5, 7-13, doi:10.4103/0974-1208.97779 (2012).
19 Ette, E. I., Sun, H. & Ludden, T. M. Balanced designs in longitudinal population pharmacokinetic studies. J Clin Pharmacol 38, 417-423 (1998).
20 Hale, M. D., Gillespie, W. R., Gupta, S. K., Tuk, B. & Holford, N. Clinical trial simulation: streamlining you drug development process. Appl Clin Trials 5, 35-40 (1996).
21 Lockwood, P., Ewy, W., Hermann, D. & Holford, N. Application of Clinical Trial Simulation to Compare Proof-of-Concept Study Designs for Drugs with a Slow Onset of Effect; An Example in Alzheimer's Disease. Pharm Res 23, 2050, doi:10.1007/s11095-006-9048-8 (2006).
22 Kowalski, K. G. & Hutmacher, M. M. Design evaluation for a population phar-macokinetic study using clinical trial simulations: a case study. Stat Med 20, 75-91 (2001).
23 Karlsson, K. E., Vong, C., Bergstrand, M., Jonsson, E. N. & Karlsson, M. O. Comparisons of Analysis Methods for Proof-of-Concept Trials. CPT Pharmaco-metrics Syst Pharmacol 2, e23, doi:10.1038/psp.2012.24 (2013).
24 Karlsson, K. E., Grahnen, A., Karlsson, M. O. & Jonsson, E. N. Randomized exposure-controlled trials; impact of randomization and analysis strategies. Br J Clin Pharmacol 64, 266-277, doi:10.1111/j.1365-2125.2007.02887.x (2007).
25 Lee, P. I. Design and power of a population pharmacokinetic study. Pharm Res 18, 75-82 (2001).
26 Goldman, M. D., Motl, R. W. & Rudick, R. A. Possible clinical outcome measures for clinical trials in patients with multiple sclerosis. Ther Adv Neurol Disord 3, 229-239, doi:10.1177/1756285610374117 (2010).
27 Tullman, M. J. Overview of the epidemiology, diagnosis, and disease progres-sion associated with multiple sclerosis. The American journal of managed care 19, S15-20 (2013).
28 Kurtzke, J. F. Epidemiology and etiology of multiple sclerosis. Phys Med Re-habil Clin N Am 16, 327-349, doi:10.1016/j.pmr.2005.01.013 (2005).
29 Lunemann, J. D., Kamradt, T., Martin, R. & Munz, C. Epstein-barr virus: envi-ronmental trigger of multiple sclerosis? Journal of virology 81, 6777-6784, doi:10.1128/jvi.00153-07 (2007).
30 Sibley, W. A., Bamford, C. R. & Clark, K. Clinical viral infections and multiple sclerosis. Lancet 1, 1313-1315 (1985).
31 Chitnis, T. The role of CD4 T cells in the pathogenesis of multiple sclerosis. International review of neurobiology 79, 43-72, doi:10.1016/S0074-7742(07)79003-7 (2007).
32 Heard, R. N. The spectrum of multiple sclerosis. Curr Allergy Asthma Rep 7, 280-284 (2007).
33 Meier, D. S., Weiner, H. L. & Guttmann, C. R. Time-series modeling of multiple sclerosis disease activity: a promising window on disease progression and repair potential? Neurotherapeutics 4, 485-498, doi:10.1016/j.nurt.2007.05.008 (2007).
34 Charcot, M. Histologie de la sclerose en plaques. Gaz Hosp 141, 554-555 (1868).

67
35 Hauser, S. L., Chan, J. R. & Oksenberg, J. R. Multiple sclerosis: Prospects and promise. Ann Neurol 74, 317-327, doi:10.1002/ana.24009 (2013).
36 Torkildsen, O., Myhr, K. M. & Bo, L. Disease-modifying treatments for multiple sclerosis - a review of approved medications. European journal of neurology 23 Suppl 1, 18-27, doi:10.1111/ene.12883 (2016).
37 Dhib-Jalbut, S. & Marks, S. Interferon-beta mechanisms of action in multiple scle-rosis. Neurology 74 Suppl 1, S17-24, doi:10.1212/WNL.0b013e3181c97d99 (2010).
38 Racke, M. K., Lovett-Racke, A. E. & Karandikar, N. J. The mechanism of action of glatiramer acetate treatment in multiple sclerosis. Neurology 74 Suppl 1, S25-30, doi:10.1212/WNL.0b013e3181c97e39 (2010).
39 Papadopoulou, A., Kappos, L. & Sprenger, T. Teriflunomide for oral therapy in multiple sclerosis. Expert review of clinical pharmacology 5, 617-628, doi:10.1586/ecp.12.56 (2012).
40 Linker, R. A. & Gold, R. Dimethyl fumarate for treatment of multiple sclerosis: mechanism of action, effectiveness, and side effects. Current neurology and neu-roscience reports 13, 394, doi:10.1007/s11910-013-0394-8 (2013).
41 Kappos, L. et al. A placebo-controlled trial of oral fingolimod in relapsing mul-tiple sclerosis. N Engl J Med 362, 387-401, doi:10.1056/NEJMoa0909494 (2010).
42 Polman, C. H. et al. A randomized, placebo-controlled trial of natalizumab for relapsing multiple sclerosis. N Engl J Med 354, 899-910, doi:10.1056/NEJMoa044397 (2006).
43 Brown, J. W. & Coles, A. J. Alemtuzumab: evidence for its potential in relaps-ing-remitting multiple sclerosis. Drug Des Devel Ther 7, 131-138, doi:10.2147/dddt.s32687 (2013).
44 Comi, G., Hartung, H. P., Kurukulasuriya, N. C., Greenberg, S. J. & Scaramozza, M. Cladribine tablets for the treatment of relapsing-remitting multiple sclerosis. Expert opinion on pharmacotherapy 14, 123-136, doi:10.1517/14656566.2013.754012 (2013).
45 Leist, T. P. & Weissert, R. Cladribine: mode of action and implications for treat-ment of multiple sclerosis. Clin Neuropharmacol 34, 28-35, doi:10.1097/WNF.0b013e318204cd90 (2011).
46 Carson, D. A., Wasson, D. B., Taetle, R. & Yu, A. Specific toxicity of 2-chloro-deoxyadenosine toward resting and proliferating human lymphocytes. Blood 62, 737-743 (1983).
47 Hartung, H. P., Aktas, O., Kieseier, B. & Giancarlo Comi, G. C. Development of oral cladribine for the treatment of multiple sclerosis. J Neurol 257, 163-170, doi:10.1007/s00415-009-5359-0 (2010).
48 Leist, T. P. & Vermersch, P. The potential role for cladribine in the treatment of multiple sclerosis: clinical experience and development of an oral tablet formu-lation. Current medical research and opinion 23, 2667-2676, doi:10.1185/030079907X233142 (2007).
49 Giovannoni, G. et al. A placebo-controlled trial of oral cladribine for relapsing multiple sclerosis. N Engl J Med 362, 416-426, doi:10.1056/NEJMoa0902533 (2010).
50 Kurtzke, J. F. Rating neurologic impairment in multiple sclerosis: an expanded disability status scale (EDSS). Neurology 33, 1444-1452 (1983).
51 Sharrack, B. & Hughes, R. A. Clinical scales for multiple sclerosis. J Neurol Sci 135, 1-9 (1996).

68
52 Hobart, J., Freeman, J. & Thompson, A. Kurtzke scales revisited: the application of psychometric methods to clinical intuition. Brain 123 ( Pt 5), 1027-1040 (2000).
53 Weinshenker, B. G. et al. The natural history of multiple sclerosis: a geograph-ically based study. 2. Predictive value of the early clinical course. Brain 112 ( Pt 6), 1419-1428 (1989).
54 Amato, M. P. & Portaccio, E. Clinical outcome measures in multiple sclerosis. J Neurol Sci 259, 118-122, doi:10.1016/j.jns.2006.06.031 (2007).
55 Vickrey, B. G., Hays, R. D., Harooni, R., Myers, L. W. & Ellison, G. W. A health-related quality of life measure for multiple sclerosis. Quality of Life Re-search 4, 187-206, doi:10.1007/bf02260859 (1995).
56 Confavreux, C., Vukusic, S., Moreau, T. & Adeleine, P. Relapses and progres-sion of disability in multiple sclerosis. N Engl J Med 343, 1430-1438, doi:10.1056/NEJM200011163432001 (2000).
57 McFarland, H. F., Barkhof, F., Antel, J. & Miller, D. H. The role of MRI as a surrogate outcome measure in multiple sclerosis. Mult Scler 8, 40-51 (2002).
58 Keegan, B. M. & Weinshenker, B. G. Laquinimod, a new oral drug for multiple sclerosis. Lancet 371, 2059-2060, doi:10.1016/S0140-6736(08)60894-6 (2008).
59 Barkhof, F. The clinico-radiological paradox in multiple sclerosis revisited. Curr Opin Neurol 15, 239-245 (2002).
60 Sormani, M. P. et al. Magnetic resonance imaging as a potential surrogate for relapses in multiple sclerosis: a meta-analytic approach. Ann Neurol 65, 268-275, doi:10.1002/ana.21606 (2009).
61 Sormani, M. P. et al. Surrogate endpoints for EDSS worsening in multiple scle-rosis. A meta-analytic approach. Neurology 75, 302-309, doi:10.1212/WNL.0b013e3181ea15aa (2010).
62 Bakshi, R. et al. MRI in multiple sclerosis: current status and future prospects. Lancet Neurol 7, 615-625, doi:10.1016/S1474-4422(08)70137-6 (2008).
63 Healy, B. C., Engler, D., Glanz, B., Musallam, A. & Chitnis, T. Assessment of definitions of sustained disease progression in relapsing-remitting multiple scle-rosis. Mult Scler Int 2013, 189624, doi:10.1155/2013/189624 (2013).
64 Gold, R. et al. Placebo-controlled phase 3 study of oral BG-12 for relapsing mul-tiple sclerosis. N Engl J Med 367, 1098-1107, doi:10.1056/NEJMoa1114287 (2012).
65 O'Connor, P. et al. Randomized trial of oral teriflunomide for relapsing multiple sclerosis. N Engl J Med 365, 1293-1303, doi:10.1056/NEJMoa1014656 (2011).
66 Fox, R. J. et al. Placebo-controlled phase 3 study of oral BG-12 or glatiramer in multiple sclerosis. N Engl J Med 367, 1087-1097, doi:10.1056/NEJMoa1206328 (2012).
67 Lavery, A. M., Verhey, L. H. & Waldman, A. T. Outcome measures in relapsing-remitting multiple sclerosis: capturing disability and disease progression in clin-ical trials. Mult Scler Int 2014, 262350, doi:10.1155/2014/262350 (2014).
68 Miller, D. H. et al. A controlled trial of natalizumab for relapsing multiple scle-rosis. N Engl J Med 348, 15-23, doi:10.1056/NEJMoa020696 (2003).
69 Kappos, L. et al. Oral fingolimod (FTY720) for relapsing multiple sclerosis. N Engl J Med 355, 1124-1140, doi:10.1056/NEJMoa052643 (2006).
70 Comi, G. et al. Effect of laquinimod on MRI-monitored disease activity in pa-tients with relapsing-remitting multiple sclerosis: a multicentre, randomised, double-blind, placebo-controlled phase IIb study. Lancet 371, 2085-2092, doi:10.1016/S0140-6736(08)60918-6 (2008).
69
71 Zivadinov, R. & Leist, T. P. Clinical-magnetic resonance imaging correlations in multiple sclerosis. J Neuroimaging 15, 10S-21S, doi:10.1177/1051228405283291 (2005).
72 Wynn, D. et al. Daclizumab in active relapsing multiple sclerosis (CHOICE study): a phase 2, randomised, double-blind, placebo-controlled, add-on trial with interferon beta. Lancet Neurol 9, 381-390, doi:10.1016/S1474-4422(10)70033-8 (2010).
73 EMEA. (2015). 74 Polman, C. H. et al. Diagnostic criteria for multiple sclerosis: 2010 Revisions to
the McDonald criteria. Ann Neurol 69, 292-302, doi:10.1002/ana.22366 (2011). 75 Plan, E. L., Karlsson, K. E. & Karlsson, M. O. Approaches to simultaneous anal-
ysis of frequency and severity of symptoms. Clin Pharmacol Ther 88, 255-259, doi:10.1038/clpt.2010.118 (2010).
76 Ribba, B. et al. A review of mixed-effects models of tumor growth and effects of anticancer drug treatment used in population analysis. CPT Pharmacometrics Syst Pharmacol 3, e113, doi:10.1038/psp.2014.12 (2014).
77 Bender, B. C., Schindler, E. & Friberg, L. E. Population pharmacokinetic-phar-macodynamic modelling in oncology: a tool for predicting clinical response. Br J Clin Pharmacol 79, 56-71, doi:10.1111/bcp.12258 (2015).
78 Schuck, E. L. & Derendorf, H. Pharmacokinetic/pharmacodynamic evaluation of anti-infective agents. Expert Rev Anti Infect Ther 3, 361-373, doi:10.1586/14787210.3.3.361 (2005).
79 Free Egelund, E., Bergesch Barth, A. & Arthur Peloquin, C. Population Pharma-cokinetics and its Role in Anti-Tuberculosis Drug Development and Optimiza-tion of Treatment. Current Pharmaceutical Design 17, 2889-2899, doi:10.2174/138161211797470246 (2011).
80 Romero, K. et al. Pharmacometrics as a Discipline Is Entering the “Industriali-zation” Phase: Standards, Automation, Knowledge Sharing, and Training Are Critical for Future Success. The Journal of Clinical Pharmacology 50, 9S-19S, doi:10.1177/0091270010377788 (2010).
81 Gauthier, S. A., Glanz, B. I., Mandel, M. & Weiner, H. L. A model for the com-prehensive investigation of a chronic autoimmune disease: the multiple sclerosis CLIMB study. Autoimmun Rev 5, 532-536, doi:10.1016/j.autrev.2006.02.012 (2006).
82 Gauthier, S. A. et al. Predicting short-term disability in multiple sclerosis. Neu-rology 68, 2059-2065, doi:10.1212/01.wnl.0000264890.97479.b1 (2007).
83 Mandel, M., Gauthier, S. A., Guttmann, C. R., Weiner, H. L. & Betensky, R. A. Estimating Time to Event From Longitudinal Categorical Data: An Analysis of Multiple Sclerosis Progression. J Am Stat Assoc 102, 1254-1266, doi:10.1198/016214507000000059 (2007).
84 Mandel, M., Mercier, F., Eckert, B., Chin, P. & Betensky, R. A. Estimating time to disease progression comparing transition models and survival methods--an analysis of multiple sclerosis data. Biometrics 69, 225-234, doi:10.1111/biom.12002 (2013).
85 Lake, S., J., P. & Mandel, M. in ECTRIMS (2010). 86 Savic, R. M., Munafo, A. & Karlsson, M. O. in ACOP (San Diego, 2011). 87 Agresti, A. Analysis of Ordinal Categorical Data. 2nd Edition edn, (2010). 88 Hancock, G. R. & Mueller, R. O. Quantitative Methods in Education and the
Behavioral Sciences: Issues, Research, and Teaching. (ed University of Mary-land Ralph O. Mueller Gregory R. Hancock, University of Hartford).
89 Hu, X. et al. in PAGE (2014).
70
90 Roskell, N. S., Zimovetz, E. A., Rycroft, C. E., Eckert, B. J. & Tyas, D. A. An-nualized relapse rate of first-line treatments for multiple sclerosis: a meta-anal-ysis, including indirect comparisons versus fingolimod. Current medical re-search and opinion 28, 767-780, doi:10.1185/03007995.2012.681637 (2012).
91 Plan, E. L., Ma, G., Nagard, M., Jensen, J. & Karlsson, M. O. Transient lower esophageal sphincter relaxation pharmacokinetic-pharmacodynamic modeling: count model and repeated time-to-event model. J Pharmacol Exp Ther 339, 878-885, doi:10.1124/jpet.111.181636 (2011).
92 Mercier, F., Demin, I. & Ohlssen, D. in PAGE (2011). 93 Mercier, F., Chin, P. & Gordon, F. Dealing with excess of zeros in the statistical
analysis of magnetic resonance imaging lesion count in multiple sclerosis. Pharm Stat 11, 417-424 (2012).
94 Hang, Y. et al. in PAGE (Alicante, 2014). 95 Savic, R. M., Munafo, A. & Karlsson, M. O. in PAGE (2011). 96 Graham, G., Mercier, F., Looby, M. & Racine, A. in PAGE (2010). 97 Clinical Trial Report No: 27820. A Phase IIIb, Double-blind, Placebo-con-
trolled, Multicenter, Parallel Group, Extension Trial to Evaluate the Safety and Tolerability of Oral Cladribine in Subjects with Relapsing- Remitting Multiple Sclerosis (RRMS) Who Have Completed Trial 25643 (CLARITY).
98 R: A Language and Environment for Statistical Computing. (2014). 99 Keizer, R. J., Karlsson, M. O. & Hooker, A. Modeling and Simulation Work-
bench for NONMEM: Tutorial on Pirana, PsN, and Xpose. CPT Pharmacomet-rics Syst Pharmacol 2, e50, doi:10.1038/psp.2013.24 (2013).
100 Karlsson, M. O. in PAGE (2012). 101 Edelen, M. O. & Reeve, B. B. Applying item response theory (IRT) modeling to
questionnaire development, evaluation, and refinement. Qual Life Res 16 Suppl 1, 5-18, doi:10.1007/s11136-007-9198-0 (2007).
102 Zhang, L., Beal, S. L. & Sheinerz, L. B. Simultaneous vs. sequential analysis for population PK/PD data II: robustness of methods. J Pharmacokinet Pharmaco-dyn 30, 405-416 (2003).
103 Wade, J. R. & Karlsson, M. O. in PAGE Meeting (Saintes, France, 1999). 104 Lacroix, B. D., Friberg, L. E. & Karlsson, M. O. Evaluation of IPPSE, an alter-
native method for sequential population PKPD analysis. J Pharmacokinet Phar-macodyn 39, 177-193, doi:10.1007/s10928-012-9240-x (2012).
105 Karlsson, M. O. & Holford, N. in PAGE (2008). 106 Bergstrand, M., Hooker, A. & Karlsson, M. O. in PAGE Abstr 1604 [www.page-
meeting.org/?abstract=1604] (2009). 107 Dosne, A. G., Bergstrand, M., Harling, K. & Karlsson, M. O. Improving the
estimation of parameter uncertainty distributions in nonlinear mixed effects models using sampling importance resampling. J Pharmacokinet Pharmacodyn, doi:10.1007/s10928-016-9487-8 (2016).
108 Novakovic, A. M., Krekels, E. H., Munafo, A., Ueckert, S. & Karlsson, M. O. Application of Item Response Theory to Modeling of Expanded Disability Status Scale in Multiple Sclerosis. Aaps J, doi:10.1208/s12248-016-9977-z (2016).
109 Vong, C., Bergstrand, M., Nyberg, J. & Karlsson, M. O. Rapid sample size cal-culations for a defined likelihood ratio test-based power in mixed-effects mod-els. Aaps J 14, 176-186, doi:10.1208/s12248-012-9327-8 (2012).
110 Lindemalm, S. et al. Application of population pharmacokinetics to cladribine. BMC Pharmacol 5, 4, doi:10.1186/1471-2210-5-4 (2005).
111 Karlsson, M. O., Port, R. E., Ratain, M. J. & Sheiner, L. B. A population model for the leukopenic effect of etoposide. Clin Pharmacol Ther 57, 325-334, doi:10.1016/0009-9236(95)90158-2 (1995).
71
112 Friberg, L. E., Brindley, C. J., Karlsson, M. O. & Devlin, A. J. Models of sched-ule dependent haematological toxicity of 2'-deoxy-2'-methylidenecytidine (DMDC). European journal of clinical pharmacology 56, 567-574 (2000).
113 Petersson, K. J., Hanze, E., Savic, R. M. & Karlsson, M. O. Semiparametric dis-tributions with estimated shape parameters. Pharm Res 26, 2174-2185, doi:10.1007/s11095-009-9931-1 (2009).
114 Michie, C. A., McLean, A., Alcock, C. & Beverley, P. C. Lifespan of human lymphocyte subsets defined by CD45 isoforms. Nature 360, 264-265, doi:10.1038/360264a0 (1992).
115 Mercier, F. & Chanu, P. in Noordwijkerhout. 116 Pigeolet, E., Luttringer, O., Wallstrom, E., Legangneux, E. & Hamren, B. in
PAGE (2011). 117 Brossard, P. et al. Pharmacokinetics and pharmacodynamics of ponesimod, a
selective S1P1 receptor modulator, in the first-in-human study. Br J Clin Phar-macol 76, 888-896, doi:10.1111/bcp.12129 (2013).
118 Savic, R. M., Novakovic, A. M., Ekblom, M., Munafo, A. & Karlsson, M. O. Population Pharmacokinetics of Cladribine in Patients with Multiple Sclerosis. Clin Pharmacokinet, 1-9, doi:10.1007/s40262-017-0516-6 (2017).
119 Carlsson, K. C., Savic, R. M., Hooker, A. C. & Karlsson, M. O. Modeling sub-populations with the $MIXTURE subroutine in NONMEM: finding the individ-ual probability of belonging to a subpopulation for the use in model analysis and improved decision making. Aaps J 11, 148-154, doi:10.1208/s12248-009-9093-4 (2009).
120 Lee, J. Y. & Wang, Y. Use of a biomarker in exposure-response analysis to sup-port dose selection for fingolimod. CPT Pharmacometrics Syst Pharmacol 2, e67, doi:10.1038/psp.2013.44 (2013).
121 Daumer, M., Neuhaus, A., Morrissey, S., Hintzen, R. & Ebers, G. C. MRI as an outcome in multiple sclerosis clinical trials. Neurology 72, 705-711, doi:10.1212/01.wnl.0000336916.38629.43 (2009).
122 Healy, B., Chitnis, T. & Engler, D. Improving power to detect disease progres-sion in multiple sclerosis through alternative analysis strategies. J Neurol 258, 1812-1819, doi:10.1007/s00415-011-6021-1 (2011).
123 Movement Disorder Society Task Force on Rating Scales for Parkinson's, D. The Unified Parkinson's Disease Rating Scale (UPDRS): status and recommen-dations. Movement disorders : official journal of the Movement Disorder Soci-ety 18, 738-750, doi:10.1002/mds.10473 (2003).
Acta Universitatis UpsaliensisDigital Comprehensive Summaries of Uppsala Dissertationsfrom the Faculty of Pharmacy 225
Editor: The Dean of the Faculty of Pharmacy
A doctoral dissertation from the Faculty of Pharmacy, UppsalaUniversity, is usually a summary of a number of papers. A fewcopies of the complete dissertation are kept at major Swedishresearch libraries, while the summary alone is distributedinternationally through the series Digital ComprehensiveSummaries of Uppsala Dissertations from the Faculty ofPharmacy. (Prior to January, 2005, the series was publishedunder the title “Comprehensive Summaries of UppsalaDissertations from the Faculty of Pharmacy”.)
Distribution: publications.uu.seurn:nbn:se:uu:diva-316562
ACTAUNIVERSITATIS
UPSALIENSISUPPSALA
2017