lonmin presentation
TRANSCRIPT

8/12/2019 lonmin Presentation
http://slidepdf.com/reader/full/lonmin-presentation 1/18
Lonmin Plc
Ian Farmer CEO1 March 2011
BMO GLOBAL METALS & MINING CONFERENCE

8/12/2019 lonmin Presentation
http://slidepdf.com/reader/full/lonmin-presentation 2/18
2
The Platinum Investment Case
2Medium to long term investment case remains compelling
Platinum demand has grown by 3% per annum on average since 1990
3.5
4.5
5.5
6.5
7.5
8.5
9.5
90 95 00 05 10 15
Millionou
nces
0200
400
600
800
1000
1200
1400
1600
1800
2000
US$/o
z
Demand Off-Road Diesel An Avg Price (right)
US recession
Source: Historical - JM, Forecast - Lonmin
"Credit
Crunch"
3.1% per year
average growth(180 koz pa)
Jewellery contracts
due to high price
Forecast
2011
Y-t-D
Avg

8/12/2019 lonmin Presentation
http://slidepdf.com/reader/full/lonmin-presentation 3/18
3
Automotive Demand
China, pent-up demand and access to credit supporting unit sales 3
2,000
3,000
4,000
5,000
6,000
7,000
8,000
9,000
0
2,000
4,000
6,000
8,000
10,000
12,000
14,000
16,000
80 82 84 86 88 90 92 94 96 98 00 02 04 06 08 10 12
Quarterly vehicle sales*
and platinum supply(rhs '000 oz; lhs '000 units)
Vehicle Sales
Pt Supply
Source: SFA (Oxford) from Oxford Economics, ACEA, JAMA, Ward's Auto, CAAM, Bloomberg* Include all vehicle sales in W.Europe, Japan, China and light vehicle sales in the United States
10 quarter downturn
12 quarter downturn
5 quarterdownturn
Scrappageschemes
Recovery & emergingmarket growth

8/12/2019 lonmin Presentation
http://slidepdf.com/reader/full/lonmin-presentation 4/18
Platinum Demand in HDD and Off-road
Legislative requirements in Heavy Duty diesel engines and off-roaddiesel remains on track 4
523
484286
369
507618
677 668 68440
188
290
443 456 472
0
200
400
600
800
1,000
1,200
1,400
2007 2008 2009 2010 2011 2012 2013 2014 2015
Heavy Commercial Vehicles Off-road engines
Pt demand in on-road heavy commercial vehicles and off-road engines, koz
+870 koz
Source: SFA
8/12/2019 lonmin Presentation
http://slidepdf.com/reader/full/lonmin-presentation 5/18
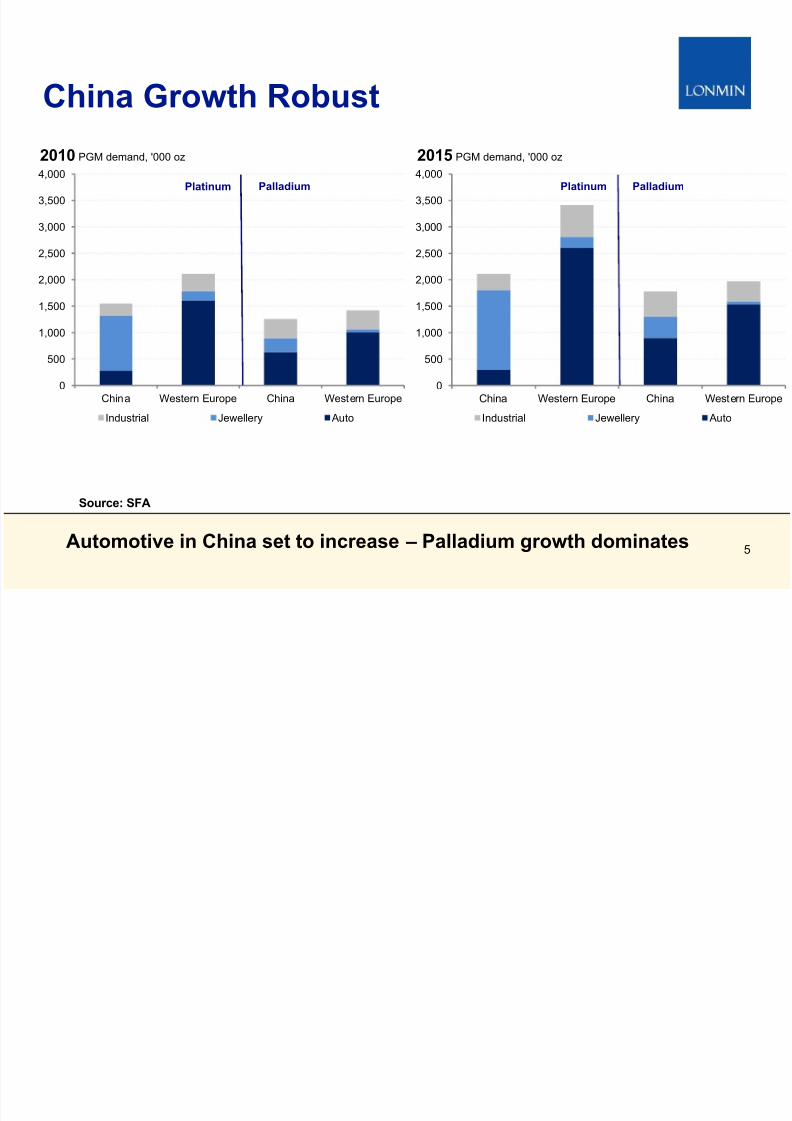
China Growth Robust
5Automotive in China set to increase – Palladium growth dominates
Source: SFA
0
500
1,000
1,500
2,000
2,500
3,000
3,500
4,000
China Western Europe China Western Europe
2010 PGM demand, '000 oz
Industrial Jewellery Auto
Platinum Palladium
0
500
1,000
1,500
2,000
2,500
3,000
3,500
4,000
China Western Europe China Western Europe
2015 PGM demand, '000 oz
Industrial Jewellery Auto
Platinum Palladium
8/12/2019 lonmin Presentation
http://slidepdf.com/reader/full/lonmin-presentation 6/18
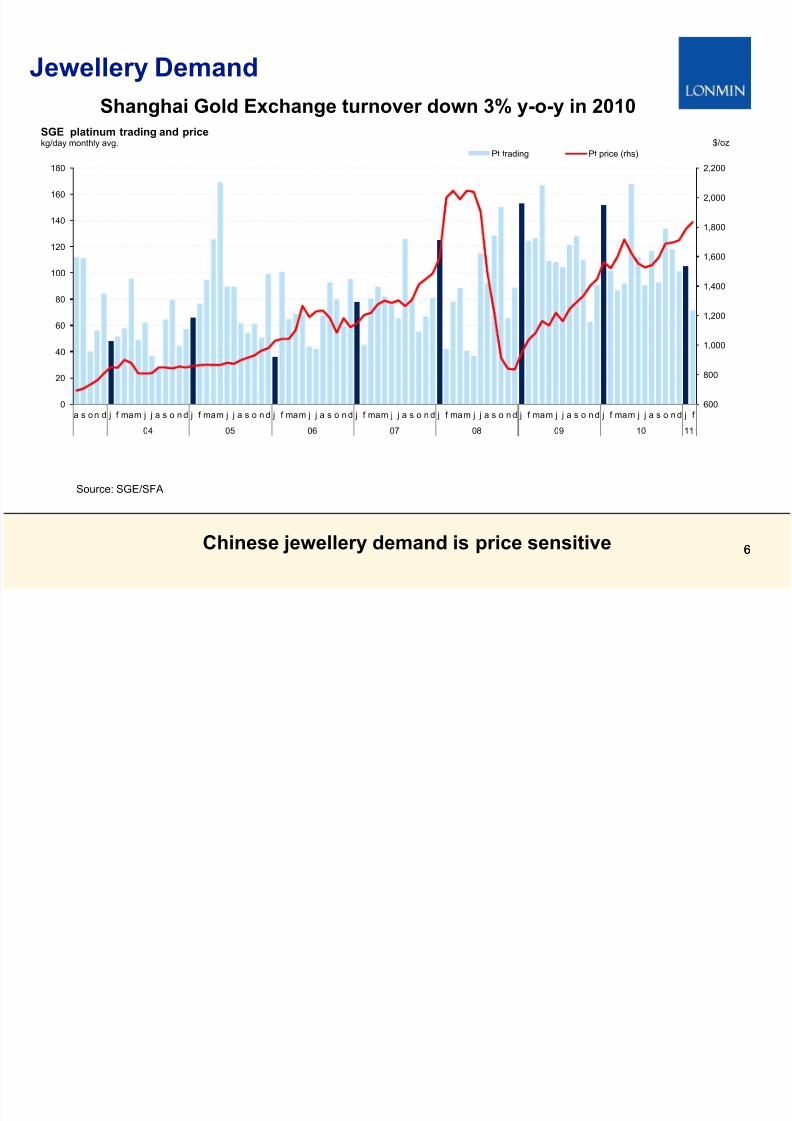
66Chinese jewellery demand is price sensitive
Jewellery Demand
Source: SGE/SFA
600
800
1,000
1,200
1,400
1,600
1,800
2,000
2,200
0
20
40
60
80
100
120
140
160
180
a s o n d j f mam j j a s o n d j f mam j j a s o n d j f mam j j a s o n d j f mam j j a s o n d j f mam j j a s o n d j f mam j j a s o n d j f mam j j a s o n d j f
04 05 06 07 08 09 10 11
SGE platinum trading and pricekg/day monthly avg.
Pt trading Pt price (rhs)
$/oz
Shanghai Gold Exchange turnover down 3% y-o-y in 2010

8/12/2019 lonmin Presentation
http://slidepdf.com/reader/full/lonmin-presentation 7/18
Impact of Auto Trends on PGM Demand
Extra >15 million passenger cars p.a. forecast by 2020 outweighsnegative impacts on PGMs from powertrain developments 7
Unit SalesVolumes
EngineSize
PGM demand trend
Drive-train &Diesel vs Gas
EmissionLegislation
Substitution& thrifting
8/12/2019 lonmin Presentation
http://slidepdf.com/reader/full/lonmin-presentation 8/18
8
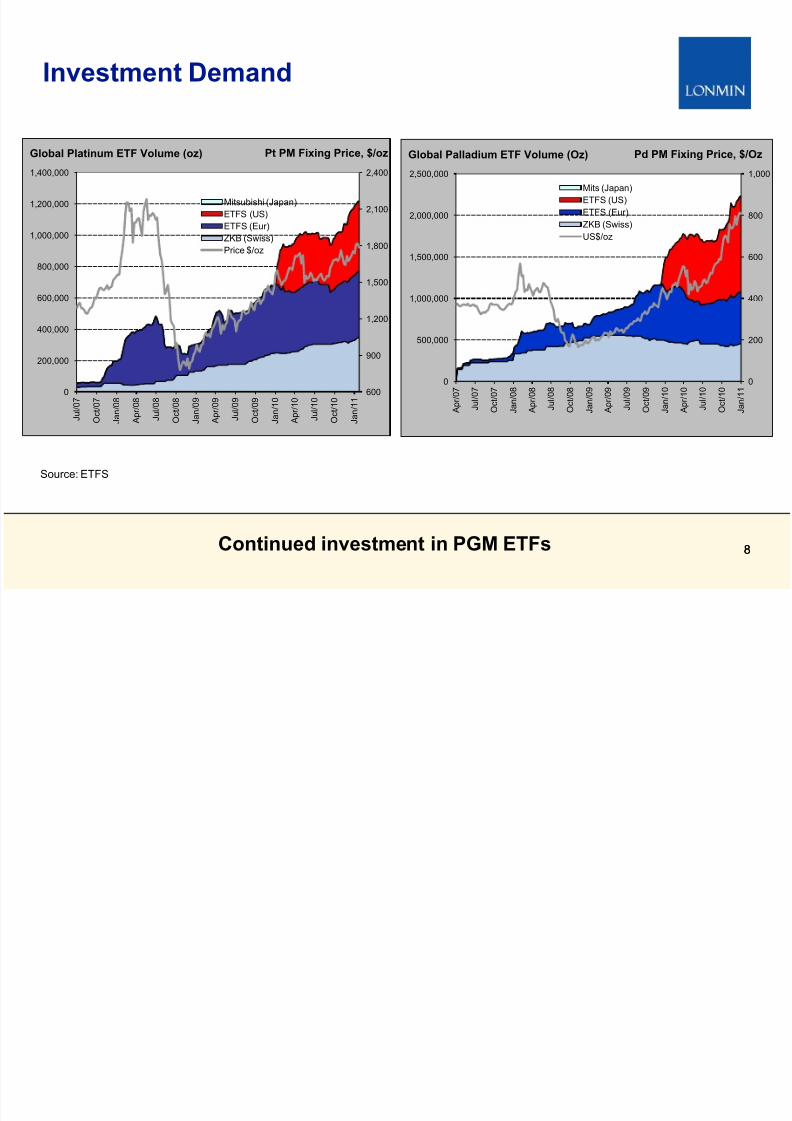
Investment Demand
8
Source: ETFS
Continued investment in PGM ETFs
600
900
1,200
1,500
1,800
2,100
2,400
0
200,000
400,000
600,000
800,000
1,000,000
1,200,000
1,400,000
J u
l / 0 7
O c
t / 0 7
J a n / 0 8
A p
r / 0 8
J u
l / 0 8
O c
t / 0 8
J a n / 0 9
A p
r / 0 9
J u
l / 0 9
O c
t / 0 9
J a n / 1 0
A p
r / 1 0
J u
l / 1 0
O c
t / 1 0
J a n / 1 1
Mitsubishi (Japan)
ETFS (US)
ETFS (Eur)
ZKB (Swiss)
Price $/oz
Global Platinum ETF Volume (oz) Pt PM Fixing Price, $/oz
0
200
400
600
800
1,000
0
500,000
1,000,000
1,500,000
2,000,000
2,500,000
A p r / 0 7
J u l / 0 7
O c t / 0 7
J a n / 0 8
A p r / 0 8
J u l / 0 8
O c t / 0 8
J a n / 0 9
A p r / 0 9
J u l / 0 9
O c t / 0 9
J a n / 1 0
A p r / 1 0
J u l / 1 0
O c t / 1 0
J a n / 1 1
Mits (Japan)
ETFS (US)
ETFS (Eur)
ZKB (Swiss)
US$/oz
Global Palladium ETF Volume (Oz) Pd PM Fixing Price, $/Oz

8/12/2019 lonmin Presentation
http://slidepdf.com/reader/full/lonmin-presentation 9/18
9
Platinum Supply Constraints and InducementPricing
Source: Lonmin
Incentive price between $1,850 and $2,000/Pt oz. Supply side
response expected to be muted while risks remain
0
500
1,000
1,500
2,000
2,500
3,000
4.0 5.0 6.0 7.0 8.0 9.0 10.0 11.0 12.0 13.0
W e i g h t e d a v e r a g e p l a t i n u m p r i c e ( $ / o z )
ZAR:$
Project incentive pricing (real, 2010)
December 2010

8/12/2019 lonmin Presentation
http://slidepdf.com/reader/full/lonmin-presentation 10/18
1010
Lonmin
View
Opportunities
•
Industrial and auto demand recovery from 2011• Small deficit in 2011
• Supply incapable of keeping up – growing deficits
__ in 2012 – 2014 period
• Stronger demand upswing
• Supply surprising on the downside
• Even tighter market & even higher prices
PGM Market Outlook
Risks
• Euro zone deteriorates
• China slowdown
• Substitution
Overall positive medium and long term market fundamentals

8/12/2019 lonmin Presentation
http://slidepdf.com/reader/full/lonmin-presentation 11/18
11
Lonmin’s Safety Record
11
Source: Department of Mineral Resources
Lonmin
AngloplatsPt industry
Impala
Comparison of Platinum Industry – Fatality Rate
12 Month Rolling
Aquarius
Committed to safety improvement
0.000
0.050
0.100
0.150
0.200
0.250
0.300
0.350
0.400
J a n - 0 5
M a y - 0 5 S e
p - 0 5 J a n - 0 6
M a y - 0 6 S e
p - 0 6 J a n - 0 7
M a y - 0 7 S e
p - 0 7 J a n - 0 8
M a y - 0 8 S e
p - 0 8 J a n - 0 9
M a y - 0 9 S e
p - 0 9 J a n - 1 0
M a y - 1 0 S e
p - 1 0
Permillion
hours
Impala Angloplats Lonmin Aquarius Pt Indus try

8/12/2019 lonmin Presentation
http://slidepdf.com/reader/full/lonmin-presentation 12/18
1212
• Continued progress in mining with tonnes mined and milled increasing
• Underground milled head grade down 0.19g/t from 4.74g/t in prior period to
4.55g/t
• Impacted by mix change and poor ground conditions
• Remains within our grade banding and down 0.08g/t from 2010Q4 - closely monitored by management
• Positive trend in underground concentrator recoveries maintained - from
84.5% in prior period to 85.1%
• Platinum sales in Q1 down 39.1% to 66,426 Platinum oz
• Impacted by unexpected adverse weather conditions in the northern hemisphere and Number One
furnace rebuild
• Number One furnace ramping up successfully following its scheduled rebuild
and modification
Q1 2011 – Operational Performance Update
A solid start to the year

8/12/2019 lonmin Presentation
http://slidepdf.com/reader/full/lonmin-presentation 13/18
-
400
800
1,200
1,600
2,000
2,400
2,800
3,200
Q109 Q110 Q111 Q209 Q210 Q309 Q310 Q409 Q410
T o n n e s
H o i s t e
d
( ' 0 0 0 s )
Westerns Middelkraal Easterns Karee
13
Marikana MiningUnderground production overview
13An encouraging trend

8/12/2019 lonmin Presentation
http://slidepdf.com/reader/full/lonmin-presentation 14/18
14
SA Industry Challenges
Operational
• Cost pressures
• Labour - wage agreements well aboveCPI
• Power - high tariff increases
• Resource constraints
• Lack of security over supply of powerand water may impact on new projects
• Shortage of experienced people
• Rand strength
• Has eroded margins and free cash flow
Regulatory
• Nationalisation
• An issue of national debate
• Security of tenure of mining rights• Associated minerals largely resolved
• Keysha issue outstanding
• Revised Mining Charter
• Collaborative approach by the DMR andindustry participants
• Increasing evidence of spot visits by mineinspectors
South Africa’s government acknowledges the need for a competitive
mining industry

8/12/2019 lonmin Presentation
http://slidepdf.com/reader/full/lonmin-presentation 15/18
15
2011 Focus and Guidance
Key deliverables for 2011
• Platinum sales of around 750,000 safe ounces
• Unit cost percentage increase of less than wage settlement
• Capital expenditure of up to $380 million, mostly Rand based
Key focus areas for 2011
• Continue to improve on safety to achieve zero harm
• Accelerate transformation and sustainability delivery
• Invest in further growth in our Marikana asset
•Focus on improving daily productivity
• Consider options beyond 2013 delivery of 850,000 Platinum ounces atMarikana
Building on a healthy operational platform

8/12/2019 lonmin Presentation
http://slidepdf.com/reader/full/lonmin-presentation 16/18
1616
• Delivering on the target of 850,000 safe Platinum ounces by 2013
• Considering options beyond this including Akanani and Limpopo
• Driving productivity through efficiencies and strict cost control
• Enabling growth and an improved competitive position
• Achieving our BEE ownership and transformation targets
Medium to Long Term Value Creation ReviewOutlook beyond 2011
Delivering growth into a market with robust fundamentals

8/12/2019 lonmin Presentation
http://slidepdf.com/reader/full/lonmin-presentation 17/18
Lonmin Plc
Questions

8/12/2019 lonmin Presentation
http://slidepdf.com/reader/full/lonmin-presentation 18/18
18
Disclaimer
This presentation, which is personal to the recipient, has been issued by Lonmin. This presentation includes forward-looking statements. All statements other than statements ofhistorical fact included in this announcement, including without limitation those regarding Lonmin's plans, objectives and expected performance, are forward-looking statements.Lonmin has based these forward-looking statements on its current expectations and projections about future events, including numerous assumptions regarding its present and futurebusiness strategies, operations, and the environment in which it will operate in the future. Forward-looking statements generally can be identified by the use of forward-lookingterminology such as 'ambition', 'may', 'will', 'could', 'would', 'expect', 'intend', 'estimate', 'anticipate', 'believe', 'plan', 'seek' or 'continue', or negative forms or variations of similarterminology. Such forward-looking statements involve known and unknown risks, uncertainties, assumptions and other factors related to Lonmin, including, among other factors: (1)material adverse changes in economic conditions generally or in relevant markets or industries in particular; (2) fluctuations in demand and pricing in the mineral resource industryand fluctuations in exchange rates; (3) future regulatory and legislative actions and conditions affecting Lonmin's operating areas; (4) obtaining and retaining skilled workers and keyexecutives; and (5) acts of war and terrorism. By their nature, forward-looking statements involve risks, uncertainties and assumptions and many relate to factors which are beyondLonmin‘ control, such as future market conditions and the behaviour of other market participants. Actual results may differ materially from those expressed in forward-lookingstatements. Given these risks, uncertainties, and assumptions, you are cautioned not to put undue reliance on any forward-looking statements. In addition, the inclusion of suchforward-looking statements should under no circumstances be regarded as a representation by Lonmin that Lonmin will achieve any results set out in such statements or that theunderlying assumptions used will in fact be the case. Other than as required by applicable law or the applicable rules of any exchange on which Lonmin's securities may be listed,Lonmin has no intention or obligation to update or revise any forward-looking statements included in this presentation after the publication of this presentation. This presentation is forinformation only and does not constitute or form part of any offer or invitation to sell, or any solicitation of any offer to purchase, any shares in Lonmin or any other securities, nor shallit or any part of it nor the fact of its distribution form the basis of, or be relied upon in connection with, any contract or investment decision related thereto. Information supplied by host
presenters may not be used, referenced or published without the prior written consent of the author of the presentations.
18