look-a-like: a fast content-based image retrieval … · therefore, it gained popularity in the...
TRANSCRIPT

Look-a-like: A Fast Content-based Image RetrievalApproach using a Hierarchically Nested Dynamically
Evolving Image Clouds and Recursive Local Data Density
Plamen Angelova, Pouria Sadeghi-Tehran1
aSchool of Computing and Communications, Data Science Group,Lancaster University, United Kingdom, LA1 4WA
Abstract
The need to find related images from big data streams is shared by many pro-fessionals, such as architects, engineers, designers, journalist, and ordinarypeople. Users need to quickly find the relevant images from data streamsgenerated from a variety of domains. The challenges in image retrieval arewidely recognised and the research aiming to address them led to the areaof CBIR becoming a ’hot’ area. In this paper, we propose a novel com-putationally efficient approach which provides a high visual quality resultbased on the use of local recursive density estimation (RDE) between a givenquery image of interest and data clouds/clusters which have hierarchical dy-namically nested evolving structure. The proposed approach makes use ofa combination of multiple features. The results on a data set of 65,000 im-ages organised in two layers of an hierarchy demonstrate its computationalefficiency. Moreover, the proposed Look-a-like approach is self-evolving andupdating adding new images by crawling and from the queries made.
Keywords: recursive density estimation (RDE), dynamically evolvinghierarchy of data clouds, content-based image retrieval (CBIR)
1. Introduction
The last decade has witnessed an enormous growth in the amount of dig-ital images on Internet (it was recently estimated that the number of imageson the Web is over 100 Billion [1], a figure which some observers consider to
URL: [email protected] (Plamen Angelov),[email protected] (Pouria Sadeghi-Tehran)
Preprint submitted to International Journal of Intelligent Systems June 14, 2016

be an underestimate). Everyday millions of new images are being generatedcreating an enormous multi-dimensional data stream. They play an im-portant role in the fields of entertainment, education, advertising, etc. Forinstance, photographers or designers often request images with a particularcolour or texture; therefore, developing a system which automatically de-rives requested and similar images is essential. Using the World-wide Web,users are able to access these images from anywhere in the World whichcreates a huge stimulus to quickly find images that user needs.
Since images are in a digital form this opens new prospects to organisethem in a convenient to manipulate form. However, the information thatthey contain is unstructured and there is no universal established and sta-ble approach to convert this information into an easy to manipulate form.For example, text can be organised alphabetically, music using notes, etc.Images, however, are significantly more unstructured by nature. It is achallenge to organise a huge and dynamically growing amount of images ina structure that is convenient to search quickly. It is possible to identifyand retrieve desired images from a small database; however, the difficultiesbecome more vivid for big and dynamically growing data streams with var-ied images. Another challenge is to use an effective measure of similaritybetween the query image and another image or a set of similar images.
The methods for retrieving similar images based on features such ascolour, texture, or shape are usually referred to as Content-Based ImageRetrieval (CBIR). The early use of CBIR system was introduced by Kato[2] in 1992. This research area has since been widely investigated by manyresearchers.
Although, CBIR technology has started to be used in the form of com-mercial products - such as TinEye [3], QBIC [4], Yandex Image Search [5],etc. and research projects like NETRA [6], Photobook [7] - still suffers fromthe lack of maturity. It is obvious from the (lack of) effectiveness of exist-ing CBIR systems, especially when handling real-time scenario on the Web(handling 1011 images). There are still many open research issues to beaddressed before taking a full advantage of fast and reliable CBIR systemsin practice.
Searching images on the Web is a complex problem. Search engineslike Google and Yahoo are still not capable of providing efficient CBIRsystems and sometimes they are too computationally expensive to operateon the Web, returned results are often not relevant or based on indexingand tagging instead of visual similarity. In addition, storing huge history ofimages and processing them in the memory is one of the toughest challenge.As a result, users still need to apply considerable efforts to find images they
2

are looking for.In order to address some of the issues mentioned above, a new fast
method called Look-a-like for finding visually similar images in big datastreams is proposed in this paper which is using a combination of featuresof different nature, a dynamically evolving hierarchically nested structureof image clouds and a single formula of recursive density estimation (RDE)[8, 9] applied locally (per image cloud). The proposed approach is compu-tationally and time-wise very efficient due to the combination of the hierar-chically nested image clouds structure and the use of the local RDE.
Dynamically evolving character of the problem is addressed by a con-stant update of the proposed nested hierarchical structure using the re-cently introduced ELM [10] clustering method at the back-end server of theoverall system. This approach is very computationally efficient and robustand provides visually meaningful results due to the combination of featuresof various nature. The local RDE provides the exact information aboutthe similarity between any given query image and all images from a givenimage clouds. The proposed approach Look-a-Like is capable of real-timeimage retrieval from a huge number of images. (For example, 1012 imageswhich is approximately the amount of images on Internet can be organisedautomatically using ELM in 6 layers of hierarchy with approximately 100clusters/data clouds in each layer and the search will then only require tocalculate 6 × 100 = 600 times the local RDE which takes less than a sec-ond on a PC. The performance of the proposed approach was evaluatedon a database containing 65,000 images with over 600 classes. The resultsdemonstrate that Look-a-like method introduced here is computationallyvery efficient and fast. Furthermore, the images returned as a result of thesearch were visually very similar to the query image and the time requiredwas very low, especially with the hierarchically nested structure. In addi-tion, a GUI for a desk-top application was also developed.
The remainder of the paper is organised as follows. First, in section 2the related work on CBIR is analysed. The proposed approach, Look-a-like,is described in section 3. Section 4 details the experimental results. Finally,Section 5 provides conclusions and outlines the future works.
2. State-of-the-art of CBIR
There have been extensive studies to investigate and address the chal-lenges that the CBIR systems face. In this section, we will briefly analysethe proposed techniques in this area.
3

Eakins and Graham [11] categorised three types of queries in CBIR sys-tems. The first type includes extracting primitive features such as colour,texture, shape or the spatial location of image elements. The most commonquery is the query by example; for instance, users are interested to find im-ages that are similar to a certain query image. The second type, concernsretrieval of specific object of given type identified by extracted features, withsome degree of logical inference [12]. For instance, users intend to find a pic-ture of a bus. The third type includes retrieval by abstract attributes. Itinvolves a considerable amount of high level reasoning regarding the purposeof the objects including pictures with emotional significance, special event,etc. For example, users may want to find pictures of a cheerful crowd. Thesecond and third types are referred to as ’semantic image retrieval’ and thedifference between them is called ’semantic gap’ [11]. Image retrieval of thefirst type requires users to submit an example/query image; on the otherhand, semantic image retrieval supports query by keywords in case users donot have a query image.
In this paper we focus on the first two types of image retrieval wherethe search is based on a query image and visual similarity, not semanticone. There are three main steps of the process, namely, feature extraction,organisation of the available images, and evaluating the similarity betweenimages.
Feature extraction is a very important element of any CBIR system.Features can be extracted from the specific region of an image or from theentire image. Since colour spaces are closer to the human perception, theyare widely used as features in CBIR systems. For different applicationsdifferent colour spaces can be used such as colour histograms, moments,covariance matrices, dominant colours, etc. [13]. For instance, if objects inan image have homogeneous colour, extracting average colour is not a goodoption, specifically for face recognition applications [12, 14]. As opposedto colour, texture is not well defined and many systems do not use it as afeature [14, 15]. However, texture refers to the pattern recognitions that haveproperties of homogeneity that can not be determined from the presence ofintensity or a single colour only [16]. Texture provides important informationin image classification and describes the content of images such as clouds,sea, fabric, skin, etc. Therefore, it gained popularity in the area of patternrecognition and image processing. Fourier transform, wavelet transform [17],and Gabor filters [18] are used often for texture analysis. Shape is anotherimportant feature used in computer vision; however, due to inaccuracy ofsegmentation it is difficult to determine and has not been as widely used ascolour and texture. The representation of the shape can be divided into two
4

categories known as; a) region-based, and b) boundary-based. In region-based techniques, the entire region is used while in the boundary-basedapproach only the outer boundary is taken into account [19]. For differentapplications scale, rotation or translation invariance can be used to representthe shape.
Another very important element of CBIR, especially, when applied tothe Internet is the organisation of images. Different clustering algorithmshas been used for this purpose such as the mean-shift, k-means, and hier-archical clustering methods [20]. BenHaim et al. in [21] used HSV colourhistogram to extract features and cluster images based on the offline iter-ative mean-shift clustering algorithm. The cluster that corresponds to thelargest number of parent images is selected and referred to as the ’significant’cluster. In [22] the BOO-clustering algorithm and GDBSCAN is utilised toextract colour clusters of each image. Once these are determined, the ob-jects are formed by selecting one or a few colour clusters of the image inan interactive manner. K-means clustering approach and indexing structureB+ tree is used in [23] to group relevant images in a CBIR system. Forthe retrieval process, images from the closest cluster and from other nearbyclusters are considered to retrieve similar images even if the query image ismis-clustered; however, an important drawback of this approach is that thenumber of clusters, K has to be predefined and is not changing afterwards(is fixed); thus, the number of image groups in the dataset should be knownin advance. Another disadvantage is the computational complexity of thek-means approach which is iterative, for large number of images it becomesprohibitive.
In [24] a hybrid clustering technique is used based on k-means clus-tering and Linde-Buzo-Gray (LBG) clustering methods. Initially, this algo-rithm assumes that one large Gaussian represents all images in the database.This is later iteratively split and re-estimated to obtain a mixture of Gaus-sians. The authors tested their algorithm on 12,000 images from 100 classescollected from Google Image search; however, the result of only one classhas been illustrated and no comparison with other methods has been done.Same disadvantages as for the previous approach can be attributed to thisapproach plus the unrealistic assumption of Gaussian distribution.
In order to tackle the ’semantic gap’ problem, Chen and Wang [25] pro-posed an unsupervised learning technique based on clustering. In their ap-proach, image clusters are obtained based on the feature similarity of re-trieved images to the query image and also on how the retrieved imagesare similar to each other. The main drawback of this approach is that theclusters are fixed and not evolving; therefore, if add even a single new im-
5

age to the database the whole procedure, including the clustering has tobe repeated ’from scratch’. In addition, this approach has not been andcannot be applied to a large number of images (e.g. Internet) because it iscomputationally expensive.
Searching through large image collections especially on the Web withover 100 billion images can be a tedious work. Developing a hierarchicalorganisation can significantly speed up the search which is essential. In [26]authors developed a hierarchical annular histogram (HAH) and tested iton images from prostate cancer. They consider the hierarchy of image tosub-images and not a hierarchy of nested clusters/image clouds as in theproposed paper and applied their technique to a small amount of imagesfrom a specific area only. On the other hand, Distasi et al. [27] applied ahierarchical entropy-based representation (HER) to a database containingseveral shapes represented by their closest contour in curvilinear coordinatesto be used in a CBIR system. A tree-based structure of representation ofimages was proposed by Chow et al. [28] where a root node contains theglobal features, as opposed to child nodes which contain the local features.Authors also used multi-layer self-organising map to form the tree structure.In [29] a multi-level hierarchy was proposed and applied to text retrievaland natural language. Finally, in [30] a hierarchical structure to whichdynamic indexing and guided search are applied using wavelet-based schemefor multiple features extracted from images in a warehouse. The hierarchyis, however, over the image colour, palm and face etc. Features are not overnested clusters/clouds of images. This approach will also struggle in termsof computational complexity for huge amount of images and sub-images orfeatures.
Although, forming hierarchical structures for retrieving images has beenexplored by other researchers, their goals for doing so differ from our pro-posed method. We offer a hierarchy of nested clusters of mean values, notimages and sub-images or features.
Last, but not least, it is important to select appropriate proximity andsimilarity measure used for clustering and search. Traditionally, Euclidean,Mahalonobis, cosine, Manhattan/city distance measures are used. In Look-a-Like, we use relative Manhattan (L1) distance. However, all of these aredistances between a given data sample and another data sample (e.g. image).There are also linkages between clusters (distance or dissimilarity measurebetween groups of images). In addition, the density in the data space asintroduced and defined in [8, 9] provides an exact value between 0 and 1 ofthe similarity between a given data sample (e.g. image) and all images froma data cloud (or cluster). In the proposed approach, Look-a-like we uniquely
6

use such measure of similarity which is not the same as the distance betweentwo data samples (images) nor between groups of images, nor between animage and a mean of a cluster (mean of a cluster is often not an existingimage, but an abstraction) only. Data density as defined in [8, 9] is a uniquemeasure which allows quickly to be computed (because is recursive and inthe proposed approach can be calculated in a hierarchically nested setting)the exact (not approximate) similarity between a given query image and asmany other images as needed (e.g. 100 billion or 100 etc.).
3. The Proposed Approach Look-a-Like
The aim of the proposed approach is to provide an efficient and fastCBIR system to deal with big data streams in the form of images. Look-a-like is a quick strategy for search and retrieval of images in big dynamicallyevolving data streams. It is subject of a pending patent application [31]. Itconsist of three main elements:
(a) multiple features extracted from images which represent them in a com-putationally compact form in a unique way (that is, an image is con-verted to a vector of less than 700 floating point numbers per image);
(b) a hierarchically nested dynamically evolving data clouds (cluster-like)structure which facilitates the computationally efficient search and logi-cal organisation of the images and is dynamically updated with each newavailable image including the query image using evolving local means(ELM) algorithm [10]:
(c) computationally efficient RDE formula for evaluating the similarity be-tween a query image and a huge number of other images. The proposedapproach is also using relative Manhattan (L1) distance.
The proposed approach builds automatically a dynamically evolving hi-erarchically nested image clouds/clusters structure from unstructured bigdata streams (e.g. billions of images) facilitating the search of most relevantsimilar images using local density (see Fig. 1). From the computing realisa-tion point of view, the proposed Look-a-Like can be realised as a client-serversystem (see Fig.2) which can be offered as a web service.
Maximum local density indicates the image cloud with mean values (ifat the higher levels of the hierarchy) or images (if at the lower hierarchicallevel). Going down through the levels of the hierarchy, a cloud with areasonably small (but not pre-defined) number of visually similar imagescan be identified for a very small amount of time (less than a second) froma big image (billions of images) stream. Look-a-like works with vectors of
7

Figure 1: Schematic representation of the hierarchically nested data clouds structure, eachsquare in layer one represents features of an image a described in section 3.1; µ and Xdenote mean values and scalar products which are abstract values and are described insection 3.3
multi-features (less than 700 floating point numbers per image) and meansand accumulated scalar products. It is not using pixels directly; finally, itis using efficient local (per cloud) RDE formula [8] and relative Manhattandistance.
In what follows, we will, first, describe the set of features that has beenused to achieve a high discrimination power. Next, we will recall the evolv-ing local means algorithm, ELM [10] to form the data clouds. ELM isusing the similar basic concept as the widely used mean-shift clustering al-gorithm; however, the local variance and local mean in ELM is calculatedrecursively and it is a non-iterative, one pass algorithm which makes it sig-nificantly faster (in orders of magnitude), especially for big data streams.The search itself is performed by calculating the local recursive density esti-mation (RDE) in regards to the query image and the data clouds (initiallyat the top layer of hierarchy, then between the query image and the dataclouds that correspond to the winning data cloud of the top layer and alldata clouds linked to it and so on going down to the lower layer of the hi-erarchical structure. Finally, a threshold, ε separates the images that arereturned to the user from the data clouds of the lower level of hierarchyassociated with the winning data cloud of the higher level of hierarchy as
8

illustrated further.It has to be stressed that local RDE calculates the exact similarity be-
tween a query image and all images from the winning data clouds recursivelyand, thus, computationally efficiently. Due to the recursive calculations, theproposed approach is very efficient computation- and time-wise. Further-more, the proposed method involves search in an ordered multi-layer hierar-chy (Fig. 3) such that search process is speeded up by orders of magnitude.The results show that the performance is very high quality and very fast forbig data streams even on ordinary laptop using Windows OS and Matlab(using Linux OS and C/C++ language as well as parallelisation or use of GPGPU can further improve significantly the performance). The main reasonis that by introducing the hierarchical organisation of the images combinedwith the RDE the number of comparisons is dramatically reduced yet thefull and exact information of the comparison with all images from a datacloud is kept intact, Fig. 2.
3.1. Feature Selection
Having a selection of representative features is very important for thequality of the algorithm. In Look-a-Like we use a combination of multiplefeature sets of different nature, with size of 697 floating point digits: F ={FG;FHSV ;FM ;FC ;FLG;FW
}[32].
The first feature is GIST [33] which extracts the global features of theimage and gives an impoverished and coarse version of the principal contoursand textures of the image which is still detailed enough to recognize theimage. It is computationally efficient and there is no need to parse the imageor group its components in order to represent the spatial configuration ofthe scene. The fundament of GIST approach is Gabor filters. Several Gaborfilters with selected channels are computed on a grid of the image (4 × 4)and indexed into an array with 512 features, FG.
The second feature is a colour HSV histogram. To extract colour his-togram, each pixel of an image is associated to a specific histogram bin onthe basis of its own colour. HSV colour space is used for histogram gen-eration where each pixel contributes its intensity and improves perceptualuniformity. Each image is quantised in the HSV colour space into 8× 2× 2equal bins, which creates a feature vector with 32 features, FHSV .
Since it has been proven [34] that colour moments are more robust andhave a better performance in comparison with the colour histogram, theyare selected as a third set of extracted features. Three central moments(mean, standard deviation and skewness) can be used for image’s colourdistributions [35]. In Look-a-Like, we define 9 moments (3 moments for
9

Figure 2: Schematic representation of the proposed approach Look-a-like
10

Figure 3: Schematic representation of the hierarchical data cloud structure (in fact, weuse matrices of feature vectors instead of the actual images). In layer2 and above we storethe mean values of the data clouds in terms of those features which do not necessarily(and usually) represent an image. The principle of ’winner takes all ’ based on maximumlocal RDE value at each layer is used to find the winning data cloud. Finally, all imagesfrom the layer1 winning data cloud are displayed which may be optionally restricted by athreshold ε (suggested value for ε is around 20).
11

each colour channel), FM . The c-th colour channel of the i-th image pixelPci is defined by:
i the average colour value in an image:
Mc =1
A
A∑i=1
pci (1)
where A = H ×W H = height, W = width
ii the variance
σc =
√√√√ 1
A
A∑i=1
(pci −Mc)2 (2)
iii the skewness which is a measure of the degree of asymmetry in thedistribution:
Sc = 3
√√√√ 1
A
A∑i=1
(pci −Mc)3 (3)
The colour auto-correlogram is the fourth extracted feature set whichdescribes how the spatial correlation of colour changes with the distance.If the distance d ∈ [n] is a fixed priori, the correlogram of an image, I isdefined for i, j ∈ [m] positions of pixels,k ∈ d as [36]:
βkci,cj (I) ≡ Pr[|p1 − p2| = k, p2 ∈ ICj |p1 ∈ ICi
](4)
where |p1 − p2|∆= max {|x1 − x2| , |y1 − y2|}
Given any pixel of colour Ci in the image I, βkci,cj gives the probabilitythat a pixel at distance k away from the given pixel’s colour [36]. For eachpixel in the image, the auto-correlogram method applies to all the neighboursof that pixel. If the distance is large, a large area will be covered and moreinformation will be collected from the image; however, the computationalcomplexity will increase. In order to address the computational complexity,the setS is used which is a subset of d(S = 1; 3; 5; 7)[34] resulting in a 64features vector, FC which are added/appended to F.
The next set of features which is being used is based on the texture rep-resentation. Gabor wavelet transform is widely used to represent texture ofimages and has been demonstrated to be very efficient. However, the band-width of the Gabor filter is limited to one octave; therefore, a large number
12

of filters is required to obtain wide spectrum coverage. In addition, theirresponse is symmetrically distributed around the centre frequency, whichresults in redundant information in the lower frequencies that could insteadbe devoted to capturing the tails of images in the higher frequencies.
The log-Gabor function is used as an alternative to Gabor function [37]designed as Gaussian functions on the log axes. It has been proven thatlog-Gabor filter outperforms the standard Gabor filter in order to verify anobject inside an image [38]. Their symmetry on the log axes results in amore effective representation of the uneven frequency content of the images.Furthermore, log-Gabor filters do not have a DC component, which allowsan increase in the bandwidth which results in fewer filters to cover the samespectrum. The log-Gabor filters are defined in the log-polar coordinates ofthe Fourier domain as shifted from the origin Gaussians [39]:
G(s,o)(ρ, θ) = exp
(−1
2
(ρ− ρsσρ
)2)
exp
(−1
2
(θ − θ(s,o)
σθ
)2)
(5)
ρs = log2(n)− s
θ(s,o) =
{ πnoo if s is odd
πno
(o+ 12) if s is even
(σρ,σθ) = 0.996(√
23 ,
1√2πno
)(6)
where s and o specify the scale and orientation of the wavelet, respec-tively (s = 0, 1, ..., ns;t = 0, 1, ..., no); and (ρ, θ) are the log-polar coordi-nates.
(ρs, θ(s,o)
)are the coordinates of the centre of the filter and (σρ, σθ)
are the bandwidths. Let F denote the Fourier transform of the input image.The convolution of Gs,o and F is obtained by [40]:
Let F denote the Fourier transform of the input image. The convolutionof Gs,o and F is obtained by [40]:
Vs,o = F ∗Gs,o (7)
13

An array of magnitudes is obtained as:
Es,o =∑i
∑j
|Vs,o(i, j)| (8)
where (i, j) denotes the 2D coordinates of a pixel pi,j .
These magnitudes represent the energy content at different scale andorientation of the image. The main goal of the texture-based retrieval isto find images or regions with similar texture. It is assumed that we areinterested in images or regions that have homogenous texture; therefore,the following mean, µso and standard deviation, σso of the magnitude of thetransformed coefficient are used to represent the homogenous texture of theregion as a feature:
µso =Es,oN
(9)
σso =
√∑i
∑j
(|Gso(i, j)| − µso)2
N(10)
A feature vector is constructed using µs,o and σs,o. In our experimentthe scale was set to 5 and orientation to 6 which results in a feature vectorFLG, of size 30 for each µs,o, σs,o.
The wavelet transform is a multi-resolution analysis technique for animage and it has been proven to work well in both space and frequencydomain [41]. It is used as the final set of features. Any decomposition ofthe image into a wavelet involves a pair of waveforms; the high frequencycomponents correspond to the details of an image while the low frequencycomponents correspond to its smooth parts [42]. Discrete Wavelet Trans-form (DWT) of an image as a 2D signal can be derived from a 1D DWT,implementing 1D DWT to every row then implementing a 1D DWT to ev-ery column. Any decomposition of the 2D images into a wavelet involves 4sub-band elements representing LL (Approximation), HL (Vertical Detail),LH (Horizontal Detail), and HH (Detail), respectively [42]. The DWT of asignal x is calculated by passing it through a low pass filter with impulseresponse h and high pass filter g. The outputs giving the detail coefficients(from the low pass and high-pass filter) and approximation coefficients.
14

wlow[n] =∞∑
k=−∞x [k]h [2n− k] (11)
whigh[n] =
∞∑k=−∞
x [k] g [2n− k] (12)
After resizing the image into 256 × 256 matrix, we applied a 4-levelwavelet transformation. The upper left 16 × 16 matrix is stored and alsodivided into its high and low frequency components, as part of the featurevector. Finally, we calculated the mean and standard deviation of the 16×16matrix to construct the feature vector. The final size of the feature vectoris composed of two sets of 16 features each (32 in total), FW .
As a result of applying these six sets of features a vector with size 697is formed as F =
{FG, FHSV , FM , FC , FLG, FW
}[32].
3.2. Forming data clouds
Similarity comparison between the query image and each image from alarge collection can be computationally prohibitive and very slow. In addi-tion, it is impossible to compare the query image with all the images in theWorld Wide Web with its vast and increasing size individually. Therefore,automatically arranging/structuring of the images based on their similarityis essential, especially when the users need to narrow down their requirementto a particular subset. In this sense, it is useful to arrange the images intosimple genres forming data clouds. Arranging massive amount of images inthe World Wide Web generated every second is the toughest challenge. Thisis where one of the main innovation aspects of the proposed new Look-a-like approach lies. If we try to implement some of the classical clusteringalgorithms such as k-means, fuzzy C-means etc. this is not practical due totheir fixed structures and pre-defined number of clusters, prohibitive com-putational costs etc. In addition, storing the huge amount of image datain the memory and processing them is another challenge that needs to beaddressed. Moreover, the amount of images in the World Wide Web is notlimited or fixed and traditional approaches would require the task to be re-solved each time again and again, which is also prohibitive. Therefore, weneed a computationally efficient, recursive and dynamically evolving algo-rithm for data partitioning/forming data clouds.
In Look-a-like we use the recently introduced ELM [10] algorithm (usingthe feature vectors of size 697 floating point values as described above andin [32], however, an alternative is the recently introduced DDCAR method
15

[43]. The advantage of DDCAR is that it is fully autonomous and does notrequire any parameter to be pre-specified (for comparison, even ELM doesrequire the radius, r to be pre-specified).
ELM is based on the concept of non-parametric gradient estimate ofthe density function using local (per data cloud/rubric) means [10]. Thelocal means are being updated for each new coming feature vector/imagedescriptor allowing for the data set to evolve/expand (as is the case withthe World Wide Web, for example). New data clouds are being formed ifthe density pattern changes, a cloud is created. In that case, the evolvingnature of ELM can be useful if new images are added to the database. Foreach image cloud, i that is being formed we can calculate the local mean,µi and variance, σi. The mean does not necessarily (and usually) representa meaningful image but is rather an abstraction/focal point of the cloud.Details of the ELM approach are provided in [10]. Initially a radius of thedata cloud is being defined. In terms of the feature vector which was definedin the previous sub-section [32], the initial radius value was chosen to be 150for the lower hierarchical layer and 250 for the higher/top layer (the unitsare related to the unnormalised feature vector. As a new image (featurevector) is being processed, the distance/dissimilarity to all existing dataclouds is computed. If the following condition is satisfied, then the image Iis assigned to the data cloud i :
di < (max (‖σi‖ , r) + r) (13)
where di is the distance from image I to the data cloud mean µi. r is apre-specified radius of the cloud.
If this condition for the image I is true for more than one data cloud,the nearest data cloud is selected. After assigning the new coming image toan existing data cloud, the mean of the data cloud µi and the variance, σiare updated recursively as detailed in [10].
3.3. Similarity measure based on the local RDE
The next step after forming the clouds and the hierarchical structure isto find the cloud which contains the most similar images to the query. Inorder to do that, we use local recursive density estimation, RDE [8, 9]. Analternative is the recently introduced typicality measure [44]. Both of themgive an estimate of the similarity between the query and all images fromthe clouds, Fig. 4. Such a recursive technique makes possible that eachimage is considered only once and discarded once it has been processed andnot kept in the memory, but the information is still exact (not approximate)
16

Figure 4: Computing similarity between a given query image, Q and clouds using localdensity at the highest hierarchical level
in terms of similarity between the query and each individual image fromthe clouds [8, 9]. Only the information concerning the density (mean, µand the scalar product, X ) is accumulated and stored for each cloud inthe memory. Moreover, it makes possible to use a significantly smaller (inorders of magnitude) amount of computations. Due to recursive nature ofthe algorithm, if compare with the case when the query image is comparedwith each image from the cloud individually, it is computationally efficientand fast.
In Look-a-Like, the degree of similarity of a query image to all imagesinside a cloud is measured by the relative density in regards to the queryimage:
γik =1
1 +∥∥Fk − µik∥∥2
+Xik −
∥∥µik∥∥2 (14)
In practice, it is more convenient (and in accordance with the typicality,[44]) to consider the accumulated proximity, π:
πik =1
γik− 1 (15)
where F = {f1, . . . , f697} is the representation of the image with itsfeature vector, k = 1, 2, . . . ,Mi; i = 1, 2, . . . , C, Mi is the number of images
17

Figure 5: Computing local density γi of a query image to all images in ith cloud
within the ith cloud; C is the number of clouds.Both, the mean, µk and the scalar product, Xk can be updated recur-
sively as follows [9]:
µk =k − 1
kµk−1 +
1
kFk; µ1 = F1 (16)
Xk =k − 1
kXk−1 +
1
k‖Fk‖2; X1 = ‖F1‖2 (17)
The cloud with the maximum local density in respect to the query imageis the winner which contains images that are most relevant/similar to thequery image:
Ck∗ = arg min
i=1
{πik}
(18)
Once the winning cloud is selected, the image that are contained in it arere-ranked using relative Manhattan/L1 distance which yields best resultsand gives the more significant difference between two images [32]. Smalldistance implies that the corresponding image is more similar to the queryimage and vice versa. The relative Manhattan distance between the queryimage and images inside the selected cloud is computed as follows:
18

d(Q, Ij
)=
n∑k=1
∣∣∣Qk − Ijk∣∣∣1 +Qk + Ijk
; j = 1, . . . ,Mi (19)
where Mi is the number of images of a certain cloud; n is the numberof extracted features, in this work n=697 [32]. The final result includes allimages from the selected/wining cloud up to a certain threshold in terms ofd, ε (recommended values ∼ 20).
IF(d(Q, Ij
)< ε)THEN
(display Ij
)(20)
4. Experimental Results
In this section, the experimental results are presented. The proposedapproach, Look-a-like has been evaluated in terms of the speed and accu-racy. It was tested with an image database which includes 65,000 imagescollected within the WANG database [45] by the visual Geometry group atthe University of Oxford [46]. The database contains over 600 classes whichmakes it an ideal example to evaluate the performance of CBIR systems.Some of the image classes are illustrated in Fig. 6. It should be noted thatthe number of images is not the same for all classes.
The tests were performed on a standard PC with Intel Core i7, process-ing power with 3.4 GHz CPU and 8 GB RAM running Windows 7 operat-ing system. A graphical user interface (GUI) application was developed inMATLAB environment (Fig. 7) to facilitate the evaluation work.
The test starts with the user uploading a query image and retrieving thesimilar images. Users can select a threshold, ε to retrieve the most similarimages (we used ε=23). At the end, the final search result was saved inHTML format and ready to publish on the Web. Execution time of theproposed nested hierarchical system and an alternative of clustering and anon-hierarchical system were also compared.
4.1. Speed evaluation of the proposed approach
The execution time of the proposed Look-a-Like was tested on severalrandomly selected queries, such as bikes, planes, cars, and sharks. Figure 9shows the execution time for the case of; a) direct comparison of the queryimage with each of the 65.000 images (no clustering); b) with clouds whenno hierarchy of nested clouds is built up; c) when two-layer hierarchy is builtfirst using randomly selected query image. In the non-hierarchical systemthe similarity value is computed between the query image and all the images
19

Figure 6: Example images from the dataset that was used (65,000 images in total)
Figure 7: The interface of the test environment for the proposed approach
20

Figure 8: All images from the winning cloud are shown after re-ranking
Table 1: A two layer example of the proposed hierarchically nested approach
Two Layer Hierarchically Nested Structure
Radius No. Clouds
Layer one 150 697
1-2 Layer two 250 36
or lower layer clouds. In the hierarchical system the comparison is madeonly with the top layer clouds and after determining the winner cloud thefurther search at the lower layers is performed only with the clouds whichcorrespond to that cloud significantly reducing the amount of comparisons.ELM method is used for forming the clouds with radius set to 150 for thelower layer and 250 for the upper layer. At the lower layer all 65,000 imageswere grouped into 697 clouds. It has to be stressed that some of them have asingle image and were ignored. At the higher layer the means of the clouds atthe lower layer that were not eliminated due to the small number of imageswhich they contain were further grouped suing ELM and a radius of 250.This resulted in 36 higher/top layer clouds, see Table 1.
21
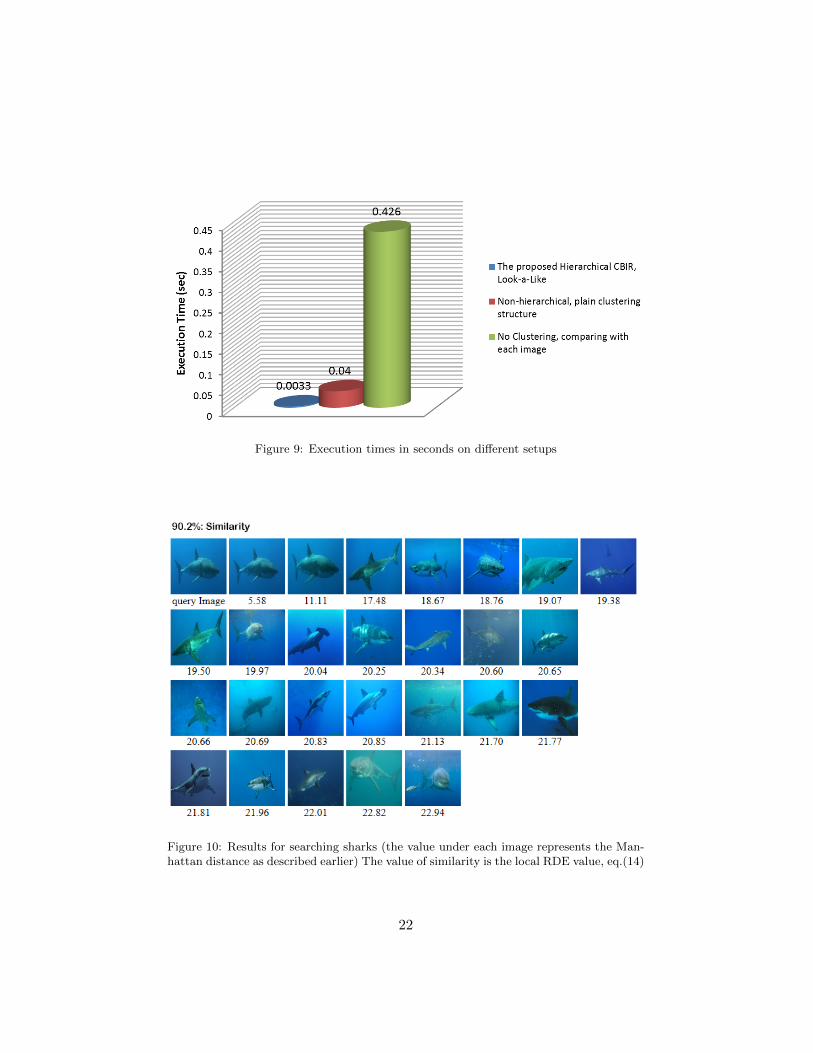
Figure 9: Execution times in seconds on different setups
Figure 10: Results for searching sharks (the value under each image represents the Man-hattan distance as described earlier) The value of similarity is the local RDE value, eq.(14)
22

Figure 11: Results for searching cars
5. Conclusion
In this paper, a new fast approach for organisation and search withinCBIR context has been proposed. Its main idea is to organise the otherwiseunstructured set of complex, multi-dimensional data (images) into a dy-namically evolving hierarchically nested clouds structure using a combinedmultiple sets of features and a computationally efficient local-RDE-basedsimilarity measure. The approach was tested on a data base which contains65,000 images from about 600 different genres/rubrics. The proposed Look-a-like approach was able to automatically form 697 lower layer clouds and 36higher/top layer clouds and for a given query image it provided visually veryrelevant results within few milliseconds making only about 50 calculationsof the local RDE formula. The approach is scalable and parallelisable innature (different data clouds can reside on different hardware or multi-coreapplication can benefit from parallelisation, too). It can be realised as a webservice. It is also possible to include user feedback in a future application.The method is a subject of a patent application [31].
6. Bibliography
[1] T. Blog, “Internet 2011 in numbershttp://royal.pingdom.com/2012/01/17/internet-2011-in-numbers/,”Jan. 2012.
23

[2] T. Kato, “Database architecture for content-based image retrieval,”Proc. SPIE 1662, Image Storage and Retrieval Systems, vol. 1662,pp. 112–123, Jan. 1992.
[3] TinEye, “http://www.tineye.com/,” Jan. 2012.
[4] W. Niblack, R. Barber, W. Equitz, M. Flickner, E. Glasman,D. Petkovic, P. Yanker, C. Faloutsos, and G. Taubin, “The QBICproject: querying images by content using colors, texture and shape,”pp. 173–187, Jan. 1993.
[5] R. Consoli, “http://yandex.ru/images/?d=IBQIKQ.”
[6] W. Y. Ma and B. S. Manjunath, “NeTra: a toolbox for navigatinglarge image databases,” in Image Processing, 1997. Proceedings., Inter-national Conference on, pp. 184–198, 1997.
[7] A. Pentland, R. W. Picard, and S. Sclaroff, “Photobook: Content-basedmanipulation of image databases,” International Journal of ComputerVision, vol. 18, pp. 233–254, Jan. 1996.
[8] P. Angelov, “Anomalous system state identification.” patent applica-tion, GB1208542.9, May 2012.
[9] P. Angelov, Autonomous Learning Systems: From Data Streams toKnowledge in Real Time. John Wiley and Sons, Jan. 2012.
[10] R. D. Baruah and P. Angelov, “Evolving Local Means Method for Clus-tering of Streaming Data,” IEEE World Congress on ComputationalIntelligence, pp. 2161–2168, Jan. 2012.
[11] J. Eakins and M. Graham, “Content-based image retrieval,” tech. rep.,Jan. 1999.
[12] Y. Liu, D. Zhang, G. Lu, and W.-Y. Ma, “A survey of content-basedimage retrieval with-level semantics,” Journal of Pattern RecognitionSociety, vol. 40, pp. 262–282, Jan. 2007.
[13] W.-T. Chen, W.-C. Liu, and M.-S. Chen, “Adaptive Color FeatureExtraction Based on Image Color Distributions,” IEEE Transaction onImage Processing, vol. 19, pp. 2005–2016, Jan. 2010.
[14] K. Hua, K. Vu, and J. Oh, “SamMatch: a flexible and efficientsampling-based image retrieval technique for large image databases,”in Proceedings of the seventh ACM international, Jan. 1999.
24

[15] P. L. Stanchev, D. Green Jr., and B. Dimitrov, “High level color similar-ity retrieval,” International Journal on Theories Applications, vol. 10,pp. 363–369, Jan. 2003.
[16] J. R. Smith and S.-F. Chang, “Automated binary texture feature setsfor image retrieval,” in Acoustics, Speech, and Signal Processing, 1996.ICASSP-96. Conference Proceedings., 1996 IEEE International Con-ference on, pp. 2239–2242, 1996.
[17] I. Daubechies and B. J. Bates, Ten lectures on wavelets, vol. 93. TheJournal of the Acoustical Society of . . . , 1993.
[18] B. S. Manjunathi and W. Y. Ma, “Texture Features for Browsing andRetrieval of Image Data,” IEEE Trans. on Pattern Analysis and Ma-chine Intelligence, vol. 18, pp. 837–842, Jan. 1996.
[19] Y. Rui, A. C. She, and T. S. Huang, “Modified Fourier descriptors forshape representation-a practical approach,” Proc of First InternationalWorkshop on Image Databases and Multi Media Search, 1996.
[20] D. Cai, X. He, Z. Li, W. Ma, and J. Wen, “Hierarchical clustering ofWWW image search results using visual, textual and link information,”in Proceedings of the 12th annual ACM, pp. 952–959, Jan. 2004.
[21] N. Ben-Haim, B. Babenko, and S. Belongie, “ImprovingWeb-based Im-age Search via Content Based Clustering,” in Computer Vision and Pat-tern Recognition Workshop, 2006. CVPRW ’06. Conference on, pp. 17–22, 2006.
[22] P. Dutta, D. Bhattacharyya, and J. Kalita, “Clustering approach tocontent based image retrieval,” Modeling and Imaging, pp. –, Jan. 1993.
[23] E. Yildizer, A. M. Balci, T. N. Jarada, and R. Alhajj, “Integratingwavelets with clustering and indexing for effective cotent-based imageretrieval,” Knowledge-Based Systems, vol. 31, pp. 55–66, Jan. 2012.
[24] T. Deselaers, D. Keysers, and H. Ney, “Clustering visually similar im-ages to improve image search engines,” In Informatiktage 2003 derGesellschaft fr Informatik, Bad Schussenried, Germany., Jan. 2003.
[25] Y. Chen, J. Wang, and R. Krovetz, “Content-based image retrieval byclustering,” on Multimedia information retrieval, Jan. 2003.
25

[26] L. Yang, X. Qi, F. Xing, T. Kurc, J. Saltz, and D. J. Foran, “Parallelcontent-based sub-image retrieval using hierarchical searching,” Bioin-formatics, Jan. 2013.
[27] R. Distasi, D. Vitulano, and S. Vitulano, “A Hierarchical Representa-tion for Content-based Image Retrieval,” Journal of Visual Languagesand Computing, vol. 11, pp. 369–382, Jan. 2000.
[28] S. Chow, M. Rahman, and S. Wu, “Content-based image retrieval byusing treestructured features and multi-layer self-organizing map,” Pat-tern Analysis & Applications, vol. 9, pp. 1–20, Jan. 2006.
[29] R. Levinson and G. Ellis, “Multi-level hierarchical retrieval,” In 6thAnnual Conceptual Graphs Workshop, pp. 285–310, Jan. 1996.
[30] J. You and Q. Li, “On hierarchical content-based image retrieval by dy-namic indexing and guided search,” Cognitive Informatics, 2009. ICCI’09. 8th IEEE International Conference on, pp. 188–195, 2009.
[31] P. Angelov and P. Sadeghi-Tehran, “Data Structuring and SearchingMethod and Apparatus.” patent application, GB1417807.3, Oct. 2014.
[32] P. Sadeghi-Tehran and P. Angelov, “An Approach to CBIR using a com-posite Multi-Feature Vector and Local Recursive Density Estimation,”Journal of Computer Vision and Image Understanding (submitted, Oc-tober 2014).
[33] A. Oliva and A. Torralba, “Building the gist of a scene: The roleof global image features in recognition,” Progress in brain research,vol. 155, pp. 23–36, Jan. 2006.
[34] H. Yu, M. Li, H.-J. Zhang, and J. Feng, “Color texture moments forcontent-based image retrieval,” in International Conference on ImageProcessing, pp. 929–932, 2002.
[35] M. Stricker and M. Orengo, “Similarity of color images,” IS&T/SPIE’s,pp. 381–392, Jan. 1995.
[36] J. Huang, S. R. Kumar, M. Mitra, W.-J. Zhu, and R. Zabih, “Imageindexing using color correlograms,” in IEEE Computer Society Confer-ence on Computer Vision and Pattern Recognition, pp. 762–768, 1997.
[37] D. J. Field, “Relations between the statistics of natural images andthe response properties of cortical cells,” J. Opt. Soc. Amer, vol. 4,pp. 2379–2394, Jan. 1987.
26

[38] J. Arrospide and L. Salgado, “Log-Gabor Filters for Image-Based Ve-hicle Verification,” IEEE Transaction on Image Processing, vol. 22,pp. 2286–2295, Jan. 2013.
[39] S. Fischer, F. Sroubek, L. Perrinet, R. Redondo, and G. Cristobal, “Self-Invertible 2D Log-Gabor Wavelets,” International Journal of ComputerVision, vol. 75, pp. 231–246, Nov. 2007.
[40] M. Kuse, Y. F. Wang, and V. Kalasannavar, “Local isotropic phasesymmetry measure for detection of beta cells and lymphocytes,” Jour-nal of pathology Informatics, vol. 2, no. 2, 2011.
[41] S. Mallat, “Wavelets for a vision,” Proceedings of the IEEE, vol. 84,pp. 604–614, Jan. 1996.
[42] K. Arai and C. Rahmad, “Wavelet Based Image Retrieval Method,”(IJACSA) International Journal of Advanced Computer Science andApplications, vol. 3, pp. 6–11, Jan. 2012.
[43] R. Hyde and P. Angelov, “DDCAR: Data Density based Clustering withAutomated Radius,” in IEEE International Symposium on Evolvingand Autonomous Learning Systems (EALS’14 to appear).
[44] P. Angelov, “Anomaly Detection,” Journal of Automation, MobileRobotics and Intelligent Systems (JAMRIS), vol. 8, pp. 29–35, 2014.
[45] J. Z. Wang, “http://wang.ist.psu.edu/docs/related.shtml,” Jan. 2004.
[46] U. Oxford, “Visual Geometry Grouphttp://www.robots.ox.ac.uk/˜vgg/data/.”
27