looking to the future: how automation will grow the value ... · looking to the future: how...
TRANSCRIPT

We Practice What We Teach
Looking to the Future: How
Automation will Grow the Value of
Microbiology
Nathan A Ledeboer
Associate Professor of Pathology
Medical College of Wisconsin
Medical Director, Microbiology and Molecular Pathology
Wisconsin Diagnostic Laboratories and Froedtert Hospital
Medical Director, Laboratory Outreach and Reference Services
Wisconsin Diagnostic Laboratories
Milwaukee, WI

We Practice What We Teach
Outline
• Drivers of Automation
• The Necessities of Automation
• Is there a Benefit to Automation?
• Automation of Automation

We Practice What We Teach
What is the Future of Automation?

We Practice What We Teach
Drivers of Automation

We Practice What We Teach
Why Automate? • Potential answer to shrinking workforce –
– Need to staff when plates are to be read, not just 9-5
• Answer to ergonomic realities – Quality of life issues/cost to organization
• Labs are consolidating – can do more potentially with less – but perhaps larger
• Better quality product – consistent plating
• Pressure for decreased TAT from receipt to results – Pressure to be open 24/7
• Increased standardization of transport media – ie liquid transport media (eSwab)

We Practice What We Teach
Why Automate ?
• Pre-analytical processing of specimens
reduces time to incubation – increased
quality, consistency in plating
• Digital Microbiology – imaging analysis
to aid the CLS
– Useful for training/Documentation
– Quality Assurance
– Remote locations – less skilled CLS

We Practice What We Teach
Automation is NOT as Simple
as Installing New Hardware –
Laboratory Workflow is Critical
We Practice What We Teach
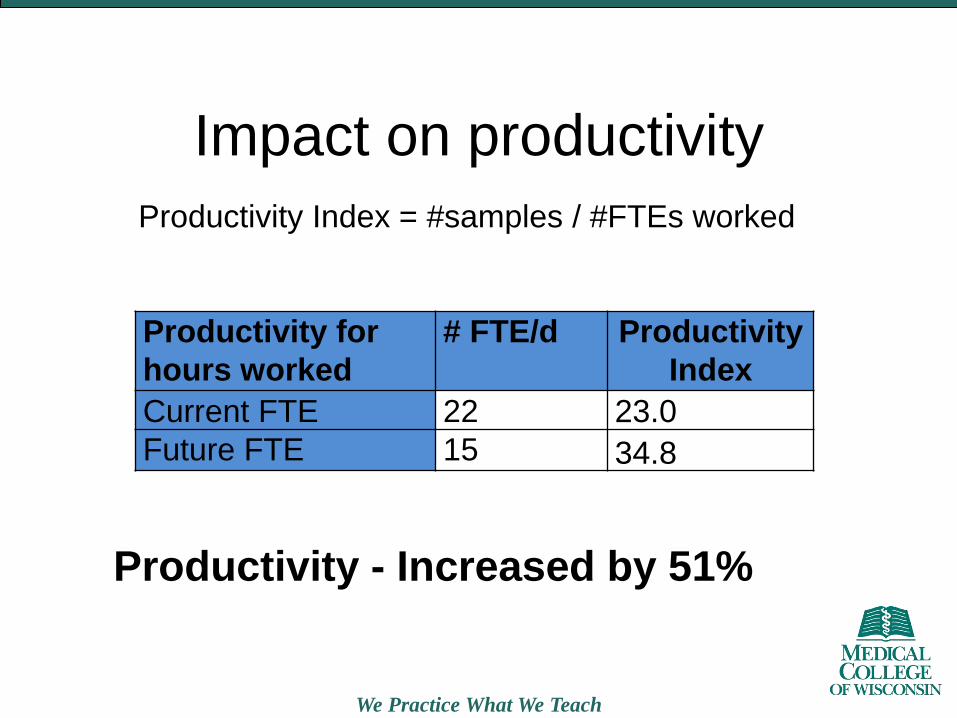
Impact on productivity
Productivity - Increased by 51%
Productivity Index = #samples / #FTEs worked
Productivity for
hours worked
# FTE/d Productivity
Index
Current FTE 22 23.0
Future FTE 15 34.8
We Practice What We Teach
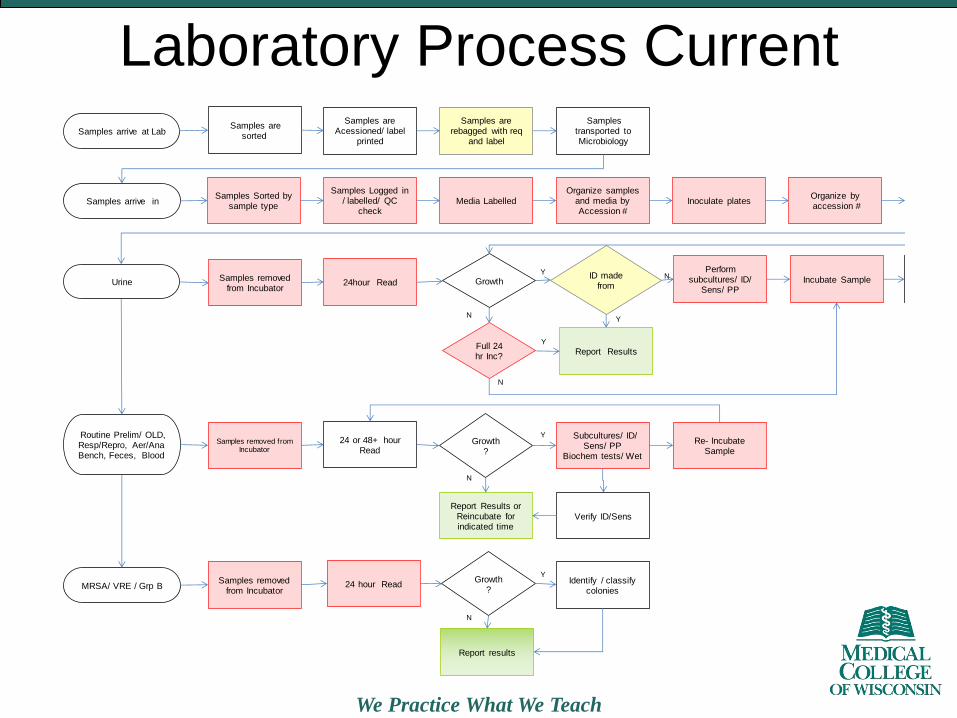
Laboratory Process Current
Samples arrive at Lab Samples are
sorted
Samples are Acessioned/ label
printed
Samples transported to Microbiology
Samples arrive in Samples Sorted by
sample type
Samples Logged in / labelled/ QC
checkMedia Labelled
Organize samples and media by Accession #
Inoculate platesOrganize byaccession #
Samples removed from Incubator
Urine
Routine Prelim/ OLD, Resp/Repro, Aer/Ana Bench, Feces, Blood
24hour Read
Perform subcultures/ ID/
Sens/ PP Growth
Y
N
Report Results
Incubate Sample ID made
from
Y
N
Samples removed from Incubator
24 or 48+ hour Read
Subcultures/ ID/ Sens/ PP
Biochem tests/ Wet
Growth?
Y
N
Report Results or Reincubate for indicated time
Re- Incubate Sample
Full 24 hr Inc?
Y
N
Samples removed from Incubator
24 hour Read Identify / classify colonies
Growth?
Y
N
Report results
MRSA/ VRE / Grp B
Samples are rebagged with req
and label
Verify ID/Sens

We Practice What We Teach
Laboratory Process-Post Automation
Samples arrive at Lab Samples are
sorted
Samples are Acessioned/
labeled
Samples transported to Microbiology
Samples arrive in Samples Loaded onto automation
Can go on
Automated Plate read
ID No growth
Plate reading with 4 Interpretation workbenches
Process Manually
N
Y
Growth No Grow th
Grow th Report Results
Reincubate for required time
Routine Prelim/ OLD, Resp/Repro, Aer/Ana Bench, Feces, Blood
Identify / classify colonies
Growth?
Y
N
Urine / MRSA/ VRE / Grp B
UrinePerform
Biochemical
Growth?
Y
N
Subcultures/ ID/ Sens/ PP
Biochem tests/ Wet
Re- Incubate Sample as required Verify ID/Sens
Report Results

We Practice What We Teach
Is There a True Benefit to
Automation?

We Practice What We Teach
The future of diagnostic bacteriology
Matthews S, et al. CMI, 2011.

We Practice What We Teach
Comparison of recovery rates of enteropathogens from
stool cultures for a one-and two-year-period before and
after introduction of automatic inoculation using Automation
Mischnik A., et al. Annals of Laboratory Medicine, 2015

We Practice What We Teach
Comparison of sensitivities and specificities of manual/LS
swab to WASP/ESwab for the recovery of S. agalactiae
Method and
swab type
No. with indicated test result
Total no.
Sensitivity
(%)
Specificity
(%)
True
positive
False
positive
True
negative
False
negative
Direct plating
Manual/LS
swab
28 0 65 4a 97 87.5 100.0
WASP/ESwab
30 0 65 2b 97 93.8 100.0
Enrichment
culture
Manual/LS
swab
29 0 65 3c 97 90.6 100.0
WASP/ESwab
31 0 65 1d 97 96.9 100.0
Buchan B et al. 2014. JCM

We Practice What We Teach
VALIDATION OF URINE SPECIMENS
• 92 urine specimens were processed on the WASPLab, images were captured at 0, 18, and 24 hours. Plate images were initially viewed on-screen after 18 h incubation. – Negative cultures were automatically unloaded, negative result confirmed
and discarded
– Positive cultures designated as “pathogens requiring further workup”, “fecal contaminated”, “pathogens <10,000 cfu/mL”, or “normal skin flora”.
– The plates were extracted from the WASPLab incubator and sent to the specified canister, manually read, and compared to the on-screen image.
• 76 of the 92 cultures were designated as positive – 100% concordance between manual read and WASPLab interpretation for
16 negative cultures
– Of the 76 positive cultures, 78% concordance between manual interpretation and WASPLab. 17 cultures (22%) where the on-screen image and manual plate reading interpretations did not match.
• 13 were due to overcalling a potential Enterococcus species on-screen, when the colony was actually a normal skin flora
– Corrected through technologist education
• 4 were due to missing a pathogen in heavily mixed cultures on the manual read
• Turnaround was reduced by ~18 hours
Riebe K, Poster at ASM 2015

We Practice What We Teach
Performance of total laboratory automation
combined with MS in clinical microbiology practice
• When full laboratory automation was combined with MALDI-ToF MS: – Pathogen identification using Kiestra TLA
combined with MS resulted in a 30.6 h time gain per isolate compared to CM.
– Pathogens were successfully identified in 98.4% (249/253) of all tested isolates. Early microbial identification without susceptibility testing led to an adjustment of antibiotic regimen in 12% (24/200) of patients.
• Did not evaluate the effect of automation alone on TAT or accuracy of identification
Mutters N et al. Annals of Laboratory Medicine.
2014;34:111-117

We Practice What We Teach
Streaking pattern details and resulting
numbers of single colony counts
Quiblier C et al. 2016. JCM

We Practice What We Teach
Recovered Species
Quiblier C et al. 2016. JCM

We Practice What We Teach
CFU Correlation between
WASP and Manual Streaking
Quiblier C et al. 2016. JCM

We Practice What We Teach
Automated Interpretation of
Chromogenic Media

We Practice What We Teach
The Algorithm

We Practice What We Teach
How it Works

We Practice What We Teach
Performance by Media Type
TABLE 2 Comparison of 3 Chromogenic Agars for the detection of MRSA
Chromogeni
c media
No. of
specimens
tested
Results (no.)a
Performance (% [95% CI])b
MP/AP MN/AN MN/AP MP/AN Sensitivity Specificity
Bio Rad 46668 799 41599 4270 0 100 (99-100) 90.7 (90-91)
chromID
MRSA 2217 162 1898 157 0 100 (97-100) 92.4 (91-93)
BD
Chromagar
MRSA
8805 406 7616 783 0 100 (99-100) 90.7 (90-91)
a MP/AP, manual Pos/automation Pos; MN//AN, manual Neg/automation Neg; MN/AP, manual Neg/automation pos; MP/AN, manual
pos/automation Neg. b CI, confidence interval.

We Practice What We Teach
Manual Negative,
Automation positive
plates generated by
WASPLab CDM software
Automation Positive Naked
Eye Negative showing a small
colony not visually detected by
manual examination but
accurately identified as positive
by the CDM (A1 and A2.).
Residual Matrix on the plate
showing lack of growth, but
containing color due to the
presence of specimen matrix
(B.) and a Borderline Color
plate demonstrating similar
color colonies (C1 and C2).

We Practice What We Teach
Discrepant Analysis
TABLE 3 Discrepant analysis of Manual Negative/Automation Positive Plates
Discrepant
Category MN/APa
Automation
Positive Naked
Eye Negative
Residual Matrix Borderline Colors
Number of plates 5210 153 1189 3868
a Manual Negative/Automation Positive

We Practice What We Teach

We Practice What We Teach
Composite VRE Results
Comparison of 2 Chromogenic Agars for the detection of VRE using automated scoring
Chromo
genic
media
No. of
specime
ns
tested
Results (no.)a
Performance (% [95% CI])b
MP/AP MN/AN MN/AP MP/AN Sensitivity Specificity
Colorex
VRE 86,956 4,296 73,664 8,996 0 100 (99-100) 89.1 (89-89)
Oxoid
VRE 17,774 2,107 14,315 1,352 0 100 (99-100) 91.4 (91-92)
aMP/AP, manual Pos/automation Pos; MN/AN, manual Neg/automation Neg; MN/AP, manual Neg/automation Pos;
MP/AN, manual Pos/automation Neg. b CI, confidence interval.

We Practice What We Teach
TABLE 2 Discrepant analysis of Manual Negative/Automation Positive Plates
Discrepant Category MN/APa Automation Positive 2nd Manual Positive
Residual Matrix/Yeast
Borderline Colors
Number of plates 10,348 498 8,234 1,616
a Manual Negative/Automation Positive
1

We Practice What We Teach a. Shadel et al. Surveillance for vancomycin-resistant enterococci: type, rates, costs, and
implications.
9.6 min/negative
specimena
Manual Processing
$6.40 in
labor/negative
specimen
$563,065.60 in labor
Cost of negative workup for
the study (n = 87,979)
~2 min/negative
specimen
Automated Processing
$1.33 in
labor/negative
specimen
$117,305.33 in labor
Savings = $445,760.27
Technologist Labor is
$40.00/hour
(w/benefits)

We Practice What We Teach
Can it Quantitate?

We Practice What We Teach
Pre-Sorting of urine cultures – 1ul
104 CFU/ml shows as
approximately 10 colonies
105 CFU/ml
shows as
approximately
100 colonies
0 CFU/ml
24 cultures per screen

We Practice What We Teach
Blood Plate Reading
We Practice What We Teach
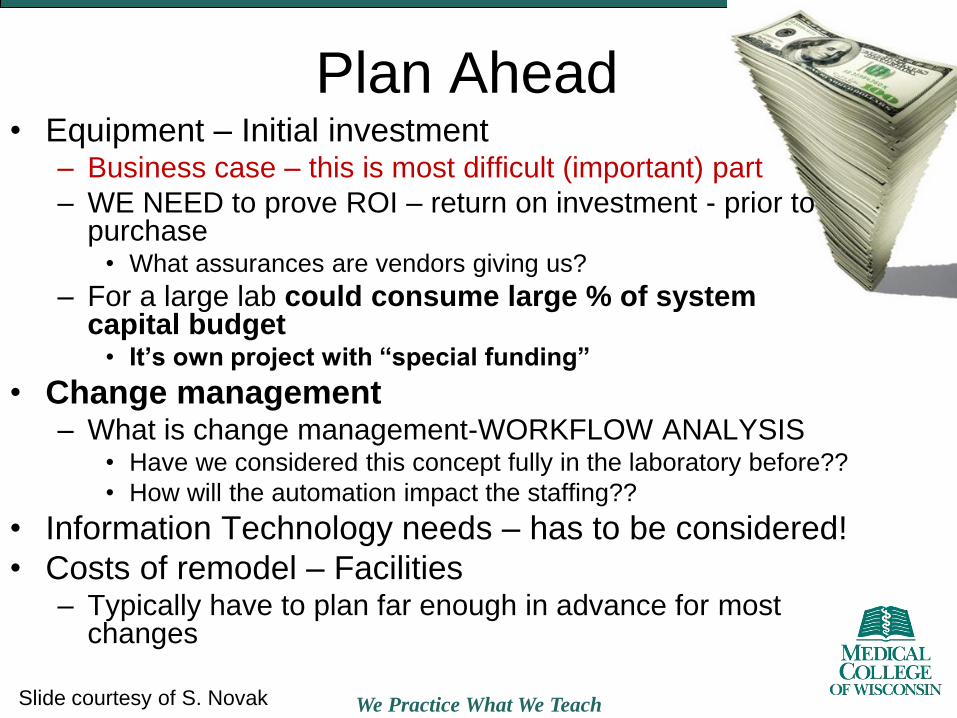
Plan Ahead • Equipment – Initial investment
– Business case – this is most difficult (important) part
– WE NEED to prove ROI – return on investment - prior to purchase
• What assurances are vendors giving us?
– For a large lab could consume large % of system capital budget
• It’s own project with “special funding”
• Change management – What is change management-WORKFLOW ANALYSIS
• Have we considered this concept fully in the laboratory before??
• How will the automation impact the staffing??
• Information Technology needs – has to be considered!
• Costs of remodel – Facilities – Typically have to plan far enough in advance for most
changes
Slide courtesy of S. Novak
We Practice What We Teach
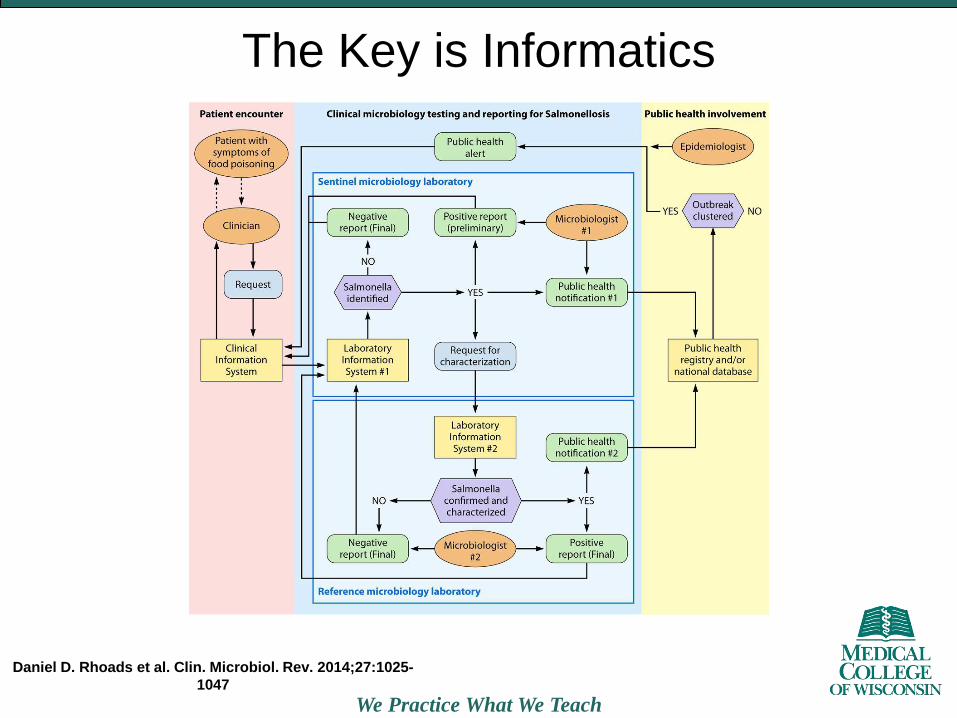
The Key is Informatics
Daniel D. Rhoads et al. Clin. Microbiol. Rev. 2014;27:1025-
1047