lora network - analysis and monitoring - chalmers...
TRANSCRIPT

LoRa Network - Analysis and MonitoringBachelor’s thesis in Computer Science and Engineering
ALEXANDER ERENSTEDT
PHILIP LAINE
Department of Computer Science & EngineeringChalmers University of TechnologyUniversity of Gothenburg
Gothenburg, Sweden 2017


The Author grants to Chalmers University of Technology and University of Gothen-burg the non-exclusive right to publish the Work electronically and in a non-commercialpurpose make it accessible on the Internet. The Author warrants that he/she is theauthor to the Work, and warrants that the Work does not contain text, pictures or othermaterial that violates copyright law.
The Author shall, when transferring the rights of the Work to a third party (for examplea publisher or a company), acknowledge the third party about this agreement. If theAuthor has signed a copyright agreement with a third party regarding the Work, theAuthor warrants hereby that he/she has obtained any necessary permission from thisthird party to let Chalmers University of Technology and University of Gothenburg storethe Work electronically and make it accessible on the Internet.
LoRa Network - Analysis and Monitoringc© ALEXANDER ERENSTEDT, PHILIP LAINE, 2017.
Supervisors:MINA ALIBEIGI, CYBERCOM GROUP ABUNO HOLMER, CHALMERSExaminer: PETER LUNDIN
Department of Computer Science & EngineeringChalmers University of Technology / University of GothenburgSE-412 96 GothenburgTelephone +46 31 772 1000
Cover: Frontend Dashboard built in project, showing a map with gateways and samplemeasurements.

Abstract
This report explores a solution to a maintenance problem of internet of things basednetworks where a lack of tools for visualization of the coverage is present. It arguesfor different software libraries and frameworks, their benefits and drawbacks for thetask. The process starts with a prestudy to define the scope and is followed up by animplementation based on the prestudy. The result is concluded as a frontend-backendsolution that visualizes the coverage on a earth map using a grid based heat map.
iv

Sammanfattning
Denna rapport utforskar en losning for ett underhallsproblem av ”Internet of Things”natverk dar det for tillfallet inte finns nagot verktyg for att visualisera tackning. Ar-gument for olika mjukvarulosningar sasom ramverk och bibliotek tas upp samt vagerfor- och nackdelar mot varandra. Projektet borjar med en forundersokning for attdefiniera funktionella krav pa applikationen vilket sedan implementeras. Resultatet aren ”frontend-backend” losning dar anvandargranssnittet bestar av en webbsida med enkarta samt ett rutnat ovanpa som visualiserar tackningen over ett specifikt omrade.
vi

Acknowledgements
We would like to thank Cybercom for providing the opportunity of doing a bachelor thesisin a new and growing concept, Daniel Ohlund and Andreas Lindmark for guidelines inthe process of development and defining scopes, Mina Alibeigi for always covering ourbacks, Gabriel Ibanez for providing administrative solutions and finally Tanner Yavuzfor providing a good social atmosphere at the office.
TalkPool is the customer which had interest in the platform and provided technicalguidelines and requirements that made the project possible at all, thanks to StefanLindgren and Bertil Moberg for this opportunity.
Finally we would also like to thank Chalmers for the whole educational programme andUno Holmer who was the supervisor for this project from Chalmers and our formerlecturer, Peter Lundin the examiner for the generous grades he will give.
Alexander Erenstedt, Philip Laine
Gothenburg 04/06/17
viii

Contents
1 Introduction 3
1.1 Problem statement . . . . . . . . . . . . . . . . . . . . . . . . . . . . . . . 3
1.2 Purpose . . . . . . . . . . . . . . . . . . . . . . . . . . . . . . . . . . . . . 4
1.3 Delimitations . . . . . . . . . . . . . . . . . . . . . . . . . . . . . . . . . . 4
2 Theory 5
2.1 Agile Development . . . . . . . . . . . . . . . . . . . . . . . . . . . . . . . 5
2.2 Docker . . . . . . . . . . . . . . . . . . . . . . . . . . . . . . . . . . . . . . 6
2.3 IoT . . . . . . . . . . . . . . . . . . . . . . . . . . . . . . . . . . . . . . . . 6
2.4 MQTT . . . . . . . . . . . . . . . . . . . . . . . . . . . . . . . . . . . . . . 7
2.5 LoRa . . . . . . . . . . . . . . . . . . . . . . . . . . . . . . . . . . . . . . . 7
2.5.1 RSSI . . . . . . . . . . . . . . . . . . . . . . . . . . . . . . . . . . . 8
2.5.2 SNR . . . . . . . . . . . . . . . . . . . . . . . . . . . . . . . . . . . 8
2.6 ReactJS . . . . . . . . . . . . . . . . . . . . . . . . . . . . . . . . . . . . . 8
x
CONTENTS
2.6.1 React-Redux . . . . . . . . . . . . . . . . . . . . . . . . . . . . . . 8
2.7 GeoJSON . . . . . . . . . . . . . . . . . . . . . . . . . . . . . . . . . . . . 9
2.8 Heat map . . . . . . . . . . . . . . . . . . . . . . . . . . . . . . . . . . . . 9
2.9 Leaflet . . . . . . . . . . . . . . . . . . . . . . . . . . . . . . . . . . . . . . 10
2.10 Big Data . . . . . . . . . . . . . . . . . . . . . . . . . . . . . . . . . . . . . 10
3 Development Approach 11
3.1 Prestudy . . . . . . . . . . . . . . . . . . . . . . . . . . . . . . . . . . . . . 11
3.2 User Stories . . . . . . . . . . . . . . . . . . . . . . . . . . . . . . . . . . . 12
3.3 Technical Requirements . . . . . . . . . . . . . . . . . . . . . . . . . . . . 12
3.3.1 Data Processing . . . . . . . . . . . . . . . . . . . . . . . . . . . . 12
3.3.2 Filtering . . . . . . . . . . . . . . . . . . . . . . . . . . . . . . . . . 14
4 System Design 15
4.1 MQTT Application . . . . . . . . . . . . . . . . . . . . . . . . . . . . . . . 16
4.2 SQL Server . . . . . . . . . . . . . . . . . . . . . . . . . . . . . . . . . . . 16
4.2.1 Grid . . . . . . . . . . . . . . . . . . . . . . . . . . . . . . . . . . . 17
4.3 Backend . . . . . . . . . . . . . . . . . . . . . . . . . . . . . . . . . . . . . 18
4.4 Frontend . . . . . . . . . . . . . . . . . . . . . . . . . . . . . . . . . . . . . 19
4.5 Deployment . . . . . . . . . . . . . . . . . . . . . . . . . . . . . . . . . . . 22
5 Result 24
5.1 Features and Functionality . . . . . . . . . . . . . . . . . . . . . . . . . . 24
xi
CONTENTS
5.2 Performance . . . . . . . . . . . . . . . . . . . . . . . . . . . . . . . . . . . 28
6 Conclusion 29
6.1 Final result . . . . . . . . . . . . . . . . . . . . . . . . . . . . . . . . . . . 29
6.2 Biggest Issues . . . . . . . . . . . . . . . . . . . . . . . . . . . . . . . . . . 30
6.3 Frontend Technology Choice . . . . . . . . . . . . . . . . . . . . . . . . . . 30
6.4 Map Solution . . . . . . . . . . . . . . . . . . . . . . . . . . . . . . . . . . 32
6.5 Compatibility . . . . . . . . . . . . . . . . . . . . . . . . . . . . . . . . . . 33
6.6 Heatmap Rendering . . . . . . . . . . . . . . . . . . . . . . . . . . . . . . 33
6.7 Sustainability . . . . . . . . . . . . . . . . . . . . . . . . . . . . . . . . . . 33
7 Continuation 34
7.1 Tile Optimization . . . . . . . . . . . . . . . . . . . . . . . . . . . . . . . . 34
7.1.1 Grouping Options . . . . . . . . . . . . . . . . . . . . . . . . . . . 35
7.1.2 Tile Server . . . . . . . . . . . . . . . . . . . . . . . . . . . . . . . 36
7.2 SQL Flavour . . . . . . . . . . . . . . . . . . . . . . . . . . . . . . . . . . 36
7.3 Additional Features . . . . . . . . . . . . . . . . . . . . . . . . . . . . . . 37
7.3.1 Filtering Options . . . . . . . . . . . . . . . . . . . . . . . . . . . . 37
7.3.2 New Devices . . . . . . . . . . . . . . . . . . . . . . . . . . . . . . 37
7.3.3 Alternative Applications . . . . . . . . . . . . . . . . . . . . . . . . 37
7.3.4 Machine Learning . . . . . . . . . . . . . . . . . . . . . . . . . . . 38
7.3.5 Big Data . . . . . . . . . . . . . . . . . . . . . . . . . . . . . . . . 38
xii

CONTENTS
References 39
xiii
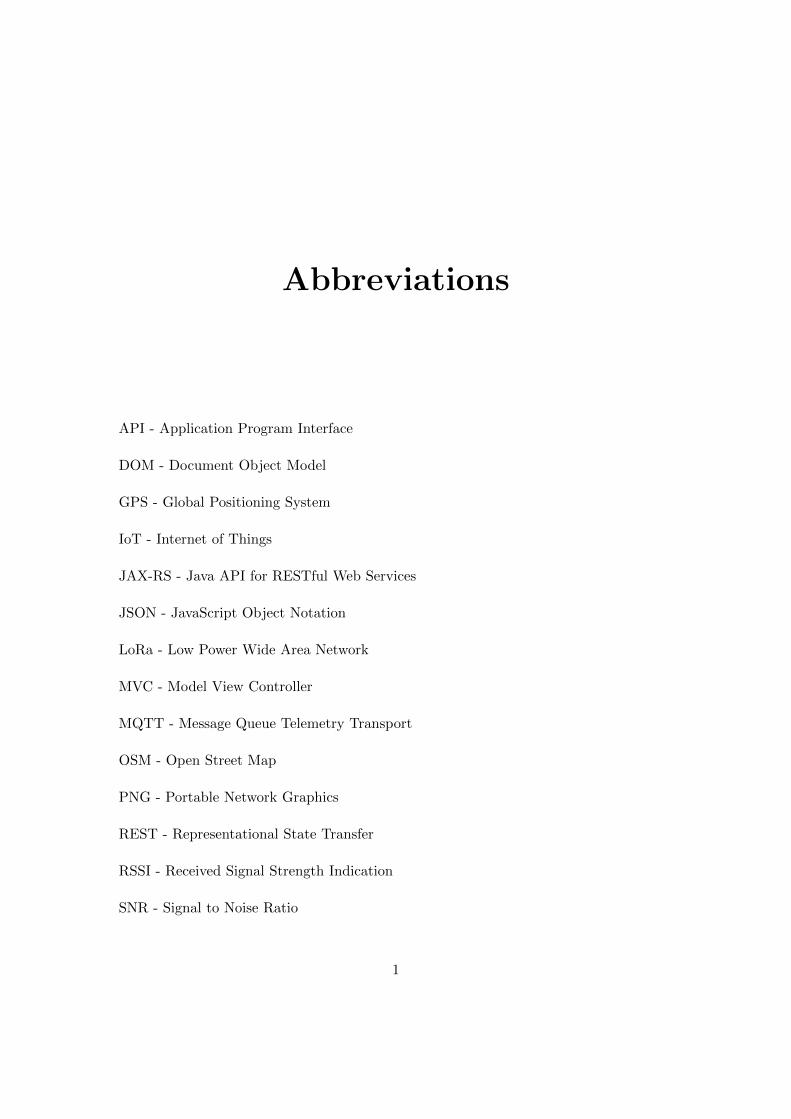
Abbreviations
API - Application Program Interface
DOM - Document Object Model
GPS - Global Positioning System
IoT - Internet of Things
JAX-RS - Java API for RESTful Web Services
JSON - JavaScript Object Notation
LoRa - Low Power Wide Area Network
MVC - Model View Controller
MQTT - Message Queue Telemetry Transport
OSM - Open Street Map
PNG - Portable Network Graphics
REST - Representational State Transfer
RSSI - Received Signal Strength Indication
SNR - Signal to Noise Ratio
1

Abbreviations
UI - User Interfaces
VM - Virtual Machine
2
1
Introduction
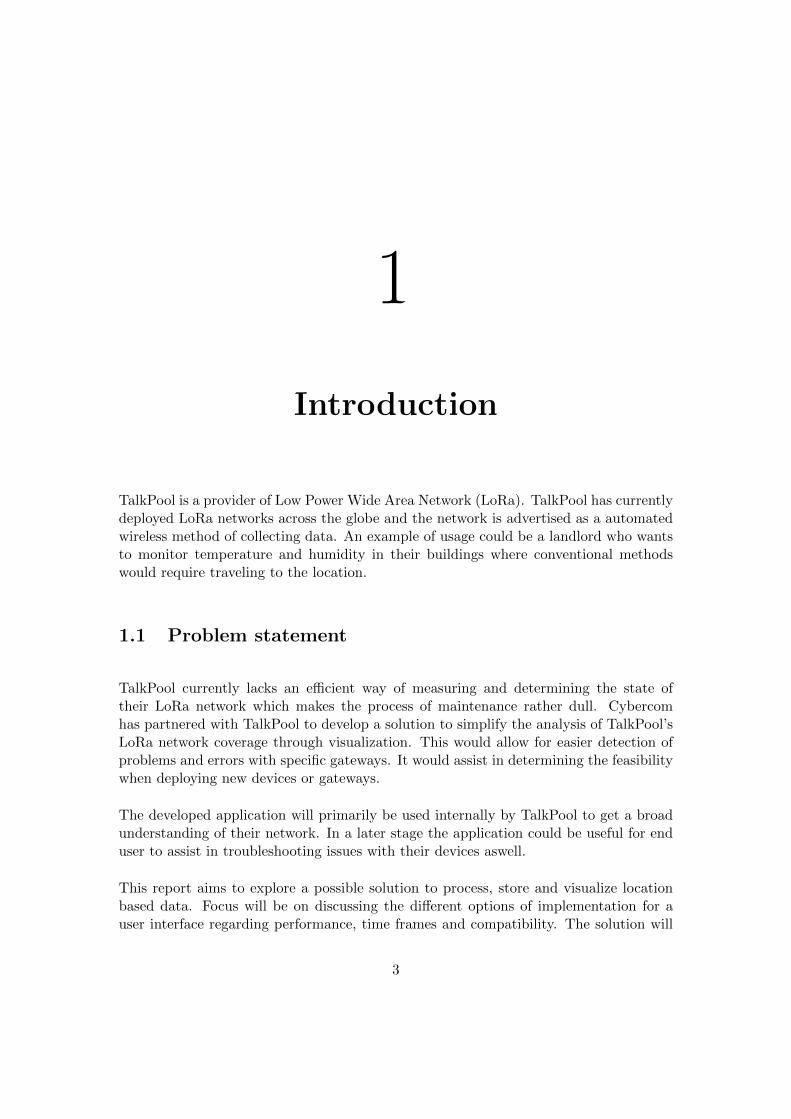
TalkPool is a provider of Low Power Wide Area Network (LoRa). TalkPool has currentlydeployed LoRa networks across the globe and the network is advertised as a automatedwireless method of collecting data. An example of usage could be a landlord who wantsto monitor temperature and humidity in their buildings where conventional methodswould require traveling to the location.
1.1 Problem statement
TalkPool currently lacks an efficient way of measuring and determining the state oftheir LoRa network which makes the process of maintenance rather dull. Cybercomhas partnered with TalkPool to develop a solution to simplify the analysis of TalkPool’sLoRa network coverage through visualization. This would allow for easier detection ofproblems and errors with specific gateways. It would assist in determining the feasibilitywhen deploying new devices or gateways.
The developed application will primarily be used internally by TalkPool to get a broadunderstanding of their network. In a later stage the application could be useful for enduser to assist in troubleshooting issues with their devices aswell.
This report aims to explore a possible solution to process, store and visualize locationbased data. Focus will be on discussing the different options of implementation for auser interface regarding performance, time frames and compatibility. The solution will
3
1.2. PURPOSE CHAPTER 1. INTRODUCTION
consist of three main components which are:
• Data receiving and processing
• Data storage and delivery
• Data visualization
The goal is to evaluate each component as if they would be used in production. Aspectssuch as scalability and mutability will be observed to create the final verdict. Aspects ofthis report will discuss the different possibilities to store and process geo-location data.It will look at different options and problems which can arise when attempting to storeand query larger sets of data based on position.
Focus is given to setting up a data processing and storing system, suited for locationbased visualization. Allowing for further features to be developed at a later time withouthaving to do the data collection again.
1.2 Purpose
The purpose is to develop a prototype application which visualizes location based net-work coverage through the use of a heat map. The end result is a proof of conceptshowing the possibilities and usefulness of visualizing a heat map through a grid basedsystem.
1.3 Delimitations
• Legacy systems support is not a requirement when selecting tools such as webbrowsers.
• Data will be supplied by TalkPool and will be generated during the project.
• Hosting will be done through Azure.
• The database is built based on the assumption that the Gateways will not change.
• Data is not expected to be received from any of the poles.
4
2
Theory
This chapter will explain key concepts used in the development and deployment of thisprojects. Focus is put on protocols and standards needed to understand the project, butsome tools and languages will also be explained.
2.1 Agile Development
Agile development is a principle which allows projects to quickly and painlessly adaptto requirement changes. Work is divided up in sprints, where each sprint is to be donewithin a set time. Each sprint gets estimated with a set of tasks, which are expected tobe completed within the sprint. These tasks are repeatedly synchronized and prioritizedin collaboration with stakeholders each sprint to ensure a solid final product. When tasksare done they will be queued for review which is supposed to be reviewed by someoneelse than the person who executed the task. There will be daily stand up meetings toupdate everyone in the team on what is under progress and problems that could hinderprogress.
5
2.2. DOCKER CHAPTER 2. THEORY
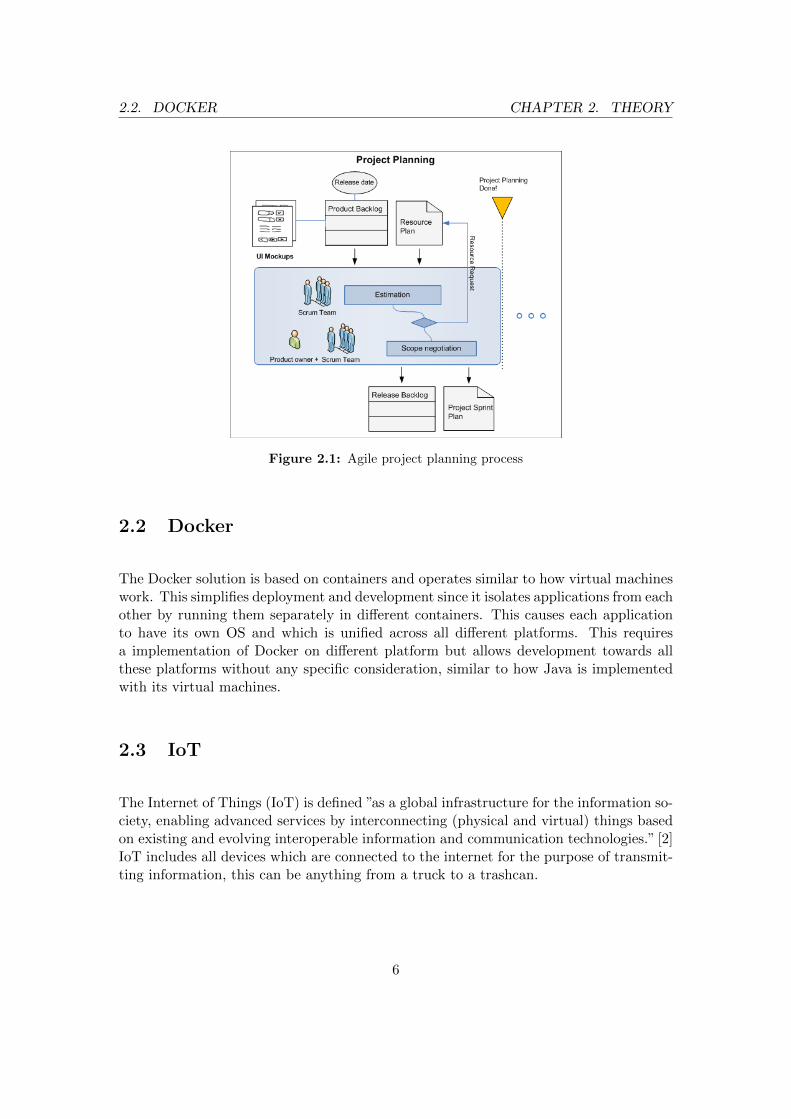
Figure 2.1: Agile project planning process
2.2 Docker
The Docker solution is based on containers and operates similar to how virtual machineswork. This simplifies deployment and development since it isolates applications from eachother by running them separately in different containers. This causes each applicationto have its own OS and which is unified across all different platforms. This requiresa implementation of Docker on different platform but allows development towards allthese platforms without any specific consideration, similar to how Java is implementedwith its virtual machines.
2.3 IoT
The Internet of Things (IoT) is defined ”as a global infrastructure for the information so-ciety, enabling advanced services by interconnecting (physical and virtual) things basedon existing and evolving interoperable information and communication technologies.” [2]IoT includes all devices which are connected to the internet for the purpose of transmit-ting information, this can be anything from a truck to a trashcan.
6
2.4. MQTT CHAPTER 2. THEORY
2.4 MQTT
Message Queue Telemetry Transport (MQTT) is a light weight communication protocolmeant for device to device communication. The protocol is widely used by IoT deviceswhich require a simple solution to send small amounts of data between devices. Devicescommunicate through a publish-subscribe pattern where a broker is required to receivemessages and forward them to devices which are interested in receiving them. Thispattern allows for multiple devices to receive the same message, and for a device topublish a message which no device listens to.
2.5 LoRa
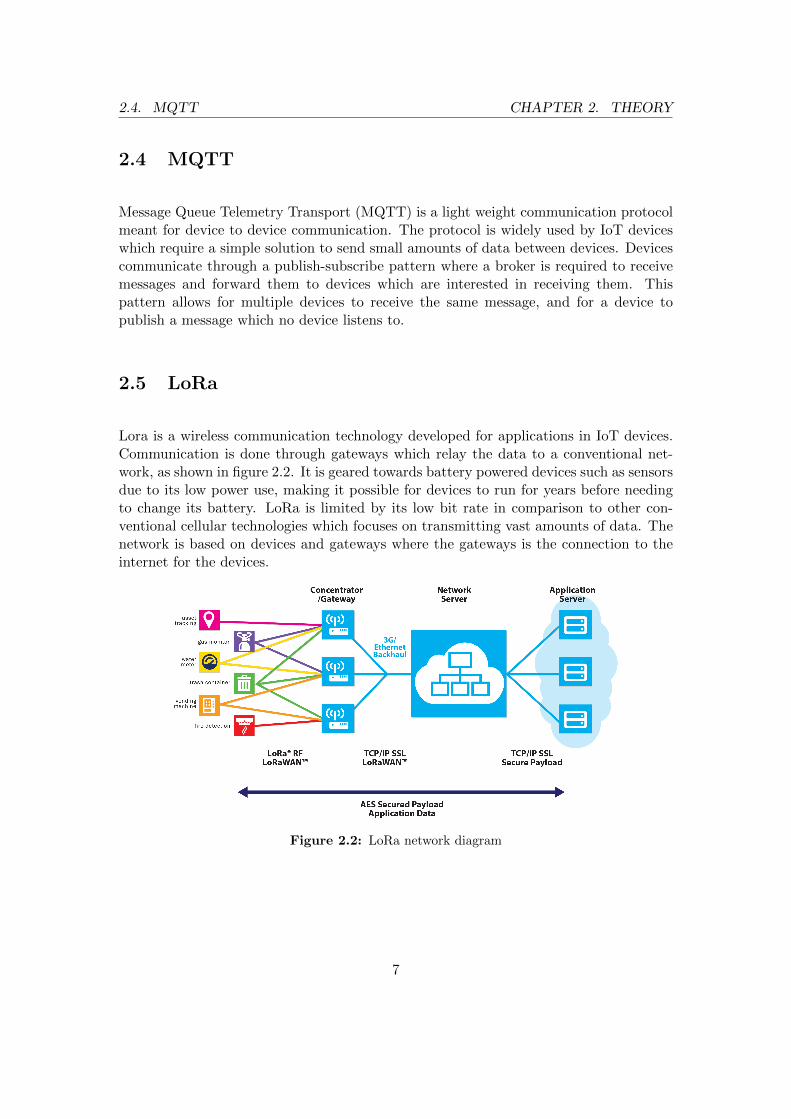
Lora is a wireless communication technology developed for applications in IoT devices.Communication is done through gateways which relay the data to a conventional net-work, as shown in figure 2.2. It is geared towards battery powered devices such as sensorsdue to its low power use, making it possible for devices to run for years before needingto change its battery. LoRa is limited by its low bit rate in comparison to other con-ventional cellular technologies which focuses on transmitting vast amounts of data. Thenetwork is based on devices and gateways where the gateways is the connection to theinternet for the devices.
Figure 2.2: LoRa network diagram
7
2.6. REACTJS CHAPTER 2. THEORY
2.5.1 RSSI
Received signal strength indication (RSSI) is the measure of signal power between adevice and a gateway in dB. The further away a device is from the receiver the lowerthe RSSI is expected to be as the power diminishes. High RSSI values means that thesignal strength is good and the connection will be reliable. While low values meansthat the connection will be more susceptible to interference from other devices, causingconnectivity issues.
2.5.2 SNR
Signal to noise ratio (SNR) is the ratio between the signal power and the amount ofbackground noise interfering with the signal. The ratio is important as data must betransmitted well above the noise floor for it to be received and decoded. Large amountsof noise would also cause the need to transmit with more power, to stay above the noisefloor.
2.6 ReactJS
React is a programming concept which simplifies building User Interfaces(UI)[3], sup-posedly replaces the view part of the Model-View-Controller (MVC) template[4]. It aimsto be simple, efficient, interactive and as the title suggests, reactive, mostly to changesin the UI[3]. It is currently mainly maintained by Facebook and is licensed as opensource under Berkeley Software Distribution(BSD) however with some extra clauses [1].ReactJS is based on a component logic which is arranged in a tree structure, parent andchild relations. The data flow between components is uni-directional which means thatthe data flow is just in one direction, most often from parent to child. This characteristicis probable to cause some confusion on how components are supposed to communicate,especially when two components that does not have a parent-child relation requires dataexchange.
2.6.1 React-Redux
Redux is a tool inspired by the Flux pattern and built to be combined but not limitedto React. It is built to solve the issues where React crumbles in the sense of data flow.Redux offers a solution where each component in React can subscribe and dispatch data
8
2.7. GEOJSON CHAPTER 2. THEORY
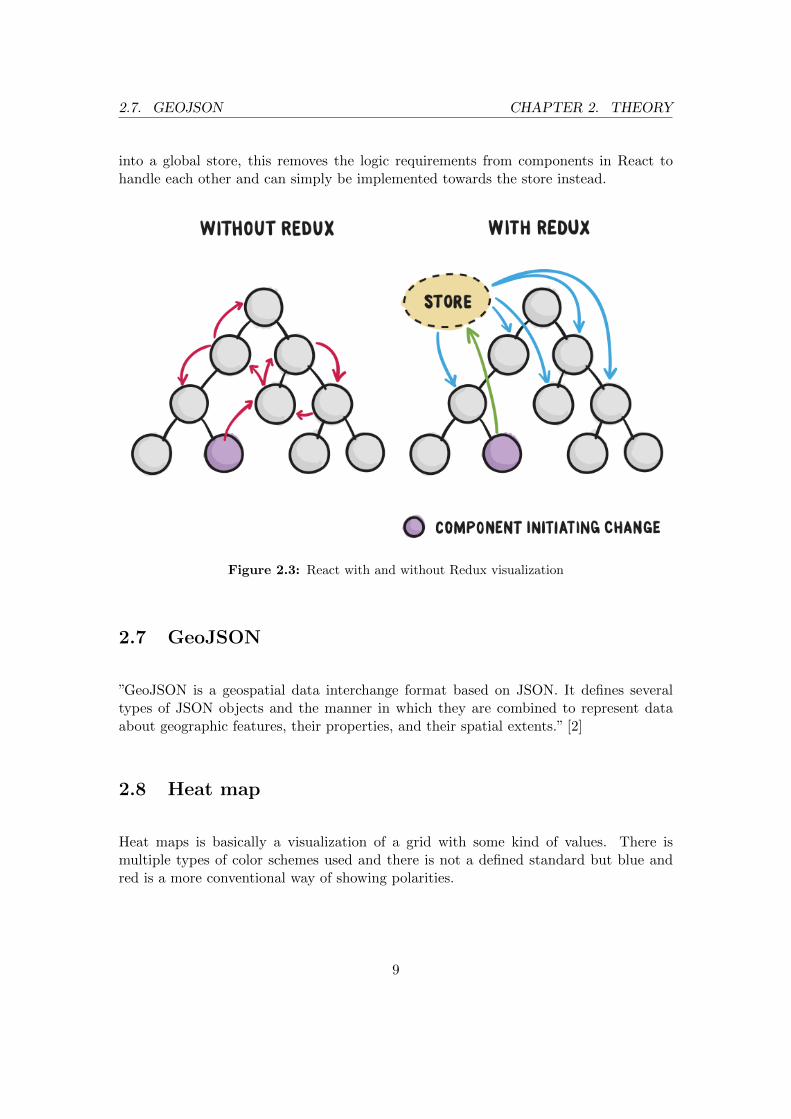
into a global store, this removes the logic requirements from components in React tohandle each other and can simply be implemented towards the store instead.
Figure 2.3: React with and without Redux visualization
2.7 GeoJSON
”GeoJSON is a geospatial data interchange format based on JSON. It defines severaltypes of JSON objects and the manner in which they are combined to represent dataabout geographic features, their properties, and their spatial extents.” [2]
2.8 Heat map
Heat maps is basically a visualization of a grid with some kind of values. There ismultiple types of color schemes used and there is not a defined standard but blue andred is a more conventional way of showing polarities.
9
2.9. LEAFLET CHAPTER 2. THEORY
2.9 Leaflet
Leaflet is a lightweight library for using interactive maps. Leaflet implements differentcomponents for the maps such as markers, rectangles, layer controllers and much more.The core element, the map, requires a tile provider which has the task to send the mapas images based on current view bounds and zoom level. Leaflet has support for drawingfigures on the map from GeoJSON data.
2.10 Big Data
Big data is a term which describes data that is too large to be handled by conventionalmethods, it is often defined with the three V’s [3].
• Volume is used to describe sizes of captured data, terabytes, petabytes and some-times exabytes of data.
• Variety defines the problems where data can be collected from different placesin different formatting and structure. The three types of data that are oftenmentioned: the structured, unstructured and the combination of these which iscalled semi-structured.
• Velocity refers to the speed of processing and generating data.
10
3
Development Approach
This chapter will cover the ways of working and a prestudy that was made to define thescope of the project. The work flow follows the agile development approach to ensurecommon goals with every stakeholder.
3.1 Prestudy
A prestudy defines the technical requirements, questions yet to be answered when theproject starts, assumptions and a brief plan of how the system will be designed. Costcalculations is also usually included but in this case a rather small component, wheresome hosting costs are considered. The broad but exact purpose of the prestudy is todefine the scope of the project, to define what resources is available and required.
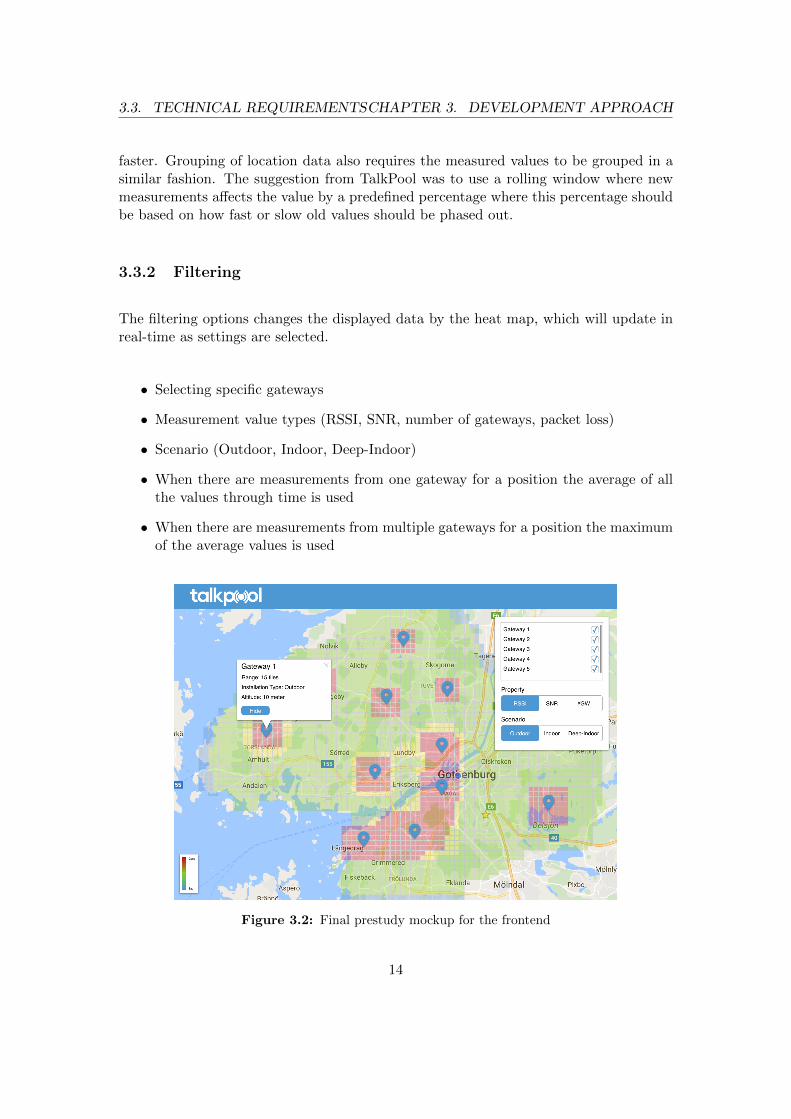
The prestudy is done in collaboration with TalkPool to ensure common requirements onfunctionality and to synchronize the grasp on the scope of the project. The process ofprestudy consists of defining user stories based on TalkPool’s idea of usage where thosedefines the core functionality that will be implemented. The user stories is afterwardsbroken down to facilitate work and thereby time estimations. Mockups of the projectshould also be presented and agreed upon to ensure that all involved parties is satisfiedwith the development direction of the project. The final mockup based on the technicalspecifications is shown in figure 3.2.
11
3.2. USER STORIES CHAPTER 3. DEVELOPMENT APPROACH
3.2 User Stories
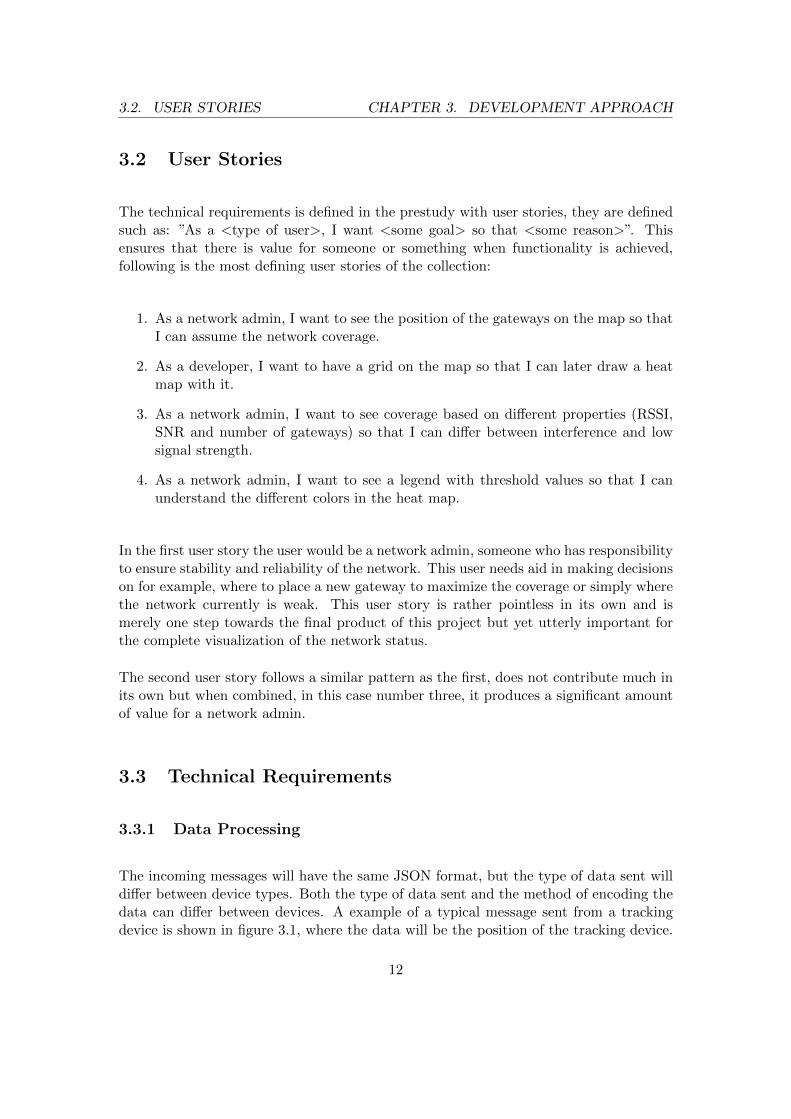
The technical requirements is defined in the prestudy with user stories, they are definedsuch as: ”As a <type of user>, I want <some goal> so that <some reason>”. Thisensures that there is value for someone or something when functionality is achieved,following is the most defining user stories of the collection:
1. As a network admin, I want to see the position of the gateways on the map so thatI can assume the network coverage.
2. As a developer, I want to have a grid on the map so that I can later draw a heatmap with it.
3. As a network admin, I want to see coverage based on different properties (RSSI,SNR and number of gateways) so that I can differ between interference and lowsignal strength.
4. As a network admin, I want to see a legend with threshold values so that I canunderstand the different colors in the heat map.
In the first user story the user would be a network admin, someone who has responsibilityto ensure stability and reliability of the network. This user needs aid in making decisionson for example, where to place a new gateway to maximize the coverage or simply wherethe network currently is weak. This user story is rather pointless in its own and ismerely one step towards the final product of this project but yet utterly important forthe complete visualization of the network status.
The second user story follows a similar pattern as the first, does not contribute much inits own but when combined, in this case number three, it produces a significant amountof value for a network admin.
3.3 Technical Requirements
3.3.1 Data Processing
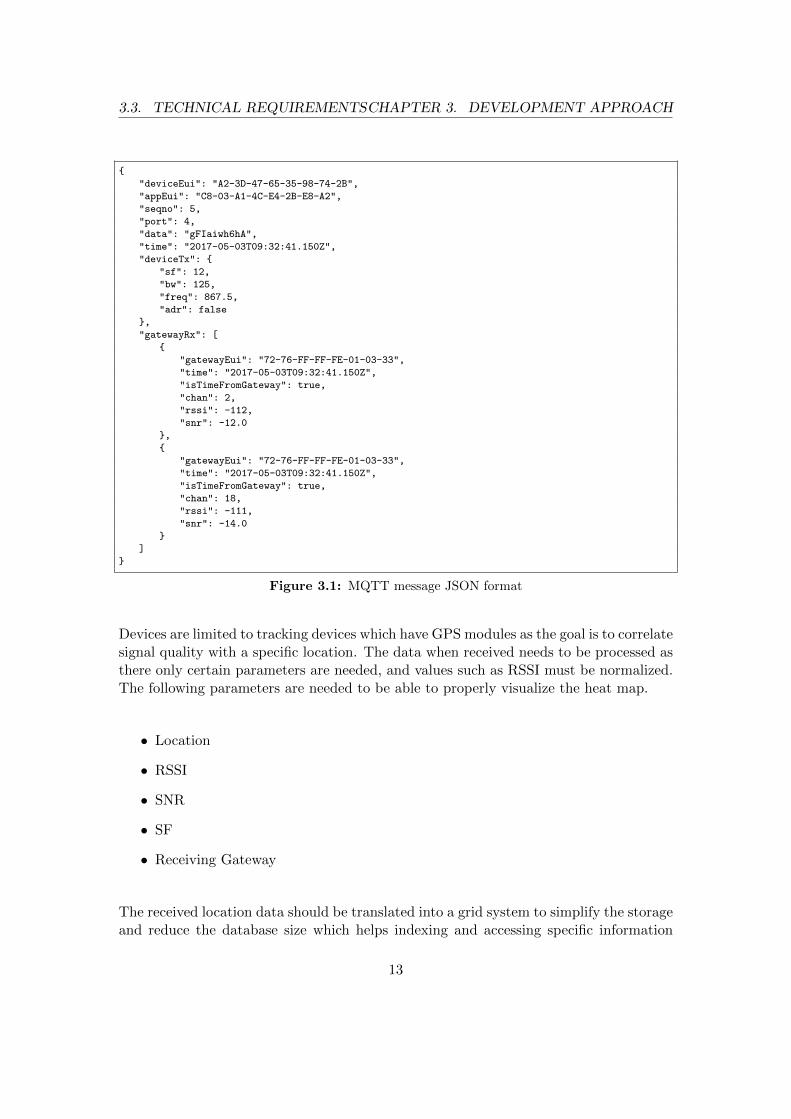
The incoming messages will have the same JSON format, but the type of data sent willdiffer between device types. Both the type of data sent and the method of encoding thedata can differ between devices. A example of a typical message sent from a trackingdevice is shown in figure 3.1, where the data will be the position of the tracking device.
12
3.3. TECHNICAL REQUIREMENTSCHAPTER 3. DEVELOPMENT APPROACH
"deviceEui": "A2-3D-47-65-35-98-74-2B",
"appEui": "C8-03-A1-4C-E4-2B-E8-A2",
"seqno": 5,
"port": 4,
"data": "gFIaiwh6hA",
"time": "2017-05-03T09:32:41.150Z",
"deviceTx":
"sf": 12,
"bw": 125,
"freq": 867.5,
"adr": false
,
"gatewayRx": [
"gatewayEui": "72-76-FF-FF-FE-01-03-33",
"time": "2017-05-03T09:32:41.150Z",
"isTimeFromGateway": true,
"chan": 2,
"rssi": -112,
"snr": -12.0
,
"gatewayEui": "72-76-FF-FF-FE-01-03-33",
"time": "2017-05-03T09:32:41.150Z",
"isTimeFromGateway": true,
"chan": 18,
"rssi": -111,
"snr": -14.0
]
Figure 3.1: MQTT message JSON format
Devices are limited to tracking devices which have GPS modules as the goal is to correlatesignal quality with a specific location. The data when received needs to be processed asthere only certain parameters are needed, and values such as RSSI must be normalized.The following parameters are needed to be able to properly visualize the heat map.
• Location
• RSSI
• SNR
• SF
• Receiving Gateway
The received location data should be translated into a grid system to simplify the storageand reduce the database size which helps indexing and accessing specific information
13
3.3. TECHNICAL REQUIREMENTSCHAPTER 3. DEVELOPMENT APPROACH
faster. Grouping of location data also requires the measured values to be grouped in asimilar fashion. The suggestion from TalkPool was to use a rolling window where newmeasurements affects the value by a predefined percentage where this percentage shouldbe based on how fast or slow old values should be phased out.
3.3.2 Filtering
The filtering options changes the displayed data by the heat map, which will update inreal-time as settings are selected.
• Selecting specific gateways
• Measurement value types (RSSI, SNR, number of gateways, packet loss)
• Scenario (Outdoor, Indoor, Deep-Indoor)
• When there are measurements from one gateway for a position the average of allthe values through time is used
• When there are measurements from multiple gateways for a position the maximumof the average values is used
Figure 3.2: Final prestudy mockup for the frontend
14
4
System Design
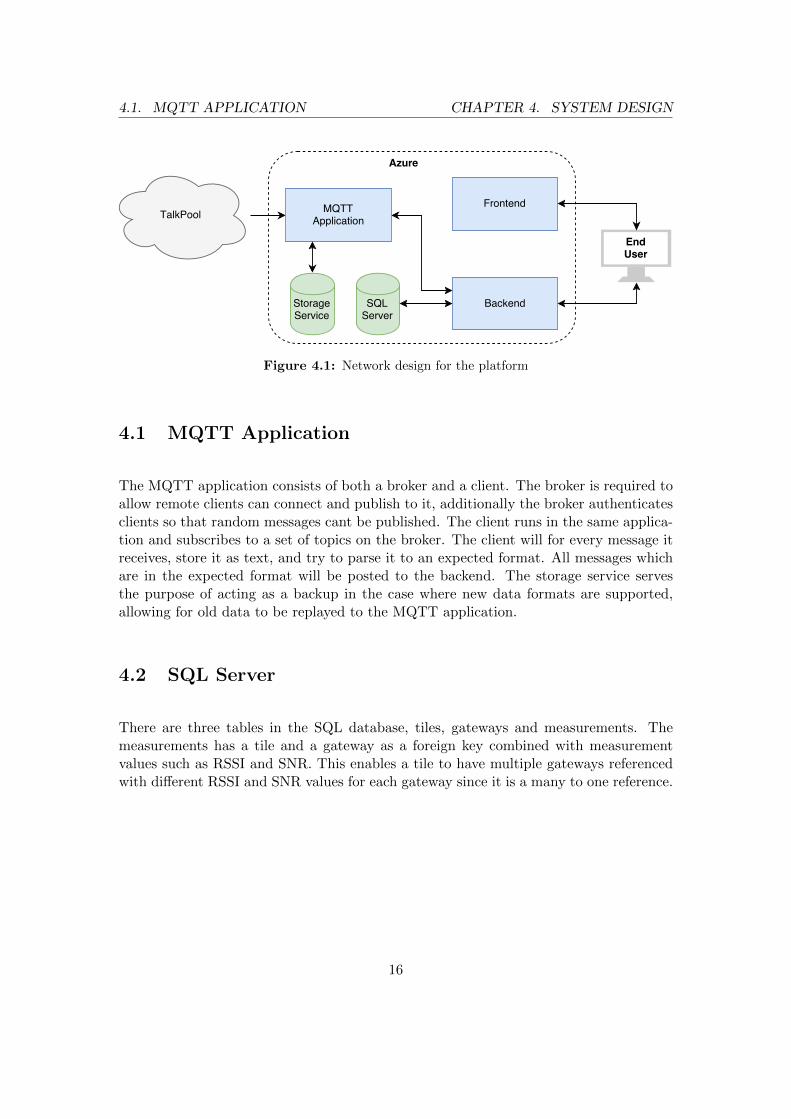
Figure 4.1 shows the general data flow and design of the platform. The data flowstarts from TalkPool’s application servers which publishes messages received from trackerdevices to a MQTT broker hosted on Azure. There is a MQTT client which runsalongside the broker, that subscribes to the messages published by TalkPool on thebroker. The client will then parse the data in the message and extract the necessarydata from the message, which it then posts to the backend. The data from TalkPoolcan come in many different formats, depending on the version and device where themessage originates from. Figure 3.1 shows an example of the received message format.It is necessary to standardize the format received by the backend as many differentapplications may communicate with the backend in theory.
The backend will then update the records in the DB or insert a new record, dependingon the specified location. The frontend is served from a static HTTP server to the enduser client, which the queries the backend for data. The backend provides data such asthe gateway position and tile values that the client then displays to the end user.
15
4.1. MQTT APPLICATION CHAPTER 4. SYSTEM DESIGN
Figure 4.1: Network design for the platform
4.1 MQTT Application
The MQTT application consists of both a broker and a client. The broker is required toallow remote clients can connect and publish to it, additionally the broker authenticatesclients so that random messages cant be published. The client runs in the same applica-tion and subscribes to a set of topics on the broker. The client will for every message itreceives, store it as text, and try to parse it to an expected format. All messages whichare in the expected format will be posted to the backend. The storage service servesthe purpose of acting as a backup in the case where new data formats are supported,allowing for old data to be replayed to the MQTT application.
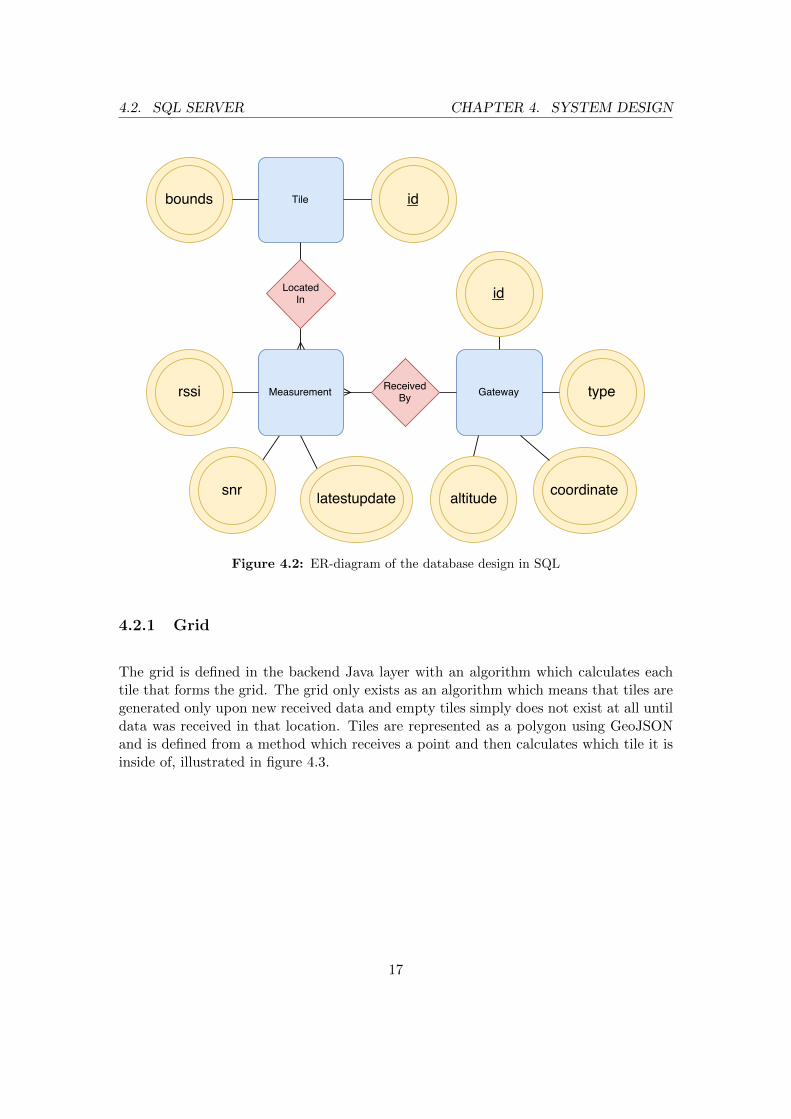
4.2 SQL Server
There are three tables in the SQL database, tiles, gateways and measurements. Themeasurements has a tile and a gateway as a foreign key combined with measurementvalues such as RSSI and SNR. This enables a tile to have multiple gateways referencedwith different RSSI and SNR values for each gateway since it is a many to one reference.
16
4.2. SQL SERVER CHAPTER 4. SYSTEM DESIGN
Figure 4.2: ER-diagram of the database design in SQL
4.2.1 Grid
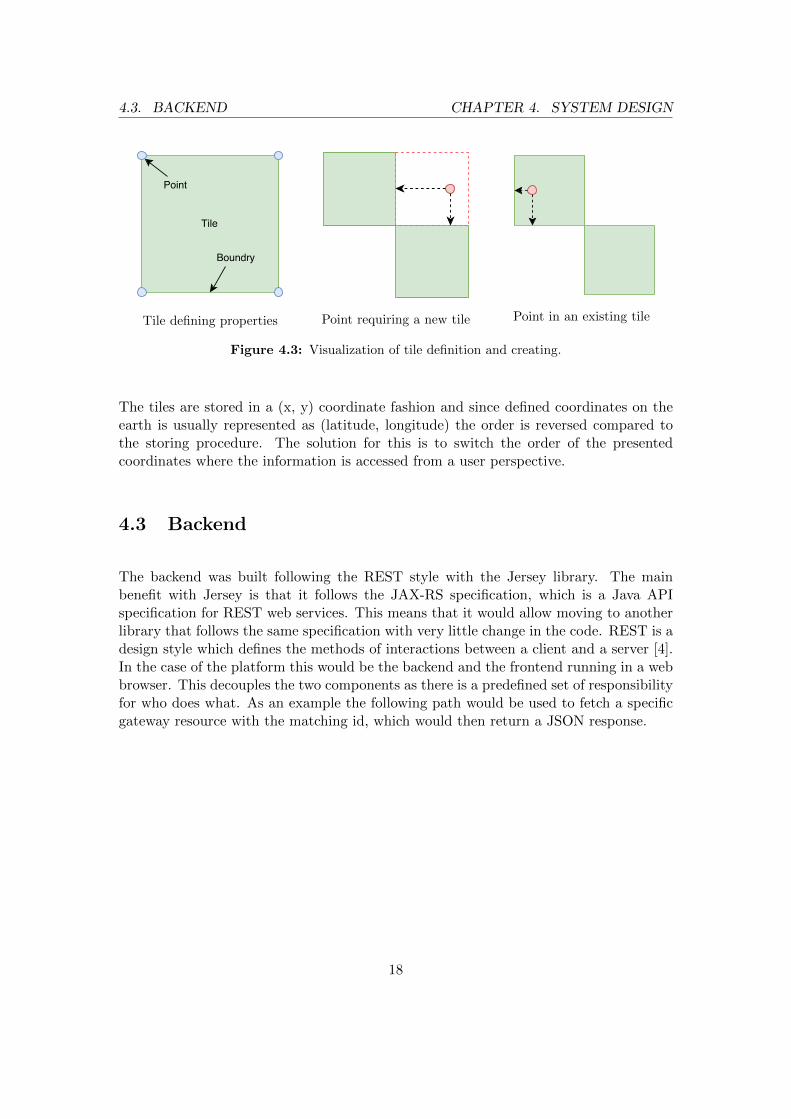
The grid is defined in the backend Java layer with an algorithm which calculates eachtile that forms the grid. The grid only exists as an algorithm which means that tiles aregenerated only upon new received data and empty tiles simply does not exist at all untildata was received in that location. Tiles are represented as a polygon using GeoJSONand is defined from a method which receives a point and then calculates which tile it isinside of, illustrated in figure 4.3.
17
4.3. BACKEND CHAPTER 4. SYSTEM DESIGN
Tile defining properties Point requiring a new tile Point in an existing tile
Figure 4.3: Visualization of tile definition and creating.
The tiles are stored in a (x, y) coordinate fashion and since defined coordinates on theearth is usually represented as (latitude, longitude) the order is reversed compared tothe storing procedure. The solution for this is to switch the order of the presentedcoordinates where the information is accessed from a user perspective.
4.3 Backend
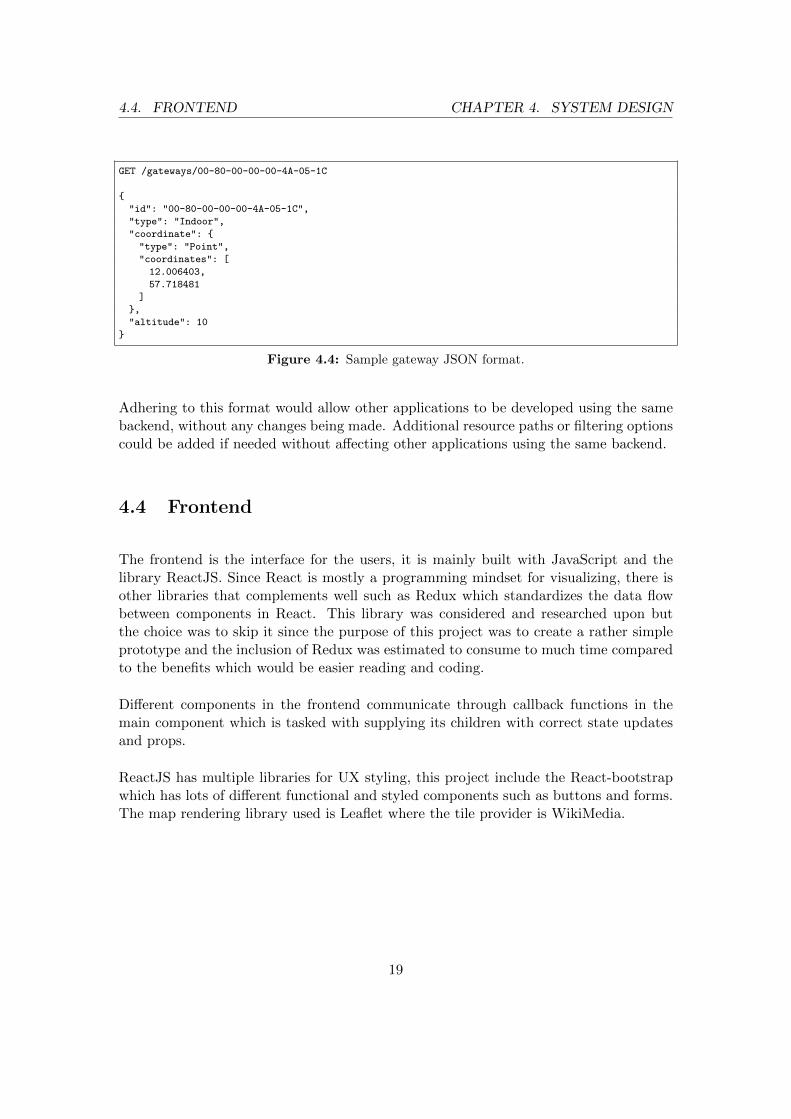
The backend was built following the REST style with the Jersey library. The mainbenefit with Jersey is that it follows the JAX-RS specification, which is a Java APIspecification for REST web services. This means that it would allow moving to anotherlibrary that follows the same specification with very little change in the code. REST is adesign style which defines the methods of interactions between a client and a server [4].In the case of the platform this would be the backend and the frontend running in a webbrowser. This decouples the two components as there is a predefined set of responsibilityfor who does what. As an example the following path would be used to fetch a specificgateway resource with the matching id, which would then return a JSON response.
18
4.4. FRONTEND CHAPTER 4. SYSTEM DESIGN
GET /gateways/00-80-00-00-00-4A-05-1C
"id": "00-80-00-00-00-4A-05-1C",
"type": "Indoor",
"coordinate":
"type": "Point",
"coordinates": [
12.006403,
57.718481
]
,
"altitude": 10
Figure 4.4: Sample gateway JSON format.
Adhering to this format would allow other applications to be developed using the samebackend, without any changes being made. Additional resource paths or filtering optionscould be added if needed without affecting other applications using the same backend.
4.4 Frontend
The frontend is the interface for the users, it is mainly built with JavaScript and thelibrary ReactJS. Since React is mostly a programming mindset for visualizing, there isother libraries that complements well such as Redux which standardizes the data flowbetween components in React. This library was considered and researched upon butthe choice was to skip it since the purpose of this project was to create a rather simpleprototype and the inclusion of Redux was estimated to consume to much time comparedto the benefits which would be easier reading and coding.
Different components in the frontend communicate through callback functions in themain component which is tasked with supplying its children with correct state updatesand props.
ReactJS has multiple libraries for UX styling, this project include the React-bootstrapwhich has lots of different functional and styled components such as buttons and forms.The map rendering library used is Leaflet where the tile provider is WikiMedia.
19
4.4. FRONTEND CHAPTER 4. SYSTEM DESIGN
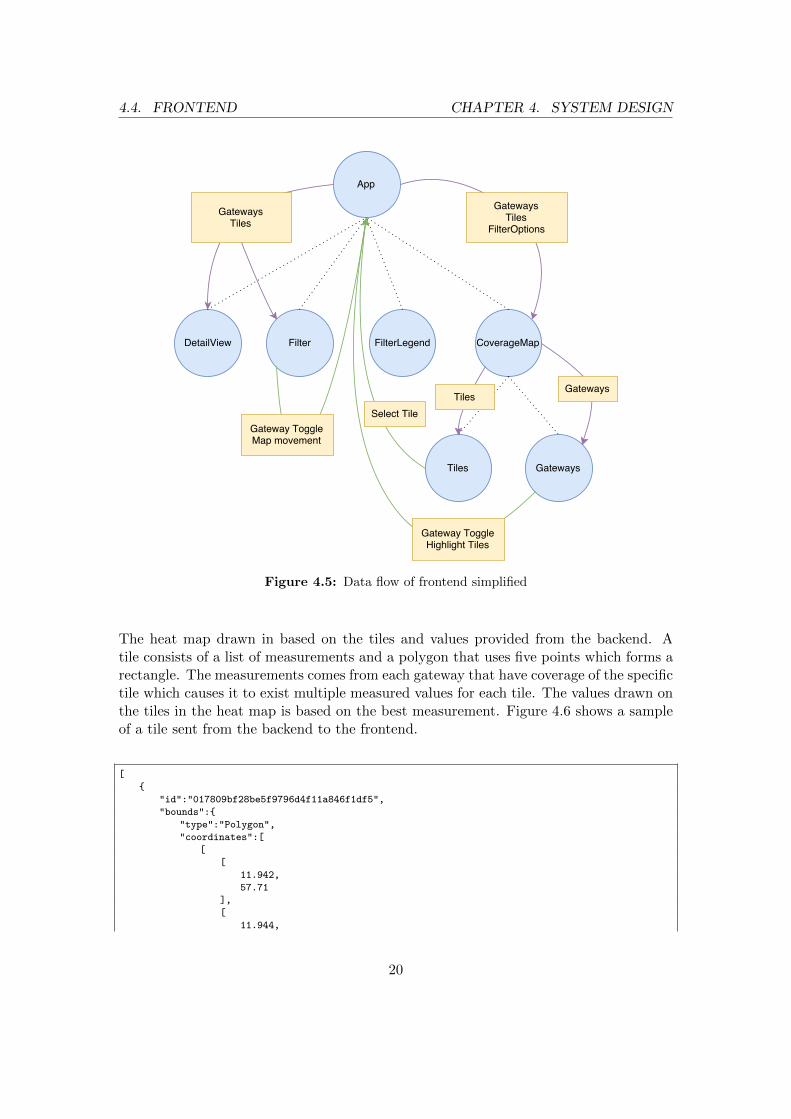
Figure 4.5: Data flow of frontend simplified
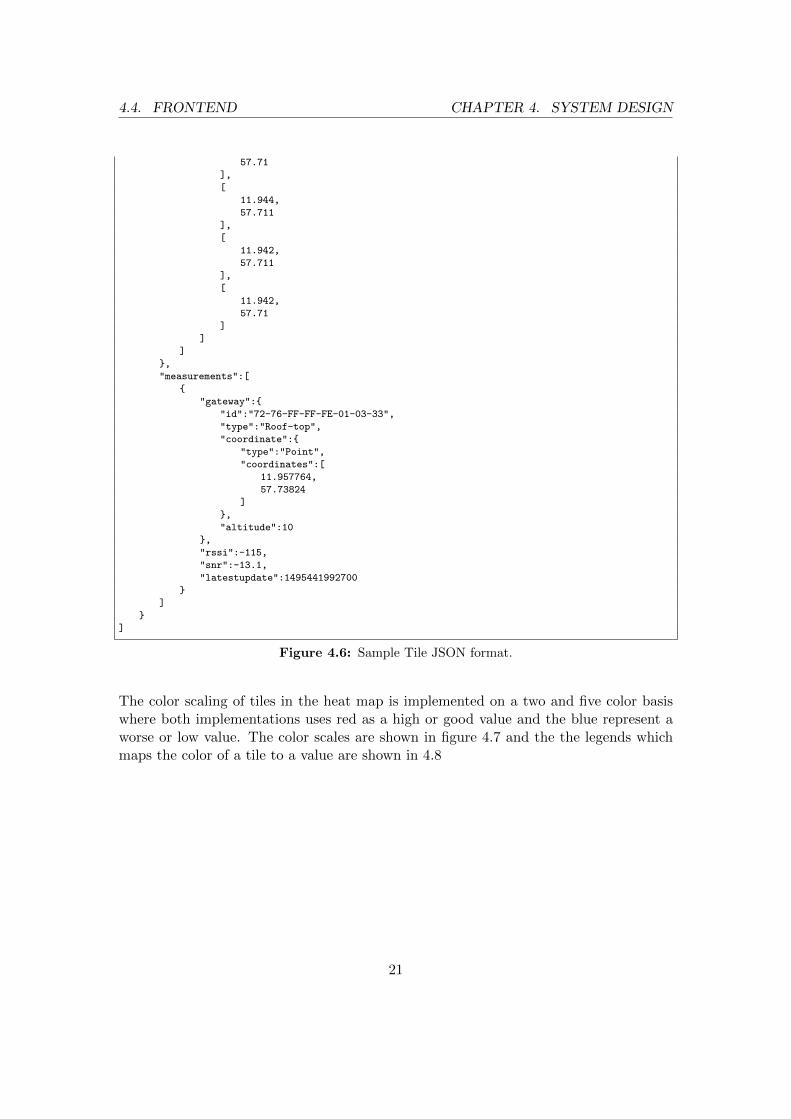
The heat map drawn in based on the tiles and values provided from the backend. Atile consists of a list of measurements and a polygon that uses five points which forms arectangle. The measurements comes from each gateway that have coverage of the specifictile which causes it to exist multiple measured values for each tile. The values drawn onthe tiles in the heat map is based on the best measurement. Figure 4.6 shows a sampleof a tile sent from the backend to the frontend.
[
"id":"017809bf28be5f9796d4f11a846f1df5",
"bounds":
"type":"Polygon",
"coordinates":[
[
[
11.942,
57.71
],
[
11.944,
20
4.4. FRONTEND CHAPTER 4. SYSTEM DESIGN
57.71
],
[
11.944,
57.711
],
[
11.942,
57.711
],
[
11.942,
57.71
]
]
]
,
"measurements":[
"gateway":
"id":"72-76-FF-FF-FE-01-03-33",
"type":"Roof-top",
"coordinate":
"type":"Point",
"coordinates":[
11.957764,
57.73824
]
,
"altitude":10
,
"rssi":-115,
"snr":-13.1,
"latestupdate":1495441992700
]
]
Figure 4.6: Sample Tile JSON format.
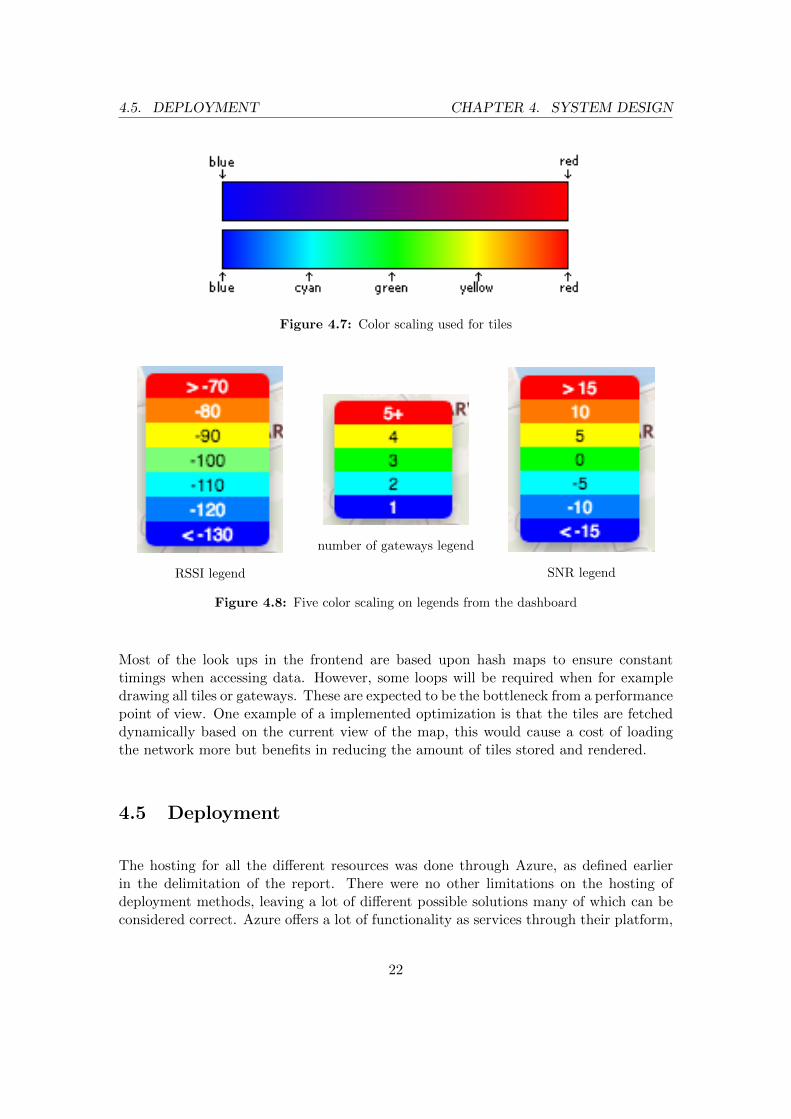
The color scaling of tiles in the heat map is implemented on a two and five color basiswhere both implementations uses red as a high or good value and the blue represent aworse or low value. The color scales are shown in figure 4.7 and the the legends whichmaps the color of a tile to a value are shown in 4.8
21
4.5. DEPLOYMENT CHAPTER 4. SYSTEM DESIGN
Figure 4.7: Color scaling used for tiles
RSSI legend
number of gateways legend
SNR legend
Figure 4.8: Five color scaling on legends from the dashboard
Most of the look ups in the frontend are based upon hash maps to ensure constanttimings when accessing data. However, some loops will be required when for exampledrawing all tiles or gateways. These are expected to be the bottleneck from a performancepoint of view. One example of a implemented optimization is that the tiles are fetcheddynamically based on the current view of the map, this would cause a cost of loadingthe network more but benefits in reducing the amount of tiles stored and rendered.
4.5 Deployment
The hosting for all the different resources was done through Azure, as defined earlierin the delimitation of the report. There were no other limitations on the hosting ofdeployment methods, leaving a lot of different possible solutions many of which can beconsidered correct. Azure offers a lot of functionality as services through their platform,
22
4.5. DEPLOYMENT CHAPTER 4. SYSTEM DESIGN
but after some considerations they were ignored in favour of running everything on oneUbuntu VM. This was partly due to time constraints favouring known tools and the lackof specific features which would have needed to be customized to expand the services.All three components were run as separate Docker containers, allowing for the use of oneVM to host all the needed resources. An additional benefit would be that deploymenton the customers own platform would be simplified, as everything could be setup on onesingle Linux machine. This could reduce the hosting cost as the cheapest option couldbe chosen, or an option which could provide more up time in comparison to Azure.
23
5
Result
The data flow of the prototype is an MQTT application receiving and processing datainto the backend, the layer above the SQL database, and a storage service where messagesare stored without modifications. The frontend ensures that data from the database isrendered and fetched properly for the user, all this is visualized in figure 4.1
5.1 Features and Functionality
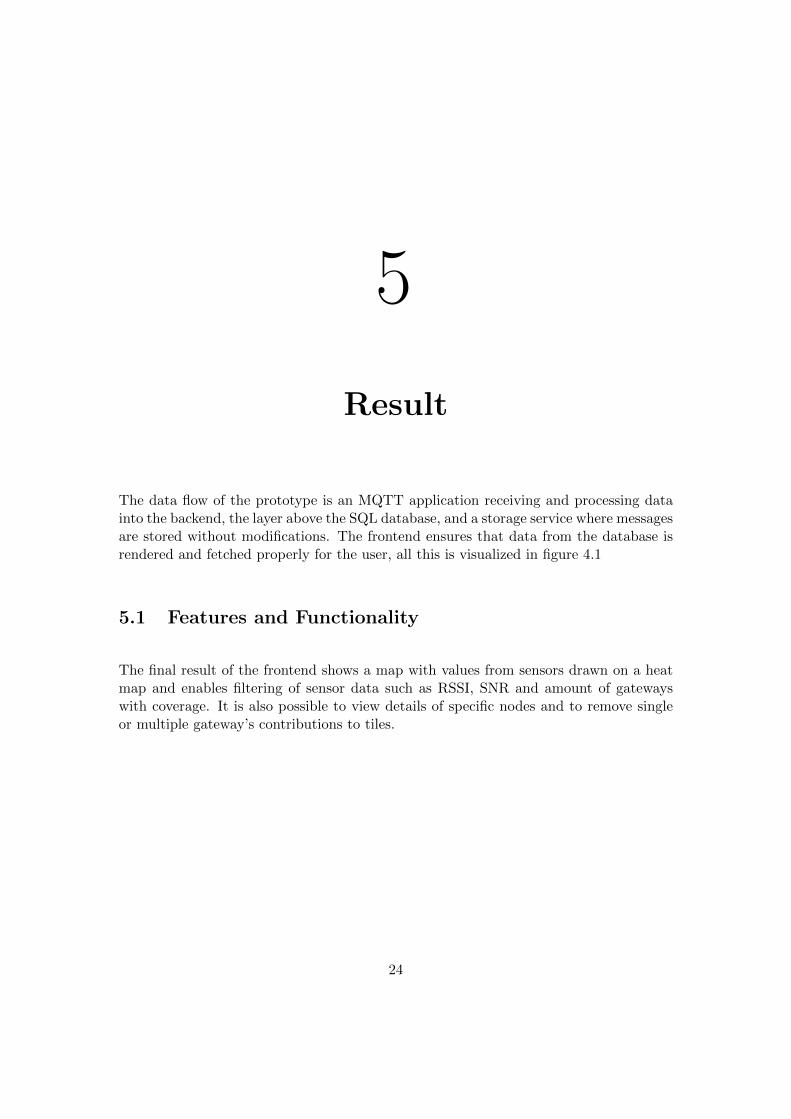
The final result of the frontend shows a map with values from sensors drawn on a heatmap and enables filtering of sensor data such as RSSI, SNR and amount of gatewayswith coverage. It is also possible to view details of specific nodes and to remove singleor multiple gateway’s contributions to tiles.
24
5.1. FEATURES AND FUNCTIONALITY CHAPTER 5. RESULT
Figure 5.1: Screenshot of the frontend
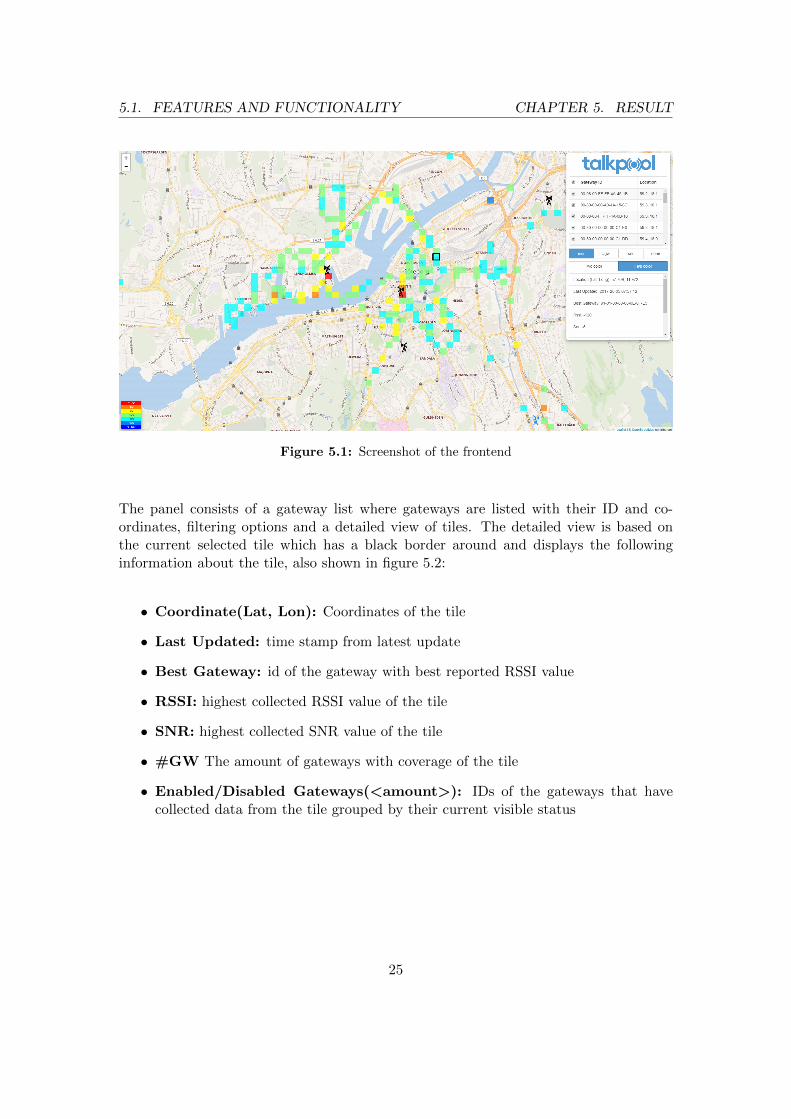
The panel consists of a gateway list where gateways are listed with their ID and co-ordinates, filtering options and a detailed view of tiles. The detailed view is based onthe current selected tile which has a black border around and displays the followinginformation about the tile, also shown in figure 5.2:
• Coordinate(Lat, Lon): Coordinates of the tile
• Last Updated: time stamp from latest update
• Best Gateway: id of the gateway with best reported RSSI value
• RSSI: highest collected RSSI value of the tile
• SNR: highest collected SNR value of the tile
• #GW The amount of gateways with coverage of the tile
• Enabled/Disabled Gateways(<amount>): IDs of the gateways that havecollected data from the tile grouped by their current visible status
25
5.1. FEATURES AND FUNCTIONALITY CHAPTER 5. RESULT
Figure 5.2: Panel from the dashboard
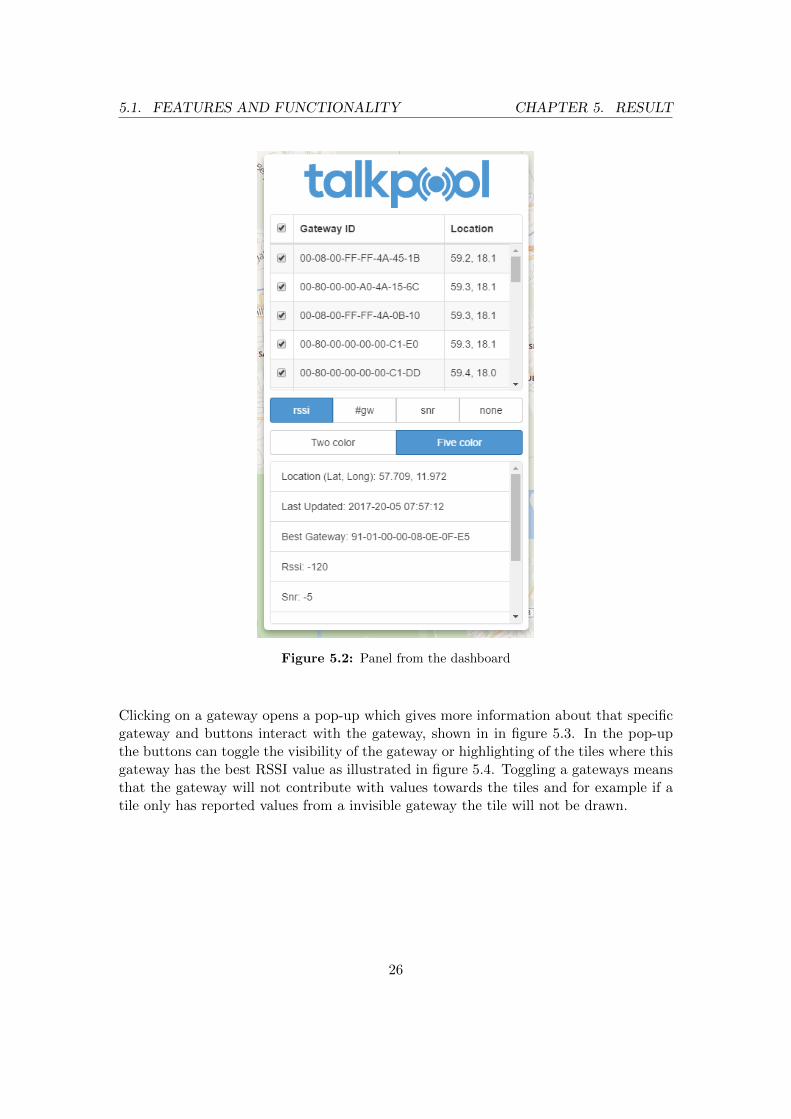
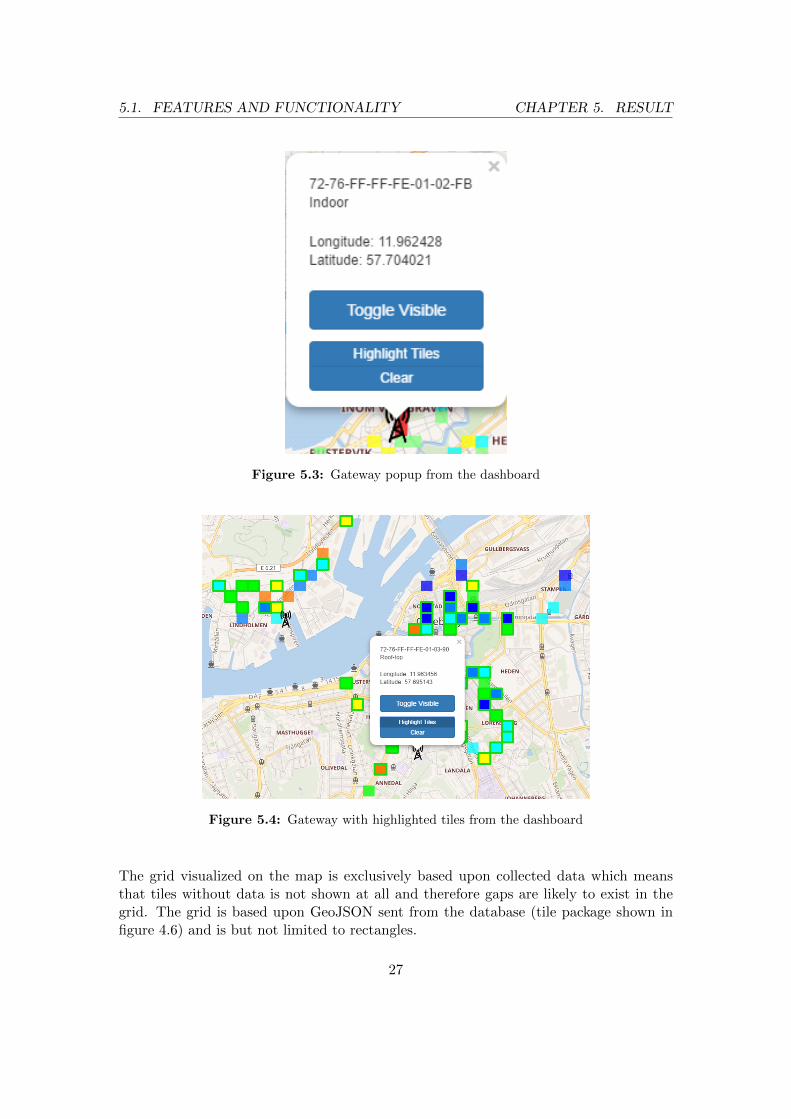
Clicking on a gateway opens a pop-up which gives more information about that specificgateway and buttons interact with the gateway, shown in in figure 5.3. In the pop-upthe buttons can toggle the visibility of the gateway or highlighting of the tiles where thisgateway has the best RSSI value as illustrated in figure 5.4. Toggling a gateways meansthat the gateway will not contribute with values towards the tiles and for example if atile only has reported values from a invisible gateway the tile will not be drawn.
26
5.1. FEATURES AND FUNCTIONALITY CHAPTER 5. RESULT
Figure 5.3: Gateway popup from the dashboard
Figure 5.4: Gateway with highlighted tiles from the dashboard
The grid visualized on the map is exclusively based upon collected data which meansthat tiles without data is not shown at all and therefore gaps are likely to exist in thegrid. The grid is based upon GeoJSON sent from the database (tile package shown infigure 4.6) and is but not limited to rectangles.
27
5.2. PERFORMANCE CHAPTER 5. RESULT
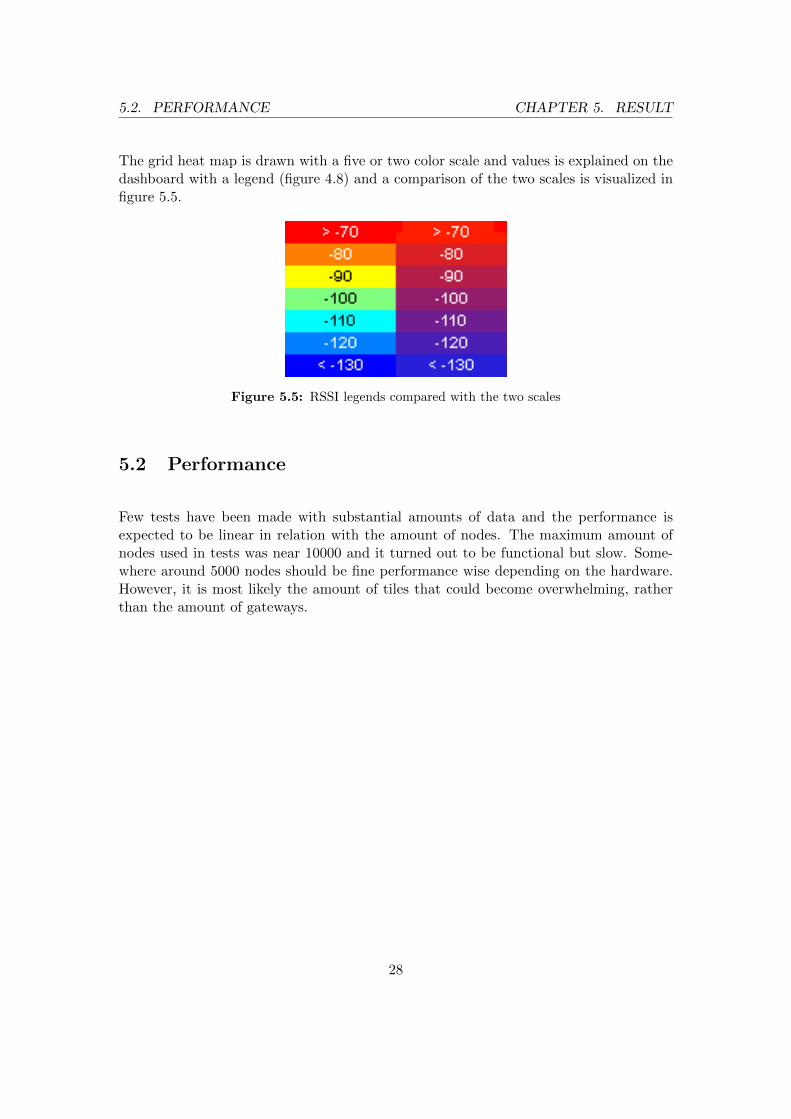
The grid heat map is drawn with a five or two color scale and values is explained on thedashboard with a legend (figure 4.8) and a comparison of the two scales is visualized infigure 5.5.
Figure 5.5: RSSI legends compared with the two scales
5.2 Performance
Few tests have been made with substantial amounts of data and the performance isexpected to be linear in relation with the amount of nodes. The maximum amount ofnodes used in tests was near 10000 and it turned out to be functional but slow. Some-where around 5000 nodes should be fine performance wise depending on the hardware.However, it is most likely the amount of tiles that could become overwhelming, ratherthan the amount of gateways.
28
6
Conclusion
This chapter will discuss different problems encountered and their solution. Challengeswere inevitable but there are many ways to face them. Using the initial technical re-quirements will simplify judging if the end goal was completed, which was discussed inthe previous chapter. Instead focus will be put on analyzing the choices made duringthe project.
6.1 Final result
The project overall turned out alright, the customer TalkPool was pleased with theresults and mentioned that they found a it usable even during development. The methodwith a prestudy and then following an agile development approach turned out to be awinning move. One could argue that the performed prestudy was quite successful sinceonly a few changes were made in the sprint meetings, a re-prioritization of some userstories for the final sprint. Some extra features were implemented in the frontend for abetter user experience such as relocating the map to gateways or multiple color scalingon the grid, they were rather minor but is likely to give the user a better experienceand result from usage. The plan was to have daily stand up meetings which was notconsistent but somewhat maintained, the average per week ended up close to three.
Considering the mockup created in the prestudy and the final result (figure 3.2 and 5.1)the similarities are quite substantial which argues for a good outcome and result of theproject. The positive differences are the color scaling of tiles, the detailed view of tiles,
29
6.2. BIGGEST ISSUES CHAPTER 6. CONCLUSION
interact ability with the pop-up of gateways. What was not included from the mockupwas the filtering on different types of gateway placements which is mentioned as scenarioin the mockup.
6.2 Biggest Issues
A performance issue were encountered during early development when tests with differentamount of tiles were tested. The amount of tiles where doubled up to a amount of tenthousands where the tests stopped since the frontend ran very slow. The rendering timeswith ten thousands of tiles could take a couple of seconds which is unacceptable but stillthe system was usable. Workarounds such as the dynamic fetching of tiles is a precautionfor the fact that it is a reasonable scenario in the future if data is collected over a longperiod of time with a variation of locations.
The fact that different systems stores location data differently caused headaches wheremost of the UI based libraries present the location as Latitude, Longitude which wouldbe Y, X in a regular coordination system in contrast to most systems which stores themas X, Y. The rather late conclusion was to store everything everywhere as X, Y andonly when presented for users switch the order into Y, X or Latitude, Longitude, sincethis is the standard of how coordinates on the earth is presented. There was a situationbecause of a misunderstanding where both the frontend and backend had the coordinatesreversed which caused everything to be presented correctly but in the sense of creatingreadable and mutable code this it had to be fixed.
6.3 Frontend Technology Choice
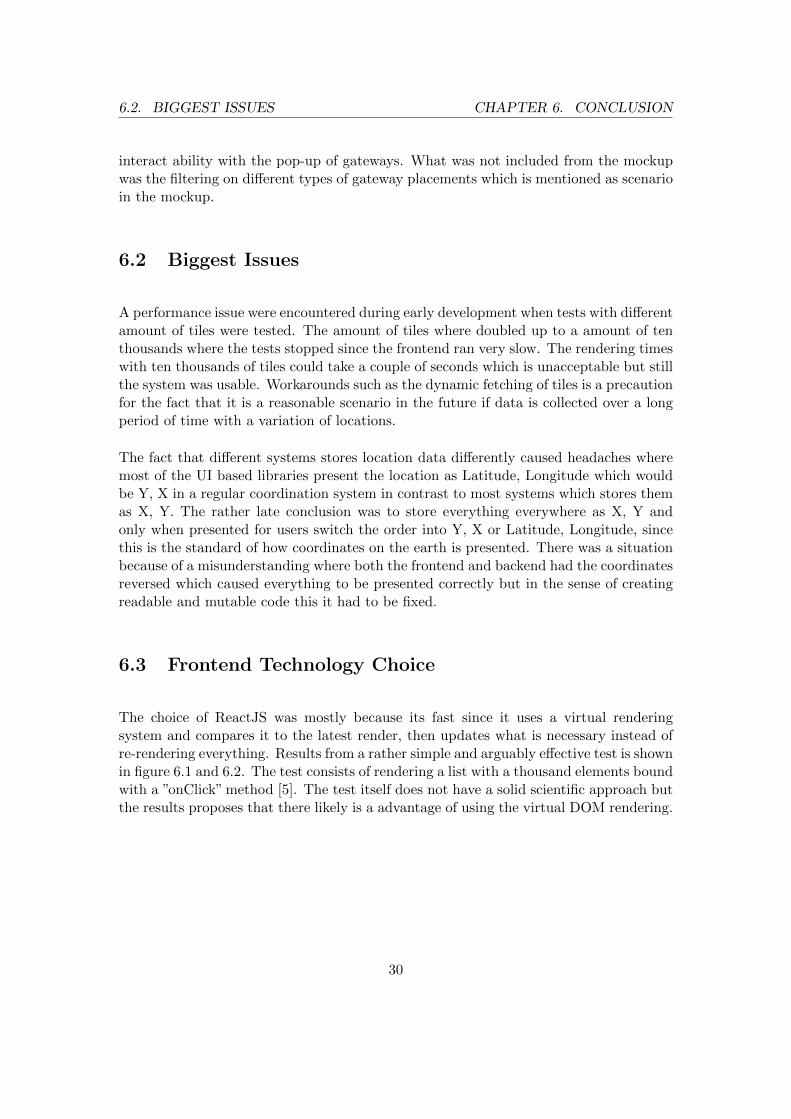
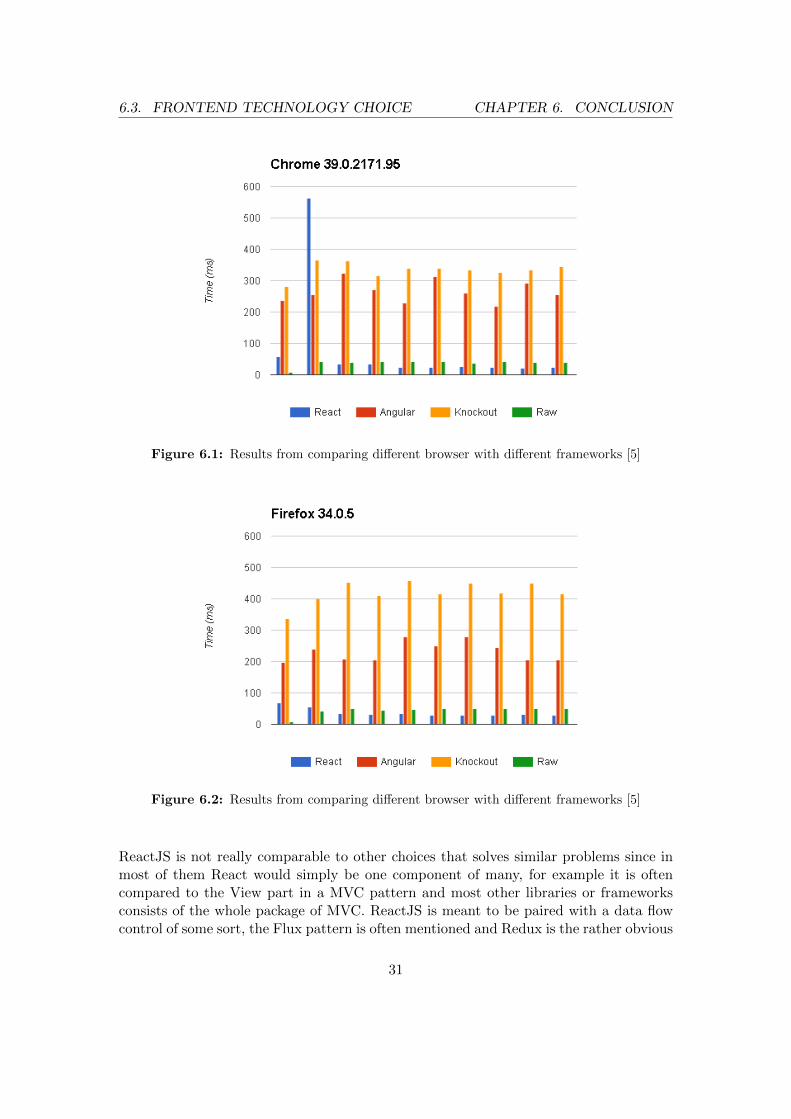
The choice of ReactJS was mostly because its fast since it uses a virtual renderingsystem and compares it to the latest render, then updates what is necessary instead ofre-rendering everything. Results from a rather simple and arguably effective test is shownin figure 6.1 and 6.2. The test consists of rendering a list with a thousand elements boundwith a ”onClick” method [5]. The test itself does not have a solid scientific approach butthe results proposes that there likely is a advantage of using the virtual DOM rendering.
30
6.3. FRONTEND TECHNOLOGY CHOICE CHAPTER 6. CONCLUSION
Figure 6.1: Results from comparing different browser with different frameworks [5]
Figure 6.2: Results from comparing different browser with different frameworks [5]
ReactJS is not really comparable to other choices that solves similar problems since inmost of them React would simply be one component of many, for example it is oftencompared to the View part in a MVC pattern and most other libraries or frameworksconsists of the whole package of MVC. ReactJS is meant to be paired with a data flowcontrol of some sort, the Flux pattern is often mentioned and Redux is the rather obvious
31
6.4. MAP SOLUTION CHAPTER 6. CONCLUSION
choice for this since it is designed primarily for ReactJS but not limited to it. The choicewas to skip Redux and this is probably one of the bigger mistakes in the project. Thedata flow in the final project turned out to be rather complex and hard to keep track of.The app component was what held most of the states and fills a similar function as aset of stores would do in a Redux implementation, but it also full filled the role of beingthe root node where both requires logic. This caused the fact that the app component ishuge and an inclusion of Redux would solve this by lifting out the states and data flow,similar to what is shown in figure 2.3.
During implementation of the later features the conclusion was made that a rewrite withReact-Redux would likely solve issues on further scaling the frontend with new featuresmore consistent. The callback functions started getting larger and the data flow betweencomponents was more complex. A rewrite in combination with Redux is likely to solvethese issues but a prediction of new problems that might occur is a rather obnoxious taskbut the existence of new complications is almost certain. Redux would solve some ofthese issues by extracting the logic out of the ReactJS, handling the data flow and logicwith reducers, actions and stores. The decision in this project was to skip it since theresearch time would be to demanding and the skill curve of using the library seemed tobe rather steep in comparison to just running with the ReactJS. Looking at this decisionpost project it is certainly hard to argue if it was right or wrong since the fact that theproject still had a good outcome. When considering the knowledge loss from skippingRedux it might be a loss on a long term goal from the members perspective but it islikely that an inclusion would not have affected the final products sum of functionalitya whole lot.
6.4 Map Solution
There is a whole lot of map services and libraries that is feasible in a project like this,the choice made was mostly based upon free to use and open source licenses. Leaflet wasa great candidate and chosen because of its simplicity and the fact that it is lightweight[6]. Competitors to the choice of leaflet were Google maps, Open layers and MapBox.All of these would all be viable choices but since Google maps and MapBox had costswhen reaching high amounts of usage they were discarded as options [7][8]. Open layersseems to be the more advanced library and probably would be more suitable for acomplex frontend, in this case the functionality of the frontend did not have excessiverequirements, partly because it is a prototype but also since the interaction with the userwas defined as rather limited. The combination of this and the fact that similartech.comkeeps track on the usage of these libraries and presented statistics on leaflet being thesuperior choice for more solutions[9].
32
6.5. COMPATIBILITY CHAPTER 6. CONCLUSION
6.5 Compatibility
There is multiple different web browsers and during the development Google Chromewas the only browser used. When the project was wrapping up a simple compatibilitytest was done and the conclusion was made that most standard browsers could run thesite except for Internet Explorer which is reasonable since it is no longer supported byMicrosoft [10]. The tested web browsers is Google Chrome, Firefox, Safari, InternetExplorer, Edge and Opera.
6.6 Heatmap Rendering
The heat map rendering was solved through translating the given bounds for each tileto an entity which is then added to the map Document Object Model (DOM). Everytile would therefore produce one entity, which leaflet would need to keep reference toand redraw when the map moves and a tile appears within the viewing bounds. Asmentioned in the result there is a limit to the amount of tiles which both Leaflet andthe web browser can render before the FPS count becomes to low and the frontendappear sluggish. This problem is for the most part avoided through tiles only beingloaded for the currently visible area of the map, forcing the previously fetched tiles to bereleased from memory leading to them not being drawn. Request to the backend couldbe considered relatively cheap and as long as they are fast enough will not be noticed bythe end user. Such a logic will work as long as there are not too many tiles in a specificarea, which could be the case further down the road when large amounts of data hasbeen collected covering an area. This is expected to happen at a certain point and wasconsidered but beyond the scope of the project.
6.7 Sustainability
The application itself has little to none impact on the environment. However, it couldhelp the technicians to reduce the amount of traveling that is required since it collectsand presents the data that otherwise would be obtained from local location. Consideringan ethical approach these devices could in fact report personal data which means thatsecurity in the sense of encryption and access limitations should be implemented.
33
7
Continuation
This chapter will cover possible new features and improvements of existing ones for theapplication. It covers some optimization methods that could be used when the dataset gets substantially bigger which currently would slow down the application. Thefeatures discussed are considered out of the scope, or additional features which could beimplemented if time allowed for it.
7.1 Tile Optimization
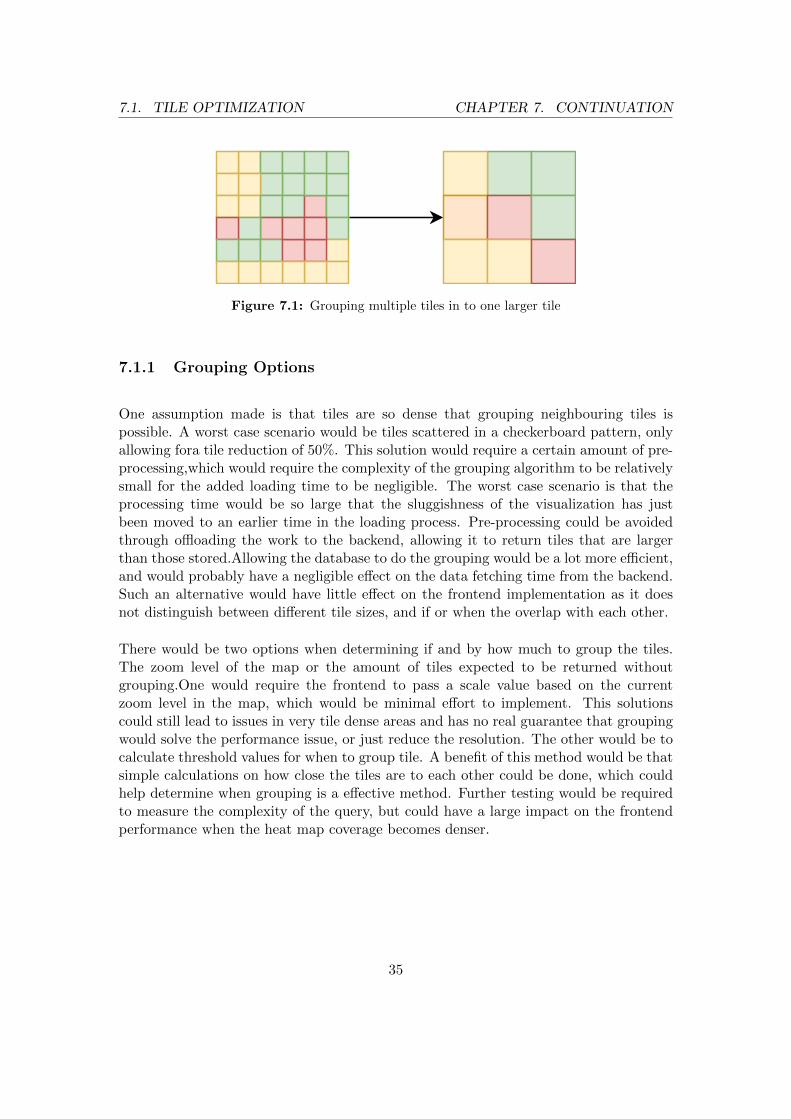
There are a couple of possible solutions to this inevitable issue, due to the fact thatthere is a threshold for the amount of simultaneous tiles being displayed. One verysimple solution would be to cluster tiles together into groups of 4 or 8, and averagingthe values across the cluster. It would reduce the resolution of the heat map, but wouldgreatly improve performance as it would reduce the amount of tile by a factor of 4 or8. An example of this process is shown in 7.1. On the other hand lower resolution isbeneficial when zoomed out, as it would be impossible to see color information whentiles become very small.
34
7.1. TILE OPTIMIZATION CHAPTER 7. CONTINUATION
Figure 7.1: Grouping multiple tiles in to one larger tile
7.1.1 Grouping Options
One assumption made is that tiles are so dense that grouping neighbouring tiles ispossible. A worst case scenario would be tiles scattered in a checkerboard pattern, onlyallowing fora tile reduction of 50%. This solution would require a certain amount of pre-processing,which would require the complexity of the grouping algorithm to be relativelysmall for the added loading time to be negligible. The worst case scenario is that theprocessing time would be so large that the sluggishness of the visualization has justbeen moved to an earlier time in the loading process. Pre-processing could be avoidedthrough offloading the work to the backend, allowing it to return tiles that are largerthan those stored.Allowing the database to do the grouping would be a lot more efficient,and would probably have a negligible effect on the data fetching time from the backend.Such an alternative would have little effect on the frontend implementation as it doesnot distinguish between different tile sizes, and if or when the overlap with each other.
There would be two options when determining if and by how much to group the tiles.The zoom level of the map or the amount of tiles expected to be returned withoutgrouping.One would require the frontend to pass a scale value based on the currentzoom level in the map, which would be minimal effort to implement. This solutionscould still lead to issues in very tile dense areas and has no real guarantee that groupingwould solve the performance issue, or just reduce the resolution. The other would be tocalculate threshold values for when to group tile. A benefit of this method would be thatsimple calculations on how close the tiles are to each other could be done, which couldhelp determine when grouping is a effective method. Further testing would be requiredto measure the complexity of the query, but could have a large impact on the frontendperformance when the heat map coverage becomes denser.
35
7.2. SQL FLAVOUR CHAPTER 7. CONTINUATION
7.1.2 Tile Server
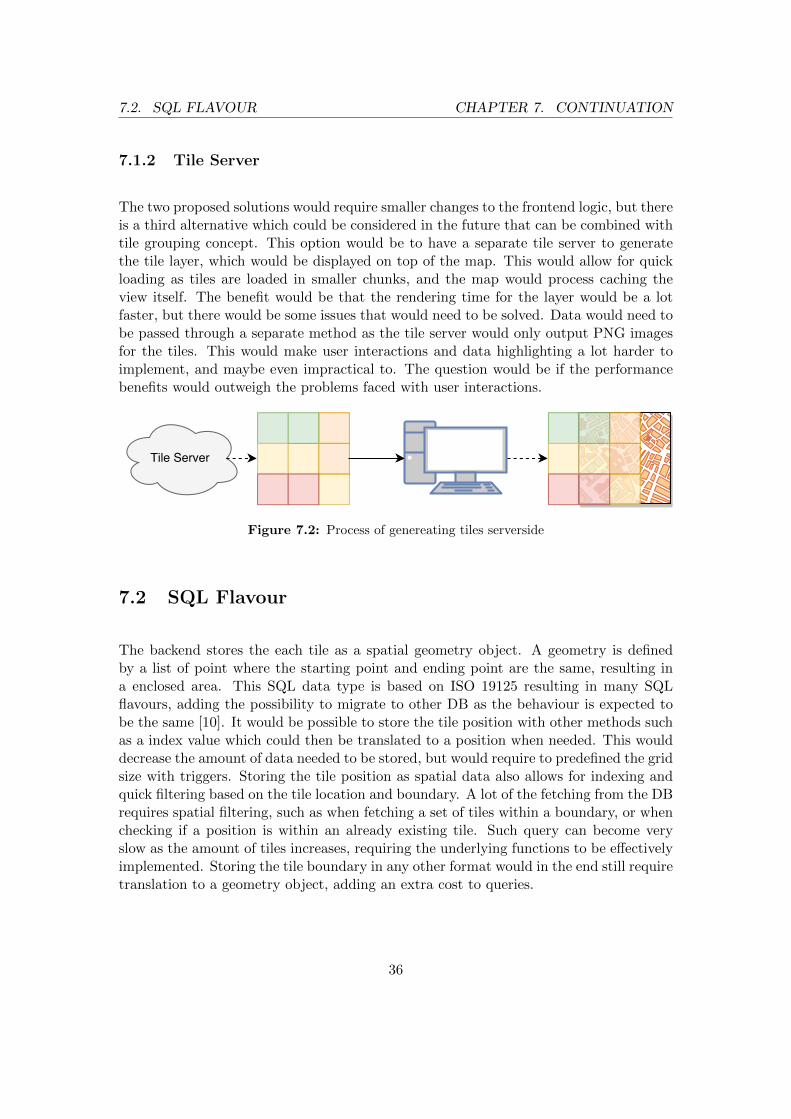
The two proposed solutions would require smaller changes to the frontend logic, but thereis a third alternative which could be considered in the future that can be combined withtile grouping concept. This option would be to have a separate tile server to generatethe tile layer, which would be displayed on top of the map. This would allow for quickloading as tiles are loaded in smaller chunks, and the map would process caching theview itself. The benefit would be that the rendering time for the layer would be a lotfaster, but there would be some issues that would need to be solved. Data would need tobe passed through a separate method as the tile server would only output PNG imagesfor the tiles. This would make user interactions and data highlighting a lot harder toimplement, and maybe even impractical to. The question would be if the performancebenefits would outweigh the problems faced with user interactions.
Figure 7.2: Process of genereating tiles serverside
7.2 SQL Flavour
The backend stores the each tile as a spatial geometry object. A geometry is definedby a list of point where the starting point and ending point are the same, resulting ina enclosed area. This SQL data type is based on ISO 19125 resulting in many SQLflavours, adding the possibility to migrate to other DB as the behaviour is expected tobe the same [10]. It would be possible to store the tile position with other methods suchas a index value which could then be translated to a position when needed. This woulddecrease the amount of data needed to be stored, but would require to predefined the gridsize with triggers. Storing the tile position as spatial data also allows for indexing andquick filtering based on the tile location and boundary. A lot of the fetching from the DBrequires spatial filtering, such as when fetching a set of tiles within a boundary, or whenchecking if a position is within an already existing tile. Such query can become veryslow as the amount of tiles increases, requiring the underlying functions to be effectivelyimplemented. Storing the tile boundary in any other format would in the end still requiretranslation to a geometry object, adding an extra cost to queries.
36
7.3. ADDITIONAL FEATURES CHAPTER 7. CONTINUATION
7.3 Additional Features
7.3.1 Filtering Options
Filtering of time frames would certainly be a feature which would bring value to thefrontend, although this was not implemented it was considered at an early stage butconcluded to require a substantial amount of work and therefore was not prioritized.The frontend would be required to accept user input and request data accordingly fromthe backend where new paths and queries would require implementation.
Each gateway has a setting property denoting the how it is placed. This could be indoor,outdoor or in a tower. The setting has an effect on the messages being picked up, asa gateway placed high up will pick up messages very far away, but record a low RSSI.The setting property is not used when filtering data, but could be to better visualize thecoverage. As it may be an indicator to why signal coverage is poor close to a gateway,due to its setting.
7.3.2 New Devices
The final product is designed for the GPS trackers but a few modifications should enablenew devices to be displayed. For devices that does not send their location in messagesa separate meta data table or database would have to be established. This howeverrequires the devices to be static and not moved which requires continuous maintenanceof the database if devices actually moves frequently. One possibility to solve this isto triangulate the positions based upon different gateways receiving the same message,this however requires that there is overlapping gateway coverage of at least three andpreferably more.
7.3.3 Alternative Applications
The developed system is suited for once special case but minor adjustments could bedone to change the nature of the platform substantially, it could be used for anythingthat has some sort of value and a position that needs a visual representation. Oneexample would be when orienteering competitions are held where you might want tobe able to track the competitors which this system should be competent of with someslight modifications such as not saving data and just visualizing the latest position ofeach device on the map. This could be done by skipping the database entirely and letthe MQTT client send the data straight to the frontend, the grid system probably is a
37
7.3. ADDITIONAL FEATURES CHAPTER 7. CONTINUATION
waste in this case and since its defined in the database and the frontend simply displaysthe data it should be a quick fix. It is likely that new trackers would have to be designedfor this since the time resolution is rather small with thirty seconds interval of messages.
7.3.4 Machine Learning
A implementation of machine learning on collected data could help analyze and predictnew positions of gateways or where devices is likely to fail transmissions, however, it isreasonable to assume that the implementation of this would give little value comparedto the cost of development.
7.3.5 Big Data
The initial plan was to have a project around the Big Data concept, however, TalkPoolrather wanted a prototype of a tool to ease the maintaining of their networks. Big dataanalysis is probably applicable on a production version and is somewhat prepared sinceall messages are stored raw in a special storage, where the reason for this storage wasexactly to collect all data for a big data analysis. A big data analysis would likely beable to add value to the product but would require thorough knowledge of the LoRanetwork which is beyond the scope of this project.
38
References
[1] Facebook, A JavaScript library for building user interfaces | React (2017).URL https://facebook.github.io/react/
[2] H. Butler, M. Daly, A. Doyle, S. Gillies, S. Hagen, T. Schaub, RFC7946 (2016).URL https://tools.ietf.org/html/rfc7946
[3] Roger Godinho and Stephen Bigelow, What is data center? - Definition fromWhatIs.com (2014).URL http://searchcloudcomputing.techtarget.com/definition/big-data-
Big-Datahttp://searchdatacenter.techtarget.com/definition/data-
center
[4] T. Fredrich, Intro to REST (aka. What Is REST Anyway?) - YouTube.URL https://www.youtube.com/watch?v=llpr5924N7E
[5] C. Harrington, React vs AngularJS vs KnockoutJS: a Performance Comparison |Codementor.URL https://www.codementor.io/reactjs/tutorial/reactjs-vs-angular-
js-performance-comparison-knockout
[6] Leaflet, Leaflet - a JavaScript library for interactive maps (2016).URL http://leafletjs.com/index.htmlhttp://leafletjs.com/
[7] Google Inc., Google Maps JavaScript API V3 – Referenz - Google Maps API —Google Developers.URL https://developers.google.com/maps/documentation/javascript/
usage#standard-usage-limitshttps://developers.google.com/maps/
documentation/javascript/reference?hl=de
[8] MapBox, Pricing | Mapbox.URL https://www.mapbox.com/pricing/
39

CHAPTER 7. CONTINUATION
[9] SimilarTech, Leaflet VS OpenLayers - Mapping Technologies Market Share Com-parison (2017).URL https://www.similartech.com/compare/leaflet-vs-openlayers
[10] Microsoft, Internet Explorer End of Support (2016).URL https://www.microsoft.com/en-us/windowsforbusiness/end-of-ie-
support
40