lord howe island renewable energy · pdf file · 2016-09-16lord howe island...
TRANSCRIPT
Lord Howe Island Renewable Energy Project
LORD HOWE ISLAND BOARD
Wind turbine generator noise impact assessment
15009-RP-NV-2-3
15 SEPTEMBER 2016
i
Lord Howe Island Renewable Energy Project
Project no: 15009
Document title: Wind Turbine Generator noise impact statement
Document no: 15009-RP-NV-2-3
Revision: 3
Date: 15 September 2016
Client name: Jacobs
Author: John Hutchison Qualifications: M.Eng.Env.Sc, Grad. Dip. Occ. Hyg.. MAAS
File name: I:\PROJECTS\15009 - LHIB\Deliverables\LHIB\15009-RP-NV-2-3 LHI WTG NIA.docx
Hutchison Weller Pty Ltd
ABN 34 603 174 518
102 / 1 Gurrigal Street
Mosman NSW 2088
T: 02 9969 8249
www.hutchisonweller.com
Document history and status
Revision Date Description By Review Approved
0 2/5/2016 Draft report for review J Hutchison S Hughes 2/5/2016
1 5/5/2016 Amended following client review J Hutchison J Hutchison 5/5/2016
2 9/9/2016 Amended following peer review J Hutchison J Hutchison 9/9/2016
3 15/9/2016 Amended at client request J Hutchison J Hutchison 15/9/2016
ii
Contents
Definition of terms ....................................................................................................................................... iii
Executive Summary ...................................................................................................................................... v
1. Introduction ....................................................................................................................................... 1
1.1 Background ........................................................................................................................................................................... 1
2. Proposed WTG location and operational parameters .................................................................. 2
2.1 Site description ..................................................................................................................................................................... 2
2.2 Operating specifications........................................................................................................................................................ 3
2.3 Sound power levels............................................................................................................................................................... 4
3. Noise assessment guidelines ......................................................................................................... 6
3.1 WTG noise sources .............................................................................................................................................................. 6
3.2 Wind farm noise guidelines ................................................................................................................................................... 6
4. Existing environment ....................................................................................................................... 7
4.1 Relevant receivers ................................................................................................................................................................ 7
4.2 Existing acoustic environment .............................................................................................................................................. 7
4.3 Seasonal prevailing wind and ambient noise sources .......................................................................................................... 9
5. Background noise and wind speed monitoring .......................................................................... 10
5.1 Methodology ....................................................................................................................................................................... 10
5.2 Monitoring results................................................................................................................................................................ 11
5.3 Noise assessment criteria ................................................................................................................................................... 14
6. Noise prediction ............................................................................................................................. 15
6.1 Noise model selection and development ............................................................................................................................ 15
6.2 Predicted results ................................................................................................................................................................. 16
6.3 Low frequency, infrasound and tonal characteristics .......................................................................................................... 18
7. Contingency strategy ..................................................................................................................... 22
Appendix A. WTG supplier sound power data ........................................................................................ 23
Appendix B. Relevant receivers ................................................................................................................ 24
Appendix C. Seasonal wind roses, Lord Howe Airport .......................................................................... 30
Appendix D. Photographs of background noise monitoring locations ................................................ 31
Appendix E. Operator attended monitoring observations ..................................................................... 32
Appendix F. Background noise and wind data analysis (all hours) ...................................................... 34
Appendix G. Derived noise criteria and predicted noise levels (all hours) .......................................... 42
Appendix H. Analysis of day and night data............................................................................................ 51
Appendix I. Noise predictions at all relevant receivers .......................................................................... 70
iii
Definition of terms
Assessment
period
The period in a day over which assessments are made. In this case:
day (0700 to 2200 h),
night (2200 to 0700 h).
Background
noise
The underlying level of noise present in the ambient noise, excluding the noise source under investigation, when
extraneous noise is removed. This is described using the LA90 descriptor.
Decibel (dB) A measure of sound equivalent to 20 times the logarithm (to base 10) of the ratio of a given sound pressure to a
reference pressure, and 10 times the logarithm (to base 10) of the ratio of a given sound power to a reference power.
dB(A) Unit used to measure ‘A-weighted’ sound pressure levels. A-weighting is an adjustment made to sound-level
measurement to approximate the response of the human ear.
dB(C) Unit used to measure ‘C-weighted’ sound pressure levels, an adjustment made to sound level to approximate low
frequency noise between 10 Hz and 200 Hz.
dB(G) Unit used to measure ‘G-weighted’ sound pressure levels, an adjustment made to sound levels to approximate human
perception to infrasound, a subset of low frequency noise between 1 Hz and 20 Hz.
Extraneous
noise
Noise resulting from activities that are not typical of the area such as construction, and traffic generated by holiday
periods or special events such as concerts or sporting events. Normal daily traffic is not considered to be extraneous.
Hub height The hub height is the distance from the turbine platform to the rotor of a wind turbine and indicates how high the turbine
stands above the ground, not including the length of the turbine blades.
Infrasound Any sound whose frequency is below the range of normal human hearing (less than approximately 20 Hz).
Intrusive noise Refers to noise that intrudes above the background level by more than 5 dB(A).
Low frequency
noise
A noise with perceptible and definite content in the audible frequency range below 250 Hz.
Masking Auditory masking occurs when the perception of one sound is affected by the presence of another sound
Noise
assessment
criteria
A standard rule or test by which the acceptability of the nature and characteristics of noise may be judged or evaluated.
Criteria are generally based on guidelines or standards developed by Government agencies (eg EPA) to protect the
majority of people for the majority of the time from adverse impacts.
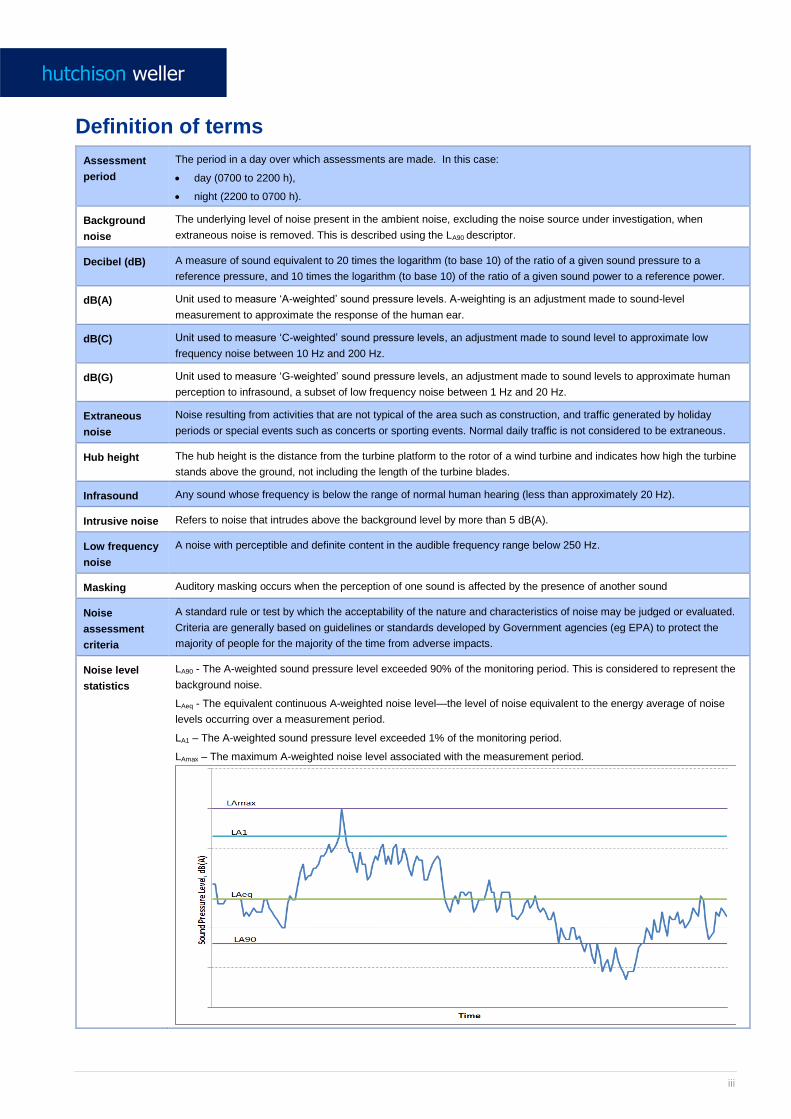
Noise level
statistics
LA90 - The A-weighted sound pressure level exceeded 90% of the monitoring period. This is considered to represent the
background noise.
LAeq - The equivalent continuous A-weighted noise level—the level of noise equivalent to the energy average of noise
levels occurring over a measurement period.
LA1 – The A-weighted sound pressure level exceeded 1% of the monitoring period.
LAmax – The maximum A-weighted noise level associated with the measurement period.
iv
Predicted
noise level
The LAeq wind farm noise level at a receiver predicted in accordance with AS4959
Receiver Premises that may be affected by the noise source, other than premises on the same land as the noise source
Receiver
catchment
A defined area in which all receivers are considered to experience similar levels of background noise and for which a
single receiver would be representative of all
Sound Power
Level (SWL)
The A-weighted sound power level is a logarithmic ratio of the acoustic power output of a source relative to 10-12 watts
and expressed in decibels. Sound power level is calculated from measured sound pressure levels and represents the
level of total sound power radiated by a sound source.
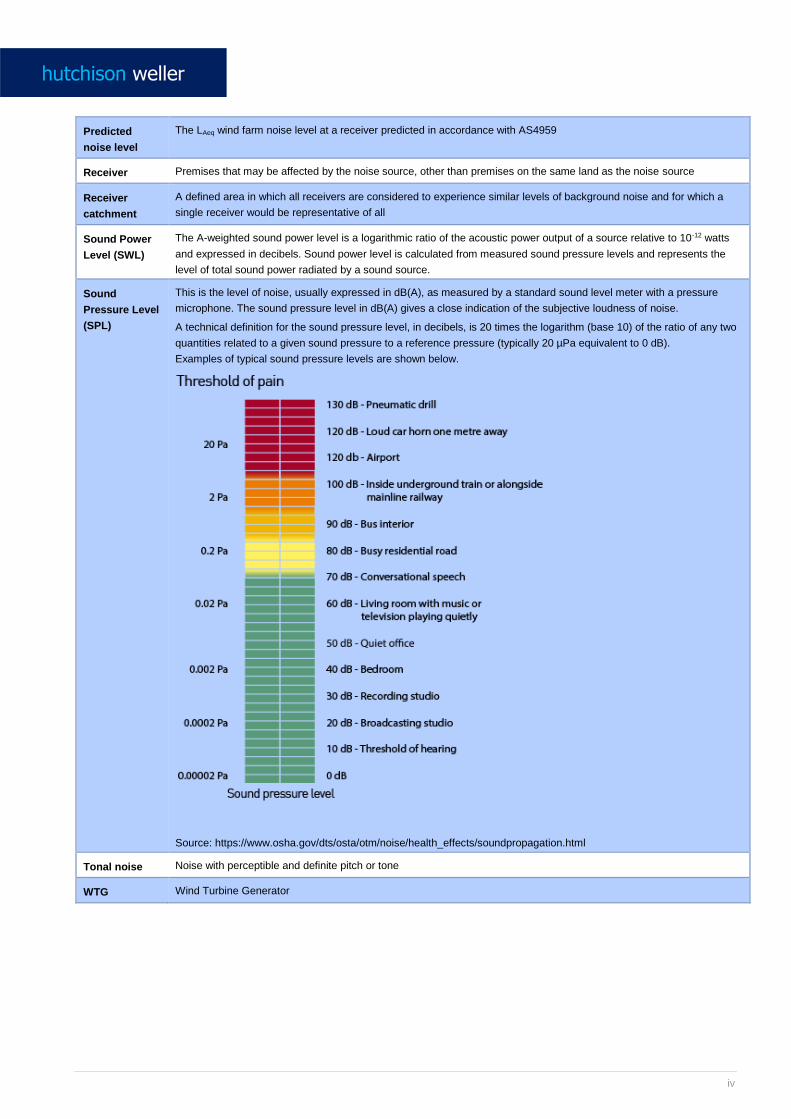
Sound
Pressure Level
(SPL)
This is the level of noise, usually expressed in dB(A), as measured by a standard sound level meter with a pressure
microphone. The sound pressure level in dB(A) gives a close indication of the subjective loudness of noise.
A technical definition for the sound pressure level, in decibels, is 20 times the logarithm (base 10) of the ratio of any two
quantities related to a given sound pressure to a reference pressure (typically 20 µPa equivalent to 0 dB).
Examples of typical sound pressure levels are shown below.
Source: https://www.osha.gov/dts/osta/otm/noise/health_effects/soundpropagation.html
Tonal noise Noise with perceptible and definite pitch or tone
WTG Wind Turbine Generator
v
Executive Summary
A hybrid renewable energy system is proposed on Lord Howe Island to reduce its reliance on imported diesel for electricity generation. Hutchison Weller was engaged by the Lord Howe Island Board (the Board) to measure background noise levels and complete an assessment of wind turbine generator (WTG) noise impacts on the Lord Howe Island community.
Two WTGs are proposed to be installed in a cleared section near Transit Hill, at a relative height of approximately 60 - 70 m above sea level. The WTG site overlooks the Pinetrees Lodge to the east, and closest to residences to the north.
Three models of WTG have been assessed in this report:
Vergnet MP-C LNn Vergnet MP-C (non-acoustically treated) XANT M21
This report supersedes previous assessments undertaken for the Renewable Energy Project including Jacobs (2015) Wind Turbine Generator Noise Impact Assessment Revision 2, April 2015 and Hutchison Weller (2105) Winter background noise monitoring, February 2016.
For the purpose of this assessment, the Island was divided into four receiver catchments, accommodating all relevant receivers. Background noise levels were measured at a single location within each receiver catchment concurrently with wind speed and direction over a period of approximately four weeks in January and February 2015. Due to seasonal prevailing wind and insect influences, supplementary monitoring was completed in August 2015.
Measured data were used to establish the correlation between the LA90 10 minute background noise level and wind speed on the island over a 24-hour period.
Based on this correlation, which is influenced by wind in the trees, ocean and insect noise (in the summer), noise assessment criteria were derived for each relevant receiver at 1 m/s wind speed intervals over the range at which the WTGs cut in (4 m/s) and reach rated power (12 m/s).
Noise levels from the proposed WTGs were predicted at relevant receivers using an acoustic model, Soundplan. Model results incorporated noise emission data provided by the equipment manufacturer as well as island topographical data and wind blowing from source to receiver (worst-case meteorological conditions).
Predicted noise levels for operation of the XANT M21 and the Vergnet MP-C LNn are summarised in Tables ES-1 and Table ES-2. Predictions indicate that, while these WTGs may be audible at some receiver locations, the most stringent criteria (for the night period) are not likely to be exceeded. Hence the risk of adverse impacts on the amenity of the island is low.
Predicted noise levels for operation of the non-acoustically treated Vergnet MP-C are also provided in this assessment for comparison with the low noise model.
Noise levels from the WTGs in the eastern coastal catchment are predicted to be higher than in other catchments due to their proximity to the WTG site. However, higher background noise levels should effectively mask WTG noise in this location and predicted noise levels would be below the assessment criteria.
Noise levels to the west of the WTG site are predicted to be closest to the assessment criteria, 4 dB(A) less than the criteria at wind speeds of 7 – 8 m/s at hub height.
Predicted noise levels in the more densely populated island centre, represented by receivers 95 and 101, are within the noise criteria for the night period and therefore this catchment is not expected to be affected by WTG noise. Similarly, predicted levels at southern receivers, are below the criteria.

vi
Table ES-1 Predicted LAeq, 10 minute noise levels for relevant receivers – XANT M21
Receiver catchment
Most affected
receivers Predicted noise level
Wind speed at hub-height, m/s
4 5 6 7 8 9 10 11 12
Eastern coastal
30, 31
Single WTG 33 33 33 35 37 39 40 40 40
Two WTGs 36 36 36 38 39 41 42 42 42
Criteria during summer 56 55 56 57 59 60 60 59 56
Criteria during winter 44 45 46 47 47 48 49 49 49
Central / Joy’s Shop
area 95, 101
Single WTG 29 29 29 29 31 33 33 34 34
Two WTGs 29 29 29 31 33 35 36 36 36
Criteria during summer 46 47 48 49 50 51 51 50 49
Criteria during winter 40 41 42 43 44 45 46 47 48
Western coastal
164, 165
Single WTG 31 31 31 31 33 35 35 36 36
Two WTGs 31 31 31 33 35 37 38 38 38
Criteria during summer 45 46 47 47 48 48 49 50 50
Criteria during winter 40 41 42 43 45 46 47 48 48
Southern 190-192
Single WTG 19 19 19 16 18 20 21 22 22
Two WTGs 19 19 19 21 23 24 25 26 26
Criteria during summer 47 47 48 49 50 52 53 54 54
Criteria during winter 41 42 43 44 45 47 48 49 50
Table ES-2 Predicted LAeq, 10 minute noise levels for relevant receivers – Low noise Vergnet MP-C LNn
Receiver catchment
Most affected receivers
Option Mode Wind speed at hub-height, m/s
4 5 7 8 9 11 12
Eastern coastal 30, 31
Single WTG LS 32 33 33 33 - - -
HS - - 41 41 41 42 43
Two WTGs LS 34 35 35 36 - - -
HS - - 43 43 44 44 45
Criteria during summer 56 55 57 59 60 59 56
Criteria during winter 44 45 47 47 48 49 49
Central / Joy’s Shop area
95, 101
Single WTG LS 26 27 27 27 - - -
HS - - 35 35 35 36 37
Two WTGs LS 28 29 30 30 - - -
HS - - 38 37 38 38 39
Criteria during summer 46 47 49 50 51 50 49
Criteria during winter 40 41 43 44 45 47 48
Western coastal
164, 165
Single WTG LS 28 29 29 29 - - -
HS - - 37 37 37 38 38
Two WTGs LS 30 31 31 32 - - -
HS - - 39 39 39 40 41
Criteria during summer 45 46 47 48 48 50 50
Criteria during winter 40 41 43 45 46 48 48
Southern 190-192
Single WTG LS 18 19 20 20 - - -
HS - - 27 27 27 28 29
Two WTGs LS 21 22 23 23 - - -
HS - - 30 30 30 31 32
Criteria during summer 47 47 49 50 52 54 54
Criteria during winter 41 42 44 45 47 49 50
Analysis of tonal, low frequency and infrasonic characteristics was undertaken based on manufacturer’s data and measured WTG noise at an existing facility with three Vergnet MP-C (non-acoustically treated) WTGs operating. No tonal or low frequency characteristics were identified. Investigation of infrasound from similar WTGs found that, while the WTGs did generate a small amount of noise in the infrasonic range between 4 Hz and 20 Hz, the contribution of the WTGs to ambient infrasound was negligible in comparison with infrasound generated by environmental sources such as wind and ocean waves. All measured infrasound was found to be less than the most stringent thresholds of human perception, meaning that infrasound was neither audible nor physiologically perceptible.
1
1. Introduction
1.1 Background
The Lord Howe Island Board (the Board) is developing a hybrid renewable energy system to reduce its reliance on imported diesel for electricity generation on Lord Howe Island, NSW. The proposed system would consist of a solar (photovoltaic) farm of 450 kW, two wind turbine generators (WTG) and battery storage.
Given the Island’s environmental and spatial constraints, options for WTG locations are limited and the potential for noise impacts on residents due to the proximity of the WTG siting is a concern to the Board, some residents and business owners.
Hutchison Weller has been engaged by the Board to assess the potential for noise generated by the proposed WTGs to result in adverse impacts on the community’s amenity. This report supersedes previous assessments undertaken for the Renewable Energy Project including Jacobs (2015) Wind Turbine Generator Noise Impact Assessment Revision 2, April 2015 and Hutchison Weller (2105) Winter background noise monitoring, February 2016.
This assessment consisted of background noise and meteorological monitoring, prediction of WTG noise on relevant receivers and recommendations for appropriate management.
This report details the methodologies and findings of the noise impact assessment, which form the scope of work, and includes:
description of the proposed WTG locations and identification of potentially affected receivers
description of the proposed WTG operational parameters;
background noise and meteorology monitoring;
applicable noise monitoring guidelines and assessment criteria;
predicted noise levels at relevant sensitive receivers with comparison against noise assessment goals;
modifications or operating strategy that may be necessary to address unforeseen non-compliances.
2
2. Proposed WTG location and operational parameters
2.1 Site description
Lord Howe Island is located around 600 km east of Port Macquarie in NSW, with a length of around 10 km and a width between 0.3 km and 2 km. The island’s topography is characterised by numerous hills, including Mt Eliza in the far north, Malabar Hill, Transit Hill near the airport, Intermediate Hill, and the two higher peaks, Mount Lidgbird and Mount Gower in the south.
The majority of the island’s population of around 390 residents and up to 400 tourists resides in the lower-lying northern part of the island, with the south consisting mostly of forested hills.
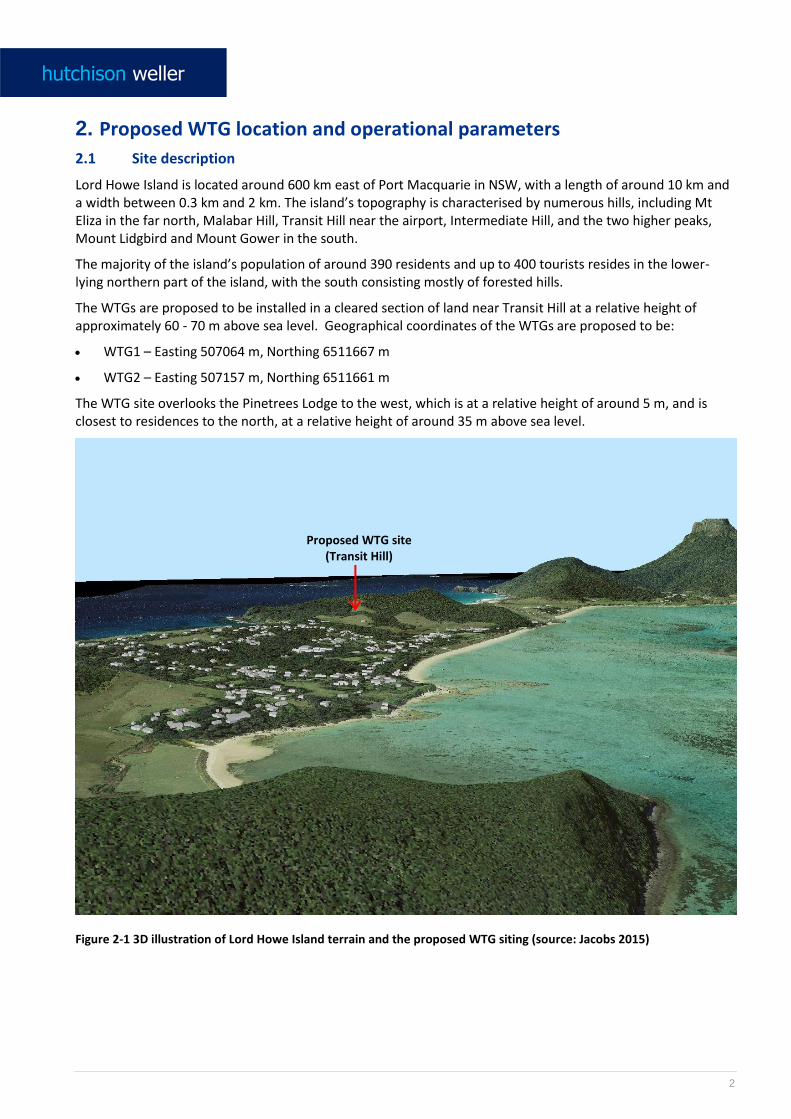
The WTGs are proposed to be installed in a cleared section of land near Transit Hill at a relative height of approximately 60 - 70 m above sea level. Geographical coordinates of the WTGs are proposed to be:
WTG1 – Easting 507064 m, Northing 6511667 m
WTG2 – Easting 507157 m, Northing 6511661 m
The WTG site overlooks the Pinetrees Lodge to the west, which is at a relative height of around 5 m, and is closest to residences to the north, at a relative height of around 35 m above sea level.
Figure 2-1 3D illustration of Lord Howe Island terrain and the proposed WTG siting (source: Jacobs 2015)
Proposed WTG site (Transit Hill)
3
2.2 Operating specifications
Two models of WTG under consideration use a downwind rotor and have been assessed in this study. Manufacturer specifications are listed in Table 2-1. These are:
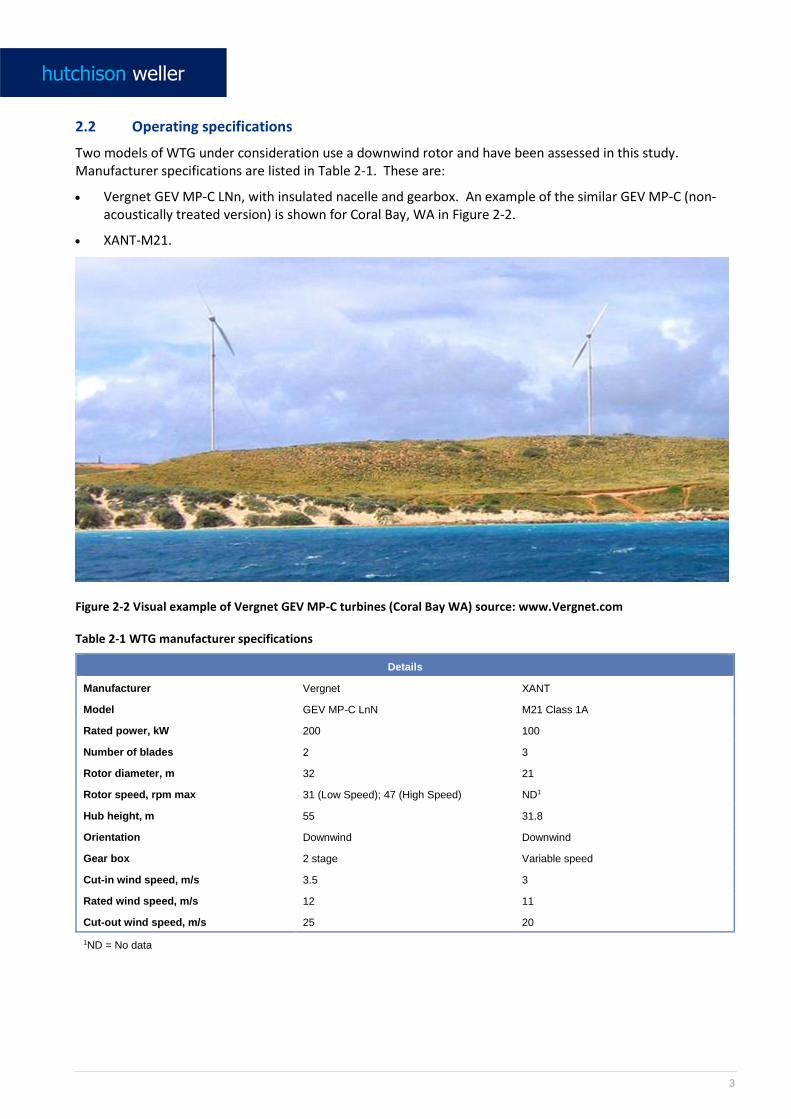
Vergnet GEV MP-C LNn, with insulated nacelle and gearbox. An example of the similar GEV MP-C (non-acoustically treated version) is shown for Coral Bay, WA in Figure 2-2.
XANT-M21.
Figure 2-2 Visual example of Vergnet GEV MP-C turbines (Coral Bay WA) source: www.Vergnet.com
Table 2-1 WTG manufacturer specifications
Details
Manufacturer Vergnet XANT
Model GEV MP-C LnN M21 Class 1A
Rated power, kW 200 100
Number of blades 2 3
Rotor diameter, m 32 21
Rotor speed, rpm max 31 (Low Speed); 47 (High Speed) ND1
Hub height, m 55 31.8
Orientation Downwind Downwind
Gear box 2 stage Variable speed
Cut-in wind speed, m/s 3.5 3
Rated wind speed, m/s 12 11
Cut-out wind speed, m/s 25 20
1ND = No data
4
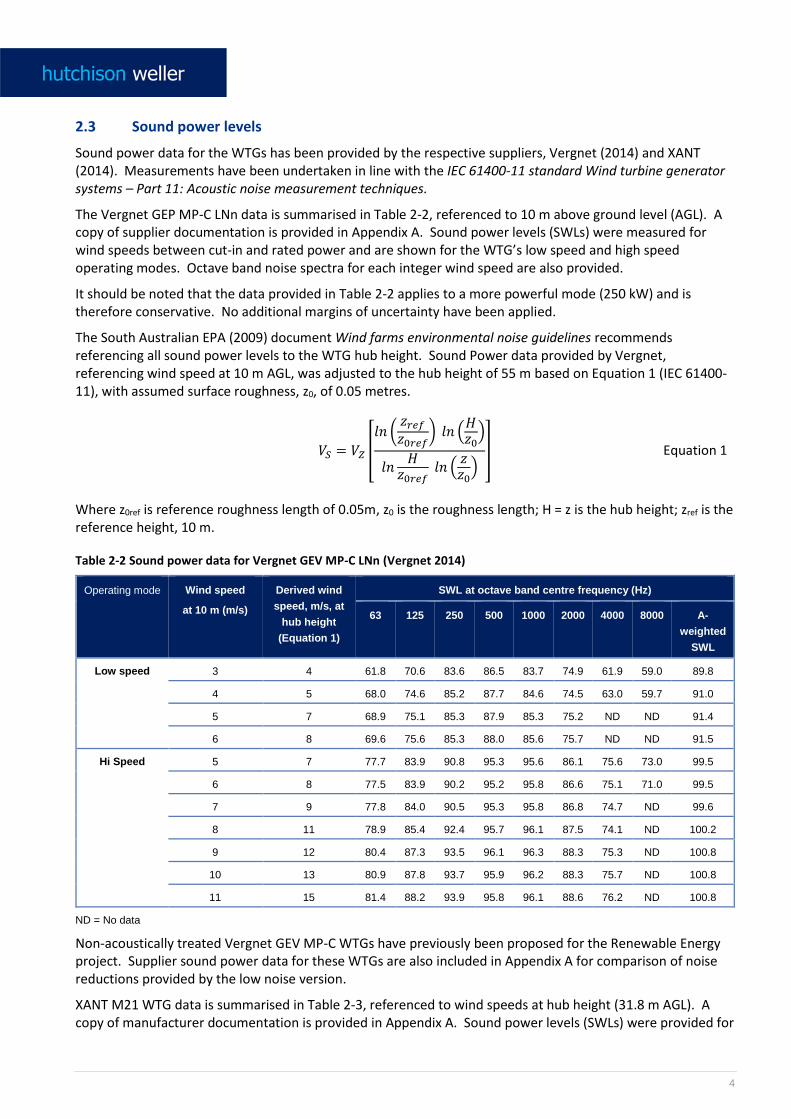
2.3 Sound power levels
Sound power data for the WTGs has been provided by the respective suppliers, Vergnet (2014) and XANT (2014). Measurements have been undertaken in line with the IEC 61400-11 standard Wind turbine generator systems – Part 11: Acoustic noise measurement techniques.
The Vergnet GEP MP-C LNn data is summarised in Table 2-2, referenced to 10 m above ground level (AGL). A copy of supplier documentation is provided in Appendix A. Sound power levels (SWLs) were measured for wind speeds between cut-in and rated power and are shown for the WTG’s low speed and high speed operating modes. Octave band noise spectra for each integer wind speed are also provided.
It should be noted that the data provided in Table 2-2 applies to a more powerful mode (250 kW) and is therefore conservative. No additional margins of uncertainty have been applied.
The South Australian EPA (2009) document Wind farms environmental noise guidelines recommends referencing all sound power levels to the WTG hub height. Sound Power data provided by Vergnet, referencing wind speed at 10 m AGL, was adjusted to the hub height of 55 m based on Equation 1 (IEC 61400-11), with assumed surface roughness, z0, of 0.05 metres.
𝑉𝑆 = 𝑉𝑍 [
𝑙𝑛 (𝑧𝑟𝑒𝑓
𝑧0𝑟𝑒𝑓) 𝑙𝑛 (
𝐻𝑧0
)
𝑙𝑛𝐻
𝑧0𝑟𝑒𝑓 𝑙𝑛 (
𝑧𝑧0
)] Equation 1
Where z0ref is reference roughness length of 0.05m, z0 is the roughness length; H = z is the hub height; zref is the reference height, 10 m.
Table 2-2 Sound power data for Vergnet GEV MP-C LNn (Vergnet 2014)
Operating mode Wind speed
at 10 m (m/s)
Derived wind
speed, m/s, at
hub height
(Equation 1)
SWL at octave band centre frequency (Hz)
63 125 250 500 1000 2000 4000 8000 A-
weighted
SWL
Low speed 3 4 61.8 70.6 83.6 86.5 83.7 74.9 61.9 59.0 89.8
4 5 68.0 74.6 85.2 87.7 84.6 74.5 63.0 59.7 91.0
5 7 68.9 75.1 85.3 87.9 85.3 75.2 ND ND 91.4
6 8 69.6 75.6 85.3 88.0 85.6 75.7 ND ND 91.5
Hi Speed 5 7 77.7 83.9 90.8 95.3 95.6 86.1 75.6 73.0 99.5
6 8 77.5 83.9 90.2 95.2 95.8 86.6 75.1 71.0 99.5
7 9 77.8 84.0 90.5 95.3 95.8 86.8 74.7 ND 99.6
8 11 78.9 85.4 92.4 95.7 96.1 87.5 74.1 ND 100.2
9 12 80.4 87.3 93.5 96.1 96.3 88.3 75.3 ND 100.8
10 13 80.9 87.8 93.7 95.9 96.2 88.3 75.7 ND 100.8
11 15 81.4 88.2 93.9 95.8 96.1 88.6 76.2 ND 100.8
ND = No data
Non-acoustically treated Vergnet GEV MP-C WTGs have previously been proposed for the Renewable Energy project. Supplier sound power data for these WTGs are also included in Appendix A for comparison of noise reductions provided by the low noise version.
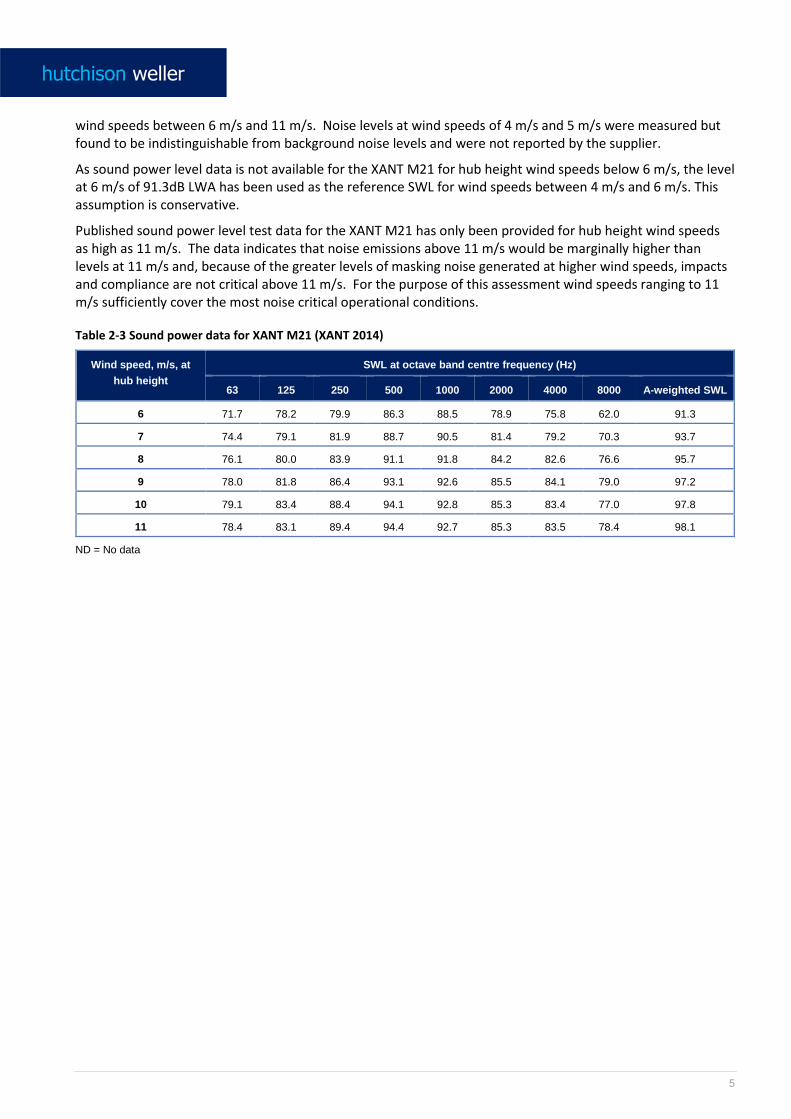
XANT M21 WTG data is summarised in Table 2-3, referenced to wind speeds at hub height (31.8 m AGL). A copy of manufacturer documentation is provided in Appendix A. Sound power levels (SWLs) were provided for
5
wind speeds between 6 m/s and 11 m/s. Noise levels at wind speeds of 4 m/s and 5 m/s were measured but found to be indistinguishable from background noise levels and were not reported by the supplier.
As sound power level data is not available for the XANT M21 for hub height wind speeds below 6 m/s, the level at 6 m/s of 91.3dB LWA has been used as the reference SWL for wind speeds between 4 m/s and 6 m/s. This assumption is conservative.
Published sound power level test data for the XANT M21 has only been provided for hub height wind speeds as high as 11 m/s. The data indicates that noise emissions above 11 m/s would be marginally higher than levels at 11 m/s and, because of the greater levels of masking noise generated at higher wind speeds, impacts and compliance are not critical above 11 m/s. For the purpose of this assessment wind speeds ranging to 11 m/s sufficiently cover the most noise critical operational conditions.
Table 2-3 Sound power data for XANT M21 (XANT 2014)
Wind speed, m/s, at
hub height
SWL at octave band centre frequency (Hz)
63 125 250 500 1000 2000 4000 8000 A-weighted SWL
6 71.7 78.2 79.9 86.3 88.5 78.9 75.8 62.0 91.3
7 74.4 79.1 81.9 88.7 90.5 81.4 79.2 70.3 93.7
8 76.1 80.0 83.9 91.1 91.8 84.2 82.6 76.6 95.7
9 78.0 81.8 86.4 93.1 92.6 85.5 84.1 79.0 97.2
10 79.1 83.4 88.4 94.1 92.8 85.3 83.4 77.0 97.8
11 78.4 83.1 89.4 94.4 92.7 85.3 83.5 78.4 98.1
ND = No data

6
3. Noise assessment guidelines
3.1 WTG noise sources
It is widely recognised that wind farms have a noise output that varies with wind speed and possesses unique noise generating characteristics that can be annoying to some people.
Traditionally, the major sources of noise on a WTG were the gearbox and the fast moving blades (aerodynamic noise). Gearboxes on modern WTGs are generally very quiet; leaving wind moving across the blade as the dominant noise source for most turbines.
Air moving across the blade produces acoustic waves at the trailing edge and tip, which are often perceived as a “swishing” or “thumping” sound. This noise can vary in intensity, called amplitude modulation (the difference between minimum and maximum noise levels).
Other historically annoying aspects of WTG noise include tonal and low frequency characteristics. Tonal noise, the emergence of discrete frequency bands in the broader spectrum, can be developed by vortices around the blade. These do not typically occur in larger (>10 kW) well designed and maintained wind turbines.
Low frequency noise is typically not a significant feature of modern wind turbine operation and is usually less than that of other environmental noise sources such as wind and the ocean.
3.2 Wind farm noise guidelines
The NSW Department of Planning and Infrastructure (DP&I) released the Draft NSW Planning Guidelines for Wind Farms (NSW Guideline) for consultation in December 2011, which are yet to be finalised. The NSW Guideline was developed with methodologies and practices closely following the South Australian EPA (2009) Wind farms environmental noise guidelines (SA Guideline). Considering the NSW guideline remains in draft form, noise assessment criteria presented by the SA EPA Guideline have been adopted in this report.
Noise assessment criteria have been developed to account for a characteristic of wind farms where noise levels from each WTG rise as the wind speed at the site increases. This increase is generally complemented by an equal or greater increase in the background noise level, which can substantially or completely mask WTG noise.
To protect the amenity of typically quiet, rural communities, and considering the wind speed at the subject
site, the predicted equivalent noise level (Leq, 10 minute), adjusted for any excessive levels of tonality, amplitude modulation or low frequency, should not exceed the greater of:
35 dB(A)
OR
The background (L90, 10 minute) noise level by more than 5 dB(A)
This goal applies at all relevant ‘rural-living’1 receivers not associated with the wind farm and for wind speeds from cut-in to rated power of the WTG and each integer wind speed in between.
The NSW Guideline recommends that criteria should be established on the basis of separate daytime (7am to 10pm) and night time (10pm to 7am) periods. Though this is not required under the SA Guidelines, criteria and impact assessments for the day and night periods are included in Appendix H.
1 Rural-living is a rural-residential ‘lifestyle’ area described by the SA Guideline as intended to have a relatively quiet amenity.
7
4. Existing environment
4.1 Relevant receivers
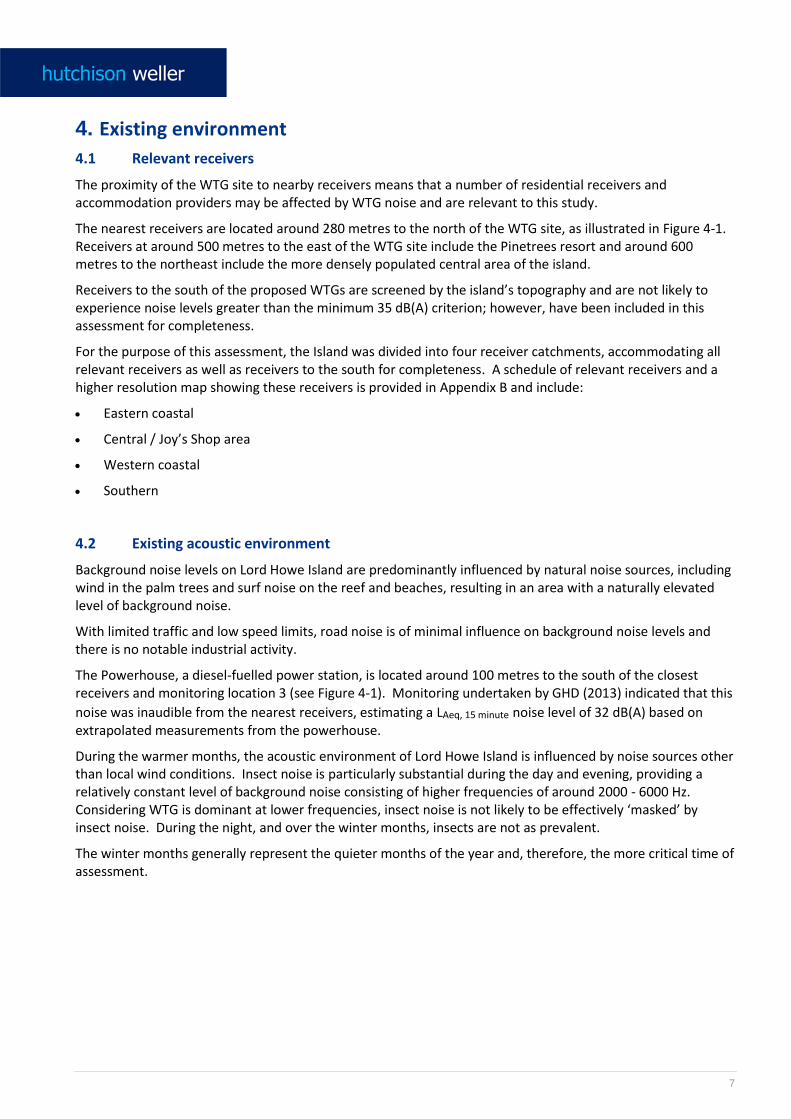
The proximity of the WTG site to nearby receivers means that a number of residential receivers and accommodation providers may be affected by WTG noise and are relevant to this study.
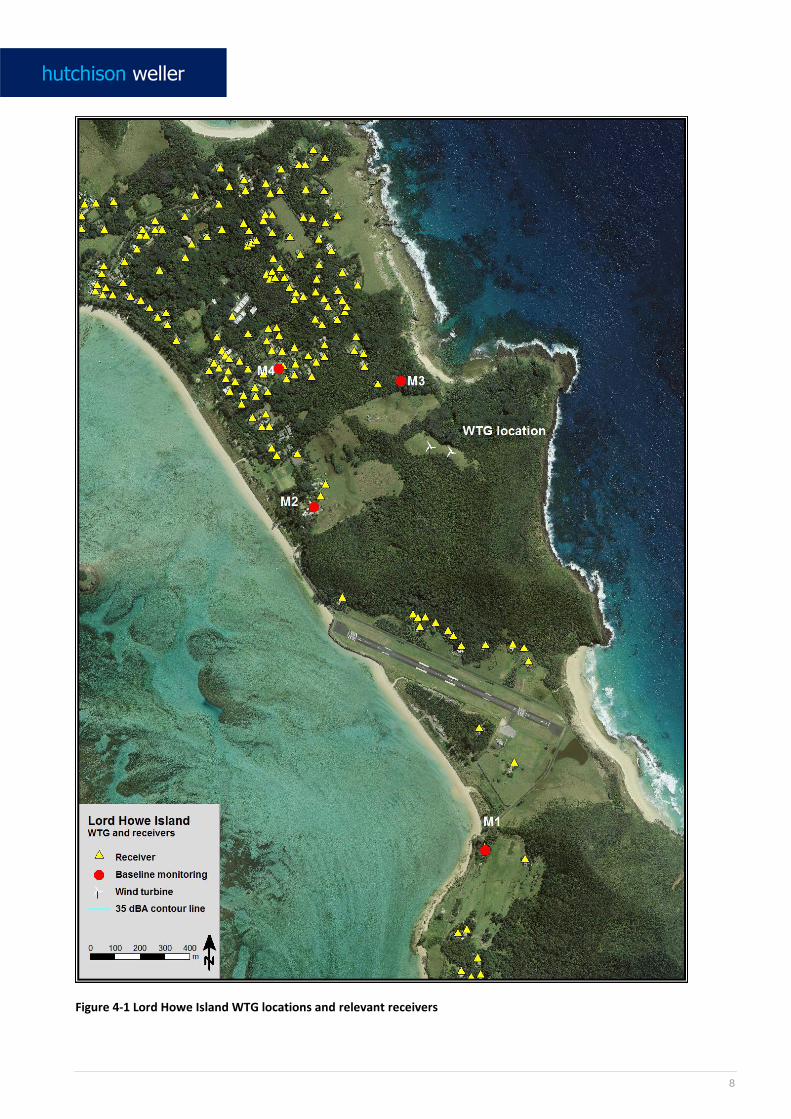
The nearest receivers are located around 280 metres to the north of the WTG site, as illustrated in Figure 4-1. Receivers at around 500 metres to the east of the WTG site include the Pinetrees resort and around 600 metres to the northeast include the more densely populated central area of the island.
Receivers to the south of the proposed WTGs are screened by the island’s topography and are not likely to experience noise levels greater than the minimum 35 dB(A) criterion; however, have been included in this assessment for completeness.
For the purpose of this assessment, the Island was divided into four receiver catchments, accommodating all relevant receivers as well as receivers to the south for completeness. A schedule of relevant receivers and a higher resolution map showing these receivers is provided in Appendix B and include:
Eastern coastal
Central / Joy’s Shop area
Western coastal
Southern
4.2 Existing acoustic environment
Background noise levels on Lord Howe Island are predominantly influenced by natural noise sources, including wind in the palm trees and surf noise on the reef and beaches, resulting in an area with a naturally elevated level of background noise.
With limited traffic and low speed limits, road noise is of minimal influence on background noise levels and there is no notable industrial activity.
The Powerhouse, a diesel-fuelled power station, is located around 100 metres to the south of the closest receivers and monitoring location 3 (see Figure 4-1). Monitoring undertaken by GHD (2013) indicated that this
noise was inaudible from the nearest receivers, estimating a LAeq, 15 minute noise level of 32 dB(A) based on extrapolated measurements from the powerhouse.
During the warmer months, the acoustic environment of Lord Howe Island is influenced by noise sources other than local wind conditions. Insect noise is particularly substantial during the day and evening, providing a relatively constant level of background noise consisting of higher frequencies of around 2000 - 6000 Hz. Considering WTG is dominant at lower frequencies, insect noise is not likely to be effectively ‘masked’ by insect noise. During the night, and over the winter months, insects are not as prevalent.
The winter months generally represent the quieter months of the year and, therefore, the more critical time of assessment.
8
Figure 4-1 Lord Howe Island WTG locations and relevant receivers
9
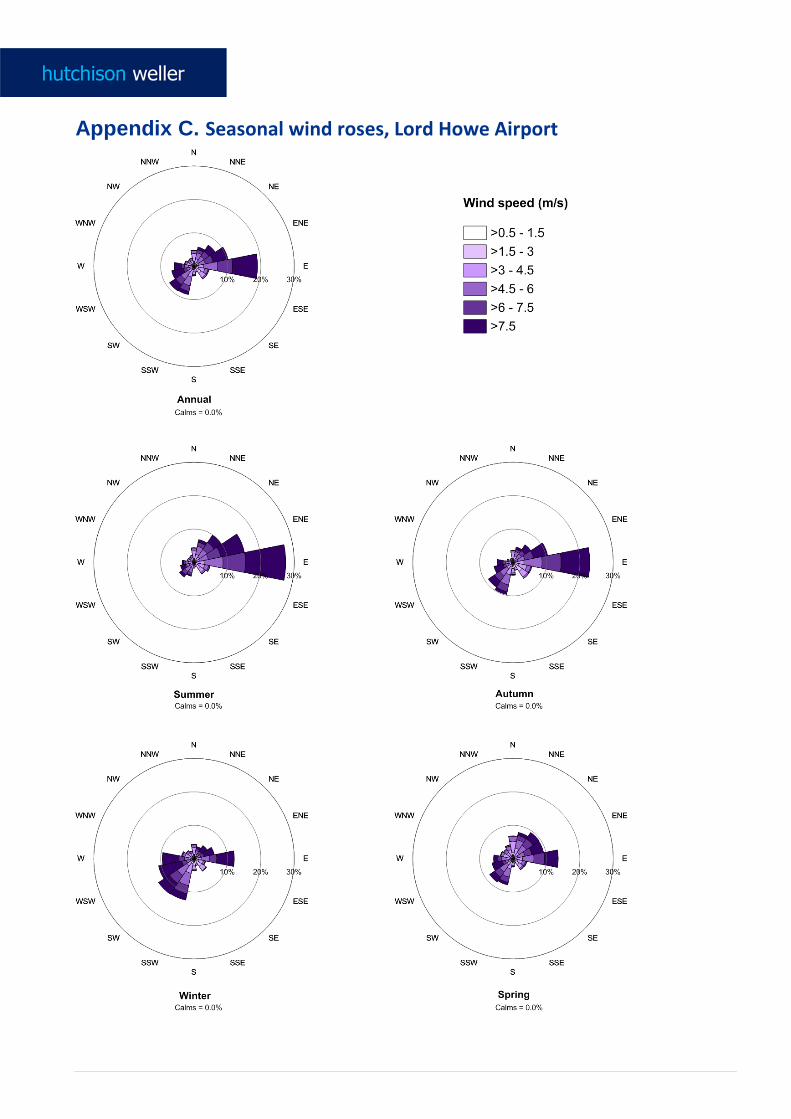
4.3 Seasonal prevailing wind and ambient noise sources
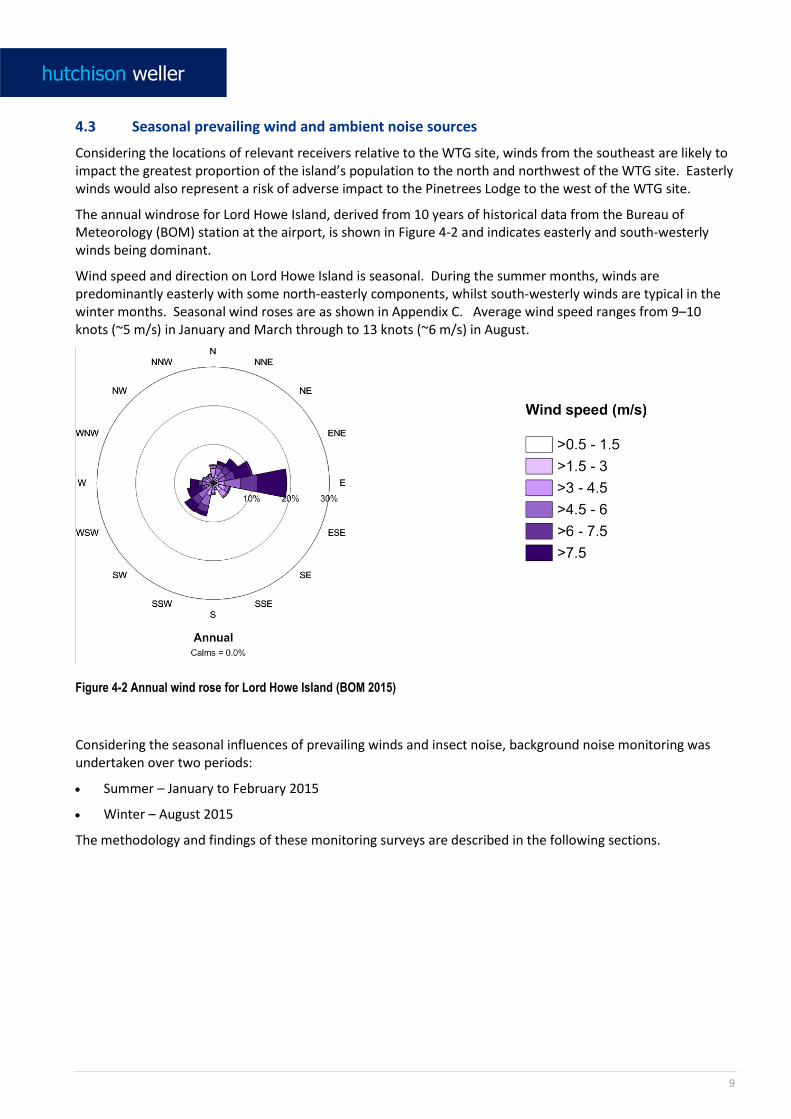
Considering the locations of relevant receivers relative to the WTG site, winds from the southeast are likely to impact the greatest proportion of the island’s population to the north and northwest of the WTG site. Easterly winds would also represent a risk of adverse impact to the Pinetrees Lodge to the west of the WTG site.
The annual windrose for Lord Howe Island, derived from 10 years of historical data from the Bureau of Meteorology (BOM) station at the airport, is shown in Figure 4-2 and indicates easterly and south-westerly winds being dominant.
Wind speed and direction on Lord Howe Island is seasonal. During the summer months, winds are predominantly easterly with some north-easterly components, whilst south-westerly winds are typical in the winter months. Seasonal wind roses are as shown in Appendix C. Average wind speed ranges from 9–10 knots (~5 m/s) in January and March through to 13 knots (~6 m/s) in August.
Figure 4-2 Annual wind rose for Lord Howe Island (BOM 2015)
Considering the seasonal influences of prevailing winds and insect noise, background noise monitoring was undertaken over two periods:
Summer – January to February 2015
Winter – August 2015
The methodology and findings of these monitoring surveys are described in the following sections.
10
5. Background noise and wind speed monitoring
5.1 Methodology
Background noise monitoring was undertaken over two survey periods representing the summer and winter months:
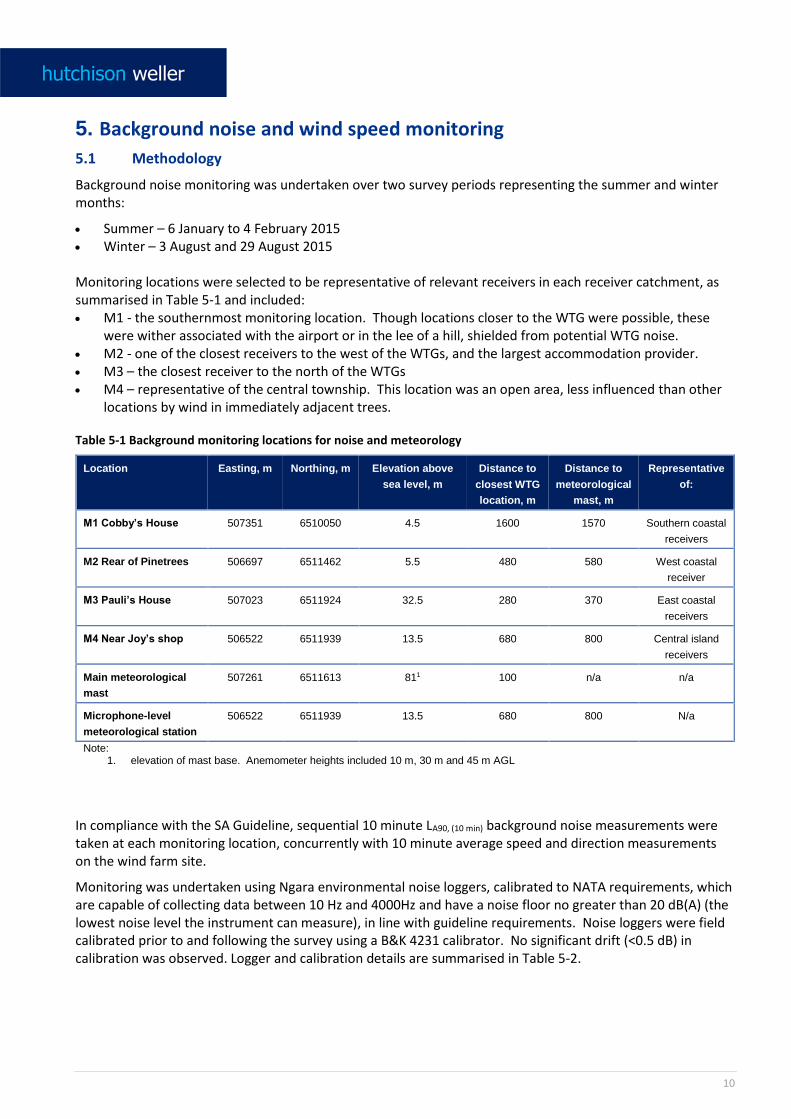
Summer – 6 January to 4 February 2015 Winter – 3 August and 29 August 2015 Monitoring locations were selected to be representative of relevant receivers in each receiver catchment, as summarised in Table 5-1 and included: M1 - the southernmost monitoring location. Though locations closer to the WTG were possible, these
were wither associated with the airport or in the lee of a hill, shielded from potential WTG noise. M2 - one of the closest receivers to the west of the WTGs, and the largest accommodation provider. M3 – the closest receiver to the north of the WTGs M4 – representative of the central township. This location was an open area, less influenced than other
locations by wind in immediately adjacent trees.
Table 5-1 Background monitoring locations for noise and meteorology
Location Easting, m Northing, m Elevation above
sea level, m
Distance to
closest WTG
location, m
Distance to
meteorological
mast, m
Representative
of:
M1 Cobby’s House 507351 6510050 4.5 1600 1570 Southern coastal
receivers
M2 Rear of Pinetrees 506697 6511462 5.5 480 580 West coastal
receiver
M3 Pauli’s House 507023 6511924 32.5 280 370 East coastal
receivers
M4 Near Joy’s shop 506522 6511939 13.5 680 800 Central island
receivers
Main meteorological
mast
507261 6511613 811 100 n/a n/a
Microphone-level
meteorological station
506522 6511939 13.5 680 800 N/a
Note: 1. elevation of mast base. Anemometer heights included 10 m, 30 m and 45 m AGL
In compliance with the SA Guideline, sequential 10 minute LA90, (10 min) background noise measurements were taken at each monitoring location, concurrently with 10 minute average speed and direction measurements on the wind farm site.
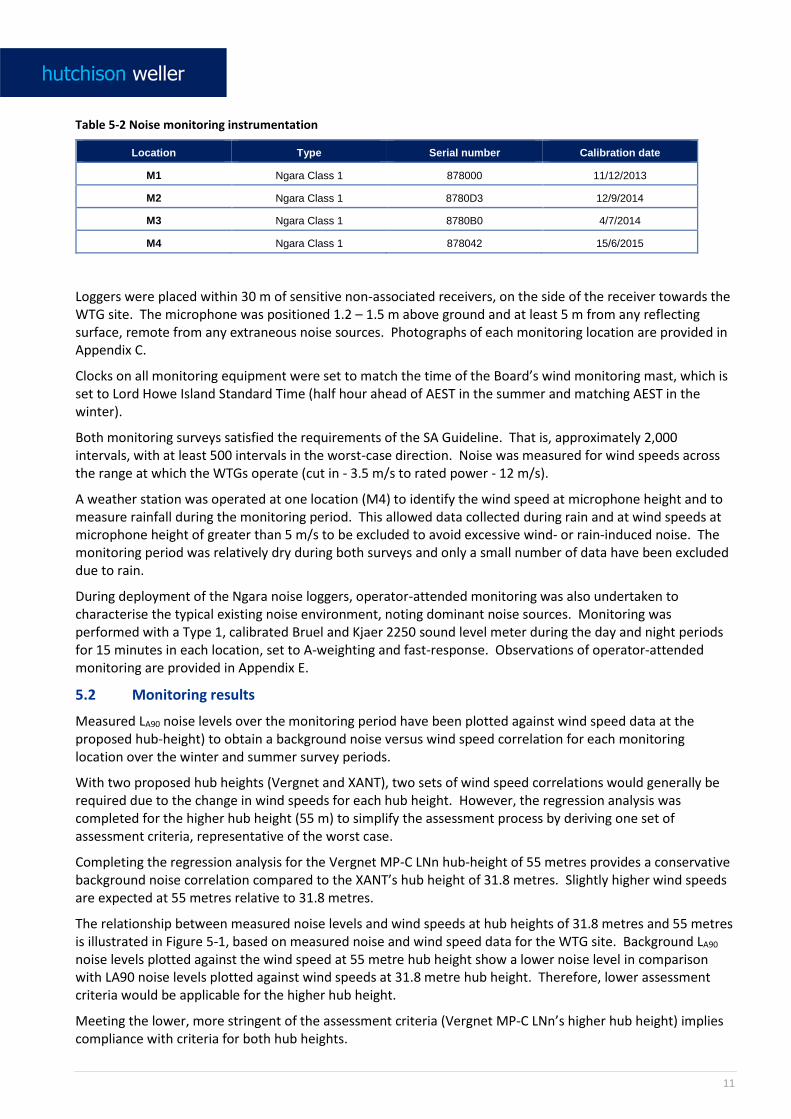
Monitoring was undertaken using Ngara environmental noise loggers, calibrated to NATA requirements, which are capable of collecting data between 10 Hz and 4000Hz and have a noise floor no greater than 20 dB(A) (the lowest noise level the instrument can measure), in line with guideline requirements. Noise loggers were field calibrated prior to and following the survey using a B&K 4231 calibrator. No significant drift (<0.5 dB) in calibration was observed. Logger and calibration details are summarised in Table 5-2.
11
Table 5-2 Noise monitoring instrumentation
Location Type Serial number Calibration date
M1 Ngara Class 1 878000 11/12/2013
M2 Ngara Class 1 8780D3 12/9/2014
M3 Ngara Class 1 8780B0 4/7/2014
M4 Ngara Class 1 878042 15/6/2015
Loggers were placed within 30 m of sensitive non-associated receivers, on the side of the receiver towards the WTG site. The microphone was positioned 1.2 – 1.5 m above ground and at least 5 m from any reflecting surface, remote from any extraneous noise sources. Photographs of each monitoring location are provided in Appendix C.
Clocks on all monitoring equipment were set to match the time of the Board’s wind monitoring mast, which is set to Lord Howe Island Standard Time (half hour ahead of AEST in the summer and matching AEST in the winter).
Both monitoring surveys satisfied the requirements of the SA Guideline. That is, approximately 2,000 intervals, with at least 500 intervals in the worst-case direction. Noise was measured for wind speeds across the range at which the WTGs operate (cut in - 3.5 m/s to rated power - 12 m/s).
A weather station was operated at one location (M4) to identify the wind speed at microphone height and to measure rainfall during the monitoring period. This allowed data collected during rain and at wind speeds at microphone height of greater than 5 m/s to be excluded to avoid excessive wind- or rain-induced noise. The monitoring period was relatively dry during both surveys and only a small number of data have been excluded due to rain.
During deployment of the Ngara noise loggers, operator-attended monitoring was also undertaken to characterise the typical existing noise environment, noting dominant noise sources. Monitoring was performed with a Type 1, calibrated Bruel and Kjaer 2250 sound level meter during the day and night periods for 15 minutes in each location, set to A-weighting and fast-response. Observations of operator-attended monitoring are provided in Appendix E.
5.2 Monitoring results
Measured LA90 noise levels over the monitoring period have been plotted against wind speed data at the proposed hub-height) to obtain a background noise versus wind speed correlation for each monitoring location over the winter and summer survey periods.
With two proposed hub heights (Vergnet and XANT), two sets of wind speed correlations would generally be required due to the change in wind speeds for each hub height. However, the regression analysis was completed for the higher hub height (55 m) to simplify the assessment process by deriving one set of assessment criteria, representative of the worst case.
Completing the regression analysis for the Vergnet MP-C LNn hub-height of 55 metres provides a conservative background noise correlation compared to the XANT’s hub height of 31.8 metres. Slightly higher wind speeds are expected at 55 metres relative to 31.8 metres.
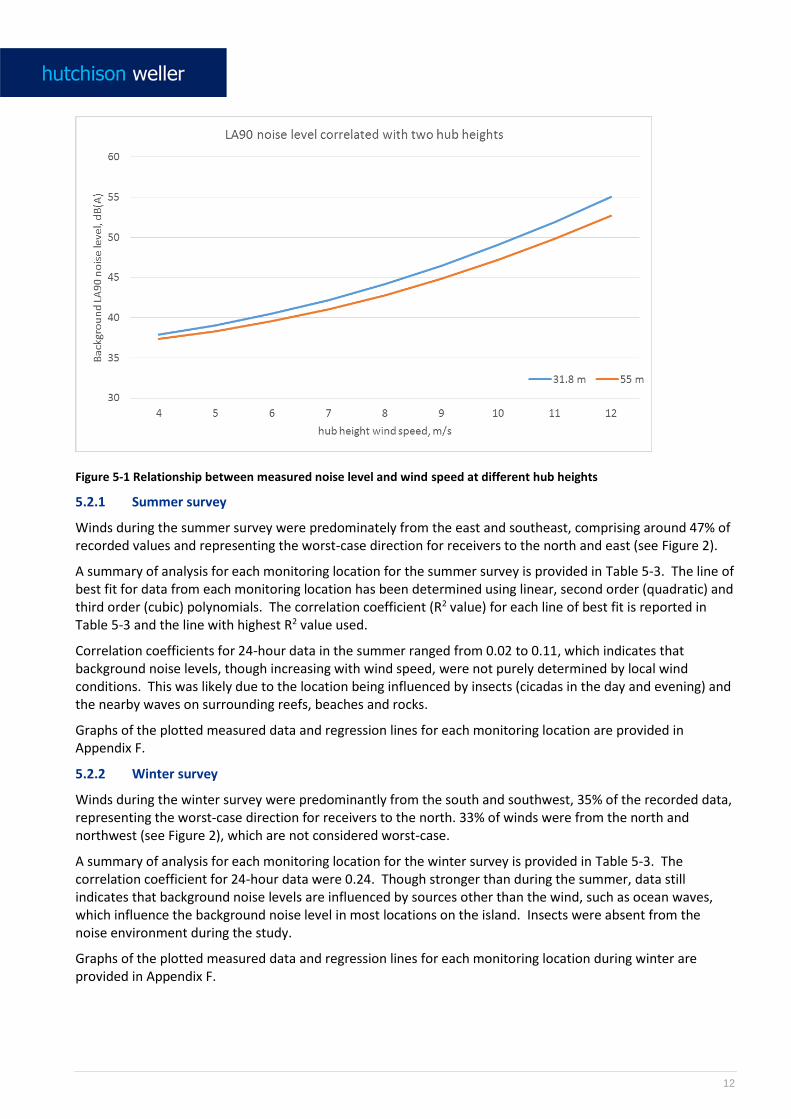
The relationship between measured noise levels and wind speeds at hub heights of 31.8 metres and 55 metres is illustrated in Figure 5-1, based on measured noise and wind speed data for the WTG site. Background LA90 noise levels plotted against the wind speed at 55 metre hub height show a lower noise level in comparison with LA90 noise levels plotted against wind speeds at 31.8 metre hub height. Therefore, lower assessment criteria would be applicable for the higher hub height.
Meeting the lower, more stringent of the assessment criteria (Vergnet MP-C LNn’s higher hub height) implies compliance with criteria for both hub heights.
12
Figure 5-1 Relationship between measured noise level and wind speed at different hub heights
5.2.1 Summer survey
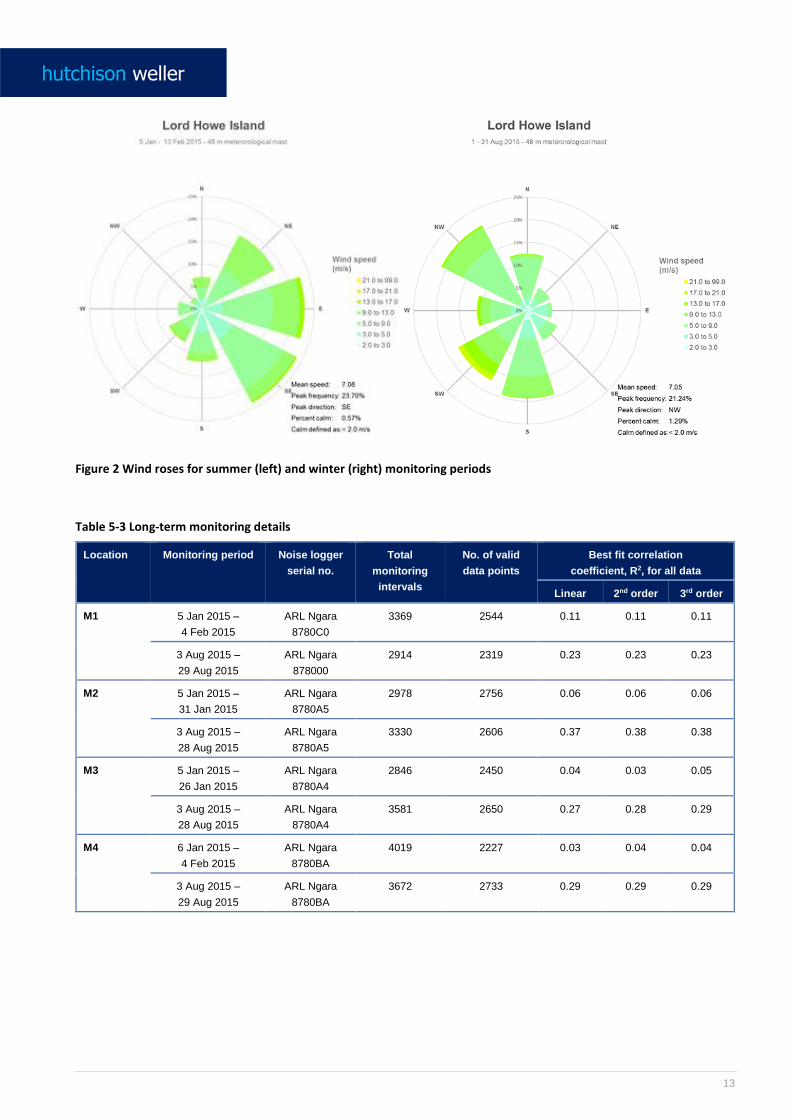
Winds during the summer survey were predominately from the east and southeast, comprising around 47% of recorded values and representing the worst-case direction for receivers to the north and east (see Figure 2).
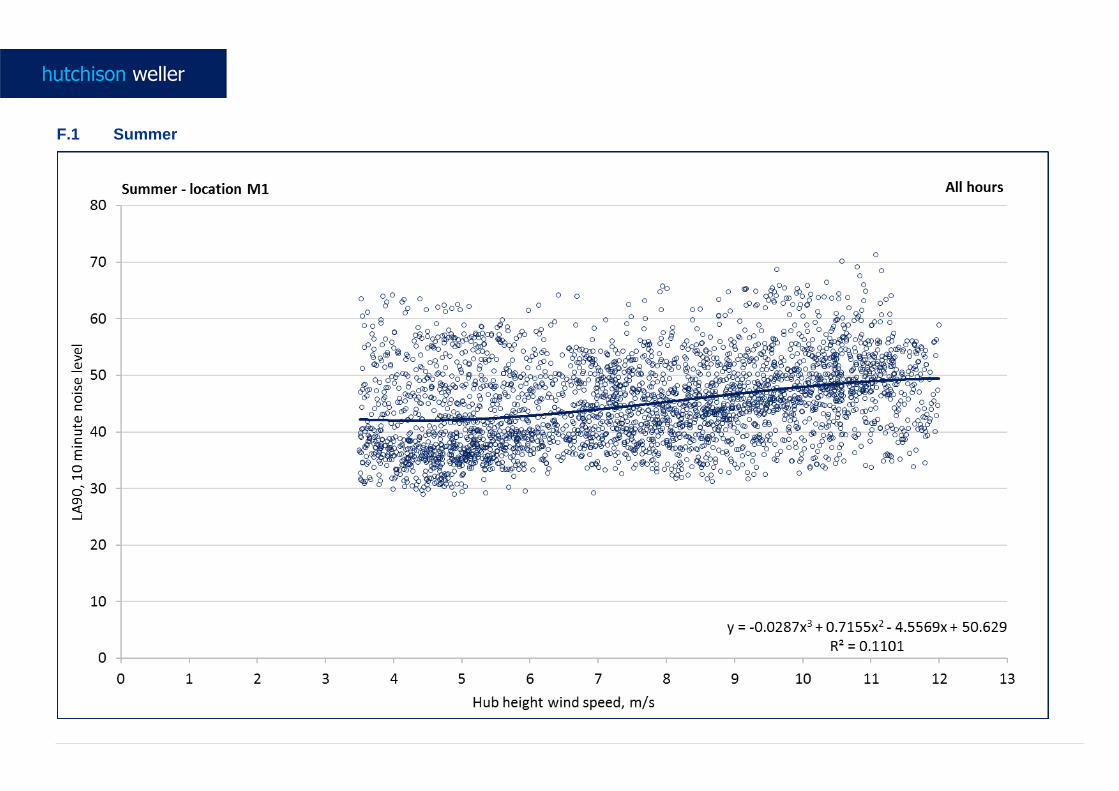
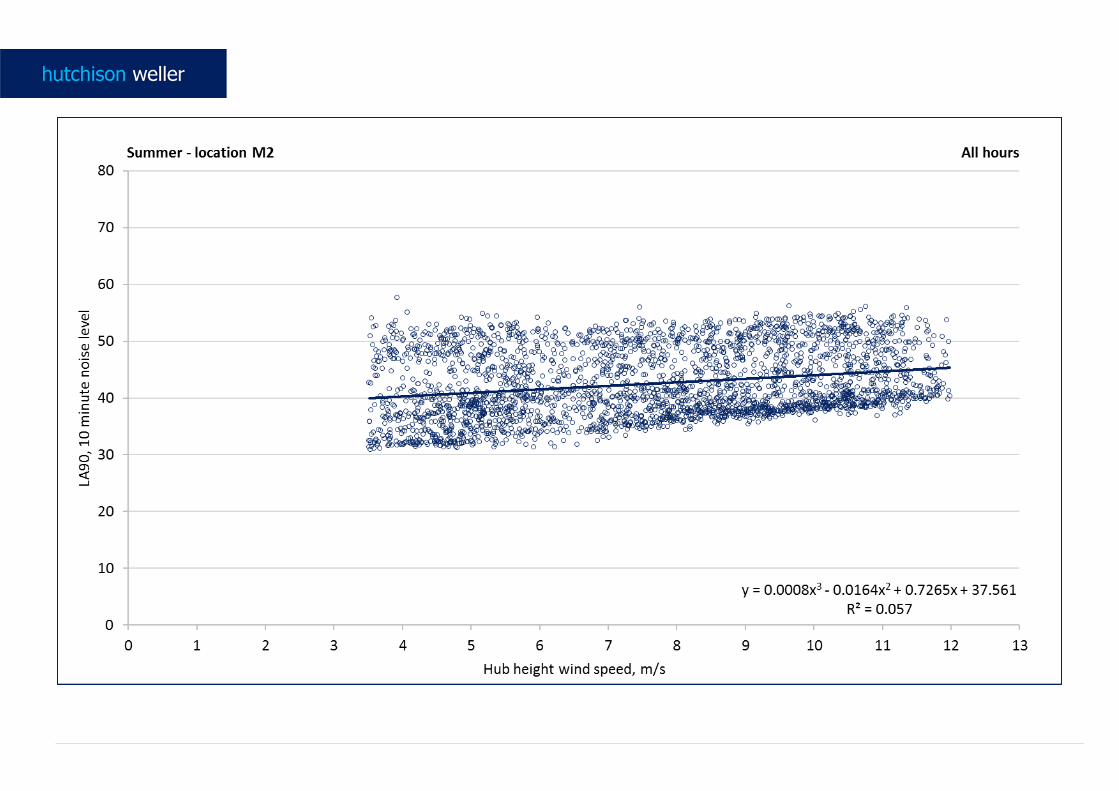
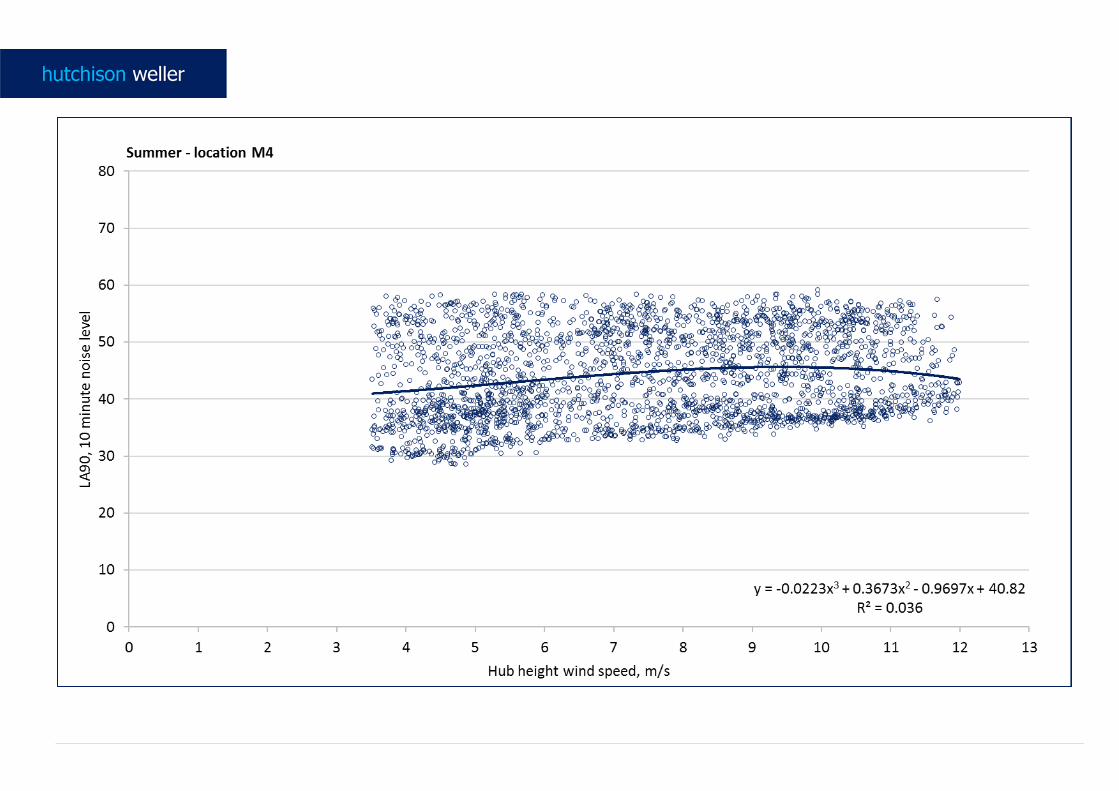
A summary of analysis for each monitoring location for the summer survey is provided in Table 5-3. The line of best fit for data from each monitoring location has been determined using linear, second order (quadratic) and third order (cubic) polynomials. The correlation coefficient (R2 value) for each line of best fit is reported in Table 5-3 and the line with highest R2 value used.
Correlation coefficients for 24-hour data in the summer ranged from 0.02 to 0.11, which indicates that background noise levels, though increasing with wind speed, were not purely determined by local wind conditions. This was likely due to the location being influenced by insects (cicadas in the day and evening) and the nearby waves on surrounding reefs, beaches and rocks.
Graphs of the plotted measured data and regression lines for each monitoring location are provided in Appendix F.
5.2.2 Winter survey
Winds during the winter survey were predominantly from the south and southwest, 35% of the recorded data, representing the worst-case direction for receivers to the north. 33% of winds were from the north and northwest (see Figure 2), which are not considered worst-case.
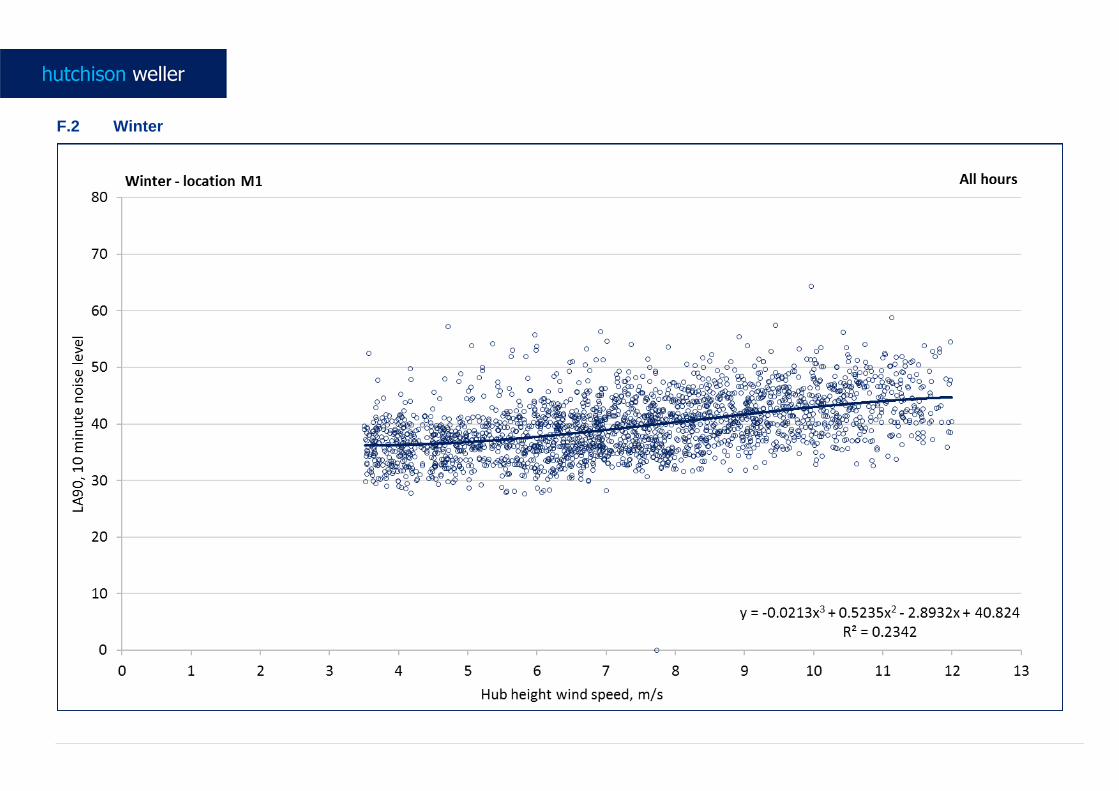
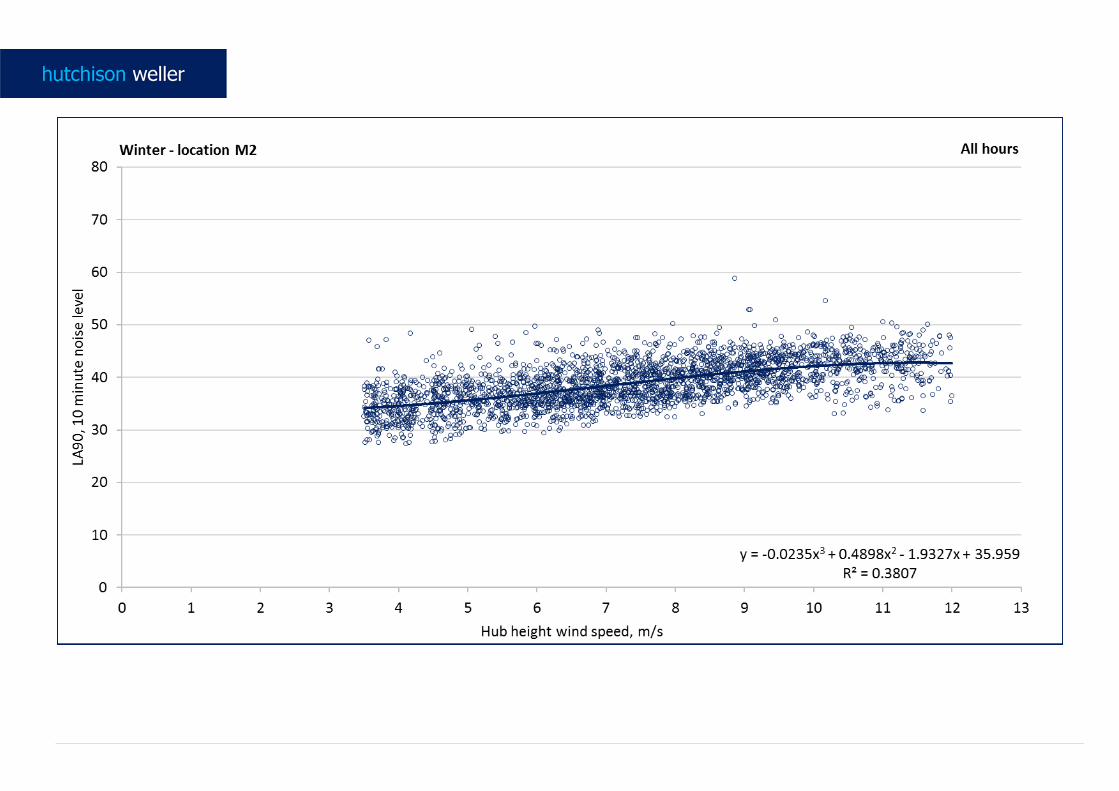
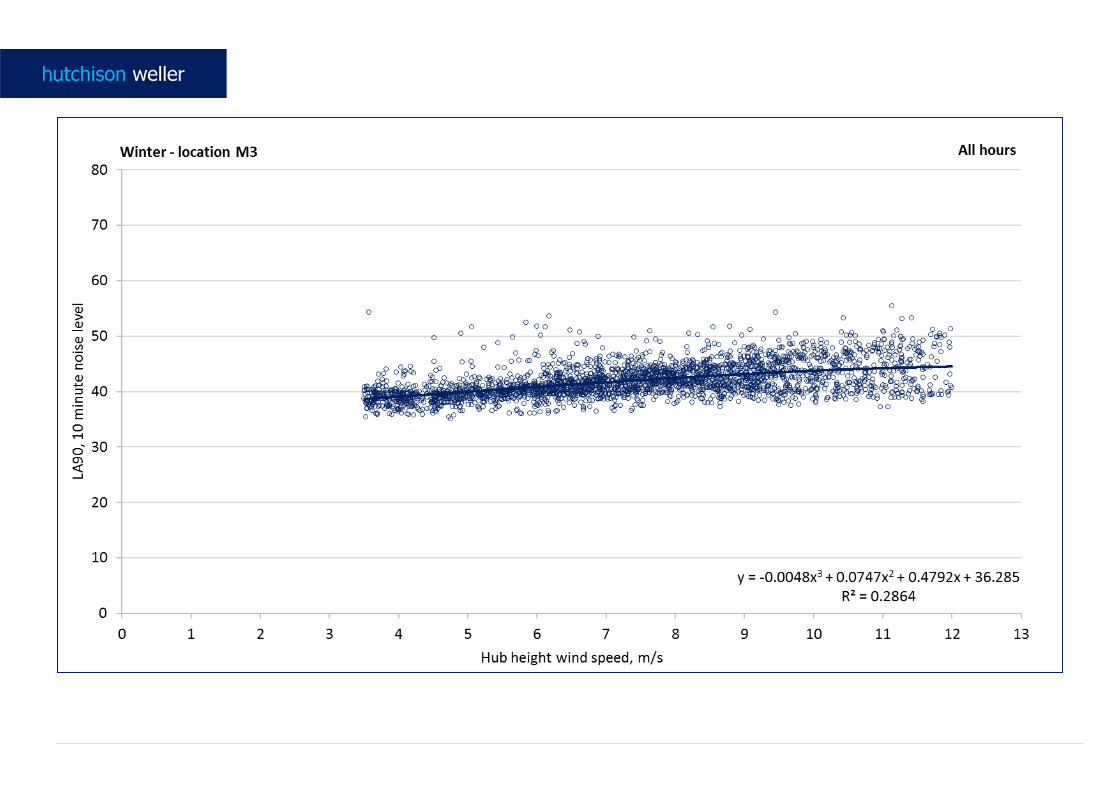
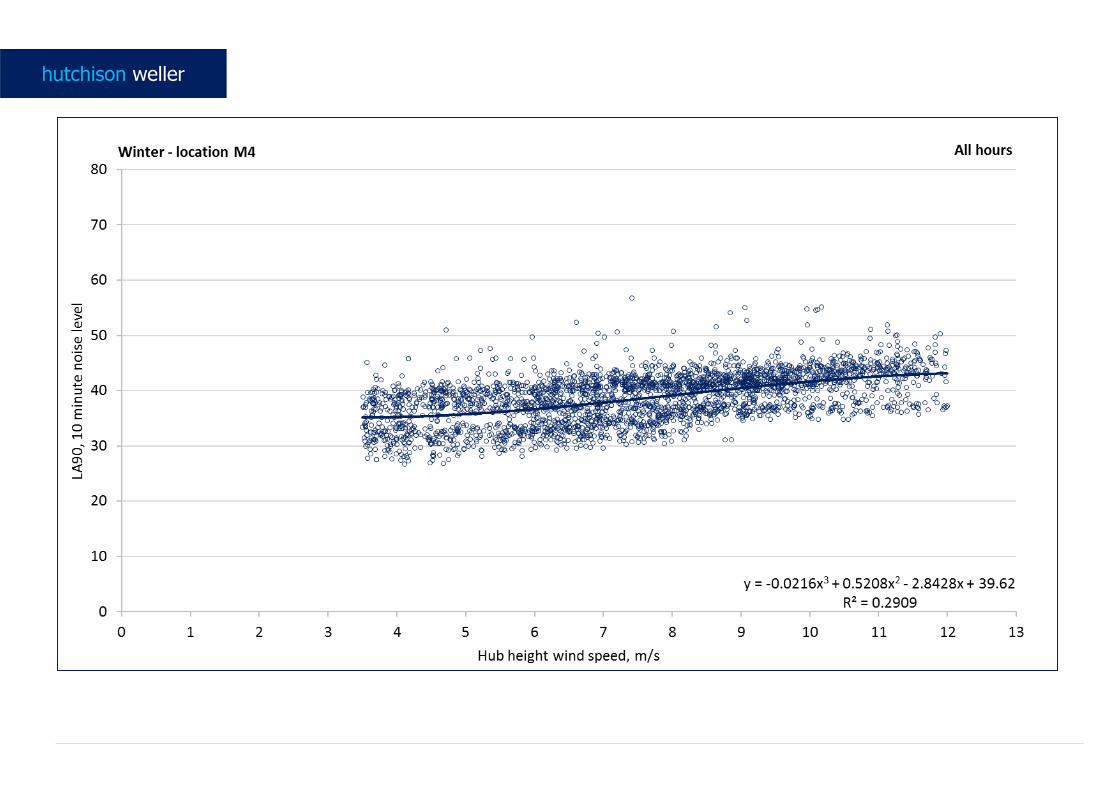
A summary of analysis for each monitoring location for the winter survey is provided in Table 5-3. The correlation coefficient for 24-hour data were 0.24. Though stronger than during the summer, data still indicates that background noise levels are influenced by sources other than the wind, such as ocean waves, which influence the background noise level in most locations on the island. Insects were absent from the noise environment during the study.
Graphs of the plotted measured data and regression lines for each monitoring location during winter are provided in Appendix F.
13
Figure 2 Wind roses for summer (left) and winter (right) monitoring periods
Table 5-3 Long-term monitoring details
Location Monitoring period Noise logger
serial no.
Total
monitoring
intervals
No. of valid
data points
Best fit correlation
coefficient, R2, for all data
Linear 2nd order 3rd order
M1 5 Jan 2015 –
4 Feb 2015
ARL Ngara
8780C0
3369 2544 0.11 0.11 0.11
3 Aug 2015 –
29 Aug 2015
ARL Ngara
878000
2914 2319 0.23 0.23 0.23
M2 5 Jan 2015 –
31 Jan 2015
ARL Ngara
8780A5
2978 2756 0.06 0.06 0.06
3 Aug 2015 –
28 Aug 2015
ARL Ngara
8780A5
3330 2606 0.37 0.38 0.38
M3 5 Jan 2015 –
26 Jan 2015
ARL Ngara
8780A4
2846 2450 0.04 0.03 0.05
3 Aug 2015 –
28 Aug 2015
ARL Ngara
8780A4
3581 2650 0.27 0.28 0.29
M4 6 Jan 2015 –
4 Feb 2015
ARL Ngara
8780BA
4019 2227 0.03 0.04 0.04
3 Aug 2015 –
29 Aug 2015
ARL Ngara
8780BA
3672 2733 0.29 0.29 0.29

14
5.2.3 Influence of powerhouse on background noise levels
As described in Section 4.2, monitoring of the powerhouse, which is located around 100 metres south of the nearest receiver and monitoring location M3, indicated that this noise source was inaudible at those receivers. With an estimated LAeq, 15 minute noise level at the nearest receiver of 32 dB(A) compared with lowest LA90 background level of 42 dB(A) (GHD 2013), the Powerhouse does not contribute to the background noise level.
When this source of noise is switched off in favour of operating the WTGs, the effect on the background noise level should be negligible and not result in lower baseline values.
5.3 Noise assessment criteria
When assessing the potential impact of WTG noise on the community, it is necessary to set a standard against which the nature and characteristics of this noise may be tested. Noise assessment criteria have been established for each relevant receiver, based on background noise levels and wind speeds in accordance with the SA Guidelines.
The noise assessment criteria were derived from the 3rd order best fit regression line, as indicated in Table 5-3 and are summarised for the summer and winter months in Table 5-4.
The specific division between summer and winter conditions has not been determined. Compliance with the most stringent criteria in each location would imply compliance with criteria for both seasons.
Plotted noise criteria are provided in Appendix G.
Table 5-4 Derived LAeq, 10 minute noise criteria for summer months
Receiver
catchment
Period Equation describing assessment
criteria
LAeq, 10 minute at each hub height wind speed bin, m/s
4 5 6 7 8 9 10 11 12
Eastern coastal Summer y=-0.0819x3 + 1.7872x^2 -11.47x+78.11 56 55 56 57 59 60 60 59 56
Winter y = -0.0064x3+0.1056x2+0.2876x+41.663 44 45 46 47 47 48 49 49 49
Central
receivers
Summer y = -0.0039x3-0.0336x2+1.6729x+40.64 46 47 48 49 50 51 51 50 49
Winter y = -0.0247x3+0.5727x2-3.1444x+45.168 40 41 42 43 44 45 46 47 48
Western
coastal
receivers
Summer y = 0.0093x3-0.1753x2+1.5769x+41.36 45 46 47 47 48 48 49 50 50
Winter y = -0.0239x3+0.4972x2-1.9803x+41.055 40 41 42 43 45 46 47 48 48
Southern
island
receivers
Summer y = -0.0287x3+ 0.7155x2-4.5569x+50.629 47 47 48 49 50 52 53 54 54
Winter y = -0.0289x3+ 0.6753x2-3.8505x+47.73 41 42 43 44 45 47 48 49 50
15
6. Noise prediction
6.1 Noise model selection and development
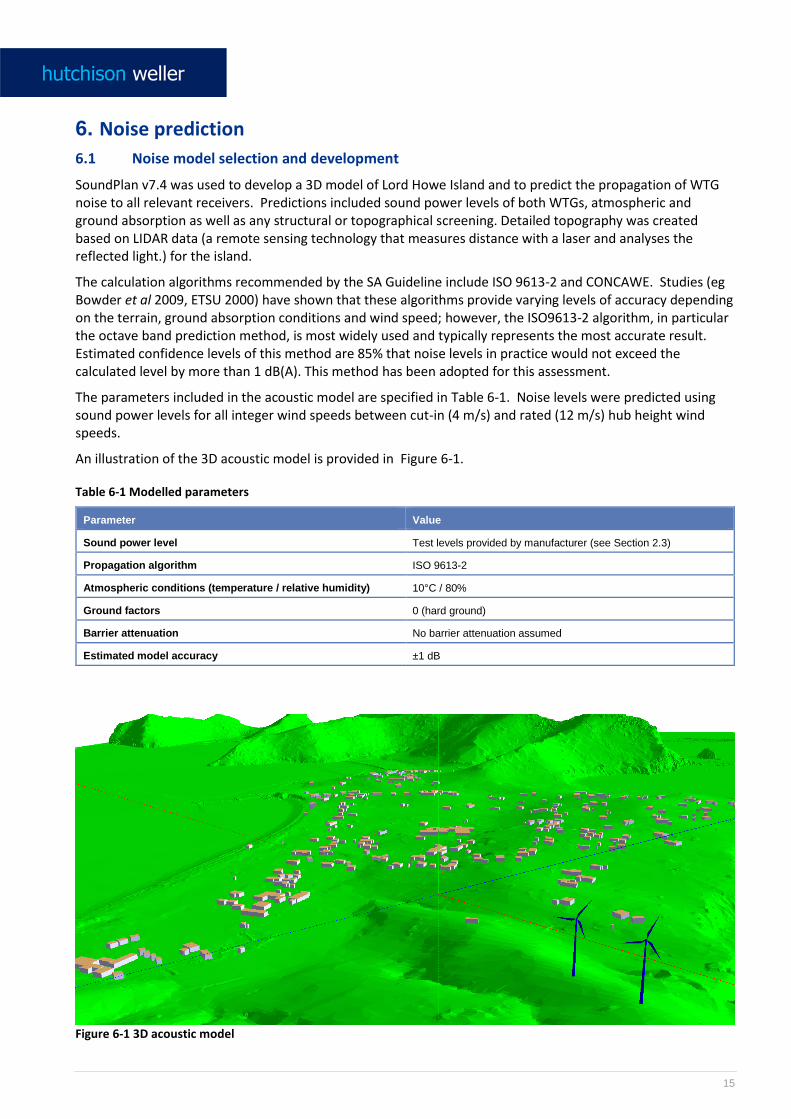
SoundPlan v7.4 was used to develop a 3D model of Lord Howe Island and to predict the propagation of WTG noise to all relevant receivers. Predictions included sound power levels of both WTGs, atmospheric and ground absorption as well as any structural or topographical screening. Detailed topography was created based on LIDAR data (a remote sensing technology that measures distance with a laser and analyses the reflected light.) for the island.
The calculation algorithms recommended by the SA Guideline include ISO 9613-2 and CONCAWE. Studies (eg Bowder et al 2009, ETSU 2000) have shown that these algorithms provide varying levels of accuracy depending on the terrain, ground absorption conditions and wind speed; however, the ISO9613-2 algorithm, in particular the octave band prediction method, is most widely used and typically represents the most accurate result. Estimated confidence levels of this method are 85% that noise levels in practice would not exceed the calculated level by more than 1 dB(A). This method has been adopted for this assessment.
The parameters included in the acoustic model are specified in Table 6-1. Noise levels were predicted using sound power levels for all integer wind speeds between cut-in (4 m/s) and rated (12 m/s) hub height wind speeds.
An illustration of the 3D acoustic model is provided in Figure 6-1.
Table 6-1 Modelled parameters
Parameter Value
Sound power level Test levels provided by manufacturer (see Section 2.3)
Propagation algorithm ISO 9613-2
Atmospheric conditions (temperature / relative humidity) 10°C / 80%
Ground factors 0 (hard ground)
Barrier attenuation No barrier attenuation assumed
Estimated model accuracy ±1 dB
Figure 6-1 3D acoustic model
16
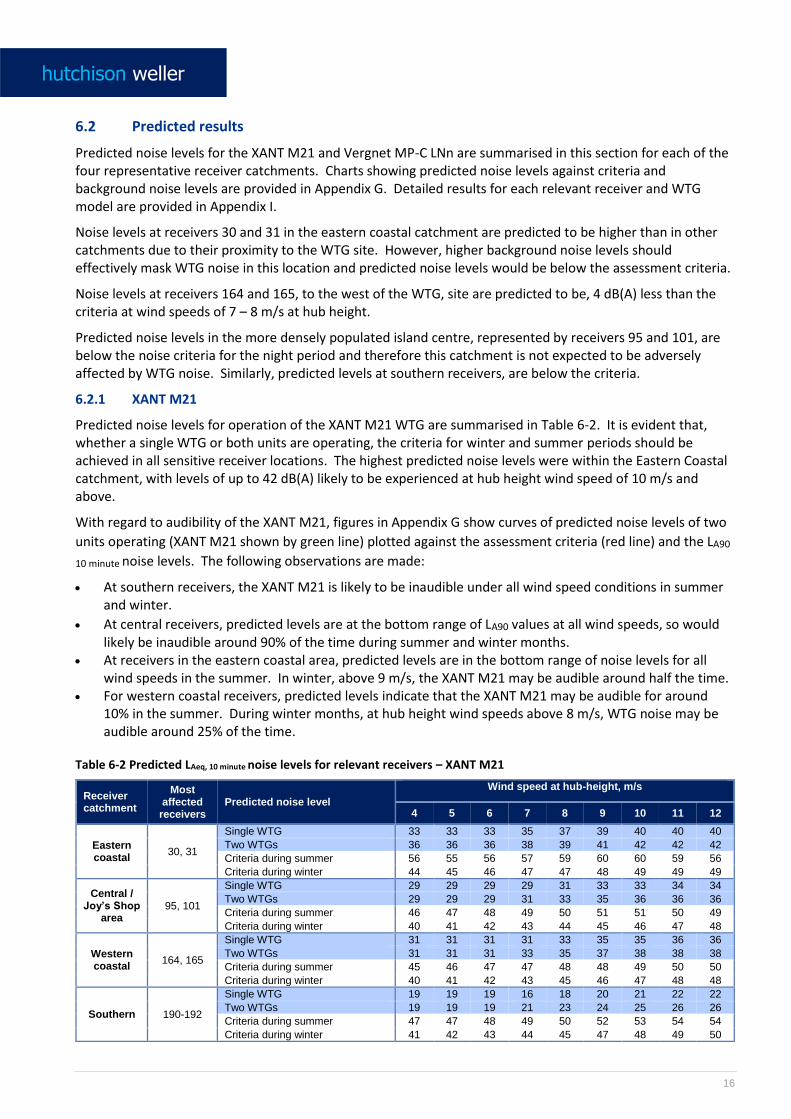
6.2 Predicted results
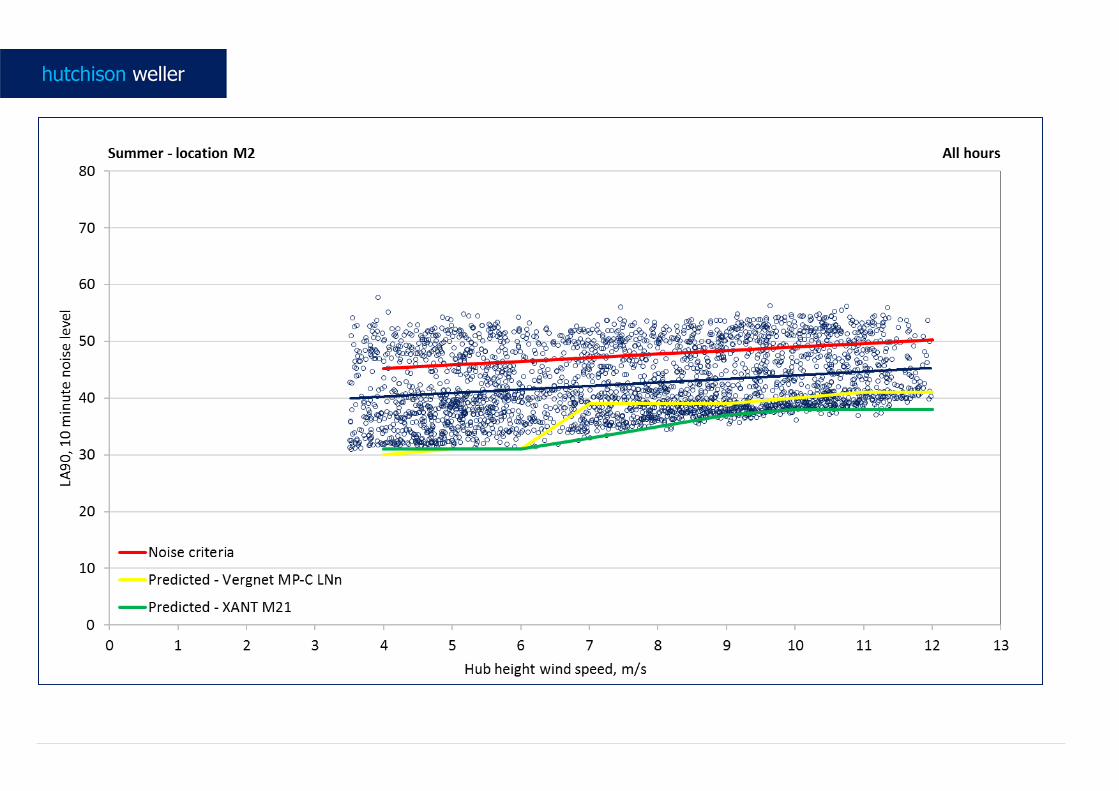
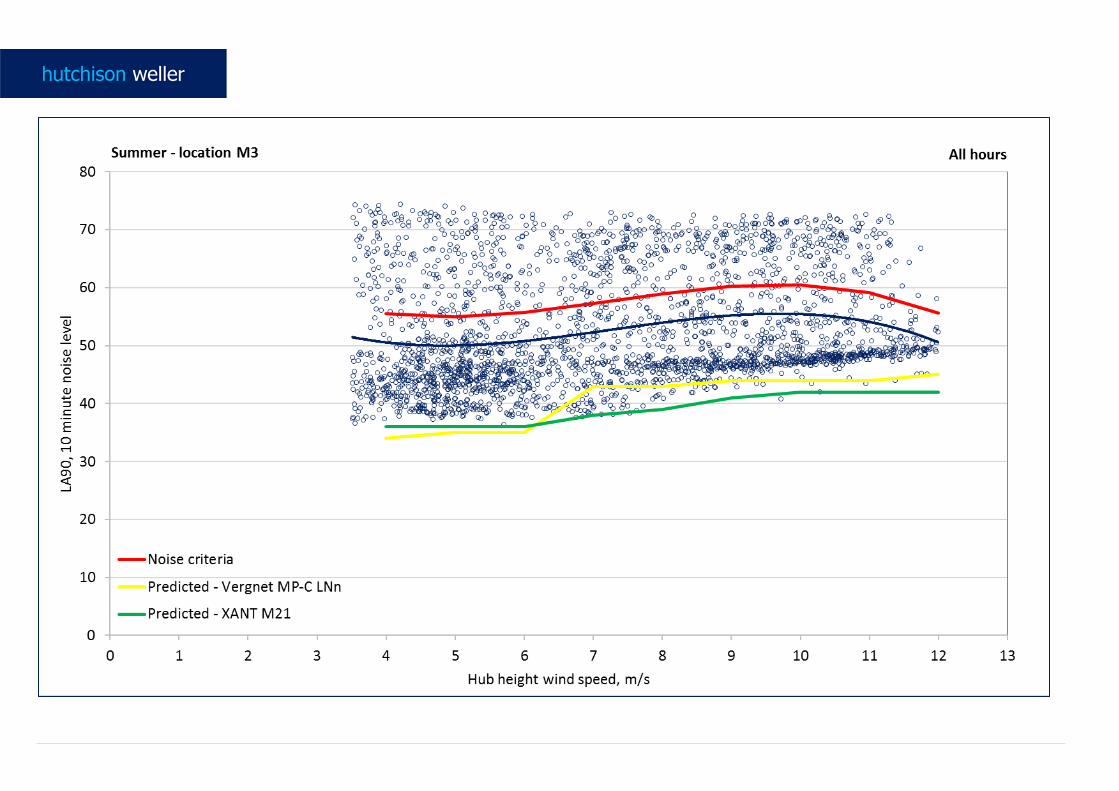
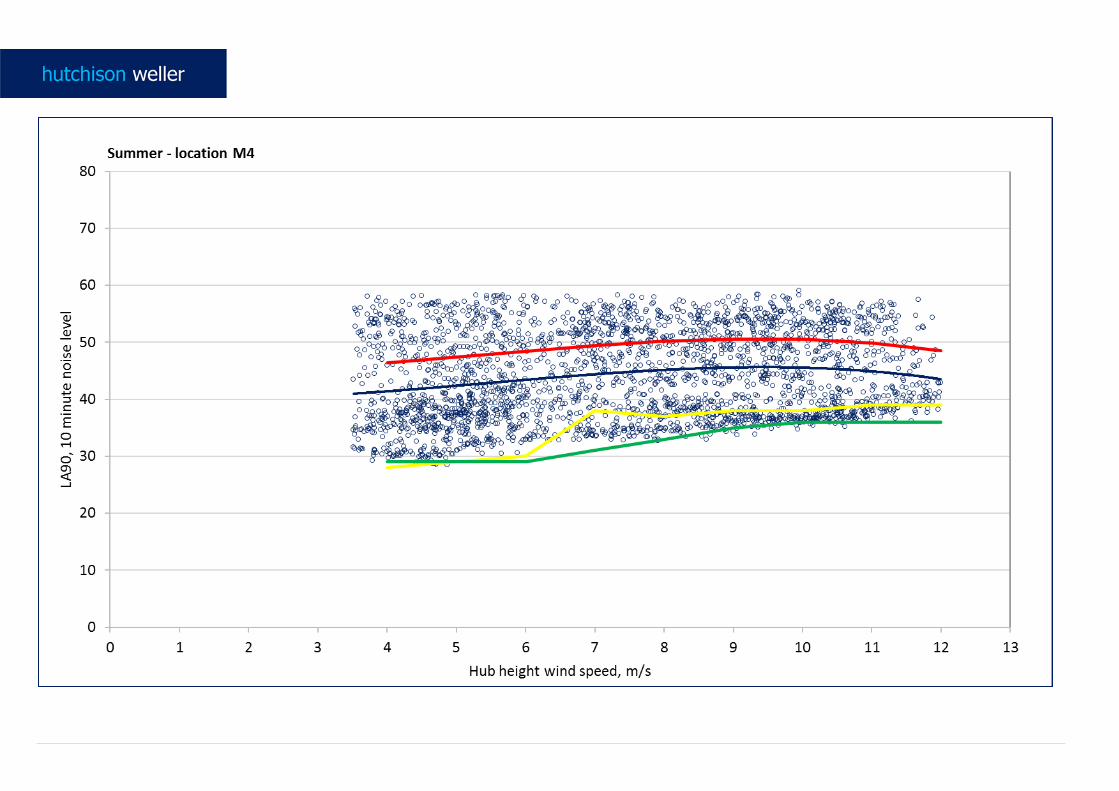
Predicted noise levels for the XANT M21 and Vergnet MP-C LNn are summarised in this section for each of the four representative receiver catchments. Charts showing predicted noise levels against criteria and background noise levels are provided in Appendix G. Detailed results for each relevant receiver and WTG model are provided in Appendix I.
Noise levels at receivers 30 and 31 in the eastern coastal catchment are predicted to be higher than in other catchments due to their proximity to the WTG site. However, higher background noise levels should effectively mask WTG noise in this location and predicted noise levels would be below the assessment criteria.
Noise levels at receivers 164 and 165, to the west of the WTG, site are predicted to be, 4 dB(A) less than the criteria at wind speeds of 7 – 8 m/s at hub height.
Predicted noise levels in the more densely populated island centre, represented by receivers 95 and 101, are below the noise criteria for the night period and therefore this catchment is not expected to be adversely affected by WTG noise. Similarly, predicted levels at southern receivers, are below the criteria.
6.2.1 XANT M21
Predicted noise levels for operation of the XANT M21 WTG are summarised in Table 6-2. It is evident that, whether a single WTG or both units are operating, the criteria for winter and summer periods should be achieved in all sensitive receiver locations. The highest predicted noise levels were within the Eastern Coastal catchment, with levels of up to 42 dB(A) likely to be experienced at hub height wind speed of 10 m/s and above.
With regard to audibility of the XANT M21, figures in Appendix G show curves of predicted noise levels of two
units operating (XANT M21 shown by green line) plotted against the assessment criteria (red line) and the LA90
10 minute noise levels. The following observations are made:
At southern receivers, the XANT M21 is likely to be inaudible under all wind speed conditions in summer and winter.
At central receivers, predicted levels are at the bottom range of LA90 values at all wind speeds, so would likely be inaudible around 90% of the time during summer and winter months.
At receivers in the eastern coastal area, predicted levels are in the bottom range of noise levels for all wind speeds in the summer. In winter, above 9 m/s, the XANT M21 may be audible around half the time.
For western coastal receivers, predicted levels indicate that the XANT M21 may be audible for around 10% in the summer. During winter months, at hub height wind speeds above 8 m/s, WTG noise may be audible around 25% of the time.
Table 6-2 Predicted LAeq, 10 minute noise levels for relevant receivers – XANT M21
Receiver catchment
Most affected
receivers Predicted noise level
Wind speed at hub-height, m/s
4 5 6 7 8 9 10 11 12
Eastern coastal
30, 31
Single WTG 33 33 33 35 37 39 40 40 40
Two WTGs 36 36 36 38 39 41 42 42 42
Criteria during summer 56 55 56 57 59 60 60 59 56
Criteria during winter 44 45 46 47 47 48 49 49 49
Central / Joy’s Shop
area 95, 101
Single WTG 29 29 29 29 31 33 33 34 34
Two WTGs 29 29 29 31 33 35 36 36 36
Criteria during summer 46 47 48 49 50 51 51 50 49
Criteria during winter 40 41 42 43 44 45 46 47 48
Western coastal
164, 165
Single WTG 31 31 31 31 33 35 35 36 36
Two WTGs 31 31 31 33 35 37 38 38 38
Criteria during summer 45 46 47 47 48 48 49 50 50
Criteria during winter 40 41 42 43 45 46 47 48 48
Southern 190-192
Single WTG 19 19 19 16 18 20 21 22 22
Two WTGs 19 19 19 21 23 24 25 26 26
Criteria during summer 47 47 48 49 50 52 53 54 54
Criteria during winter 41 42 43 44 45 47 48 49 50
17
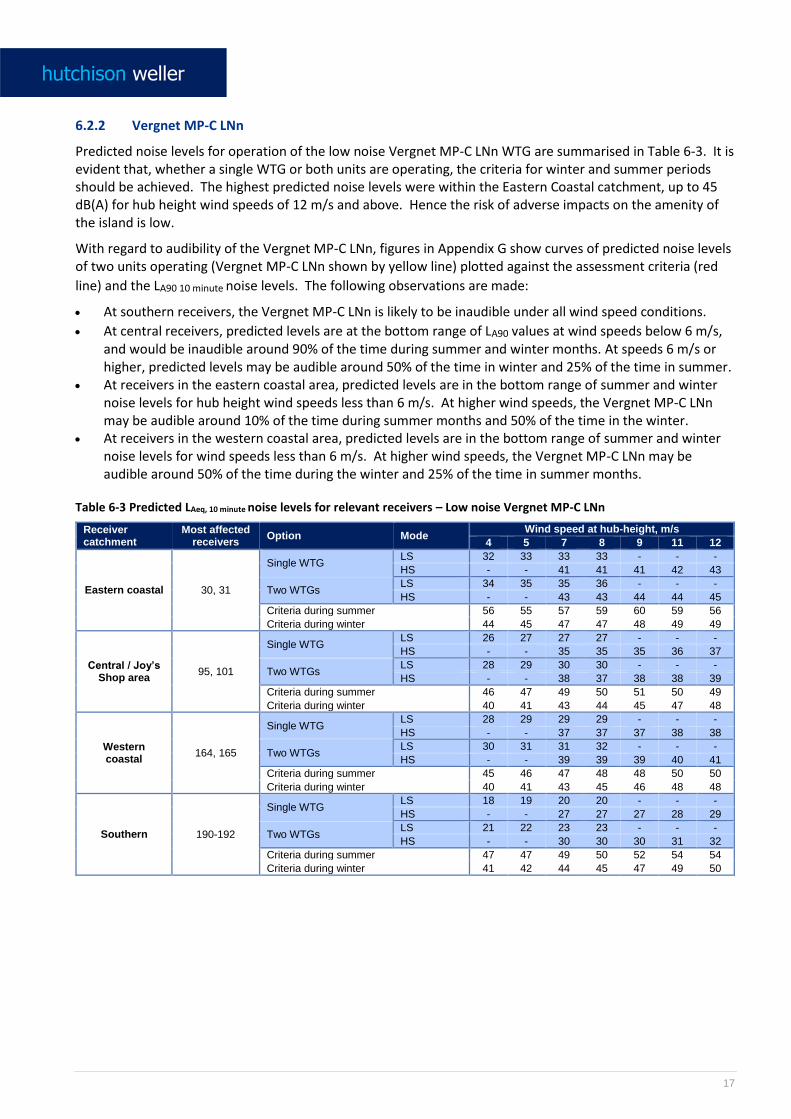
6.2.2 Vergnet MP-C LNn
Predicted noise levels for operation of the low noise Vergnet MP-C LNn WTG are summarised in Table 6-3. It is evident that, whether a single WTG or both units are operating, the criteria for winter and summer periods should be achieved. The highest predicted noise levels were within the Eastern Coastal catchment, up to 45 dB(A) for hub height wind speeds of 12 m/s and above. Hence the risk of adverse impacts on the amenity of the island is low.
With regard to audibility of the Vergnet MP-C LNn, figures in Appendix G show curves of predicted noise levels of two units operating (Vergnet MP-C LNn shown by yellow line) plotted against the assessment criteria (red
line) and the LA90 10 minute noise levels. The following observations are made:
At southern receivers, the Vergnet MP-C LNn is likely to be inaudible under all wind speed conditions.
At central receivers, predicted levels are at the bottom range of LA90 values at wind speeds below 6 m/s, and would be inaudible around 90% of the time during summer and winter months. At speeds 6 m/s or higher, predicted levels may be audible around 50% of the time in winter and 25% of the time in summer.
At receivers in the eastern coastal area, predicted levels are in the bottom range of summer and winter noise levels for hub height wind speeds less than 6 m/s. At higher wind speeds, the Vergnet MP-C LNn may be audible around 10% of the time during summer months and 50% of the time in the winter.
At receivers in the western coastal area, predicted levels are in the bottom range of summer and winter noise levels for wind speeds less than 6 m/s. At higher wind speeds, the Vergnet MP-C LNn may be audible around 50% of the time during the winter and 25% of the time in summer months.
Table 6-3 Predicted LAeq, 10 minute noise levels for relevant receivers – Low noise Vergnet MP-C LNn
Receiver catchment
Most affected receivers
Option Mode Wind speed at hub-height, m/s
4 5 7 8 9 11 12
Eastern coastal 30, 31
Single WTG LS 32 33 33 33 - - -
HS - - 41 41 41 42 43
Two WTGs LS 34 35 35 36 - - -
HS - - 43 43 44 44 45
Criteria during summer 56 55 57 59 60 59 56
Criteria during winter 44 45 47 47 48 49 49
Central / Joy’s Shop area
95, 101
Single WTG LS 26 27 27 27 - - -
HS - - 35 35 35 36 37
Two WTGs LS 28 29 30 30 - - -
HS - - 38 37 38 38 39
Criteria during summer 46 47 49 50 51 50 49
Criteria during winter 40 41 43 44 45 47 48
Western coastal
164, 165
Single WTG LS 28 29 29 29 - - -
HS - - 37 37 37 38 38
Two WTGs LS 30 31 31 32 - - -
HS - - 39 39 39 40 41
Criteria during summer 45 46 47 48 48 50 50
Criteria during winter 40 41 43 45 46 48 48
Southern 190-192
Single WTG LS 18 19 20 20 - - -
HS - - 27 27 27 28 29
Two WTGs LS 21 22 23 23 - - -
HS - - 30 30 30 31 32
Criteria during summer 47 47 49 50 52 54 54
Criteria during winter 41 42 44 45 47 49 50

18
6.2.3 Previously proposed Vergnet MP-C (non-acoustically treated)
Predicted noise levels for the non-acoustically treated Vergnet MP-C WTG are summarised in Table 6-4. This WTG would be noisier than the acoustically treated version and may result in noise levels slightly exceeding the winter noise criteria in the eastern coastal catchment, with the maximum noise level predicted to be 48 dB(A) at wind speeds of 8 m/s and above.
In the western coastal catchment, maximum predicted levels are 44 dB(A) at hub height wind speeds of 8 m/s or higher, which meet the noise criteria.
Table 6-4 Predicted LAeq, 10 minute noise levels for relevant receivers –Vergnet MP-C
Receiver catchment
Most affected receivers
Predicted noise level Wind speed at hub-height, m/s
4 5 7 8 9 11 12
Eastern coastal
30, 31
Single WTG 36 36 45 46 46 46 46
Two WTGs 38 39 47 48 48 48 48
Criteria during summer 56 55 57 59 60 59 56
Criteria during winter 44 45 47 47 48 49 49
Central / Joy’s Shop
area 95, 101
Single WTG 30 31 39 40 40 40 40
Two WTGs 32 33 41 42 42 42 42
Criteria during summer 46 47 49 50 51 50 49
Criteria during winter 40 41 43 44 45 47 48
Western coastal
164, 165
Single WTG 32 32 41 42 42 42 42
Two WTGs 34 35 43 44 44 44 44
Criteria during summer 45 46 47 48 48 50 50
Criteria during winter 40 41 43 45 46 48 48
Southern 190-192
Single WTG 23 23 31 32 32 32 32
Two WTGs 26 26 34 35 35 35 35
Criteria during summer 47 47 49 50 52 54 54
Criteria during winter 41 42 44 45 47 49 50
6.3 Low frequency, infrasound and tonal characteristics
The noise assessment criteria of the NSW Guideline were developed with the fundamental characteristics of wind turbine noise taken into consideration and account for the level of noise generated by the wind farm and any annoying characteristics of this noise, such as discrete tones low frequency and other characteristics that are commonly found in acoustic environments
However, assessment of excessive levels of specific noise characteristics should also be undertaken and this section addresses the following:
Tonal characteristics Low frequency noise Infrasound.
6.3.1 Tonal characteristics
Excessive tonality is defined the levels of one-third octave band in the predicted LAeq, 10 minute noise level at the receiver exceeding the level of adjacent bands on both sides by:
5 dB or more if the centres frequency of the band containing the tone is above 400 Hz 8 dB or more if the centres frequency of the band containing the tone is 160 Hz to 400 Hz inclusive 15 dB or more if the centres frequency of the band containing the tone is below 160 Hz
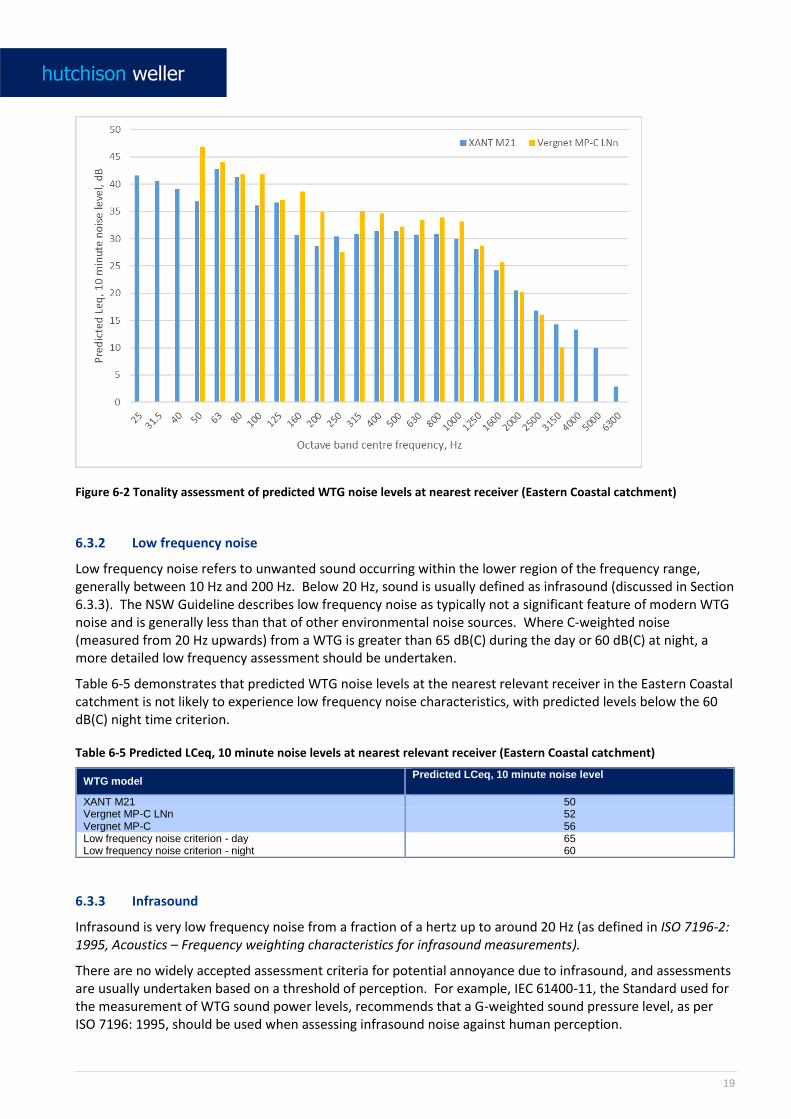
Based on supplier’s data for WTG noise emissions, Figure 6-2 demonstrates no tonal characteristics are expected at the nearest relevant receivers.
19
Figure 6-2 Tonality assessment of predicted WTG noise levels at nearest receiver (Eastern Coastal catchment)
6.3.2 Low frequency noise
Low frequency noise refers to unwanted sound occurring within the lower region of the frequency range, generally between 10 Hz and 200 Hz. Below 20 Hz, sound is usually defined as infrasound (discussed in Section 6.3.3). The NSW Guideline describes low frequency noise as typically not a significant feature of modern WTG noise and is generally less than that of other environmental noise sources. Where C-weighted noise (measured from 20 Hz upwards) from a WTG is greater than 65 dB(C) during the day or 60 dB(C) at night, a more detailed low frequency assessment should be undertaken.
Table 6-5 demonstrates that predicted WTG noise levels at the nearest relevant receiver in the Eastern Coastal catchment is not likely to experience low frequency noise characteristics, with predicted levels below the 60 dB(C) night time criterion.
Table 6-5 Predicted LCeq, 10 minute noise levels at nearest relevant receiver (Eastern Coastal catchment)
WTG model Predicted LCeq, 10 minute noise level
XANT M21 50 Vergnet MP-C LNn 52 Vergnet MP-C 56 Low frequency noise criterion - day 65 Low frequency noise criterion - night 60
6.3.3 Infrasound
Infrasound is very low frequency noise from a fraction of a hertz up to around 20 Hz (as defined in ISO 7196-2: 1995, Acoustics – Frequency weighting characteristics for infrasound measurements).
There are no widely accepted assessment criteria for potential annoyance due to infrasound, and assessments are usually undertaken based on a threshold of perception. For example, IEC 61400-11, the Standard used for the measurement of WTG sound power levels, recommends that a G-weighted sound pressure level, as per ISO 7196: 1995, should be used when assessing infrasound noise against human perception.
20
The G-weighting curve is used to quantify sound that has a large portion of its energy in the infrasonic range, with reference to frequencies between 0.25 Hz and 315 Hz. ISO 7196 states that sound pressure levels below 90 dB(G) would not normally be significant for human perception.
In Australia, the Draft Queensland Department of Environment and Resource Management’s (2004) EcoAccess Guideline – Assessment of low frequency noise recommends an internal noise limit of 85 dB(G) for dwellings. A criterion of 85 dB(G) is lower than the mean hearing threshold up to a frequency of 20 Hz and is comparatively stringent relative to criteria from other overseas jurisdictions. Hence, where predicted WTG noise levels fall below 85 dB(G) inside a dwelling, they are not likely to be perceived by the occupants.
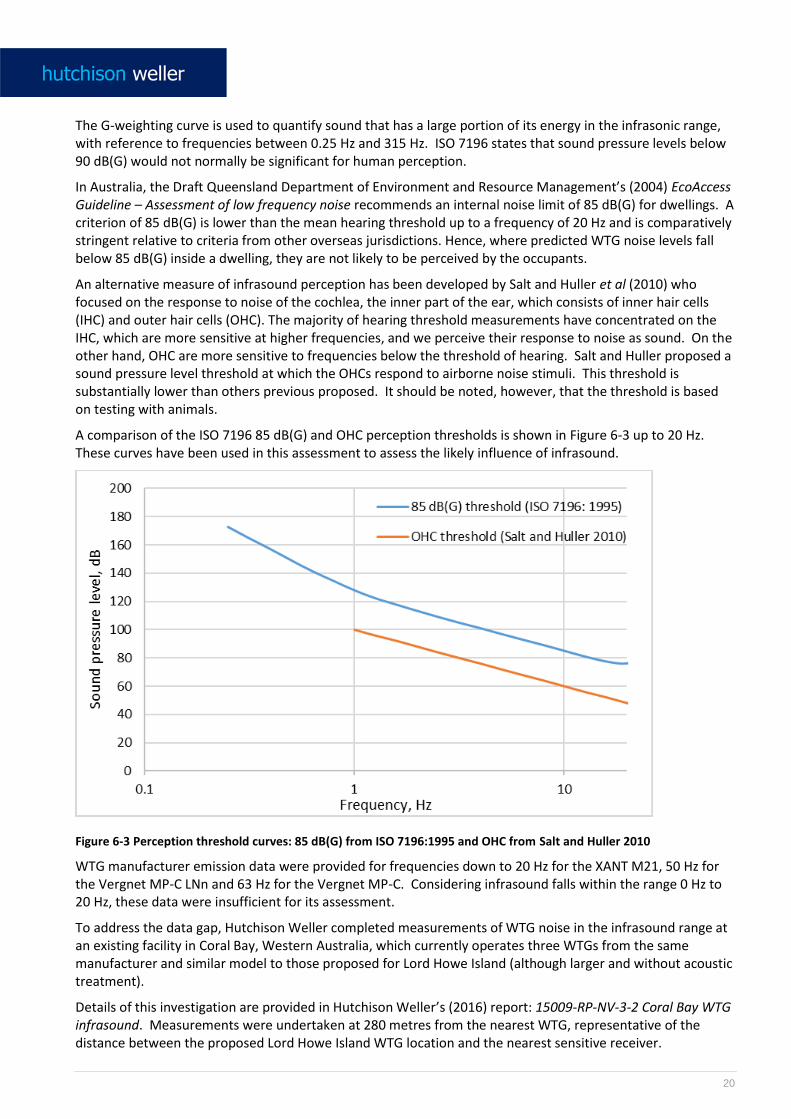
An alternative measure of infrasound perception has been developed by Salt and Huller et al (2010) who focused on the response to noise of the cochlea, the inner part of the ear, which consists of inner hair cells (IHC) and outer hair cells (OHC). The majority of hearing threshold measurements have concentrated on the IHC, which are more sensitive at higher frequencies, and we perceive their response to noise as sound. On the other hand, OHC are more sensitive to frequencies below the threshold of hearing. Salt and Huller proposed a sound pressure level threshold at which the OHCs respond to airborne noise stimuli. This threshold is substantially lower than others previous proposed. It should be noted, however, that the threshold is based on testing with animals.
A comparison of the ISO 7196 85 dB(G) and OHC perception thresholds is shown in Figure 6-3 up to 20 Hz. These curves have been used in this assessment to assess the likely influence of infrasound.
Figure 6-3 Perception threshold curves: 85 dB(G) from ISO 7196:1995 and OHC from Salt and Huller 2010
WTG manufacturer emission data were provided for frequencies down to 20 Hz for the XANT M21, 50 Hz for the Vergnet MP-C LNn and 63 Hz for the Vergnet MP-C. Considering infrasound falls within the range 0 Hz to 20 Hz, these data were insufficient for its assessment.
To address the data gap, Hutchison Weller completed measurements of WTG noise in the infrasound range at an existing facility in Coral Bay, Western Australia, which currently operates three WTGs from the same manufacturer and similar model to those proposed for Lord Howe Island (although larger and without acoustic treatment).
Details of this investigation are provided in Hutchison Weller’s (2016) report: 15009-RP-NV-3-2 Coral Bay WTG infrasound. Measurements were undertaken at 280 metres from the nearest WTG, representative of the distance between the proposed Lord Howe Island WTG location and the nearest sensitive receiver.
21
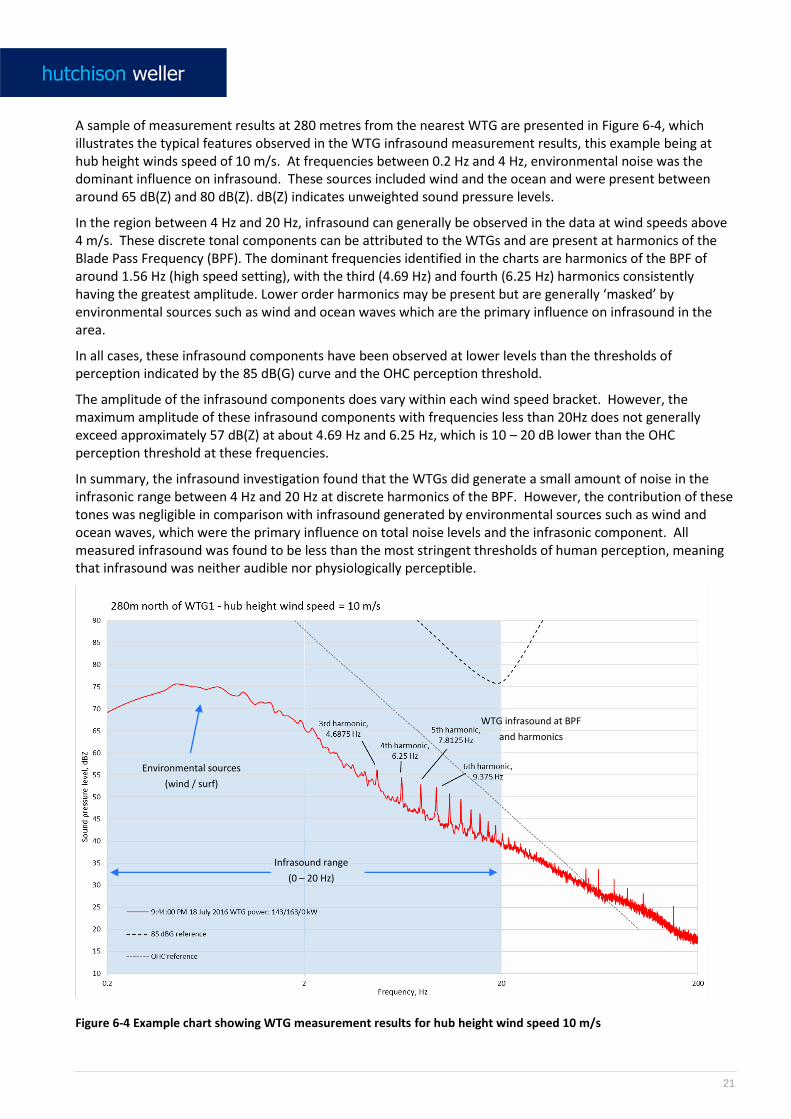
A sample of measurement results at 280 metres from the nearest WTG are presented in Figure 6-4, which illustrates the typical features observed in the WTG infrasound measurement results, this example being at hub height winds speed of 10 m/s. At frequencies between 0.2 Hz and 4 Hz, environmental noise was the dominant influence on infrasound. These sources included wind and the ocean and were present between around 65 dB(Z) and 80 dB(Z). dB(Z) indicates unweighted sound pressure levels.
In the region between 4 Hz and 20 Hz, infrasound can generally be observed in the data at wind speeds above 4 m/s. These discrete tonal components can be attributed to the WTGs and are present at harmonics of the Blade Pass Frequency (BPF). The dominant frequencies identified in the charts are harmonics of the BPF of around 1.56 Hz (high speed setting), with the third (4.69 Hz) and fourth (6.25 Hz) harmonics consistently having the greatest amplitude. Lower order harmonics may be present but are generally ‘masked’ by environmental sources such as wind and ocean waves which are the primary influence on infrasound in the area.
In all cases, these infrasound components have been observed at lower levels than the thresholds of perception indicated by the 85 dB(G) curve and the OHC perception threshold.
The amplitude of the infrasound components does vary within each wind speed bracket. However, the maximum amplitude of these infrasound components with frequencies less than 20Hz does not generally exceed approximately 57 dB(Z) at about 4.69 Hz and 6.25 Hz, which is 10 – 20 dB lower than the OHC perception threshold at these frequencies.
In summary, the infrasound investigation found that the WTGs did generate a small amount of noise in the infrasonic range between 4 Hz and 20 Hz at discrete harmonics of the BPF. However, the contribution of these tones was negligible in comparison with infrasound generated by environmental sources such as wind and ocean waves, which were the primary influence on total noise levels and the infrasonic component. All measured infrasound was found to be less than the most stringent thresholds of human perception, meaning that infrasound was neither audible nor physiologically perceptible.
Figure 6-4 Example chart showing WTG measurement results for hub height wind speed 10 m/s
Environmental sources
(wind / surf)
WTG infrasound at BPF
and harmonics
Infrasound range
(0 – 20 Hz)
22
7. Contingency strategy
Where it is demonstrated through compliance monitoring during commissioning of the WTGs or in response to a complaint, that the WTGs exceed noise predicted noise levels at the relevant criteria, noise management strategies may be considered. The specific management strategy adopted would depend on the conditions which cause the exceedances and should be appropriately investigated.
Options include:
Identify the conditions and times that lead to undue impacts.
Turn off one or both WTGs that are identified as causing undue impacts during specific conditions (wind directions and strengths), a mitigation process called sector management.
Consult with the manufacturer to identify noise control options of the turbines such as:
- variable speed;
- changes to the pitch regulation regime;
- vortex generators and/or
- trailing edge serrations.
Negotiate with affected property owners.
Appendix A. WTG supplier sound power data
Appendix B. Relevant receivers
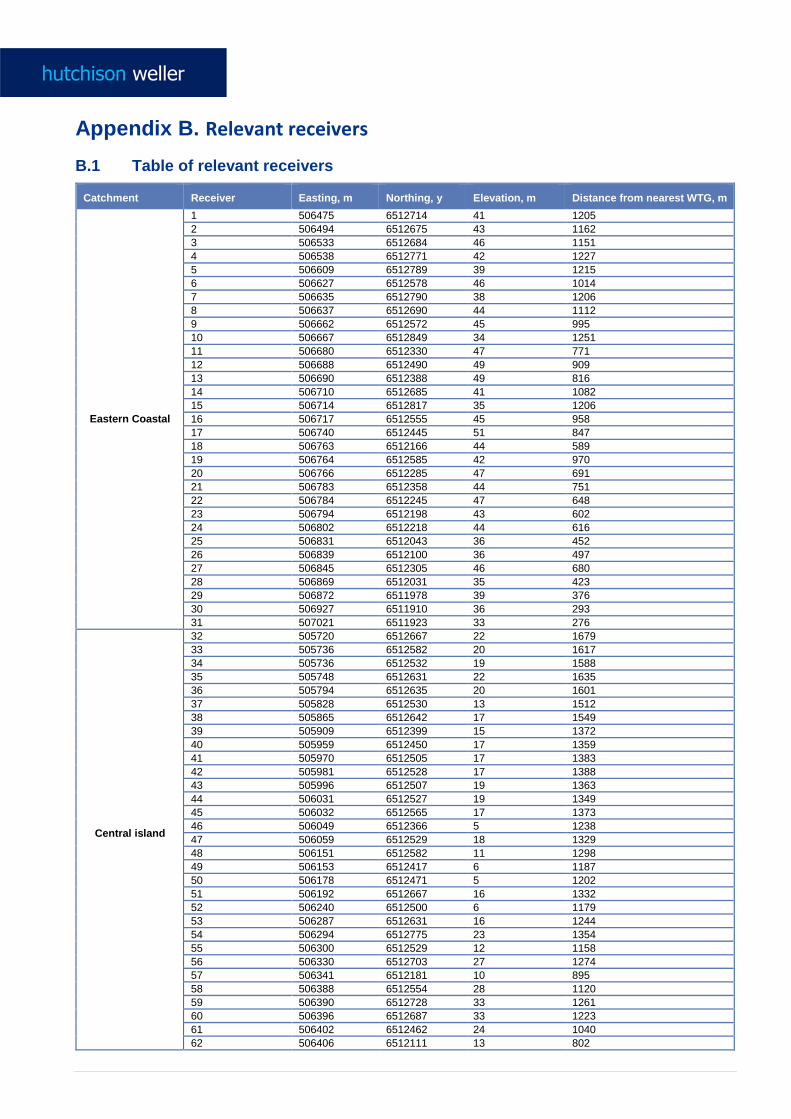
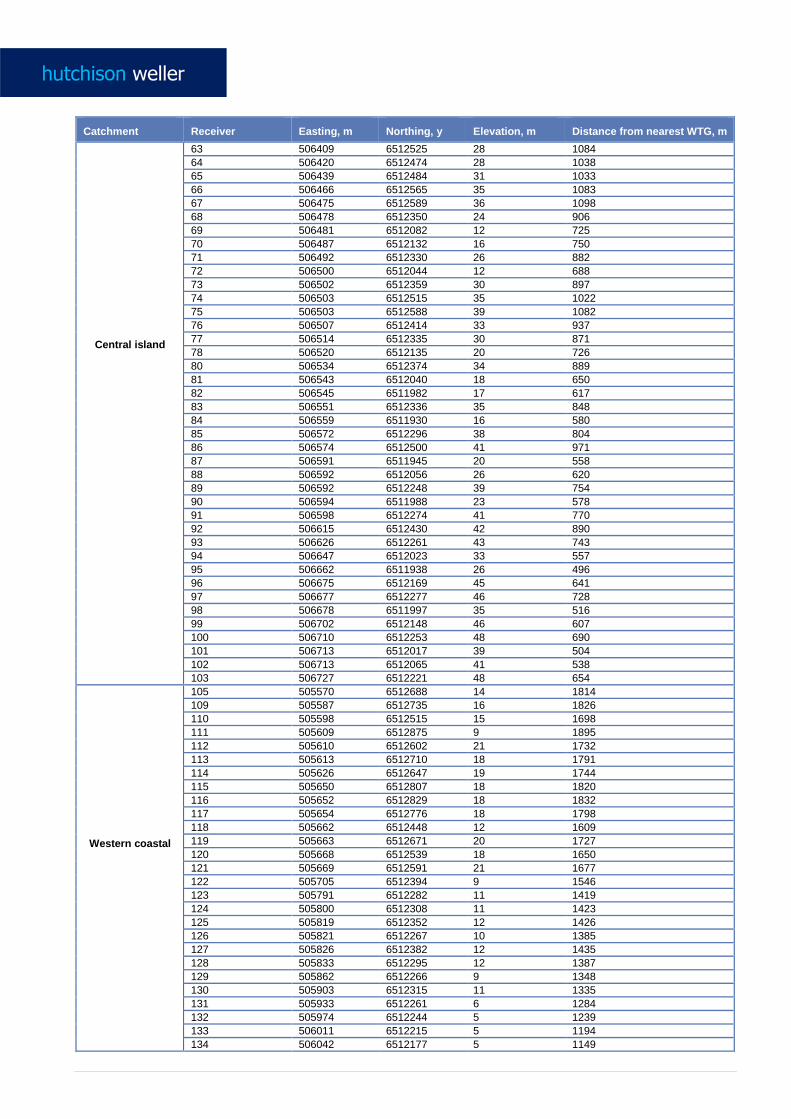
B.1 Table of relevant receivers
Catchment Receiver Easting, m Northing, y Elevation, m Distance from nearest WTG, m
Eastern Coastal
1 506475 6512714 41 1205
2 506494 6512675 43 1162
3 506533 6512684 46 1151
4 506538 6512771 42 1227
5 506609 6512789 39 1215
6 506627 6512578 46 1014
7 506635 6512790 38 1206
8 506637 6512690 44 1112
9 506662 6512572 45 995
10 506667 6512849 34 1251
11 506680 6512330 47 771
12 506688 6512490 49 909
13 506690 6512388 49 816
14 506710 6512685 41 1082
15 506714 6512817 35 1206
16 506717 6512555 45 958
17 506740 6512445 51 847
18 506763 6512166 44 589
19 506764 6512585 42 970
20 506766 6512285 47 691
21 506783 6512358 44 751
22 506784 6512245 47 648
23 506794 6512198 43 602
24 506802 6512218 44 616
25 506831 6512043 36 452
26 506839 6512100 36 497
27 506845 6512305 46 680
28 506869 6512031 35 423
29 506872 6511978 39 376
30 506927 6511910 36 293
31 507021 6511923 33 276
Central island
32 505720 6512667 22 1679
33 505736 6512582 20 1617
34 505736 6512532 19 1588
35 505748 6512631 22 1635
36 505794 6512635 20 1601
37 505828 6512530 13 1512
38 505865 6512642 17 1549
39 505909 6512399 15 1372
40 505959 6512450 17 1359
41 505970 6512505 17 1383
42 505981 6512528 17 1388
43 505996 6512507 19 1363
44 506031 6512527 19 1349
45 506032 6512565 17 1373
46 506049 6512366 5 1238
47 506059 6512529 18 1329
48 506151 6512582 11 1298
49 506153 6512417 6 1187
50 506178 6512471 5 1202
51 506192 6512667 16 1332
52 506240 6512500 6 1179
53 506287 6512631 16 1244
54 506294 6512775 23 1354
55 506300 6512529 12 1158
56 506330 6512703 27 1274
57 506341 6512181 10 895
58 506388 6512554 28 1120
59 506390 6512728 33 1261
60 506396 6512687 33 1223
61 506402 6512462 24 1040
62 506406 6512111 13 802
Catchment Receiver Easting, m Northing, y Elevation, m Distance from nearest WTG, m
Central island
63 506409 6512525 28 1084
64 506420 6512474 28 1038
65 506439 6512484 31 1033
66 506466 6512565 35 1083
67 506475 6512589 36 1098
68 506478 6512350 24 906
69 506481 6512082 12 725
70 506487 6512132 16 750
71 506492 6512330 26 882
72 506500 6512044 12 688
73 506502 6512359 30 897
74 506503 6512515 35 1022
75 506503 6512588 39 1082
76 506507 6512414 33 937
77 506514 6512335 30 871
78 506520 6512135 20 726
80 506534 6512374 34 889
81 506543 6512040 18 650
82 506545 6511982 17 617
83 506551 6512336 35 848
84 506559 6511930 16 580
85 506572 6512296 38 804
86 506574 6512500 41 971
87 506591 6511945 20 558
88 506592 6512056 26 620
89 506592 6512248 39 754
90 506594 6511988 23 578
91 506598 6512274 41 770
92 506615 6512430 42 890
93 506626 6512261 43 743
94 506647 6512023 33 557
95 506662 6511938 26 496
96 506675 6512169 45 641
97 506677 6512277 46 728
98 506678 6511997 35 516
99 506702 6512148 46 607
100 506710 6512253 48 690
101 506713 6512017 39 504
102 506713 6512065 41 538
103 506727 6512221 48 654
Western coastal
105 505570 6512688 14 1814
109 505587 6512735 16 1826
110 505598 6512515 15 1698
111 505609 6512875 9 1895
112 505610 6512602 21 1732
113 505613 6512710 18 1791
114 505626 6512647 19 1744
115 505650 6512807 18 1820
116 505652 6512829 18 1832
117 505654 6512776 18 1798
118 505662 6512448 12 1609
119 505663 6512671 20 1727
120 505668 6512539 18 1650
121 505669 6512591 21 1677
122 505705 6512394 9 1546
123 505791 6512282 11 1419
124 505800 6512308 11 1423
125 505819 6512352 12 1426
126 505821 6512267 10 1385
127 505826 6512382 12 1435
128 505833 6512295 12 1387
129 505862 6512266 9 1348
130 505903 6512315 11 1335
131 505933 6512261 6 1284
132 505974 6512244 5 1239
133 506011 6512215 5 1194
134 506042 6512177 5 1149
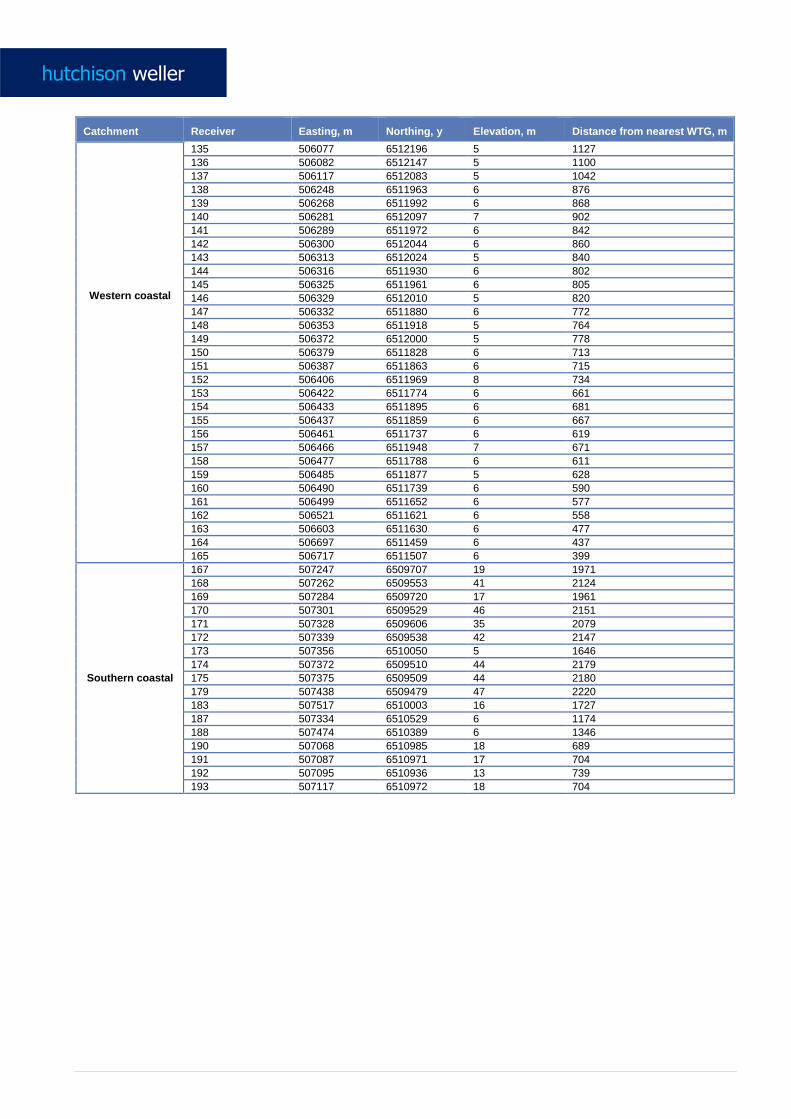
Catchment Receiver Easting, m Northing, y Elevation, m Distance from nearest WTG, m
Western coastal
135 506077 6512196 5 1127
136 506082 6512147 5 1100
137 506117 6512083 5 1042
138 506248 6511963 6 876
139 506268 6511992 6 868
140 506281 6512097 7 902
141 506289 6511972 6 842
142 506300 6512044 6 860
143 506313 6512024 5 840
144 506316 6511930 6 802
145 506325 6511961 6 805
146 506329 6512010 5 820
147 506332 6511880 6 772
148 506353 6511918 5 764
149 506372 6512000 5 778
150 506379 6511828 6 713
151 506387 6511863 6 715
152 506406 6511969 8 734
153 506422 6511774 6 661
154 506433 6511895 6 681
155 506437 6511859 6 667
156 506461 6511737 6 619
157 506466 6511948 7 671
158 506477 6511788 6 611
159 506485 6511877 5 628
160 506490 6511739 6 590
161 506499 6511652 6 577
162 506521 6511621 6 558
163 506603 6511630 6 477
164 506697 6511459 6 437
165 506717 6511507 6 399
Southern coastal
167 507247 6509707 19 1971
168 507262 6509553 41 2124
169 507284 6509720 17 1961
170 507301 6509529 46 2151
171 507328 6509606 35 2079
172 507339 6509538 42 2147
173 507356 6510050 5 1646
174 507372 6509510 44 2179
175 507375 6509509 44 2180
179 507438 6509479 47 2220
183 507517 6510003 16 1727
187 507334 6510529 6 1174
188 507474 6510389 6 1346
190 507068 6510985 18 689
191 507087 6510971 17 704
192 507095 6510936 13 739
193 507117 6510972 18 704
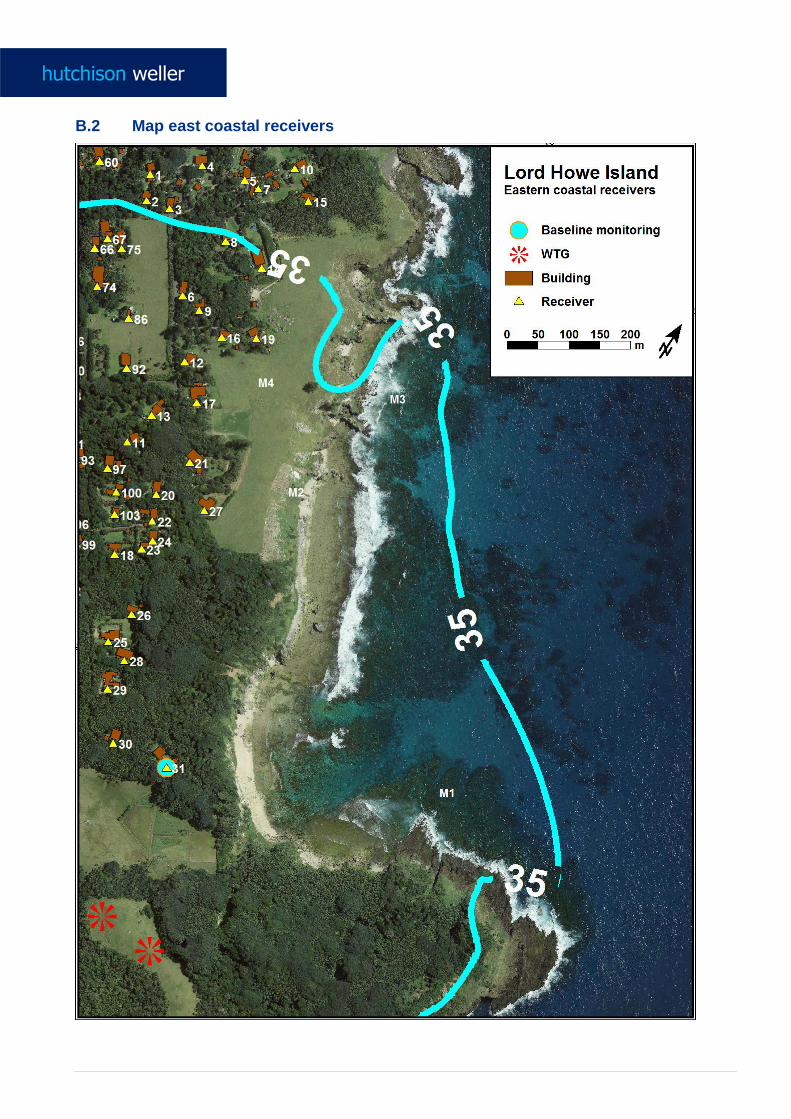
B.2 Map east coastal receivers
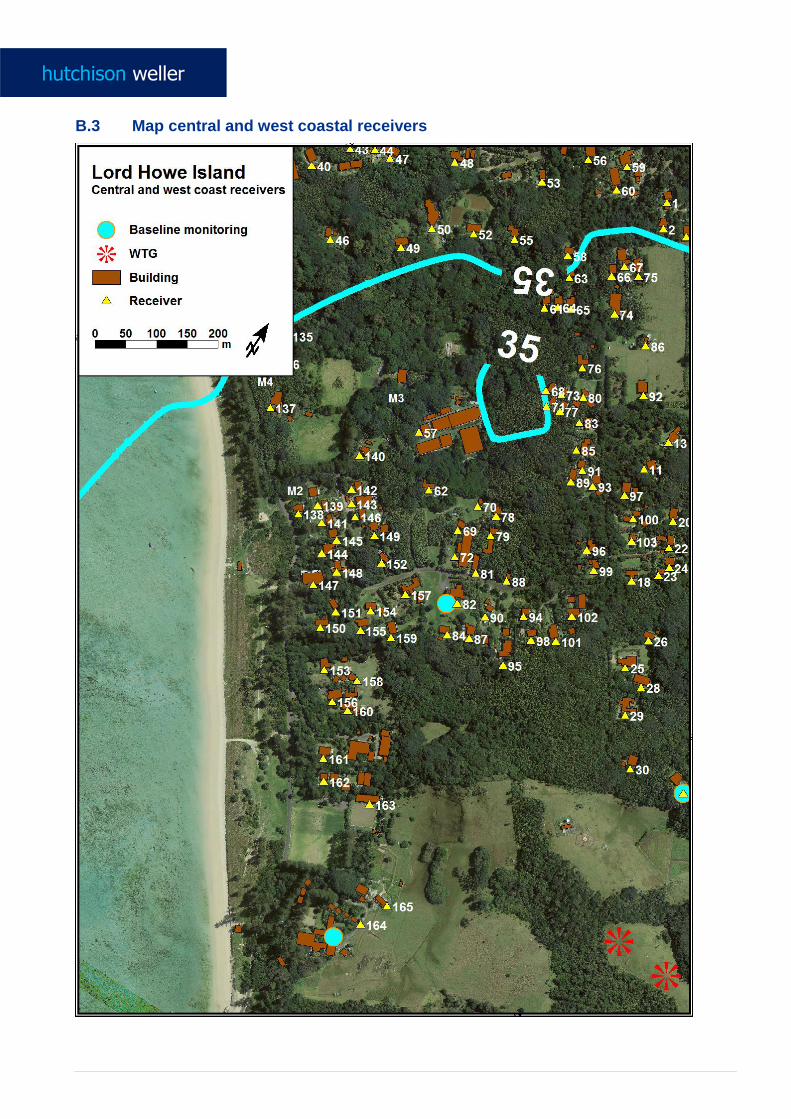
B.3 Map central and west coastal receivers
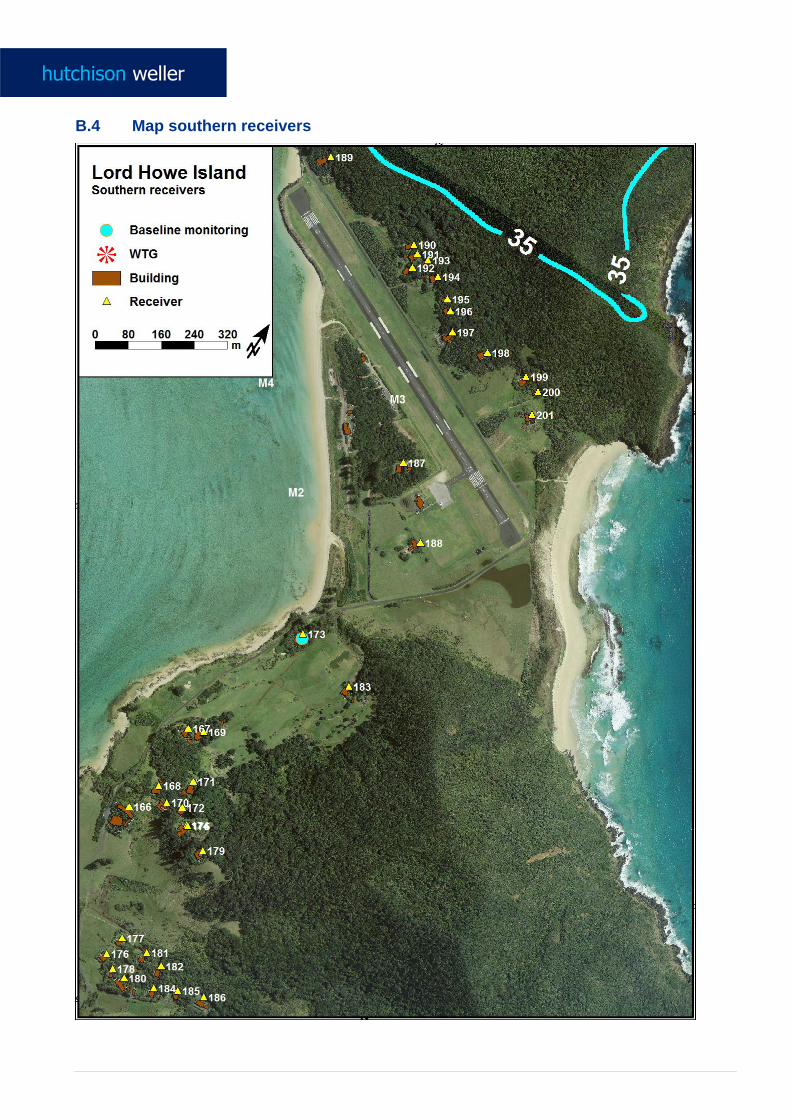
B.4 Map southern receivers
Appendix C. Seasonal wind roses, Lord Howe Airport
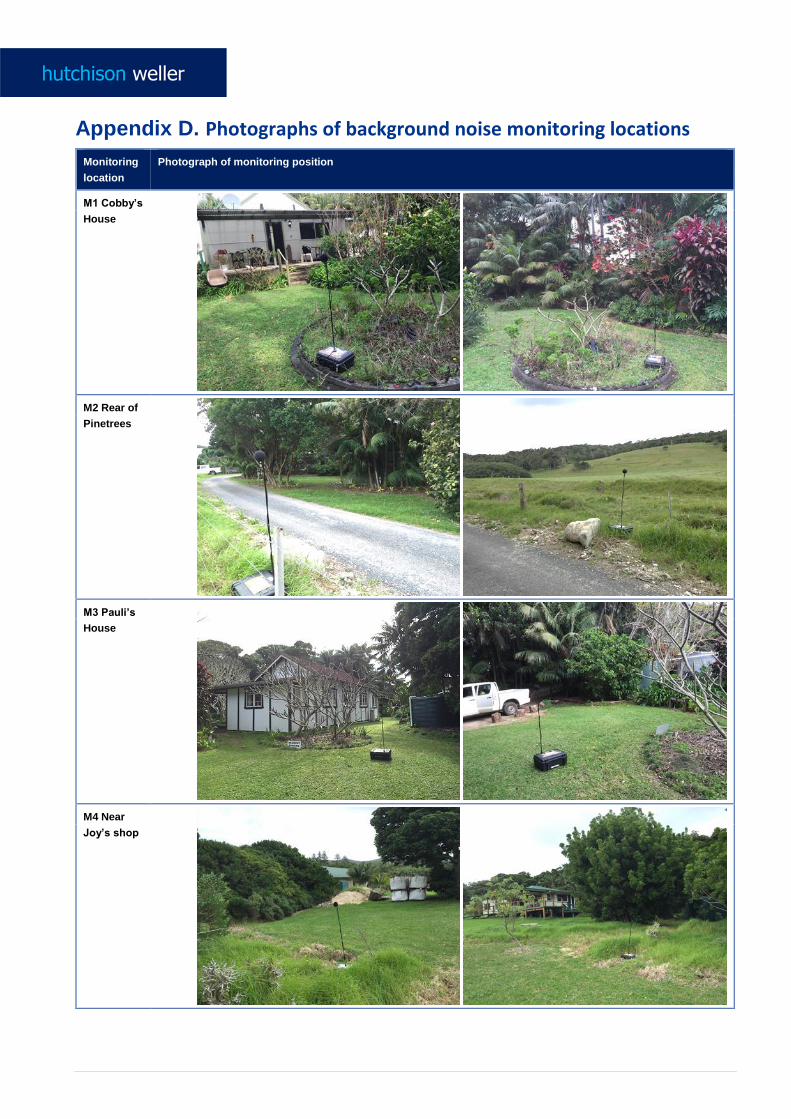
Appendix D. Photographs of background noise monitoring locations
Monitoring
location
Photograph of monitoring position
M1 Cobby’s
House
M2 Rear of
Pinetrees
M3 Pauli’s
House
M4 Near
Joy’s shop

Appendix E. Operator attended monitoring observations
E.1 Summer survey
Monitoring
location
Recorded 15 minute
noise parameters
Time Observations
LA90 LAeq
M1 Cobby’s
House
41 51 3:50 pm Conditions: Calm, Partly cloudy, around 28°C.
Cicadas in the trees dominant when active in the daytime
(LAeq ~54 dB(A) at 4 - 6kHz)
When cicadas silent, wave noise and occasional car passing ~40 dB(A)
34 39 10:20 pm Conditions: very light breeze from east, calm and partly cloudy, ~21°C.
Lapping of waves on beach
Some insects (not cicadas)
Distant waves
A little breeze in the trees
M2 Rear of
Pinetrees
41 45 4:50 pm Conditions: Light easterly breeze, partly cloudy
Breeze in trees is dominant when it fills in.
Laundry/chiller facilities are audible (part of local noise feature)
Distant cicadas (~40 dB(A) at 4 – 6 kHz)
General accommodation noise eg voices, banging, laughter
35 38 10:45 pm Conditions: very light breeze from E/ESE, partly cloudy, ~21°C.
Distant power station audible in east if wind drops out
Crickets
Laundry building fans / chiller including just audible 100 Hz tone
Breeze picks up from time to time - noise from rustling of leaves and
branches in trees
M3 Pauli’s
House
44 52 5:35 pm Conditions: Gentle easterly breeze, Partly cloudy, ~ 26°C.
Site is surrounded by trees.
Surf quite audible to east, laying a continuous baseline of noise
Birds in trees ~40 dB(A) at 2 – 3 kHz
A little local traffic
Nearby diesel power station inaudible
42 45 11:34 pm Conditions: very light breeze from east, calm and partly cloudy, ~21°C.
Waves dominant – continuous broadband noise ~42 dB(A)
Some breeze in trees
Birds
Power station not audible over waves and breeze
M4 Near Joy’s
shop
45 53 9:33 am Conditions: Gentle E/NE breeze, partly cloudy, ~23°C
Open space tree-fringed
Joy’s shop nearby – no audible chillers
Cicadas in trees ~50-52 dB(A) at 2-3 kHz
Breeze in trees when it picks up
A little local traffic
Distant waves when wind is calm
36 38 11:05 pm Conditions: very light breeze from E/SE, partly cloudy, ~21°C.
Some breeze in palms
Distant waves
Insects
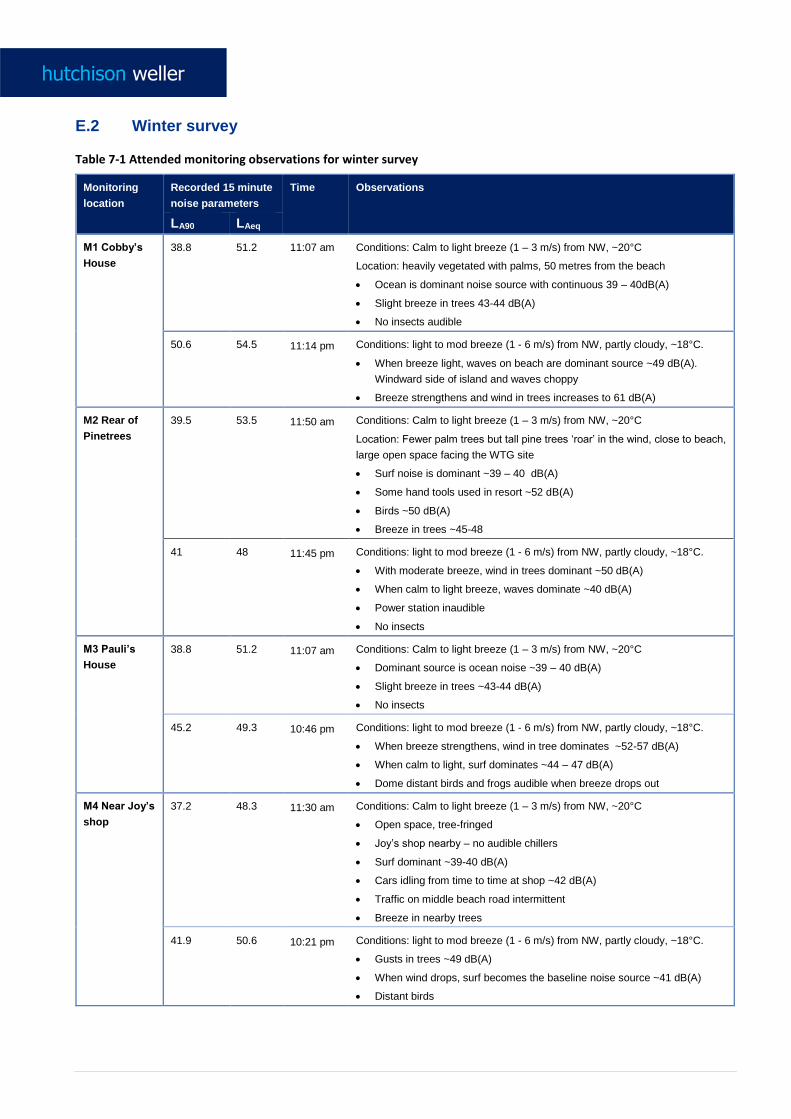
E.2 Winter survey
Table 7-1 Attended monitoring observations for winter survey
Monitoring
location
Recorded 15 minute
noise parameters
Time Observations
LA90 LAeq
M1 Cobby’s
House
38.8 51.2 11:07 am Conditions: Calm to light breeze (1 – 3 m/s) from NW, ~20°C
Location: heavily vegetated with palms, 50 metres from the beach
Ocean is dominant noise source with continuous 39 – 40dB(A)
Slight breeze in trees 43-44 dB(A)
No insects audible
50.6 54.5 11:14 pm Conditions: light to mod breeze (1 - 6 m/s) from NW, partly cloudy, ~18°C.
When breeze light, waves on beach are dominant source ~49 dB(A).
Windward side of island and waves choppy
Breeze strengthens and wind in trees increases to 61 dB(A)
M2 Rear of
Pinetrees
39.5 53.5 11:50 am Conditions: Calm to light breeze (1 – 3 m/s) from NW, ~20°C
Location: Fewer palm trees but tall pine trees ‘roar’ in the wind, close to beach,
large open space facing the WTG site
Surf noise is dominant ~39 – 40 dB(A)
Some hand tools used in resort ~52 dB(A)
Birds ~50 dB(A)
Breeze in trees ~45-48
41 48 11:45 pm Conditions: light to mod breeze (1 - 6 m/s) from NW, partly cloudy, ~18°C.
With moderate breeze, wind in trees dominant ~50 dB(A)
When calm to light breeze, waves dominate ~40 dB(A)
Power station inaudible
No insects
M3 Pauli’s
House
38.8 51.2 11:07 am Conditions: Calm to light breeze (1 – 3 m/s) from NW, ~20°C
Dominant source is ocean noise ~39 – 40 dB(A)
Slight breeze in trees ~43-44 dB(A)
No insects
45.2 49.3 10:46 pm Conditions: light to mod breeze (1 - 6 m/s) from NW, partly cloudy, ~18°C.
When breeze strengthens, wind in tree dominates ~52-57 dB(A)
When calm to light, surf dominates ~44 – 47 dB(A)
Dome distant birds and frogs audible when breeze drops out
M4 Near Joy’s
shop
37.2 48.3 11:30 am Conditions: Calm to light breeze (1 – 3 m/s) from NW, ~20°C
Open space, tree-fringed
Joy’s shop nearby – no audible chillers
Surf dominant ~39-40 dB(A)
Cars idling from time to time at shop ~42 dB(A)
Traffic on middle beach road intermittent
Breeze in nearby trees
41.9 50.6 10:21 pm Conditions: light to mod breeze (1 - 6 m/s) from NW, partly cloudy, ~18°C.
Gusts in trees ~49 dB(A)
When wind drops, surf becomes the baseline noise source ~41 dB(A)
Distant birds
Appendix F. Background noise and wind data analysis (all hours)
F.1 Summer
F.2 Winter
Appendix G. Derived noise criteria and predicted noise levels (all hours)
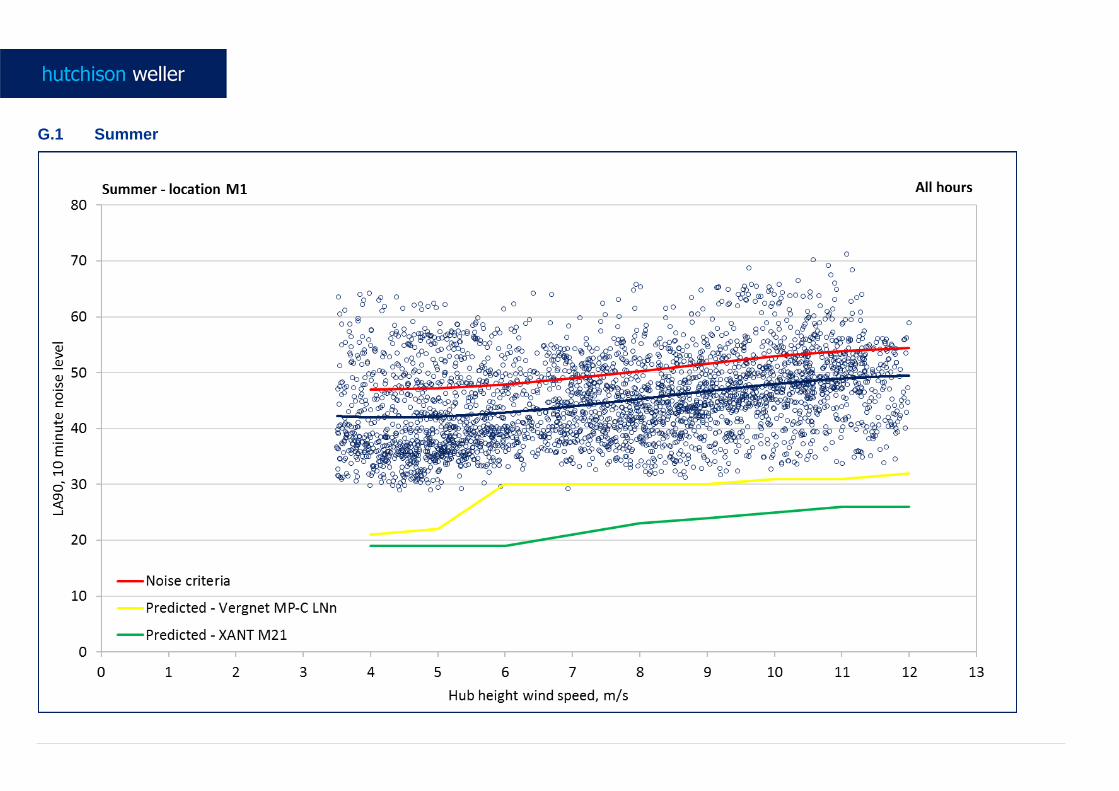
G.1 Summer
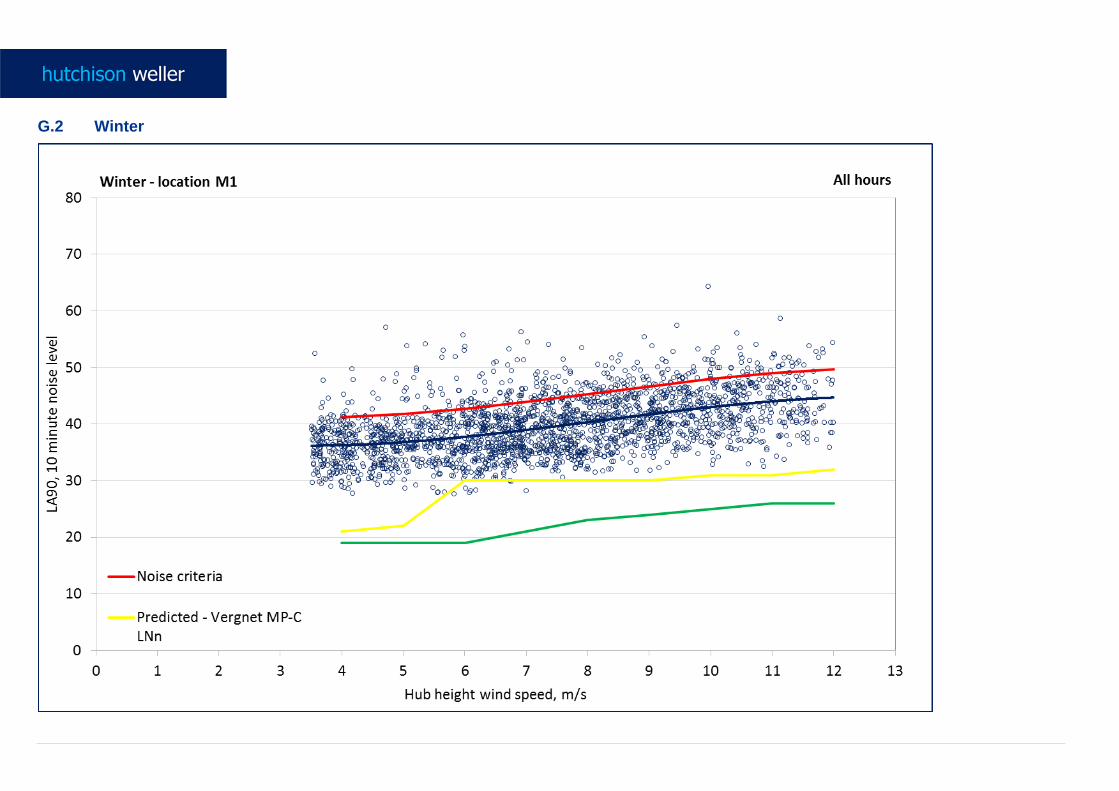
G.2 Winter
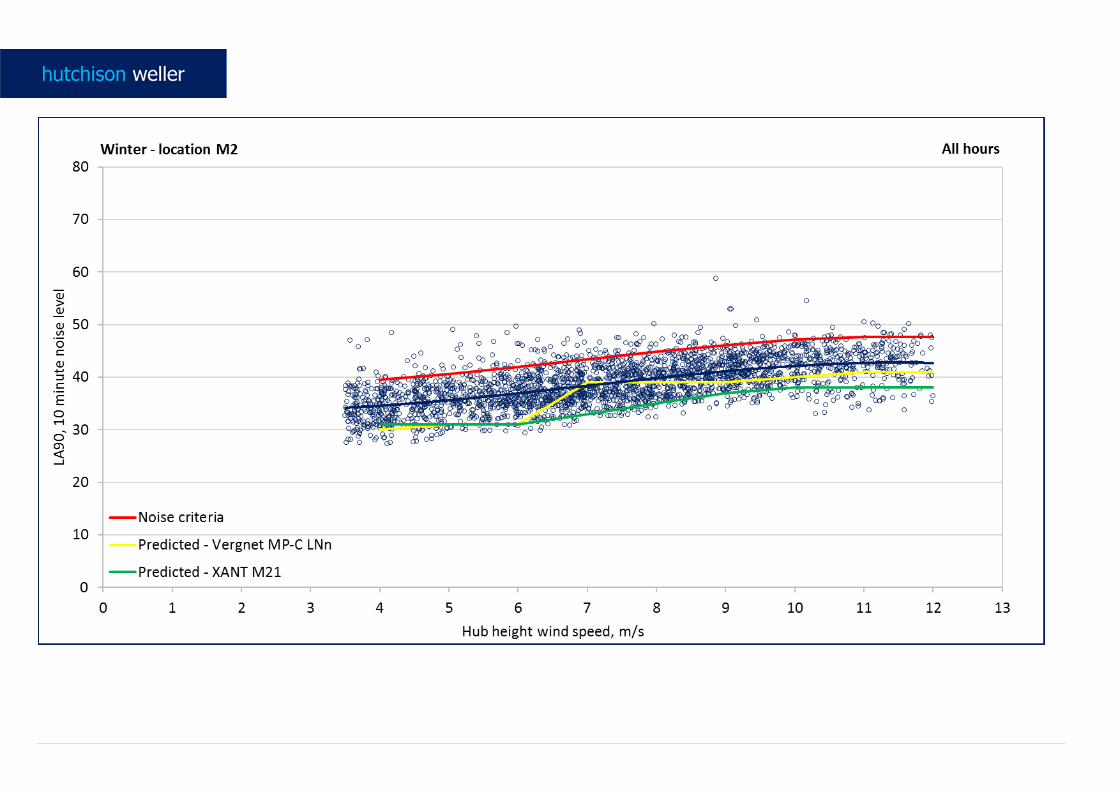
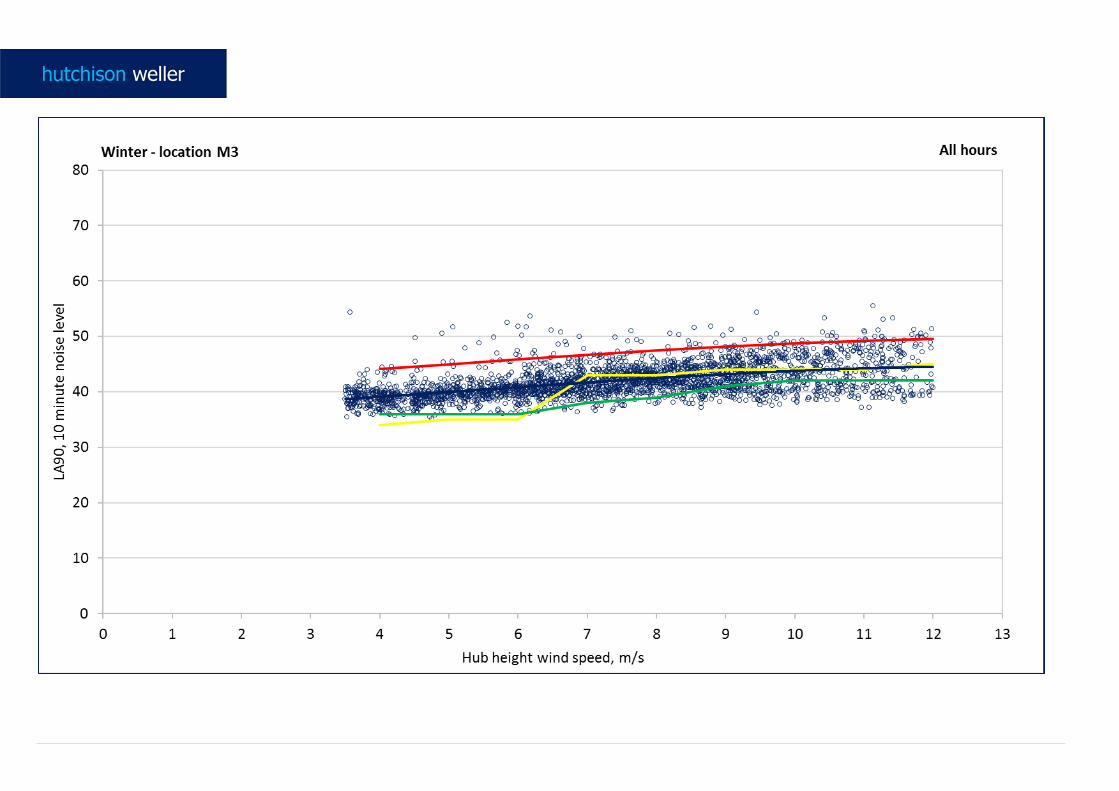
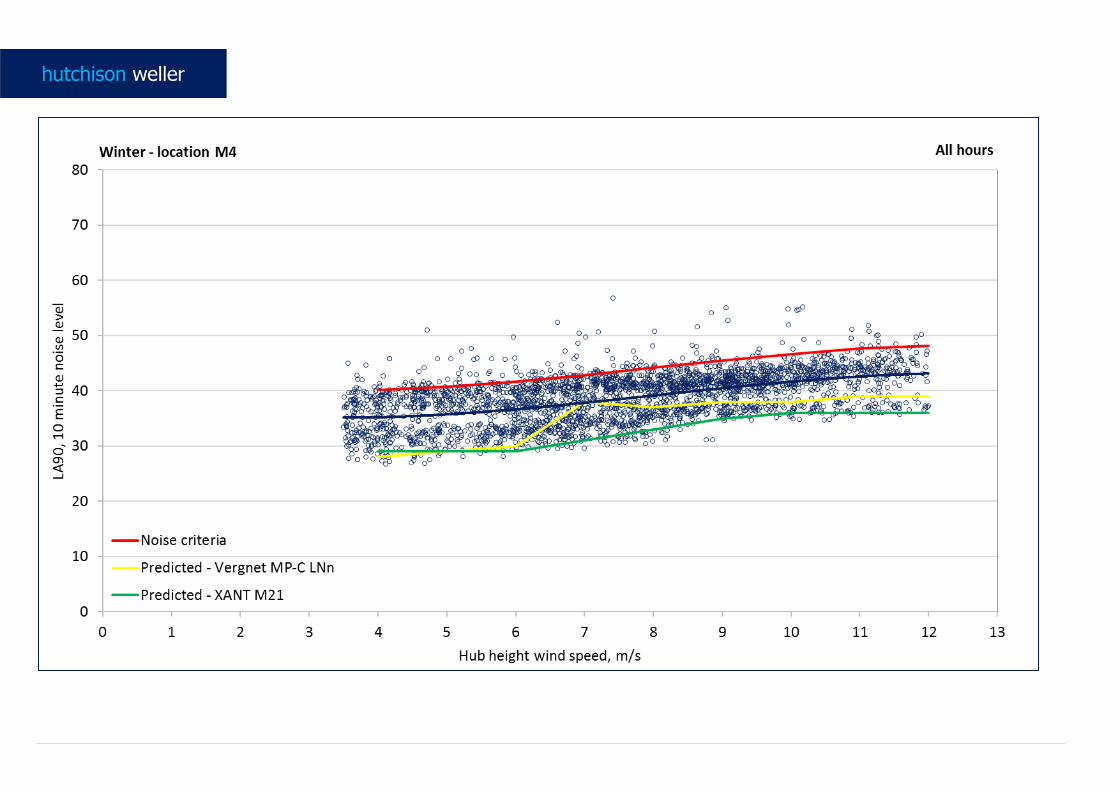
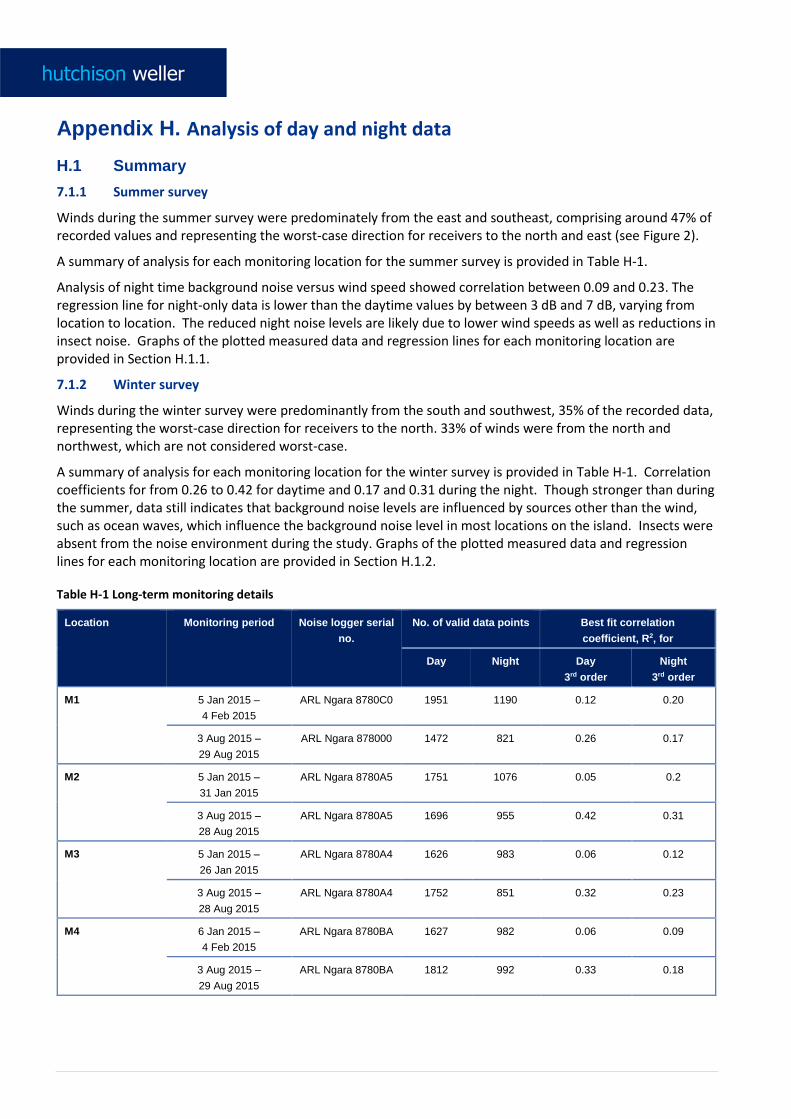
Appendix H. Analysis of day and night data
H.1 Summary
7.1.1 Summer survey
Winds during the summer survey were predominately from the east and southeast, comprising around 47% of recorded values and representing the worst-case direction for receivers to the north and east (see Figure 2).
A summary of analysis for each monitoring location for the summer survey is provided in Table H-1.
Analysis of night time background noise versus wind speed showed correlation between 0.09 and 0.23. The regression line for night-only data is lower than the daytime values by between 3 dB and 7 dB, varying from location to location. The reduced night noise levels are likely due to lower wind speeds as well as reductions in insect noise. Graphs of the plotted measured data and regression lines for each monitoring location are provided in Section H.1.1.
7.1.2 Winter survey
Winds during the winter survey were predominantly from the south and southwest, 35% of the recorded data, representing the worst-case direction for receivers to the north. 33% of winds were from the north and northwest, which are not considered worst-case.
A summary of analysis for each monitoring location for the winter survey is provided in Table H-1. Correlation coefficients for from 0.26 to 0.42 for daytime and 0.17 and 0.31 during the night. Though stronger than during the summer, data still indicates that background noise levels are influenced by sources other than the wind, such as ocean waves, which influence the background noise level in most locations on the island. Insects were absent from the noise environment during the study. Graphs of the plotted measured data and regression lines for each monitoring location are provided in Section H.1.2.
Table H-1 Long-term monitoring details
Location Monitoring period Noise logger serial
no.
No. of valid data points Best fit correlation
coefficient, R2, for
Day Night Day
3rd order
Night
3rd order
M1 5 Jan 2015 –
4 Feb 2015
ARL Ngara 8780C0 1951 1190 0.12 0.20
3 Aug 2015 –
29 Aug 2015
ARL Ngara 878000 1472 821 0.26 0.17
M2 5 Jan 2015 –
31 Jan 2015
ARL Ngara 8780A5 1751 1076 0.05 0.2
3 Aug 2015 –
28 Aug 2015
ARL Ngara 8780A5 1696 955 0.42 0.31
M3 5 Jan 2015 –
26 Jan 2015
ARL Ngara 8780A4 1626 983 0.06 0.12
3 Aug 2015 –
28 Aug 2015
ARL Ngara 8780A4 1752 851 0.32 0.23
M4 6 Jan 2015 –
4 Feb 2015
ARL Ngara 8780BA 1627 982 0.06 0.09
3 Aug 2015 –
29 Aug 2015
ARL Ngara 8780BA 1812 992 0.33 0.18
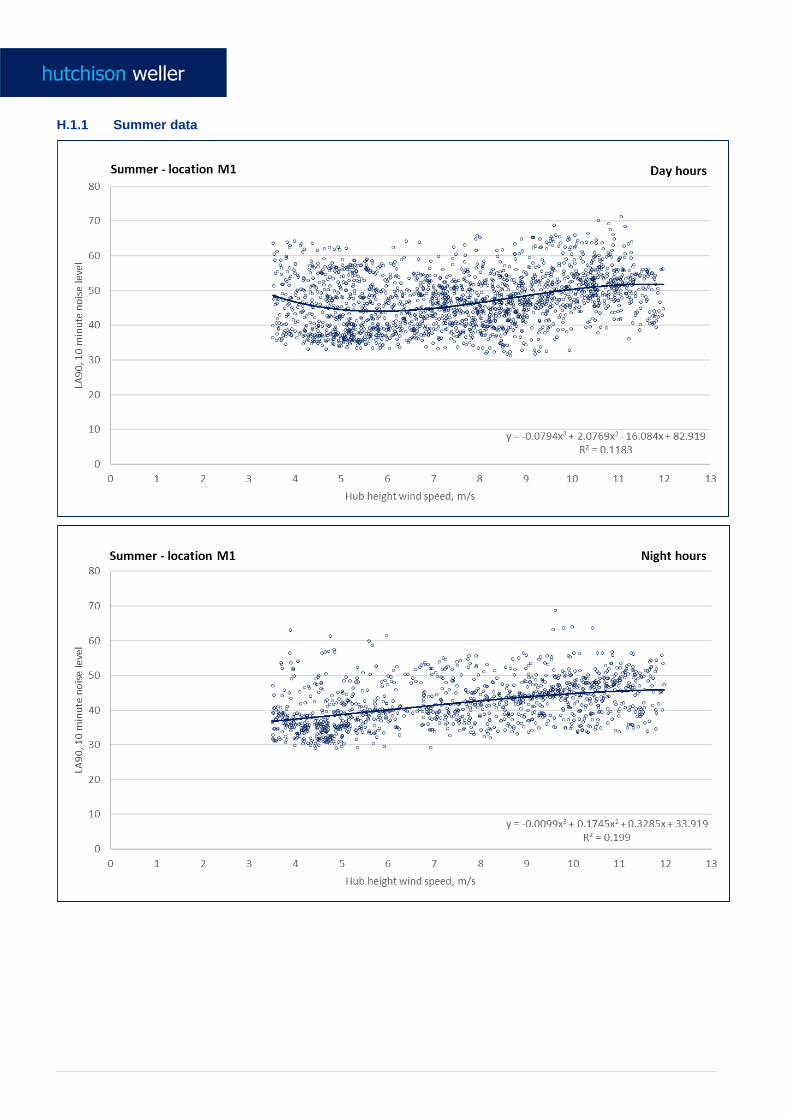
H.1.1 Summer data
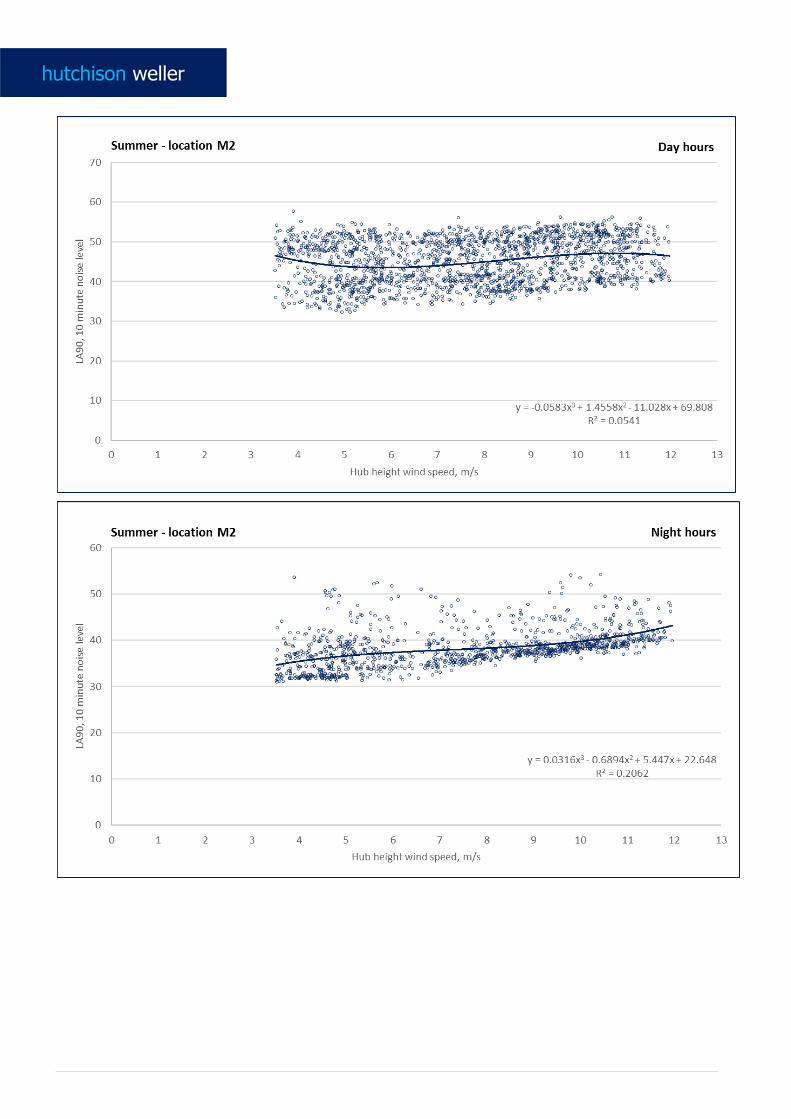
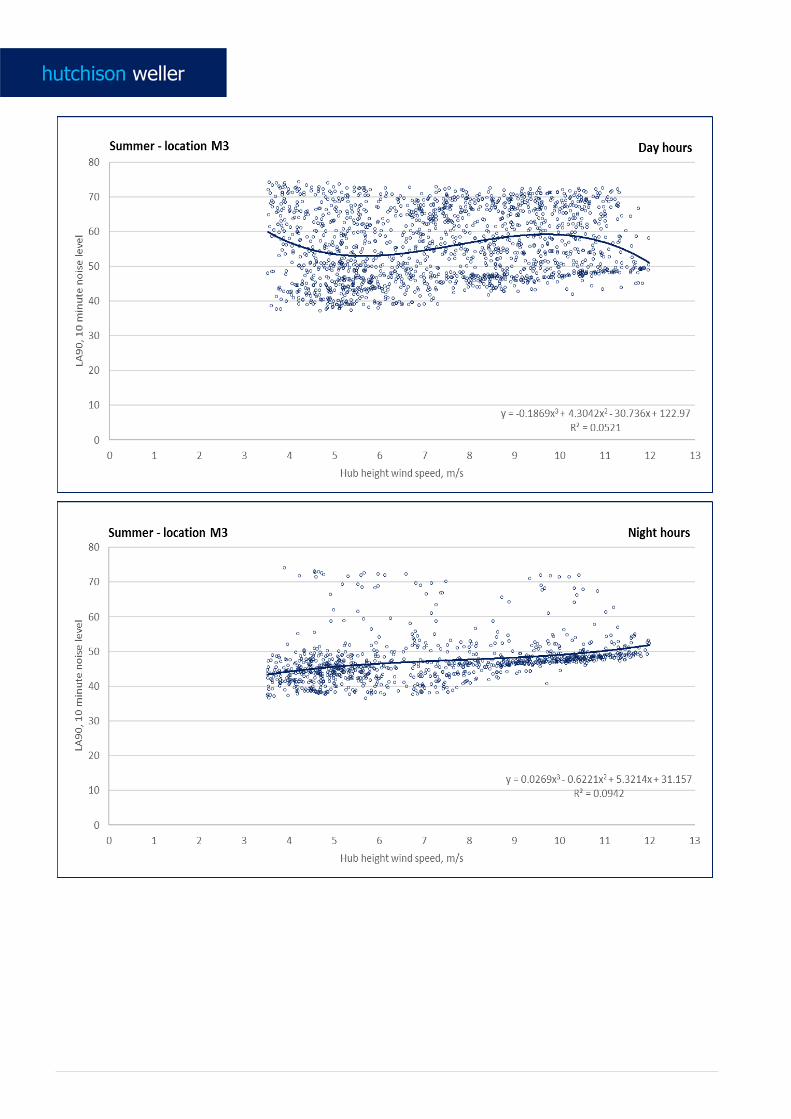
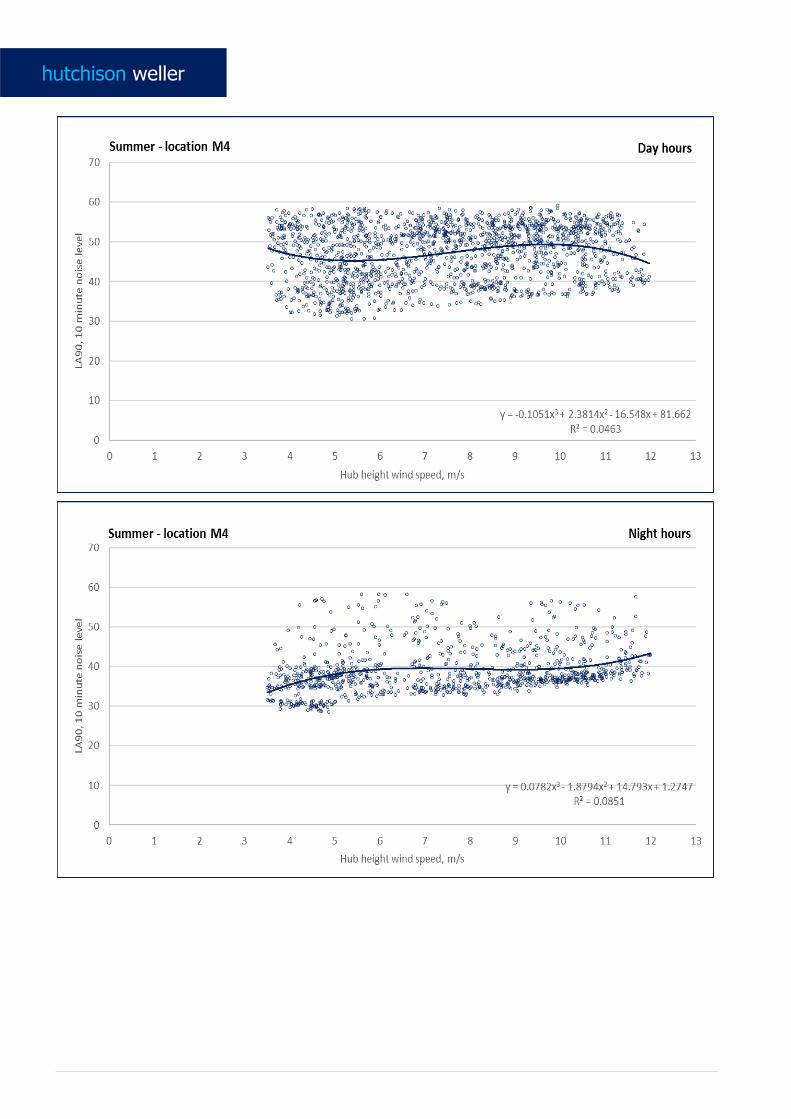
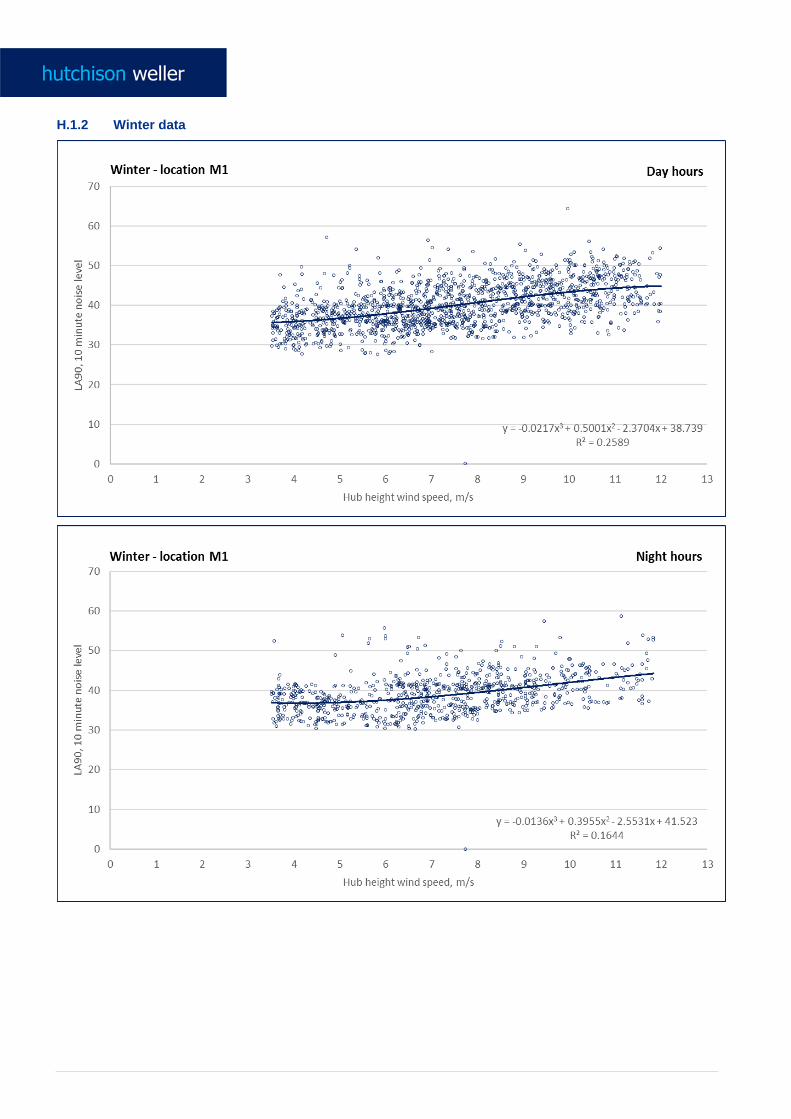
H.1.2 Winter data
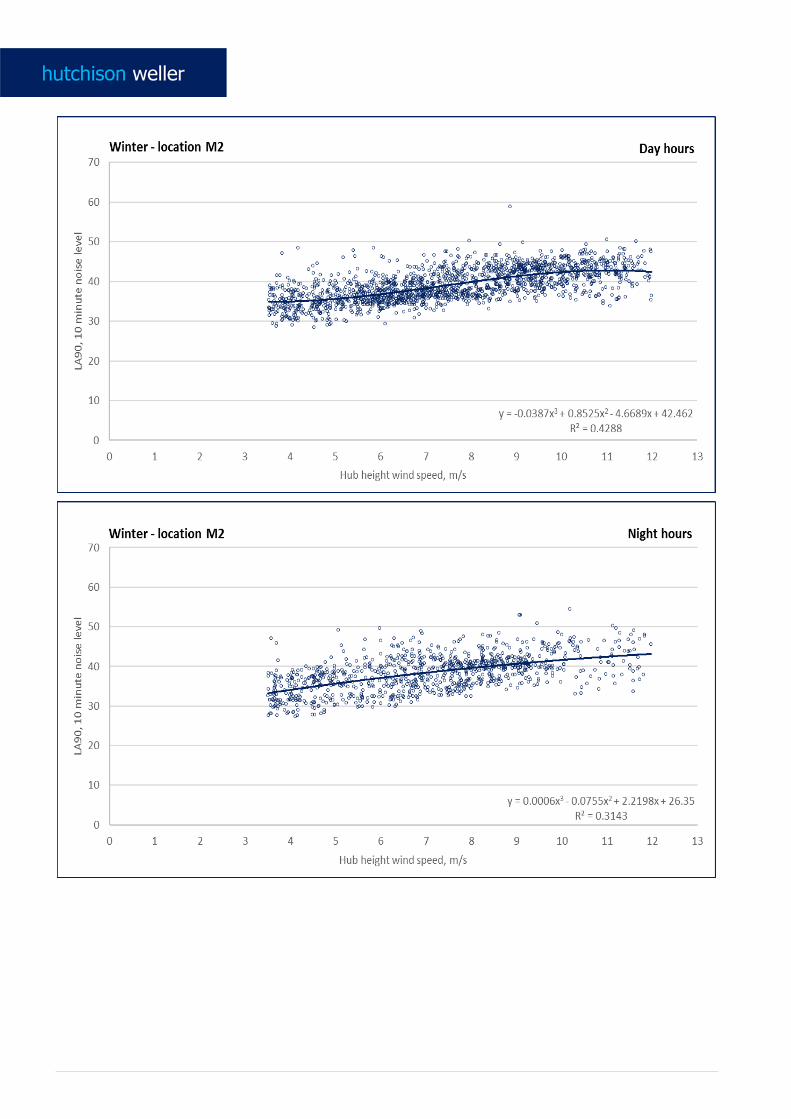
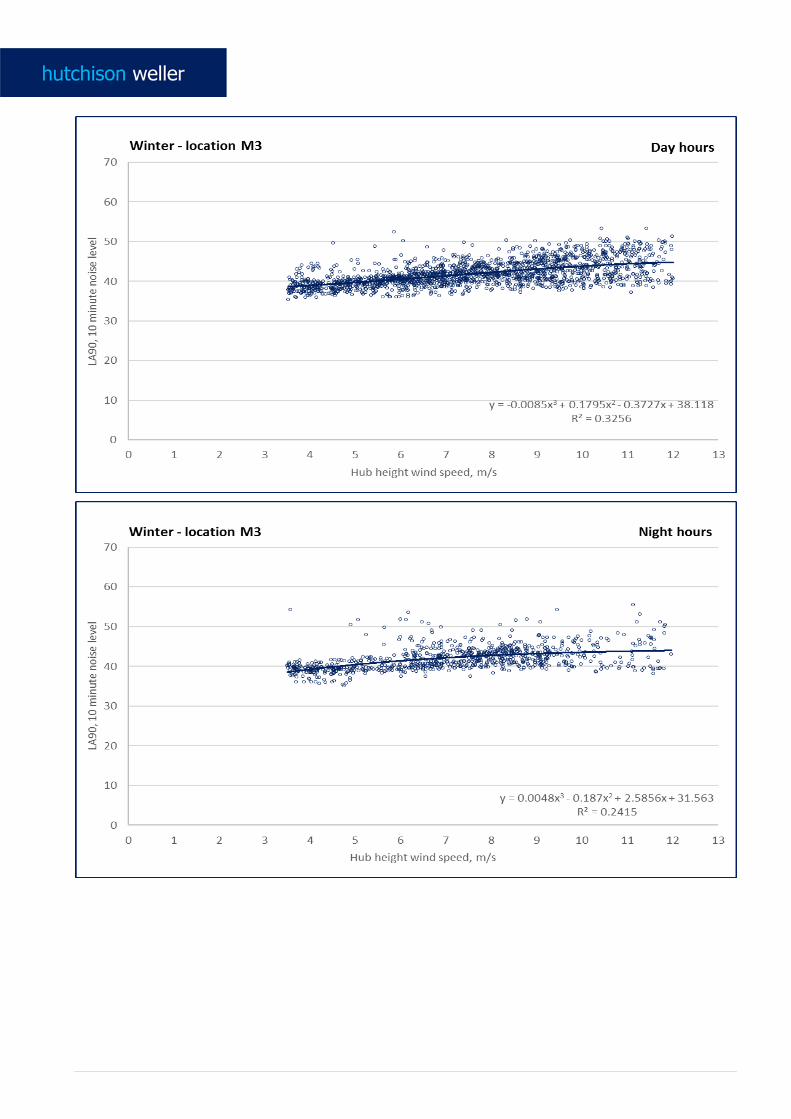
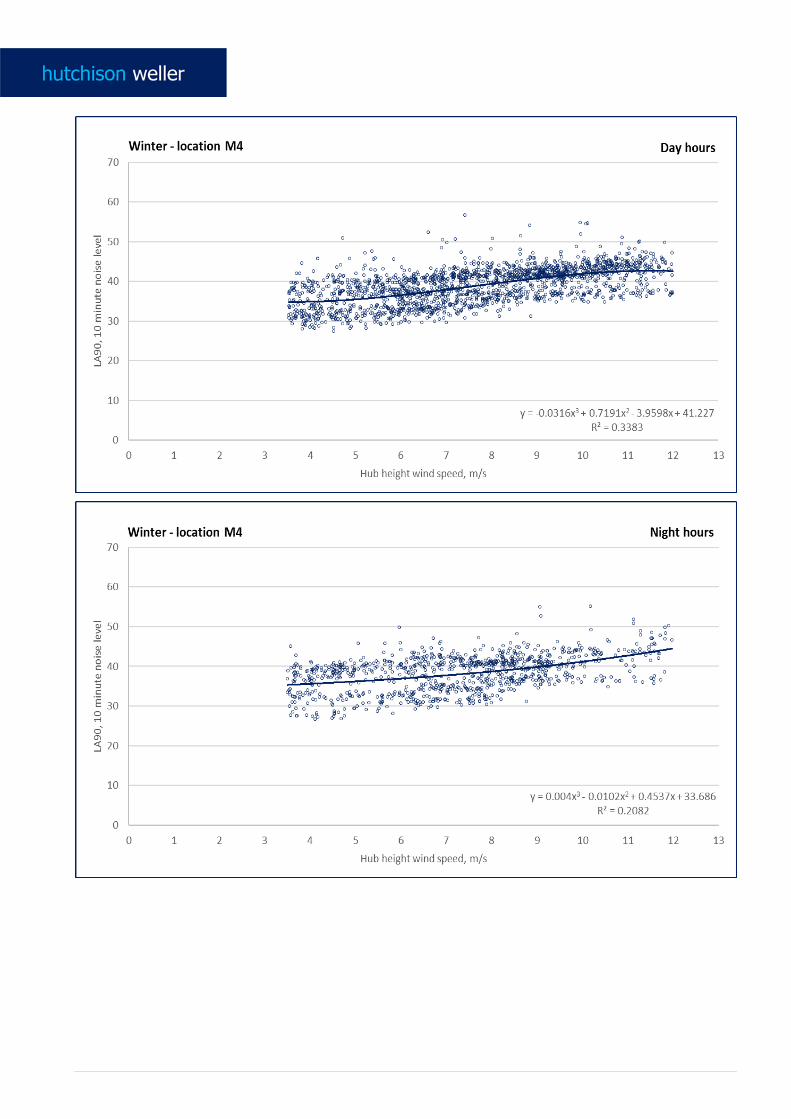
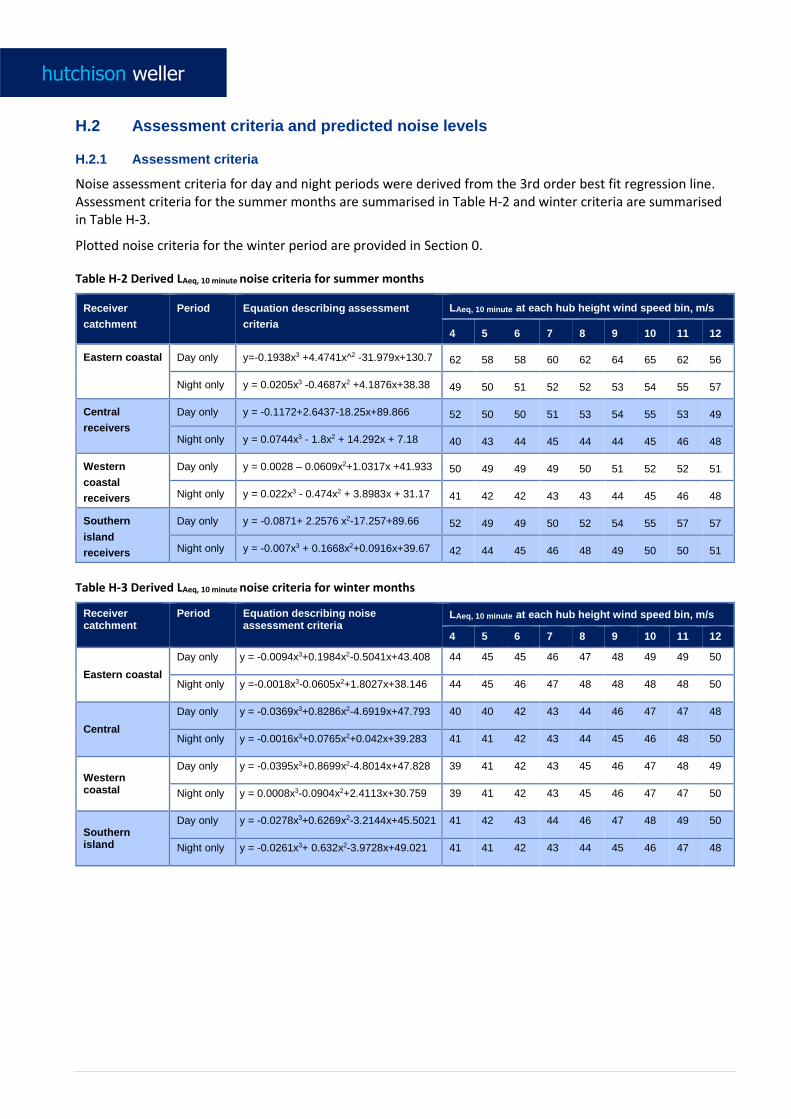
H.2 Assessment criteria and predicted noise levels
H.2.1 Assessment criteria
Noise assessment criteria for day and night periods were derived from the 3rd order best fit regression line. Assessment criteria for the summer months are summarised in Table H-2 and winter criteria are summarised in Table H-3.
Plotted noise criteria for the winter period are provided in Section 0.
Table H-2 Derived LAeq, 10 minute noise criteria for summer months
Receiver
catchment
Period Equation describing assessment
criteria
LAeq, 10 minute at each hub height wind speed bin, m/s
4 5 6 7 8 9 10 11 12
Eastern coastal Day only y=-0.1938x3 +4.4741x^2 -31.979x+130.7 62 58 58 60 62 64 65 62 56
Night only y = 0.0205x3 -0.4687x2 +4.1876x+38.38 49 50 51 52 52 53 54 55 57
Central
receivers
Day only y = -0.1172+2.6437-18.25x+89.866 52 50 50 51 53 54 55 53 49
Night only y = 0.0744x3 - 1.8x2 + 14.292x + 7.18 40 43 44 45 44 44 45 46 48
Western
coastal
receivers
Day only y = 0.0028 – 0.0609x2+1.0317x +41.933 50 49 49 49 50 51 52 52 51
Night only y = 0.022x3 - 0.474x2 + 3.8983x + 31.17 41 42 42 43 43 44 45 46 48
Southern
island
receivers
Day only y = -0.0871+ 2.2576 x2-17.257+89.66 52 49 49 50 52 54 55 57 57
Night only y = -0.007x3 + 0.1668x2+0.0916x+39.67 42 44 45 46 48 49 50 50 51
Table H-3 Derived LAeq, 10 minute noise criteria for winter months
Receiver catchment
Period Equation describing noise assessment criteria
LAeq, 10 minute at each hub height wind speed bin, m/s
4 5 6 7 8 9 10 11 12
Eastern coastal
Day only y = -0.0094x3+0.1984x2-0.5041x+43.408 44 45 45 46 47 48 49 49 50
Night only y =-0.0018x3-0.0605x2+1.8027x+38.146 44 45 46 47 48 48 48 48 50
Central
Day only y = -0.0369x3+0.8286x2-4.6919x+47.793 40 40 42 43 44 46 47 47 48
Night only y = -0.0016x3+0.0765x2+0.042x+39.283 41 41 42 43 44 45 46 48 50
Western coastal
Day only y = -0.0395x3+0.8699x2-4.8014x+47.828 39 41 42 43 45 46 47 48 49
Night only y = 0.0008x3-0.0904x2+2.4113x+30.759 39 41 42 43 45 46 47 47 50
Southern island
Day only y = -0.0278x3+0.6269x2-3.2144x+45.5021 41 42 43 44 46 47 48 49 50
Night only y = -0.0261x3+ 0.632x2-3.9728x+49.021 41 41 42 43 44 45 46 47 48
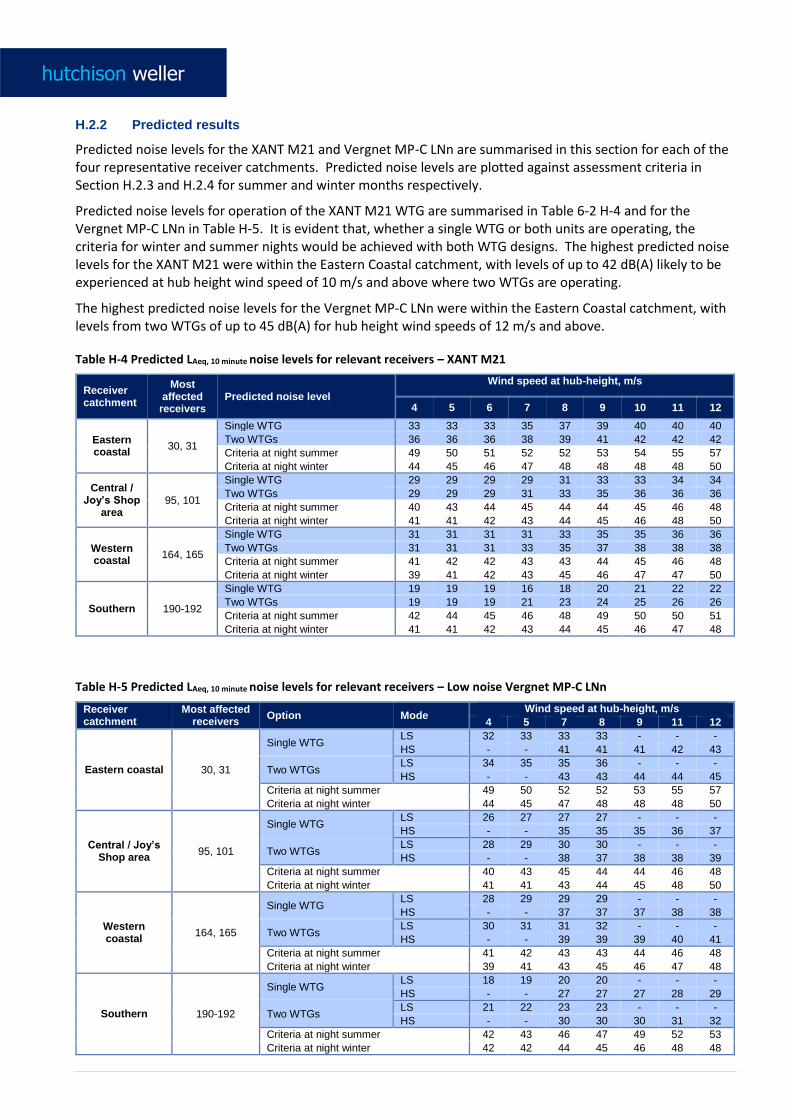
H.2.2 Predicted results
Predicted noise levels for the XANT M21 and Vergnet MP-C LNn are summarised in this section for each of the four representative receiver catchments. Predicted noise levels are plotted against assessment criteria in Section H.2.3 and H.2.4 for summer and winter months respectively.
Predicted noise levels for operation of the XANT M21 WTG are summarised in Table 6-2 H-4 and for the Vergnet MP-C LNn in Table H-5. It is evident that, whether a single WTG or both units are operating, the criteria for winter and summer nights would be achieved with both WTG designs. The highest predicted noise levels for the XANT M21 were within the Eastern Coastal catchment, with levels of up to 42 dB(A) likely to be experienced at hub height wind speed of 10 m/s and above where two WTGs are operating.
The highest predicted noise levels for the Vergnet MP-C LNn were within the Eastern Coastal catchment, with levels from two WTGs of up to 45 dB(A) for hub height wind speeds of 12 m/s and above.
Table H-4 Predicted LAeq, 10 minute noise levels for relevant receivers – XANT M21
Receiver catchment
Most affected
receivers Predicted noise level
Wind speed at hub-height, m/s
4 5 6 7 8 9 10 11 12
Eastern coastal
30, 31
Single WTG 33 33 33 35 37 39 40 40 40
Two WTGs 36 36 36 38 39 41 42 42 42
Criteria at night summer 49 50 51 52 52 53 54 55 57
Criteria at night winter 44 45 46 47 48 48 48 48 50
Central / Joy’s Shop
area 95, 101
Single WTG 29 29 29 29 31 33 33 34 34
Two WTGs 29 29 29 31 33 35 36 36 36
Criteria at night summer 40 43 44 45 44 44 45 46 48
Criteria at night winter 41 41 42 43 44 45 46 48 50
Western coastal
164, 165
Single WTG 31 31 31 31 33 35 35 36 36
Two WTGs 31 31 31 33 35 37 38 38 38
Criteria at night summer 41 42 42 43 43 44 45 46 48
Criteria at night winter 39 41 42 43 45 46 47 47 50
Southern 190-192
Single WTG 19 19 19 16 18 20 21 22 22
Two WTGs 19 19 19 21 23 24 25 26 26
Criteria at night summer 42 44 45 46 48 49 50 50 51
Criteria at night winter 41 41 42 43 44 45 46 47 48
Table H-5 Predicted LAeq, 10 minute noise levels for relevant receivers – Low noise Vergnet MP-C LNn
Receiver catchment
Most affected receivers
Option Mode Wind speed at hub-height, m/s
4 5 7 8 9 11 12
Eastern coastal 30, 31
Single WTG LS 32 33 33 33 - - -
HS - - 41 41 41 42 43
Two WTGs LS 34 35 35 36 - - -
HS - - 43 43 44 44 45
Criteria at night summer 49 50 52 52 53 55 57
Criteria at night winter 44 45 47 48 48 48 50
Central / Joy’s Shop area
95, 101
Single WTG LS 26 27 27 27 - - -
HS - - 35 35 35 36 37
Two WTGs LS 28 29 30 30 - - -
HS - - 38 37 38 38 39
Criteria at night summer 40 43 45 44 44 46 48
Criteria at night winter 41 41 43 44 45 48 50
Western coastal
164, 165
Single WTG LS 28 29 29 29 - - -
HS - - 37 37 37 38 38
Two WTGs LS 30 31 31 32 - - -
HS - - 39 39 39 40 41
Criteria at night summer 41 42 43 43 44 46 48
Criteria at night winter 39 41 43 45 46 47 48
Southern 190-192
Single WTG LS 18 19 20 20 - - -
HS - - 27 27 27 28 29
Two WTGs LS 21 22 23 23 - - -
HS - - 30 30 30 31 32
Criteria at night summer 42 43 46 47 49 52 53
Criteria at night winter 42 42 44 45 46 48 48
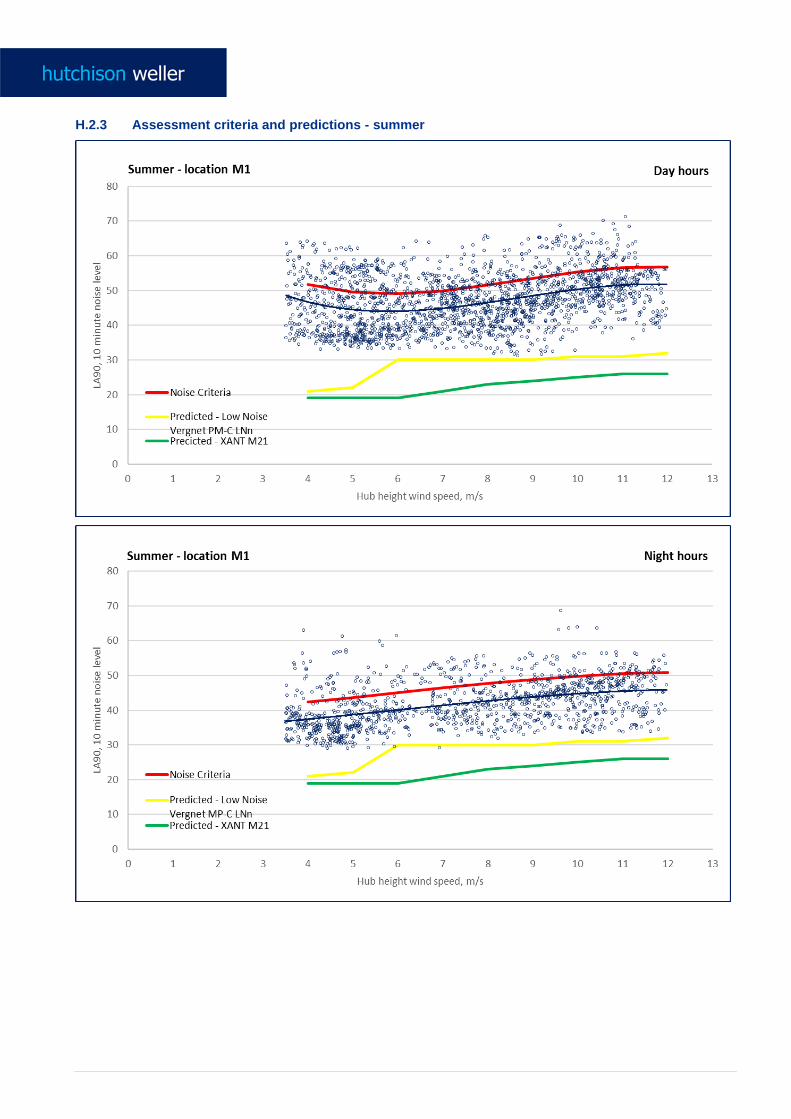
H.2.3 Assessment criteria and predictions - summer
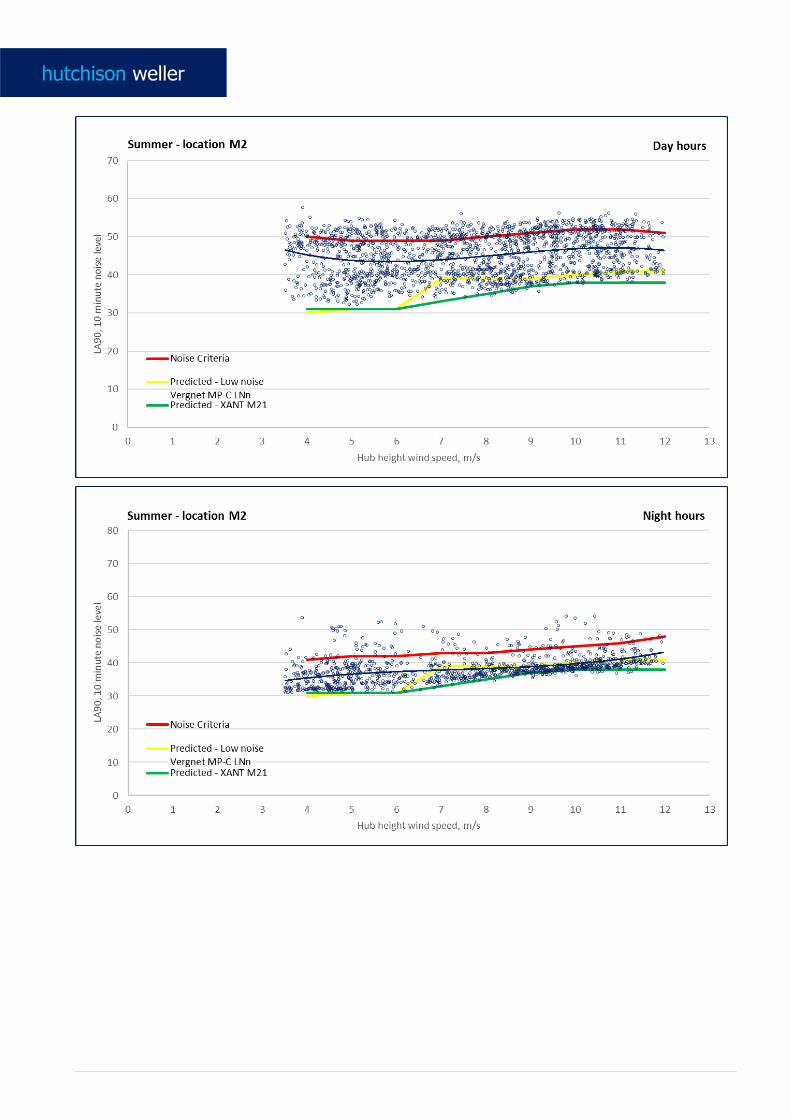
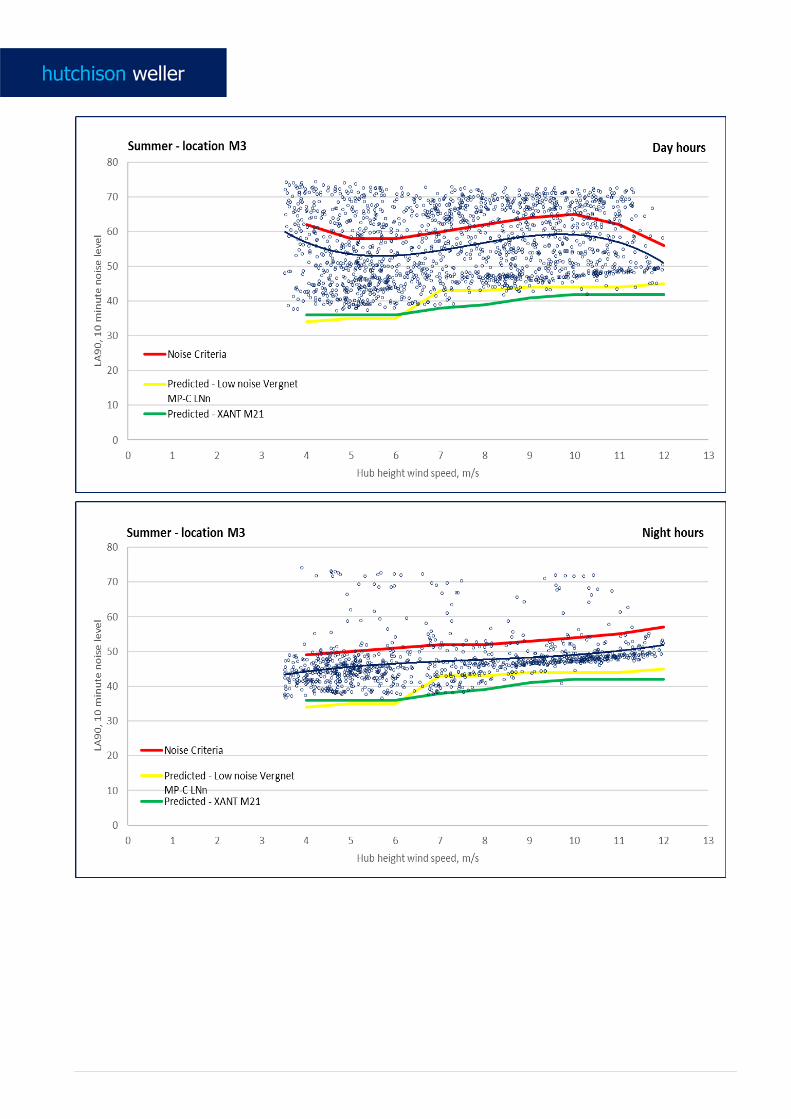
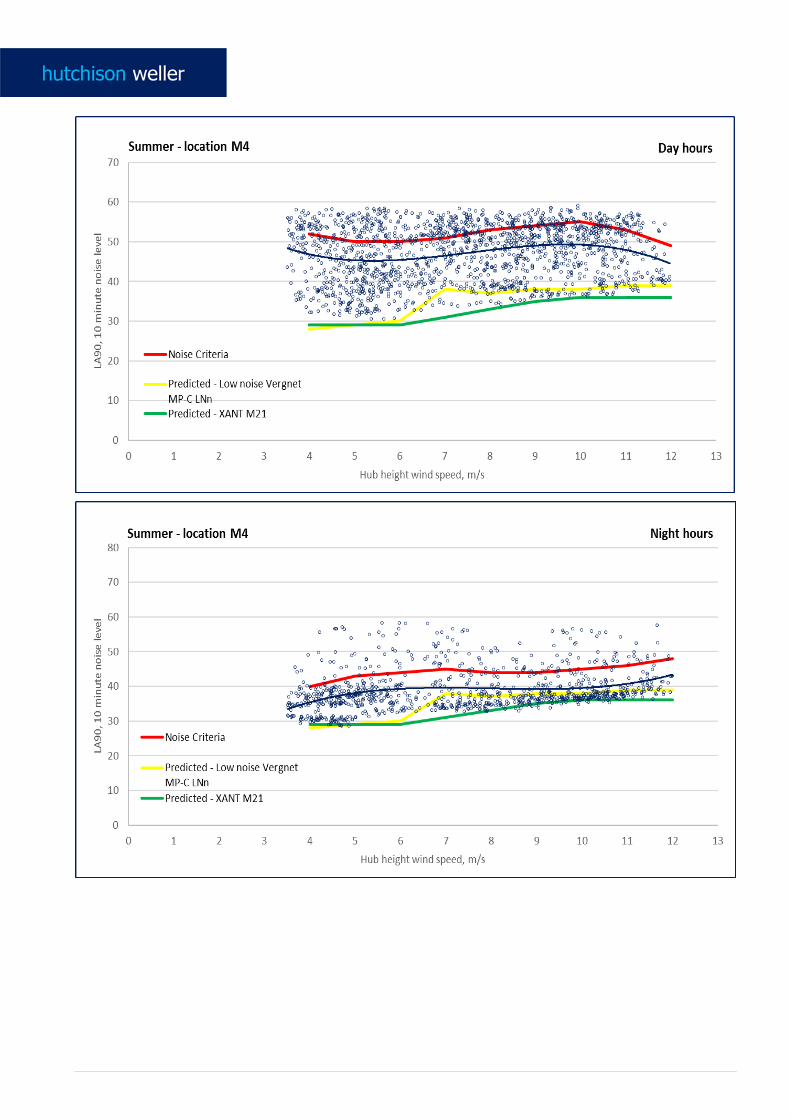
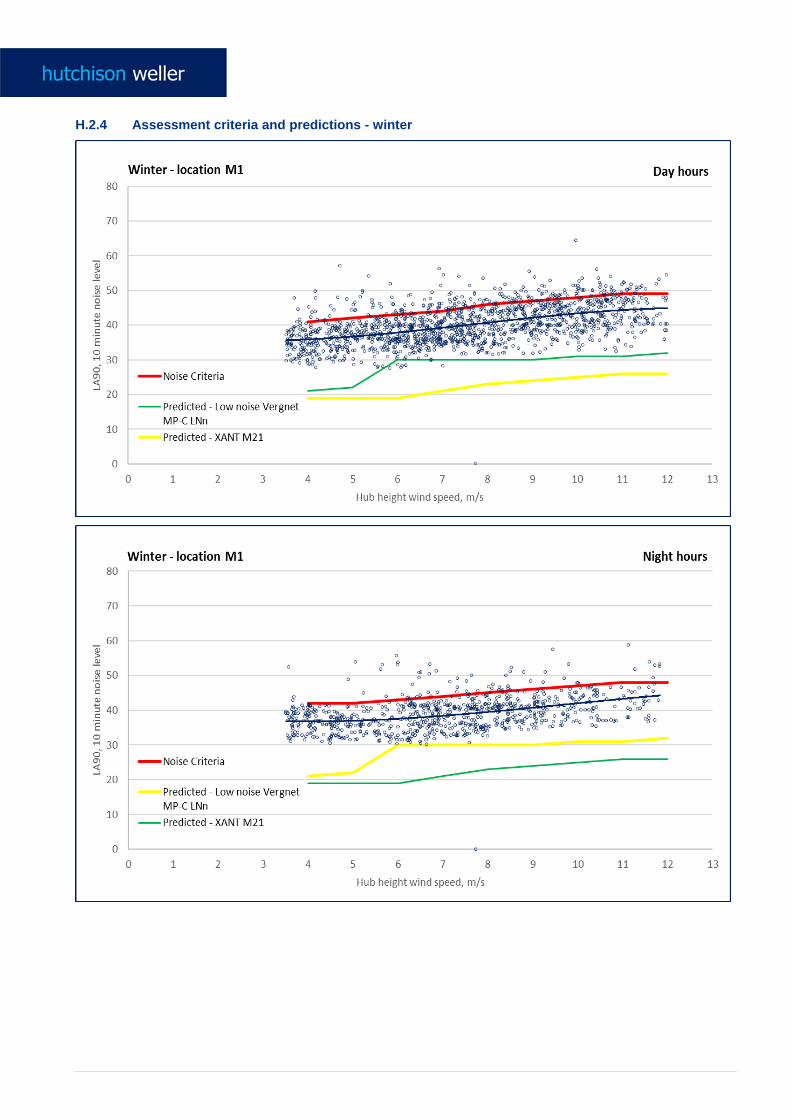
H.2.4 Assessment criteria and predictions - winter
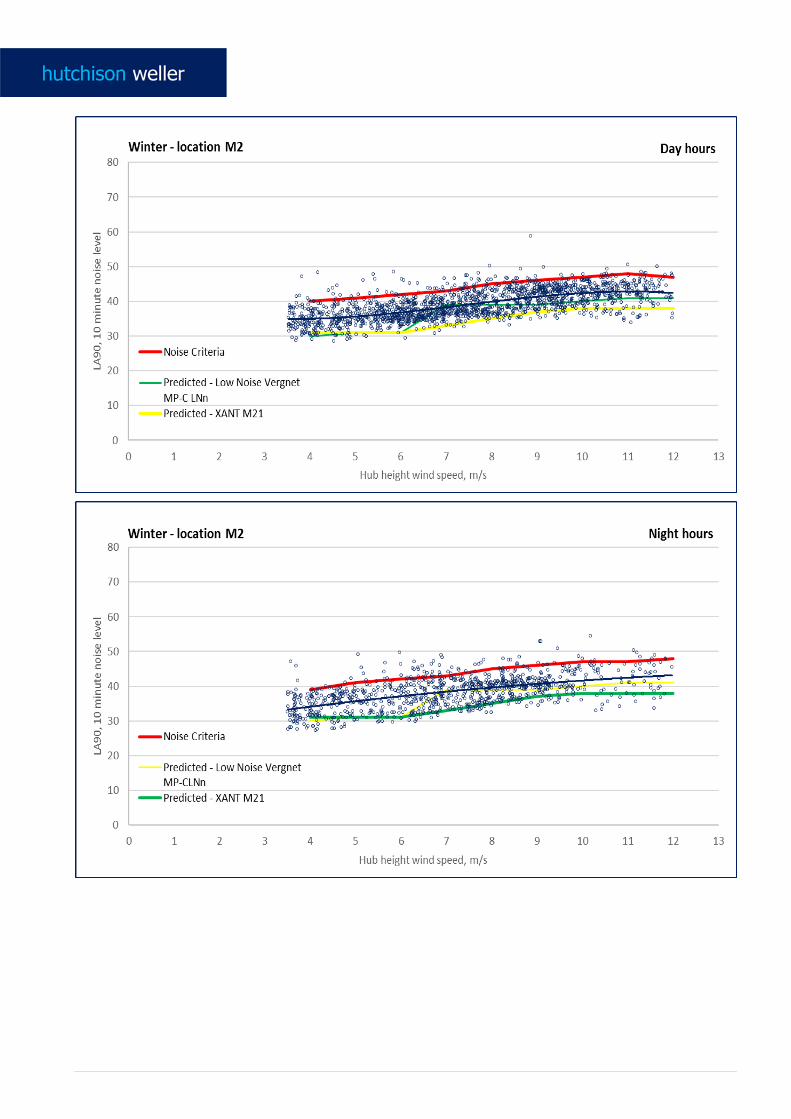
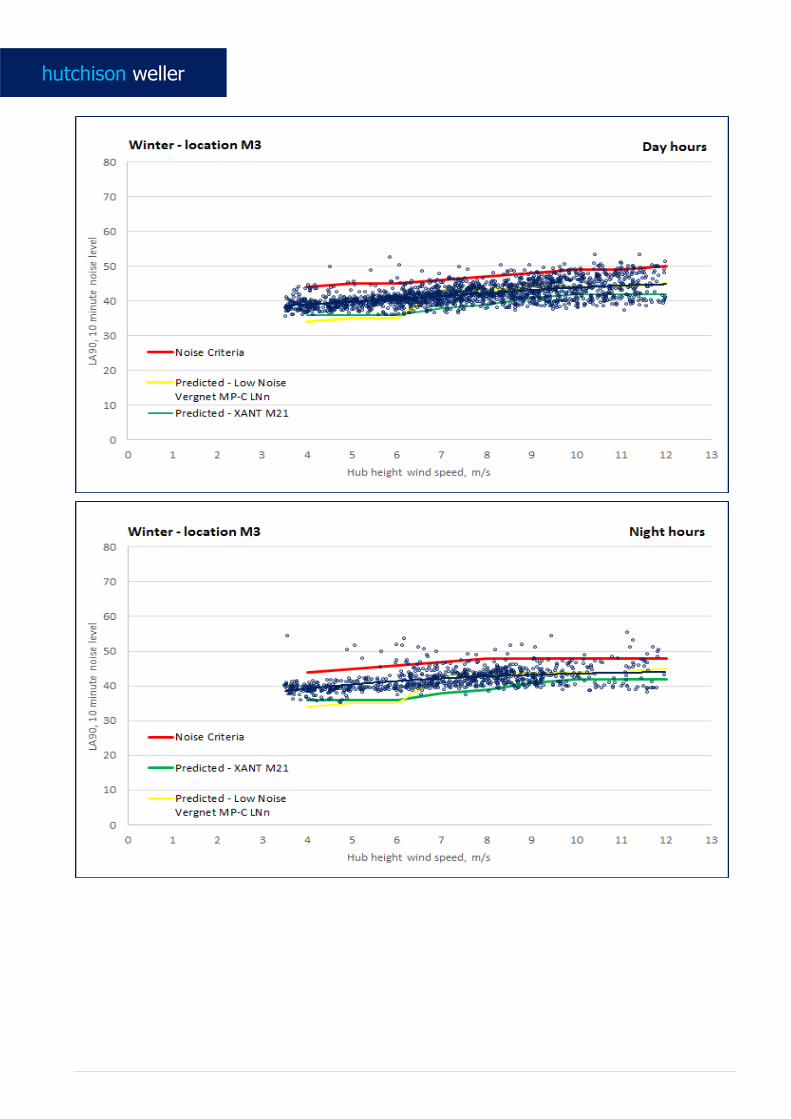

Appendix I. Noise predictions at all relevant receivers
I.1 Vergnet MP-C LNn

I.2 XANT M21